Multi-objective Optimization of Accommodation Capacity for Distributed Generation Based on Mixed Strategy Nash Equilibrium, Considering Distribution Network Flexibility

Abstract
1. Introduction
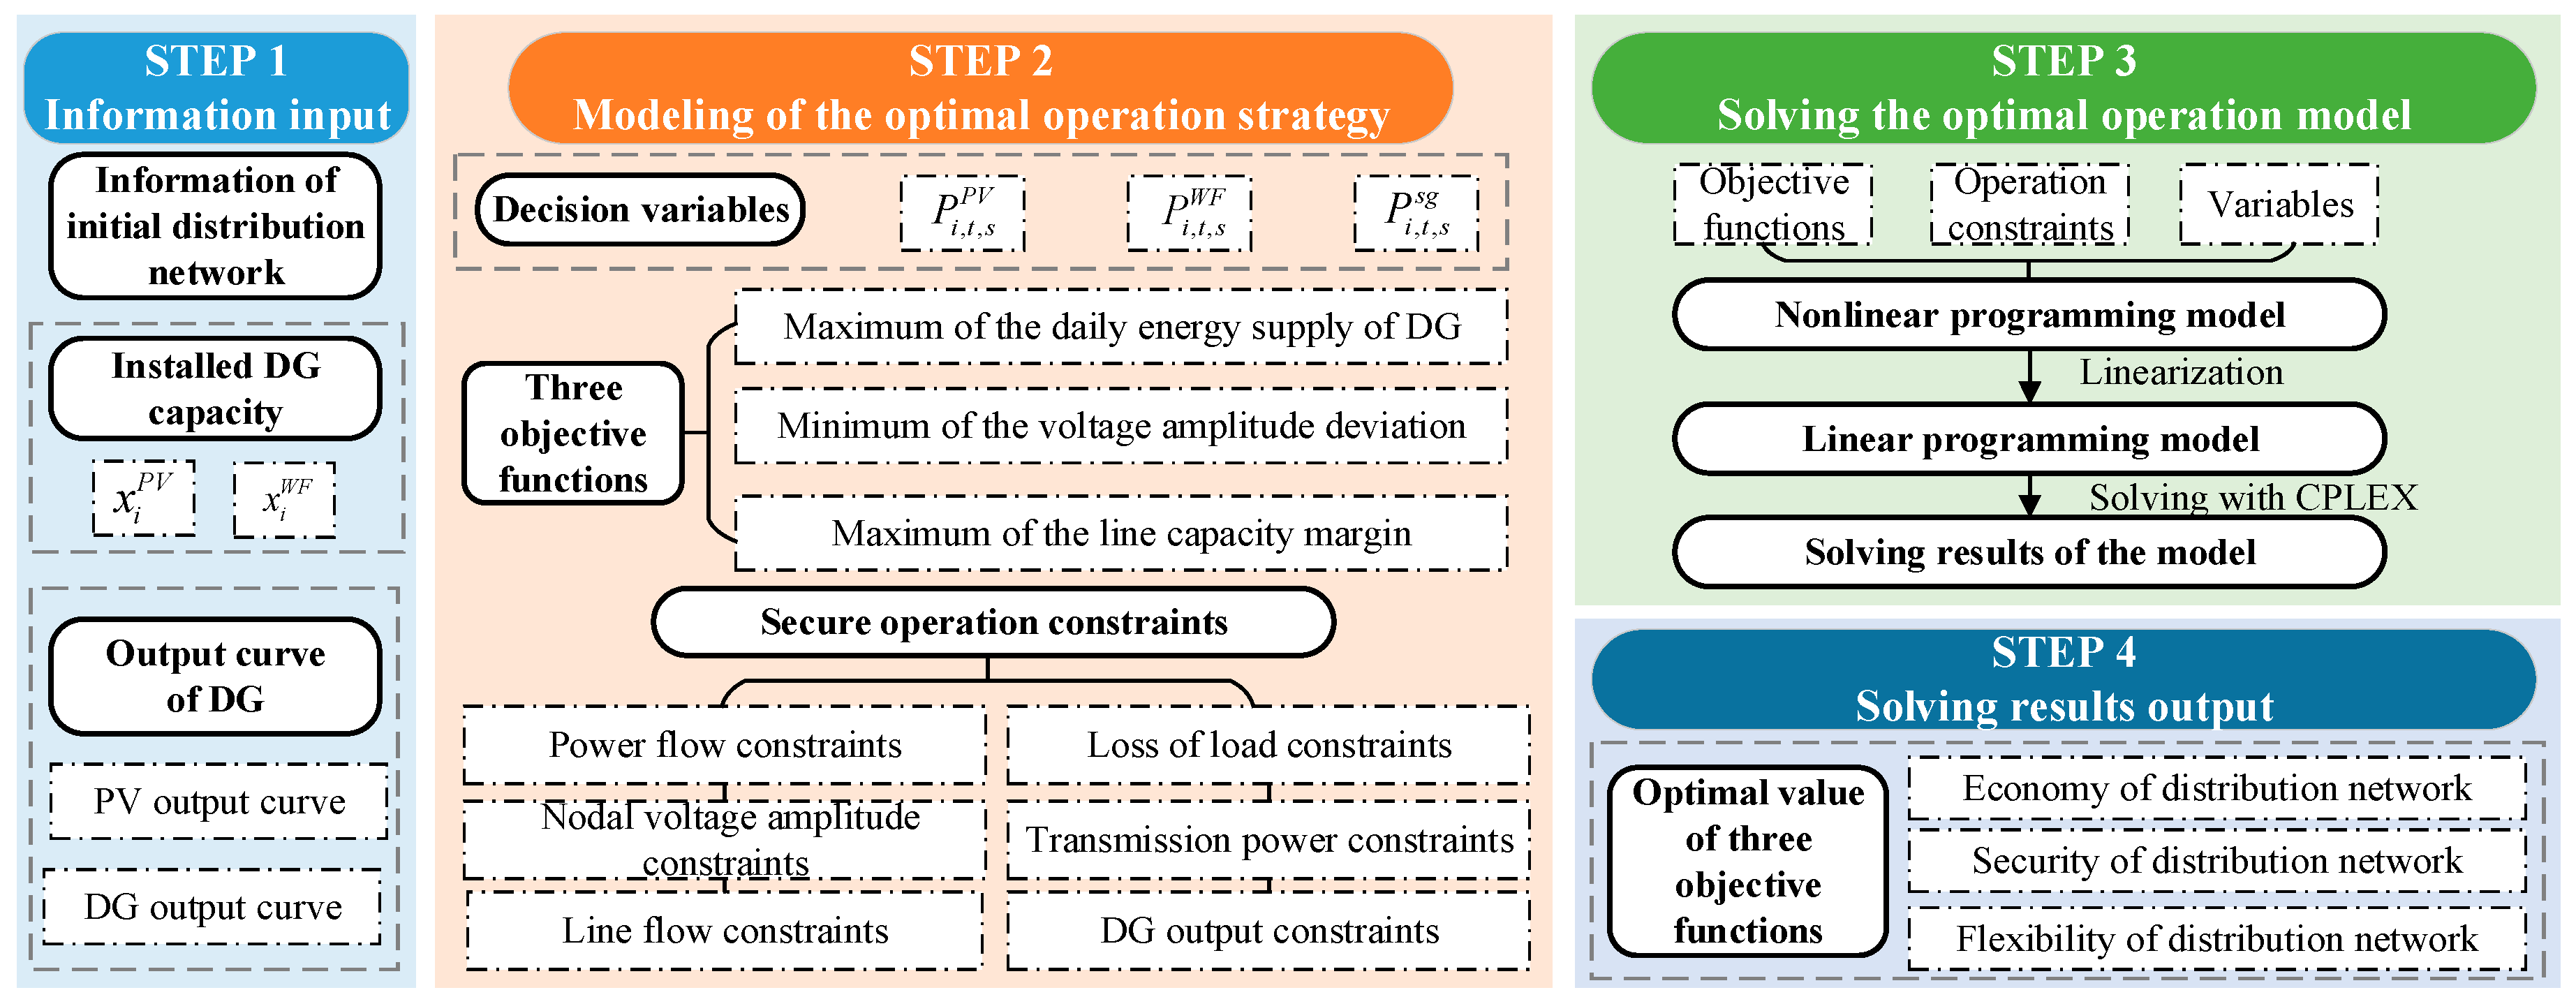
- A multi-objective optimal planning model for the accommodation of DG is proposed, which aims to maximize the daily energy supply, minimize the voltage amplitude deviation, and maximize the line capacity margin. The model effectively takes the distribution network flexibility into consideration while achieving multi-objective optimization under the secure operation constraints of the distribution network.
- The optimal planning problem regarding high-dimensional variables and multi-peak objective functions is solved using the comprehensive learning particle swarm optimization (CLPSO) algorithm. The CLPSO algorithm can obtain the non-inferior solution set of the DG optimal planning problem, which is distributed across the whole Pareto optimal front and shows better diversity.
- The mixed strategy Nash equilibrium strategy is first applied to decide the optimal planning solution from the non-inferior solutions, which handle the conflicts between multiple objective functions of the optimal planning model more effectively.
2. Multi-Objective Optimization Model for Accommodation Capability of DG, Considering Distribution Network Flexibility
2.1. Flexibility of Distribution Network with DG
2.2. Multi-Objective Optimization Model for Accommodation Capability of DG, Considering Distribution Network Flexibility
2.2.1. Objective Function of Multi-Objective Optimization Model
2.2.2. Constraints for the Multi-Objective Optimization Model
3. Solving Methods for the Multi-Objective Optimization Model Based on the CLPSO Algorithm and Mixed Strategy Nash Equilibrium
3.1. Comprehensive Learning Particle Swarm Optimization Algorithm for Solving the Multi-Objective Optimization Model
3.2. Multi-Objective, Non-Cooperative Equilibrium Decision-Making Based on Mixed Strategy Nash Equilibrium for Determining the Optimal Accommodation Capacity of DG
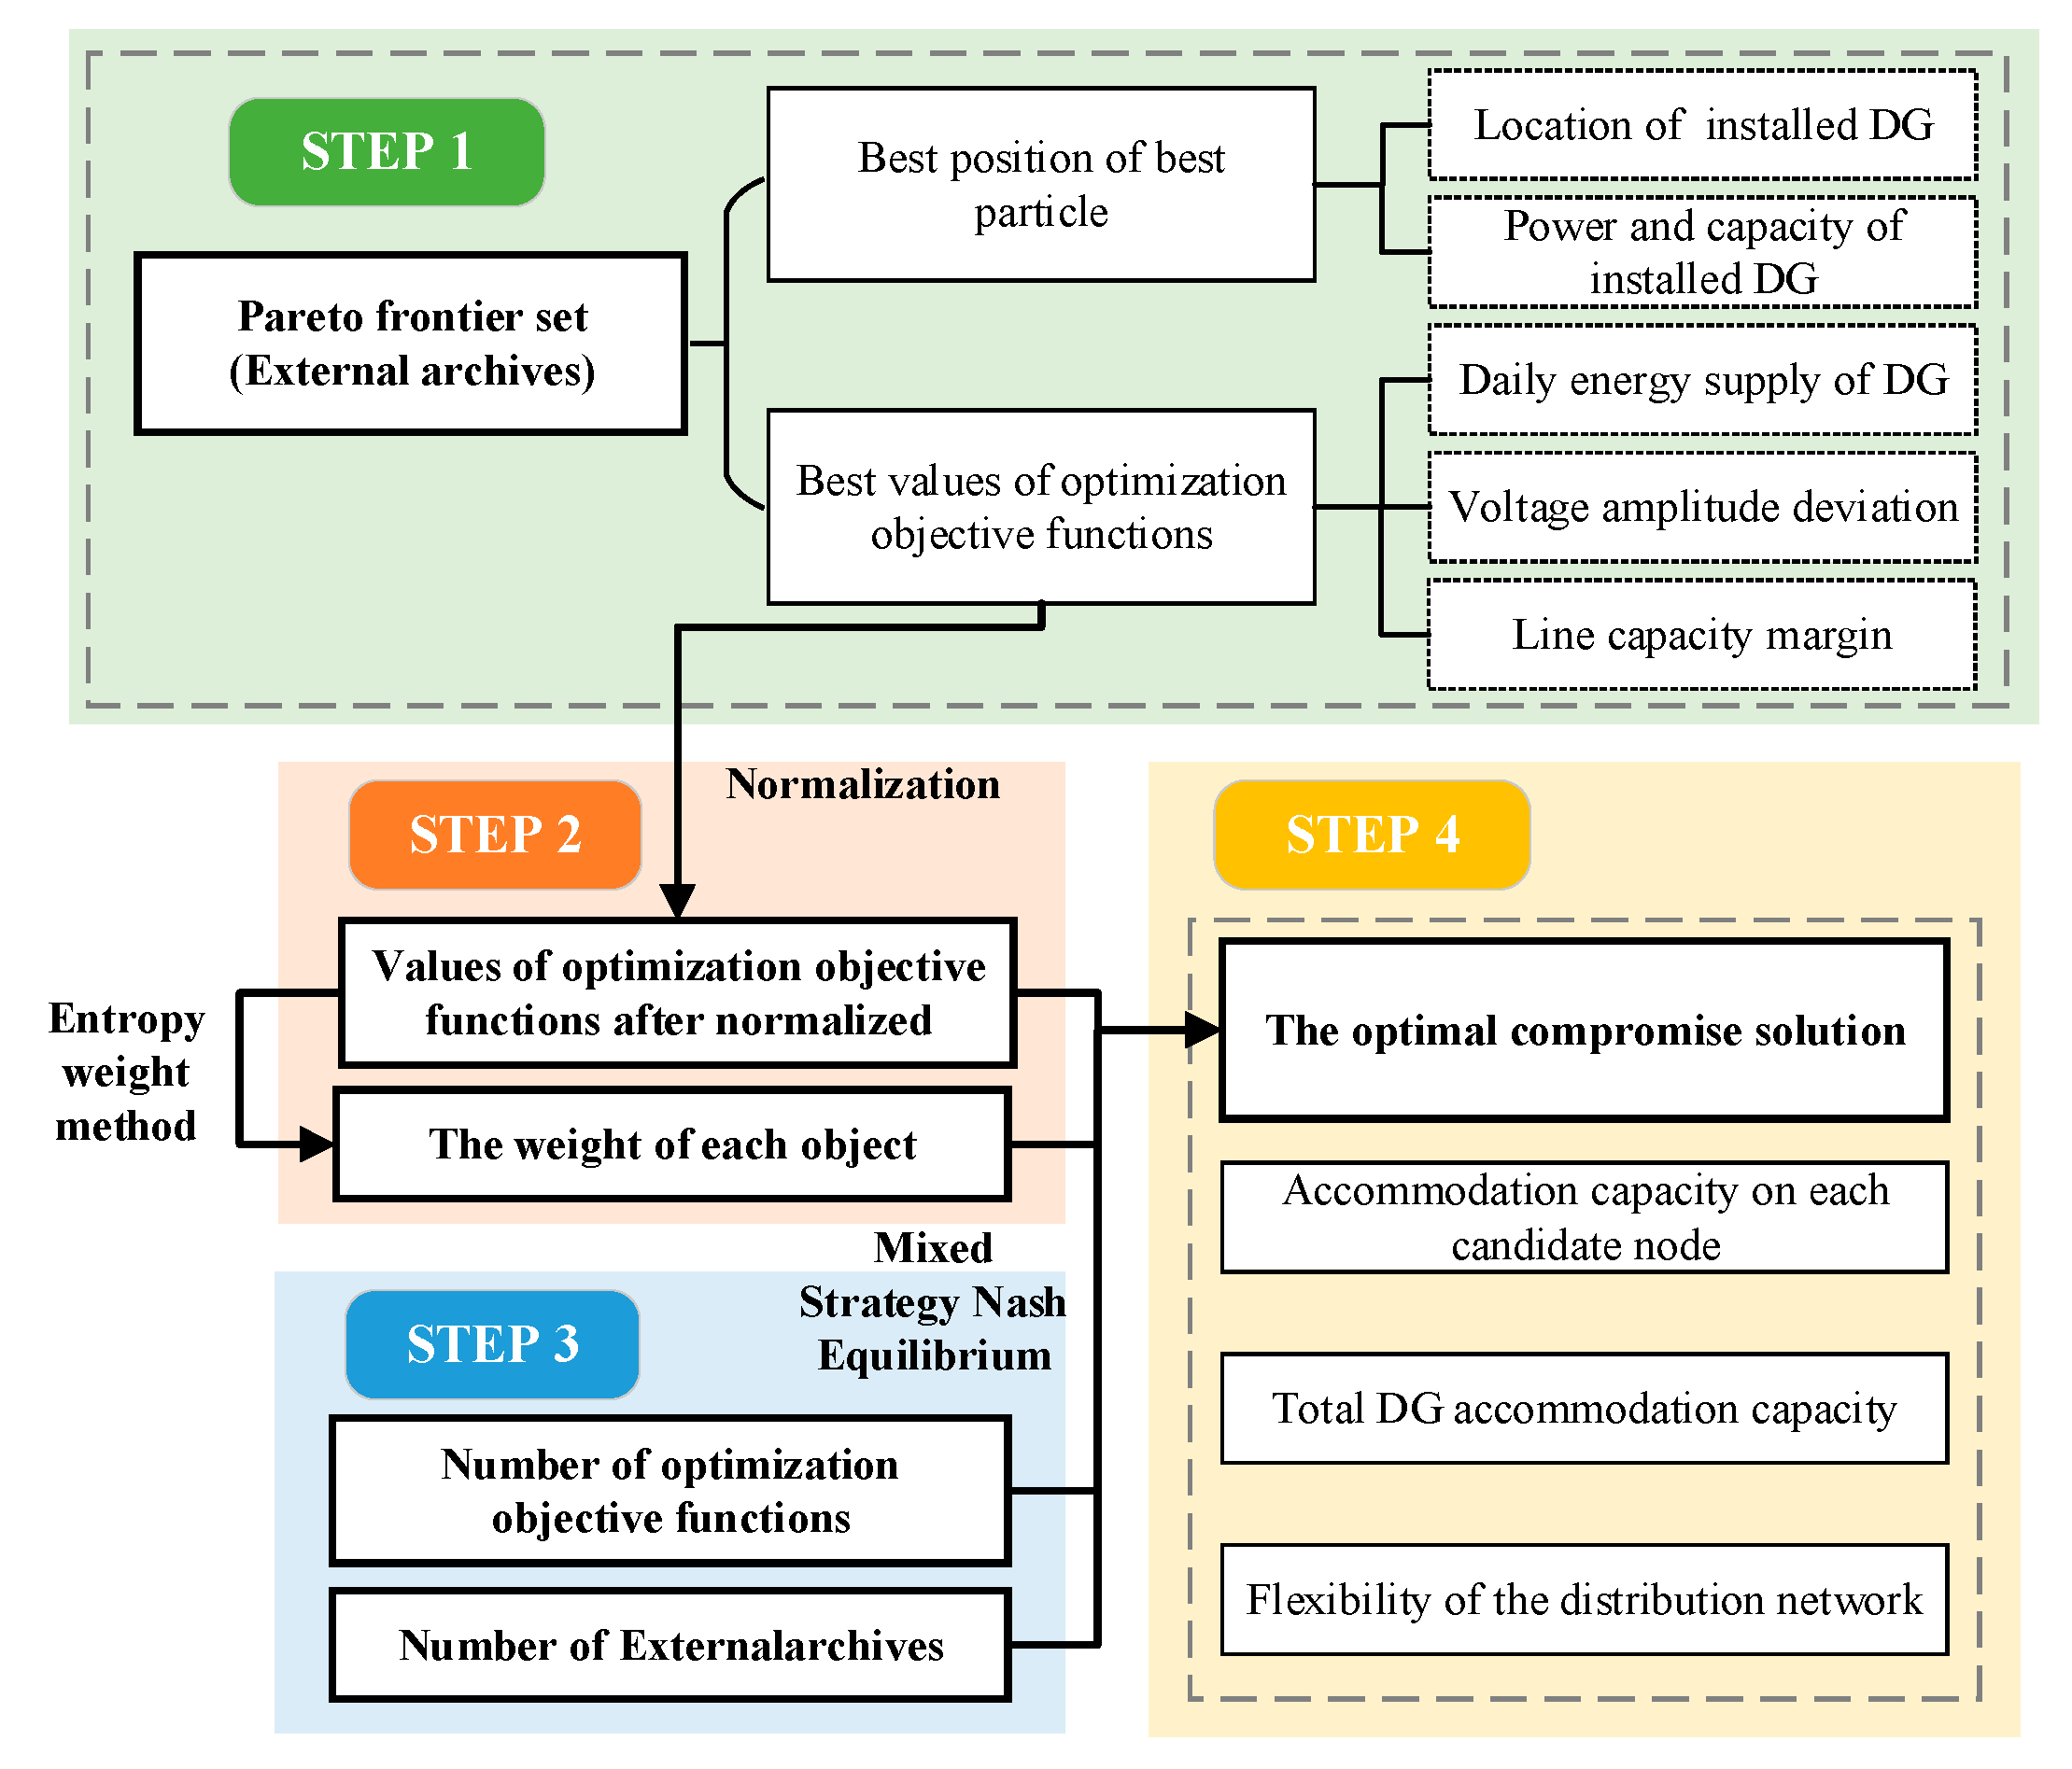
3.3. Steps for Optimizing the Accommodation Capacity of DG Based on the CPLSO Algorithm and Mixed Strategy Nash Equilibrium
- Step 1:
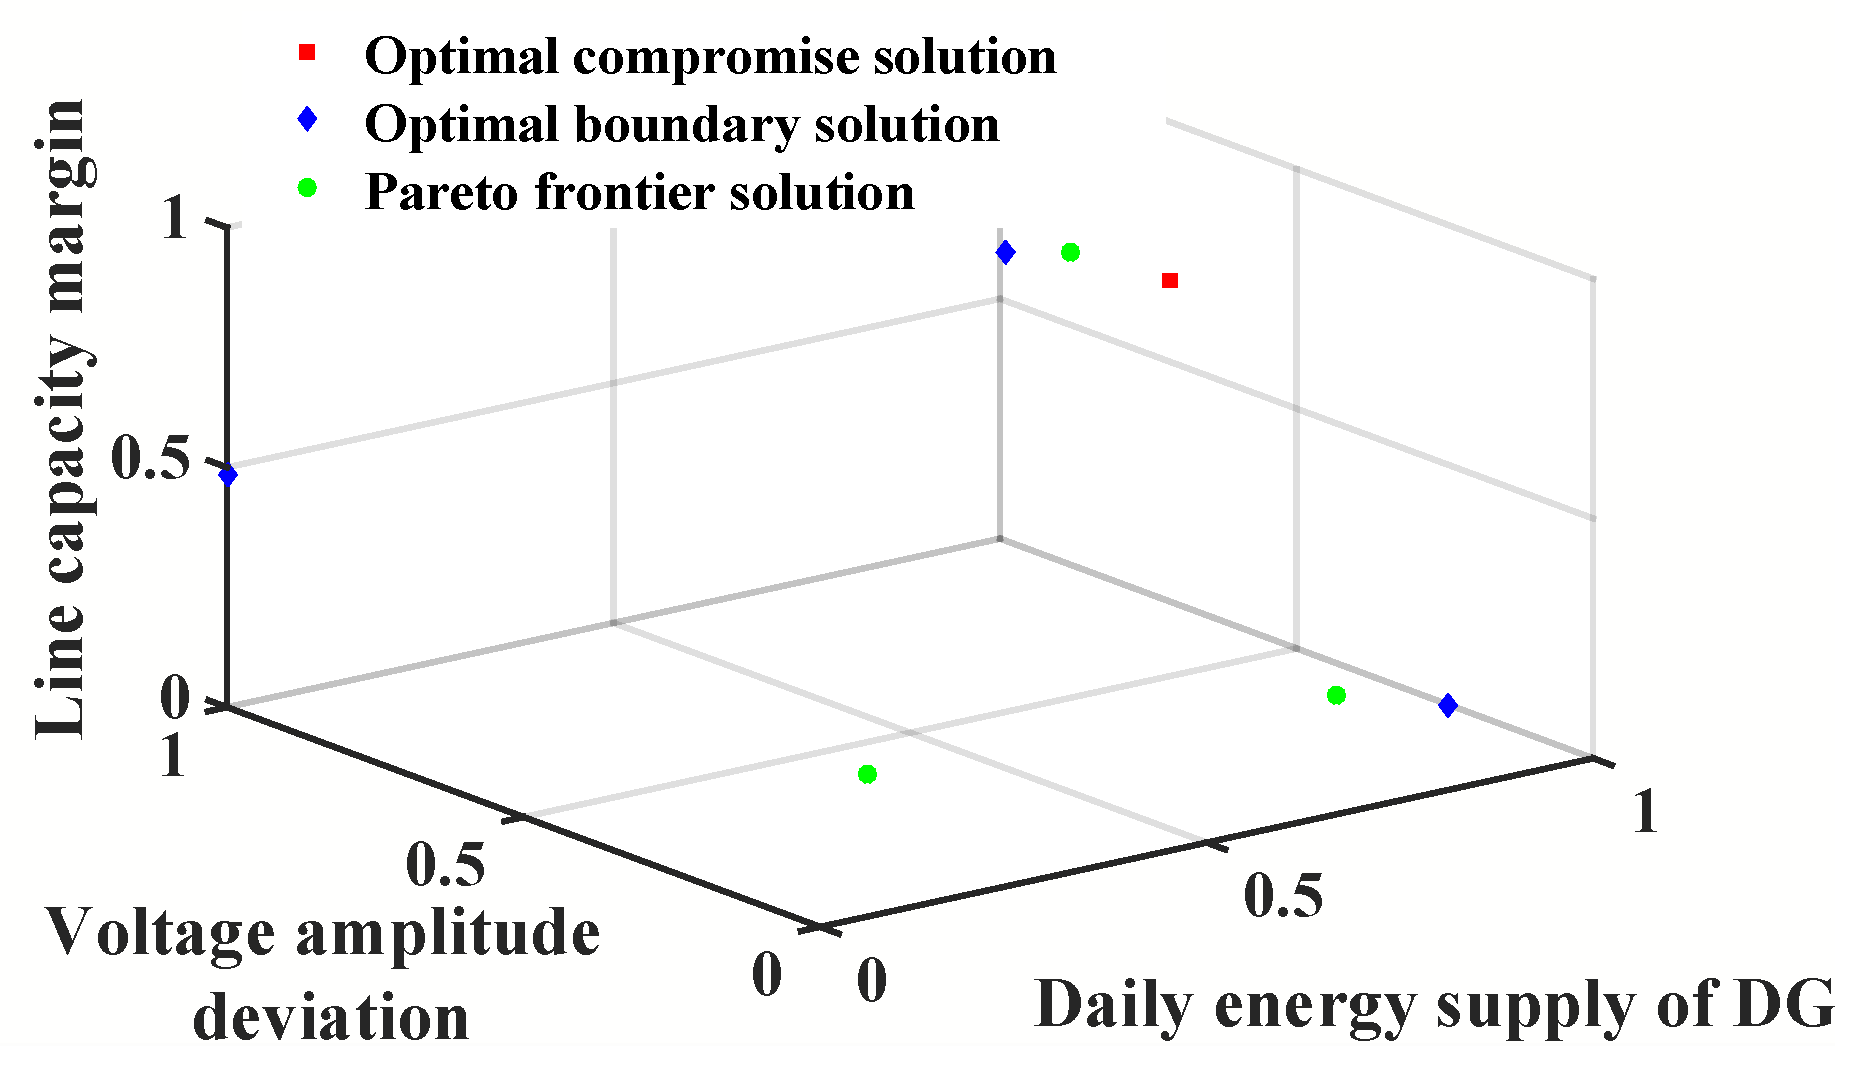
- The Pareto frontier solution set (i.e., the DG connection solutions obtained by CLPSO algorithm) is stored in external archives.
- Step 2:
- The values of three optimization objective functions are normalized (i.e., maximizing daily power supply of DG, minimizing voltage deviation, and maximizing line capacity margin).
- Step 3:
- The weight of each object is solved using the entropy weight method.
- Step 4:
- The multi-objective, non-cooperative equilibrium decision-making model is solved according to Equations (14) and (15), and the optimal compromise solution is obtained.
4. Numerical Results
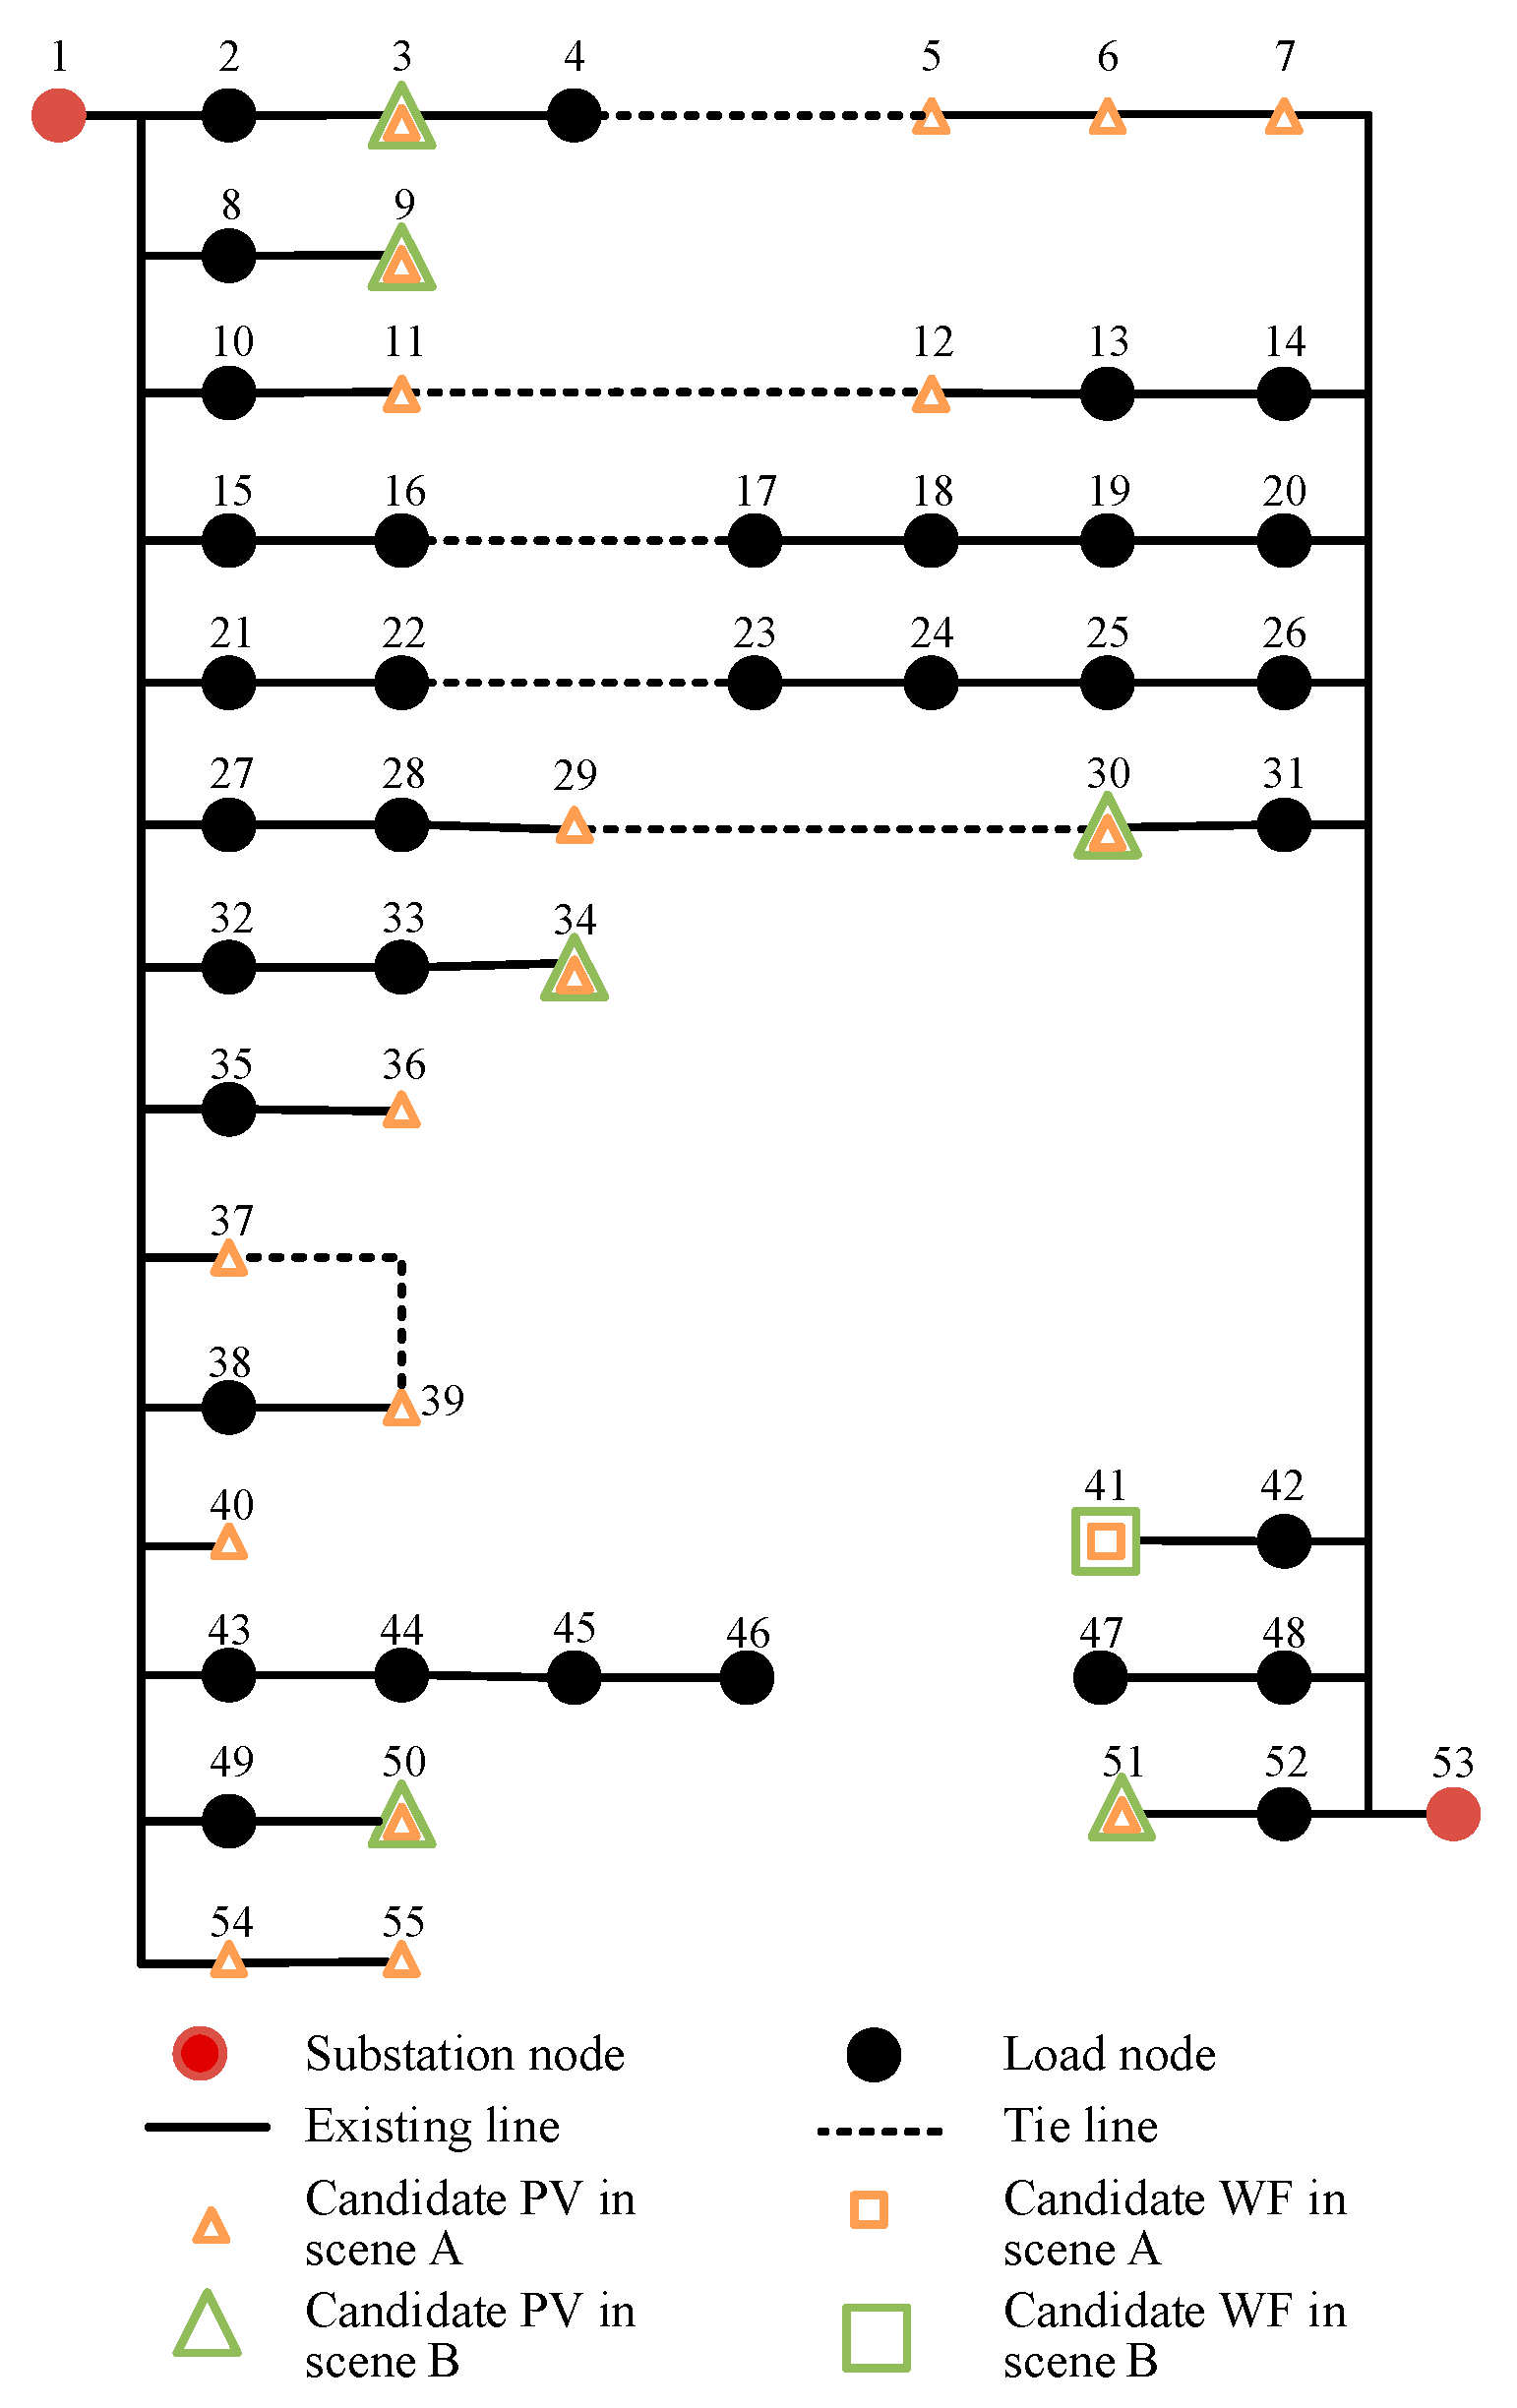
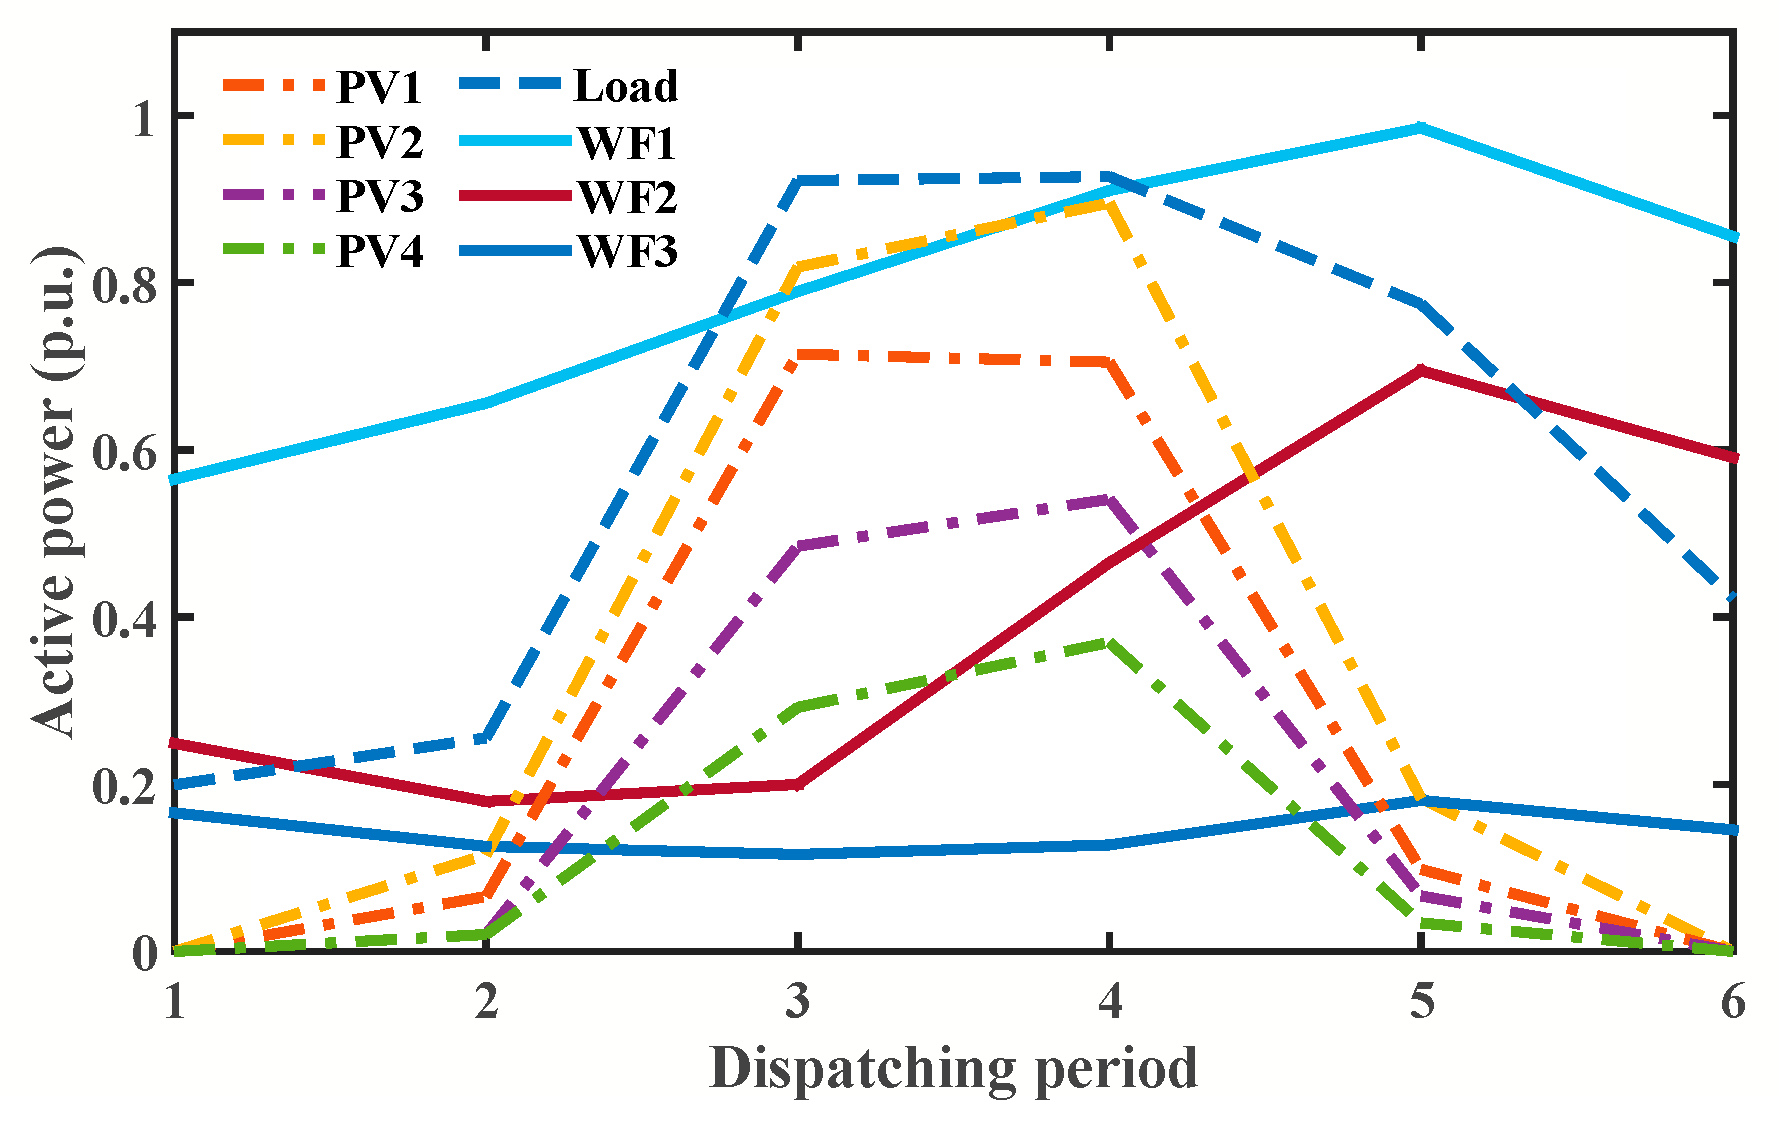
4.1. Case Descriptions
4.2. Simulation Results
5. Conclusions
Author Contributions
Funding
Conflicts of Interest
Nomenclature
| (1) Indices and Sets | |||
| i, j | Index for nodes. | s | Index for scenarios. |
| ij | Index for branch from node i to node j. | t | Index for time periods. |
| k | Index for branches. | ΩPV | Node set of PV generation. |
| ΩWF | Node set of WF generation. | Ωnode | Set of all nodes. |
| ΩLine | Branch set of distribution network. | ΩG | Set of power nodes. |
| (2) Parameters | |||
| S | Number of WF and PV output scenarios. | ps | Occurrence probability of scenario s. |
| T | Number of periods in the daily scheduling period. | Δt | Length of unit scheduling period. |
| Rated voltage of node i. | Nline | The total number of branches. | |
| Maximum transmission current of branch k. | NPV, NWF | The total number of PVs and WFs. | |
| The lowest and highest allowed voltage magnitudes of node i. | Gij, Bij | The corresponding elements of node admittance matrix. | |
| θWF, θPV | Maximum abandonment rate of WF and PV in an allowable daily dispatching period of the distribution system. | Sij | Upper limit of power flow through branch i-j. |
| λ | Maximum loss of load rate. | , | Maximum output of WF and PV of node i at the dispatching period t. |
| ui | Upper limit of the expected value of objective function i. | Equilibrium solution of objective function i. | |
| fij | Normalized function value of frontier solution j for objective function i. | ωi | Importance weight of objective function i. |
| Ses | Number of Pareto frontier solution set in external archives. | Sob | Number of objective functions. |
| (3) Variables | |||
| Actual power of PC in dispatching period t under scenario s. | Actual power of distributed wind farm generation at dispatching period t under scenario s. | ||
| Active load of node i at dispatching period t under scenario s. | Current of branch k at dispatching period t under scenario s. | ||
| Capacity margin of branch k. | Pij,t,s, Qij,t,s | The active and reactive power flowing through branch i-j at dispatching period t under scenario s. | |
| Ui,t,s | Voltage amplitude of node i at dispatching period t under scenario s. | θij,t,s | Power factor angle. |
| , | Net active and reactive power of node i at dispatching period t under scenario s. | , | Actual active and reactive power of node i at dispatching period t under scenario s. |
| , | Active and reactive power injected from the superior grid to node i at dispatching period t under scenario s. | ,, | Reactive power of the wind farm, photovoltaic farm, and non-supplied load of node i at dispatching period t under scenario s. |
| Energy not supply at node i at dispatching period t under scenario s. | Transmission power from superior grids to power node i at dispatching period t under scenario s. | ||
| Load power at node i at dispatching period t under scenario s. | yij | Equilibrium value of frontier solution set j for objective function i. | |
References
- Karimyan, P.; Gharehpetian, G.B.; Abedi, M.; Gavili, A. Long term scheduling for optimal allocation and sizing of DG unit considering load variations and DG type. Int. J. Electr. Power Energy Syst. 2014, 54, 277–287. [Google Scholar] [CrossRef]
- Yong, C.; Kong, X.; Chen, Y.; Cui, K.; Wang, X. Multiobjective scheduling of an active distribution network based on coordinated optimization of source network load. Appl. Sci. 2018, 8, 1888. [Google Scholar] [CrossRef]
- Ganguly, S.; Samajpati, D. Distributed generation allocation on radial distribution networks under uncertainties of load and generation using genetic algorithm. IEEE Trans. Sustain. Energy 2015, 6, 688–697. [Google Scholar] [CrossRef]
- Huang, J.; Ge, S.; Han, J.; Li, H.; Zhou, X.; Liu, H.; Wang, B.; Chen, Z. A diagnostic method for distribution networks based on power supply safety standards. Prot. Control Mod. Power Syst. 2016, 1, 9. [Google Scholar] [CrossRef]
- Shayani, R.A.; Oliveira, M.A. Photovoltaic generation penetration limits in radial distribution systems. IEEE Trans. Power Syst. 2011, 26, 1625–1631. [Google Scholar] [CrossRef]
- Yin, D.E.; Mei, F.; Zheng, J.Y. An AC/DC distribution network DG planning problem: A genetic-ant colony hybrid algorithm approach. Appl. Sci. 2019, 9, 1212. [Google Scholar] [CrossRef]
- Wang, C.S.; Zhang, N.; Zhao, J.L. Maximum capacity calculation of distributed generators considering fluctuation characteristics. Proc. CSU-EPSA 2016, 28, 38–43. [Google Scholar]
- Quijano, D.A.; Padilha-Feltrin, A. Optimal integration of distributed generation and conservation voltage reduction in active distribution networks. Int. J. Electr. Power Energy Syst. 2019, 113, 197–207. [Google Scholar] [CrossRef]
- El-Khattam, W.; Salama, M.A. Distributed generation technologies, definitions and benefits. Electr. Power Syst. Res. 2004, 71, 119–128. [Google Scholar] [CrossRef]
- Wang, L.L.; Wang, X.; Jiang, C.W.; Yin, S.; Yang, M. Dynamic coordinated active–reactive power optimization for active distribution network with energy storage systems. Appl. Sci. 2019, 9, 1129. [Google Scholar] [CrossRef]
- Ma, L.; Wang, Z.L.; Liu, W.; Zhu, T.M.; Zhao, M.X.; Chen, H. Research on multi-layer optimization planning method for intelligent distribution network considering operational flexibility. Electr. Power Constr. 2018, 39, 71–79. [Google Scholar] [CrossRef]
- Wang, H.K.; Wang, S.X.; Pan, Z.X.; Wang, J.M. Optimized dispatching method for flexibility improvement of distribution network with high-penetration distributed generation. Autom. Electr. Power Syst. 2018, 42, 86–93. [Google Scholar] [CrossRef]
- Lu, Z.X.; Li, H.B.; Qiao, Y. Power system flexibility planning and challenges considering high proportion of renewable energy. Autom. Electr. Power Syst. 2016, 40, 147–158. [Google Scholar] [CrossRef]
- Yi, H.C.; Zhang, B.D.; Wang, H.Y.; Wu, Y.; Yuan, G.S.; Lv, R.R. Distribution network dynamic reconfiguration method for improving distribution network’s ability of accepting DG. Power Syst. Technol. 2016, 40, 1431–1436. [Google Scholar] [CrossRef]
- Li, Z.H.; Chen, L.; Lu, X.M.; Zhang, Y.F.; Xu, F.; Yan, G.G. Assessment of renewable energy accommodation based on system flexibility analysis. Power Syst. Technol. 2017, 41, 2187–2194. [Google Scholar] [CrossRef]
- Sanchez-Squella, A.; Ortega, R.; Grino, R.; Malo, S. Dynamic Energy Router. IEEE Control Syst. Mag. 2010, 30, 72–80. [Google Scholar] [CrossRef]
- Geidl, M.; Koeppel, G.; Favre-Perrod, P.; Klockl, B.; Andersson, G.; Frohlich, K. A powerful approach for next-generation energy systems. IEEE Power Energy Mag. 2006, 5, 24–30. [Google Scholar] [CrossRef]
- Carli, R.; Dotoli, M. Decentralized control for residential energy management of a smart users’ microgrid with renewable energy exchange. IEEE/CAA J. Autom. Sin. 2019, 6, 641–656. [Google Scholar] [CrossRef]
- AlSkaif, T.; Zapata, M.G.; Bellalta, B.; Nilsson, A. A distributed power sharing framework among households in microgrids: A repeated game approach. Computing 2017, 99, 23–37. [Google Scholar] [CrossRef]
- Zakariazadeh, A.; Jadid, S.; Siano, P. Smart microgrid energy and reserve scheduling with demand response using stochastic optimization. Electr. Power Energy Syst. 2014, 63, 523–533. [Google Scholar] [CrossRef]
- Zhang, Y.; Gatsis, N.; Giannakis, G.B. Robust energy management for microgrids with high-penetration renewables. IEEE Trans. Sustain. Energy 2013, 4, 944–953. [Google Scholar] [CrossRef]
- Hosseini, S.M.; Carli, R.; Dotoli, M. Robust day-ahead energy scheduling of a smart residential user Under Uncertainty. In Proceedings of the 2019 18th European Control Conference, Naples, Italy, 25–28 June 2019. [Google Scholar] [CrossRef]
- Hemmati, R.; Saboori, H.; Jirdehi, M.A. Stochastic planning and scheduling of energy storage systems for congestion management in electric power systems including renewable energy resources. Energy 2017, 133, 380–387. [Google Scholar] [CrossRef]
- Feng, Y.; Wu, W.; Zhang, B.; Li, W. Power system operation risk assessment using credibility theory. IEEE Trans. Power Syst. 2008, 23, 1309–1318. [Google Scholar] [CrossRef]
- Borghetti, A.; Bosetti, M.; Grillo, S.; Massucco, S.; Nucci, C.A.; Paolone, M.; Silvestro, F. Short-term scheduling and control of active distribution systems with high penetration of renewable resources. IEEE Syst. J. 2010, 3, 313–322. [Google Scholar] [CrossRef]
- Sedghi, M.; Ahmadian, A.; Aliakbar-Golkar, M. Optimal storage planning in active distribution network considering uncertainty of wind power distributed generation. IEEE Trans. Power Syst. 2016, 31, 304–316. [Google Scholar] [CrossRef]
- Celli, G.; Mocci, S.; Pilo, F.; Loddo, M. Optimal integration of energy storage in distribution networks. In Proceedings of the 2009 IEEE Bucharest PowerTech, Bucharest, Romania, 28 June–2 July 2009; pp. 1–7. [Google Scholar] [CrossRef]
- Kim, C.; Gui, Y.; Chung, C.C.; Kang, Y. Model predictive control in dynamic economic dispatch using Weibull distribution. In Proceedings of the 2013 IEEE Power & Energy Society General Meeting, Vancouver, BC, Canada, 21–25 July 2013; pp. 1–5. [Google Scholar] [CrossRef]
- Godina, R.; Rodrigues, E.M.G.; Pouresmaeil, E.; Matias, J.C.O.; Catalão, J.P.S. Model predictive control home energy management and optimization strategy with demand response. Appl. Sci. 2018, 8, 408. [Google Scholar] [CrossRef]
- Touretzky, C.R.; Baldea, M. Integrating scheduling and control for economic MPC of buildings with energy storage. J. Process Control 2014, 24, 1292–1300. [Google Scholar] [CrossRef]
- Xie, L.; Ilic, M.D. Model predictive dispatch in electric energy systems with intermittent resources. In Proceedings of the 2008 IEEE International Conference on Systems, Man and Cybernetics, Singapore, 12–15 October 2008. [Google Scholar] [CrossRef]
- Wang, W.L.; Yang, L.; Wang, L.; Zhang, P.; Huang, J.J.; Wang, K.Y. Optimal dispatch of integrated electricity-heat energy system considering energy storage of heating network. Autom. Electr. Power Syst. 2018, 42, 45–55. [Google Scholar] [CrossRef]
- Hu, P.; Chen, H.K.; Zhu, X.H.; Chen, C. Integration planning of microgrid considering power quality constraints. Electr. Power Constr. 2016, 37, 93–100. [Google Scholar] [CrossRef]
- Zhang, X.; Yang, J.H.; Wang, W.Z.; Jing, T.J.; Zhang, M. Optimal operation analysis of the distribution network comprising a micro energy grid based on an improved grey wolf optimization algorithm. Appl. Sci. 2018, 8, 923. [Google Scholar] [CrossRef]
- Atzeni, I.; Ordóñez, L.G.; Scutari, G.; Palomar, D.P.; Fonollosa, J.R. Demand-side management via distributed energy generation and storage optimization. IEEE Trans. Smart Grid 2013, 4, 866–876. [Google Scholar] [CrossRef]
- Sperstad, I.B.; Korpås, M. Energy storage scheduling in distribution systems considering wind and photovoltaic generation uncertainties. Energies 2019, 12, 1231. [Google Scholar] [CrossRef]
- Hwang, C.L.; Masud, A.S.M. Multiple Objective Decision Making—Methods and Applications: A State-of-the Art Survey, 1st ed.; Springer Science & Business Media: Berlin/Heidelberg, Germany, 2012; p. 13. [Google Scholar]
- Chen, J.; Chen, C.S.; Duan, S.X. Cooperative optimization of electric vehicles and renewable energy resources in a regional multi-microgrid system. Appl. Sci. 2019, 9, 2267. [Google Scholar] [CrossRef]
- Kuroda, K.; Magori, H.; Ichimura, T.; Yokoyama, R. A hybrid multi-objective optimization method considering optimization problems in power distribution systems. J. Mod. Power Syst. Clean Energy 2015, 3, 41–50. [Google Scholar] [CrossRef]
- Han, C.; Lin, Z.Z.; Yang, L.; Cai, J.D.; Lv, Y.F.; Zhang, S.M. Multi-objective planning for anti-disaster backbone grid considering economics and network frame performance. Autom. Electr. Power Syst. 2019, 43, 34–44. [Google Scholar] [CrossRef]
- Tzeng, G.H.; Huang, J.J. Multiple Attribute Decision Making: Methods and Applications; CRC Press: Boca Raton, FL, USA, 2011. [Google Scholar]
- Agrawal, S.; Panigrahj, B.K.; Tiwari, M.K. Multiobjective particle swarm algorithm with fuzzy clustering for electrical power dispatch. IEEE Trans. Evol. Comput. 2008, 12, 529–541. [Google Scholar] [CrossRef]
- Xie, Z. Introduction to Game Theory; Science Press: Beijing, China, 2010. [Google Scholar]
- Zhou, B.; Song, Y.; Li, J.M.; Yu, T.; Wei, H. Multi-objective optimal generation dispatch using equilibria-based multi-group synergistic searching algorithm. Trans. China Electrotech. Soc. 2015, 30, 181–189. [Google Scholar] [CrossRef]


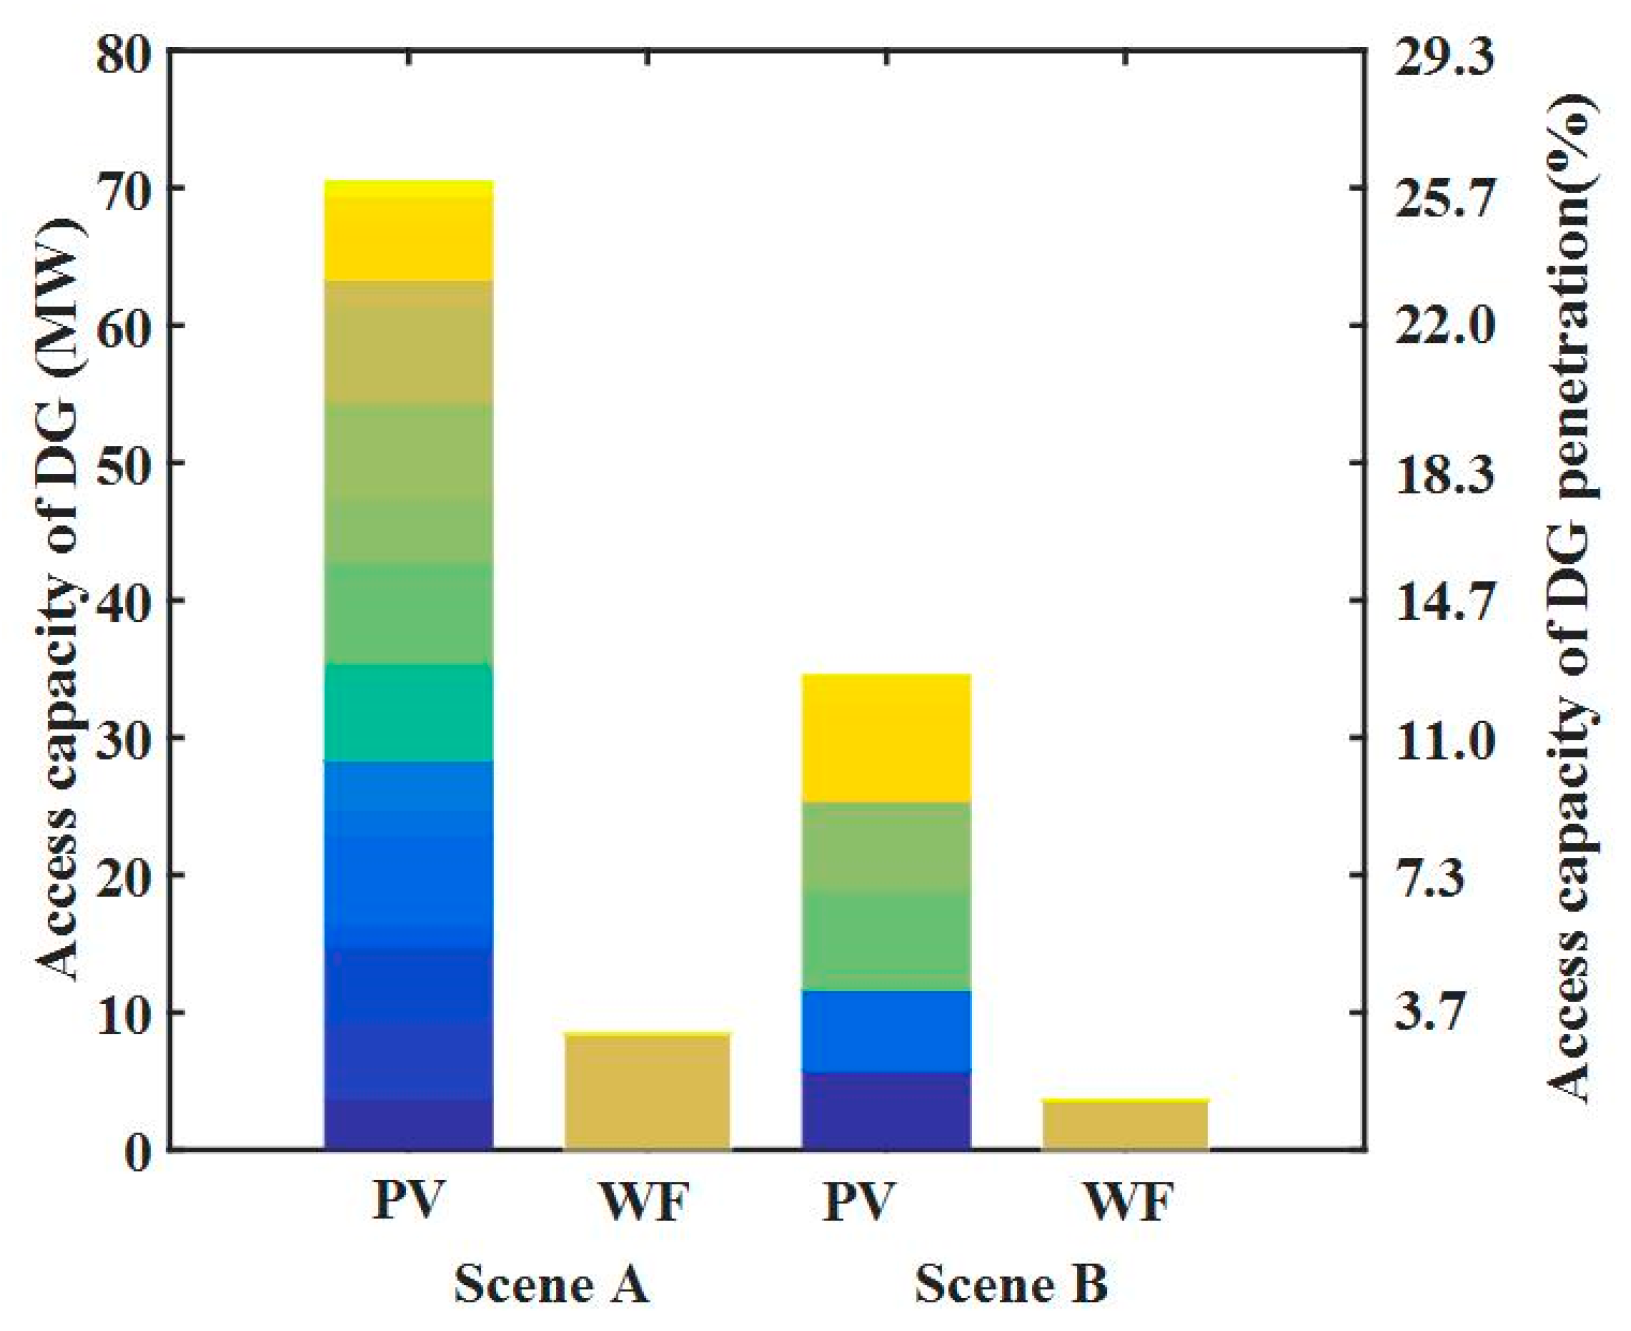
| DG Type | Accommodation Nodes in Scene A | Accommodation Nodes in Scene B |
|---|---|---|
| PV | 3, 5, 6, 7, 9, 11, 12, 29, 30, 34, 36, 37, 39, 40, 50, 51, 54, 55 | 3, 9, 34, 36, 50, 51 |
| WF | 41 | 41 |
| Objective | Daily Energy Supply of DG | Voltage Amplitude Deviation | Line Capacity Margin | The Optimal Solution (Mixed Strategy Nash Equilibrium Decision-Making) | The Optimal Solution (TOPSIS Method ) |
|---|---|---|---|---|---|
| Daily energy supply of DG | 1.000 | 0.000 | 0.5821 | 0.7996 | 0.7996 |
| Voltage amplitude deviation | 0.2442 | 1.000 | 0.456 | 0.4508 | 0.4508 |
| Line capacity margin | 0.000 | 0.4867 | 1.000 | 0.8582 | 0.8582 |
| Number of Case | Upper Limit of the Expected Value (u1, u2, u3) | Objective Function Value of Nash Equilibrium Decision-Making | Number of Optimal Solutions |
|---|---|---|---|
| 1 | (0.5,0.5,0.5) | −0.8094 | 3 |
| 2 | (0.5,0.7,0.7) | 1.2094 | 3 |
| 3 | (0.7,0.7,0.7) | −1.4094 | 3 |
| 4 | (0.5,0.7,0.9) | −1.4094 | 3 |
| 5 | (1.0,1.0,1.0) | −3.000 | - |
| Scene A | Scene B | |
|---|---|---|
| Daily energy supply of DG | 476.8 MW·h | 282.0 MW·h |
| Voltage amplitude deviation | 0.347 | 0.257 |
| Line capacity margin | 58.1% | 58.7% |
| Total accommodation capacity of DG | 78.9 MW | 38.2 MW |
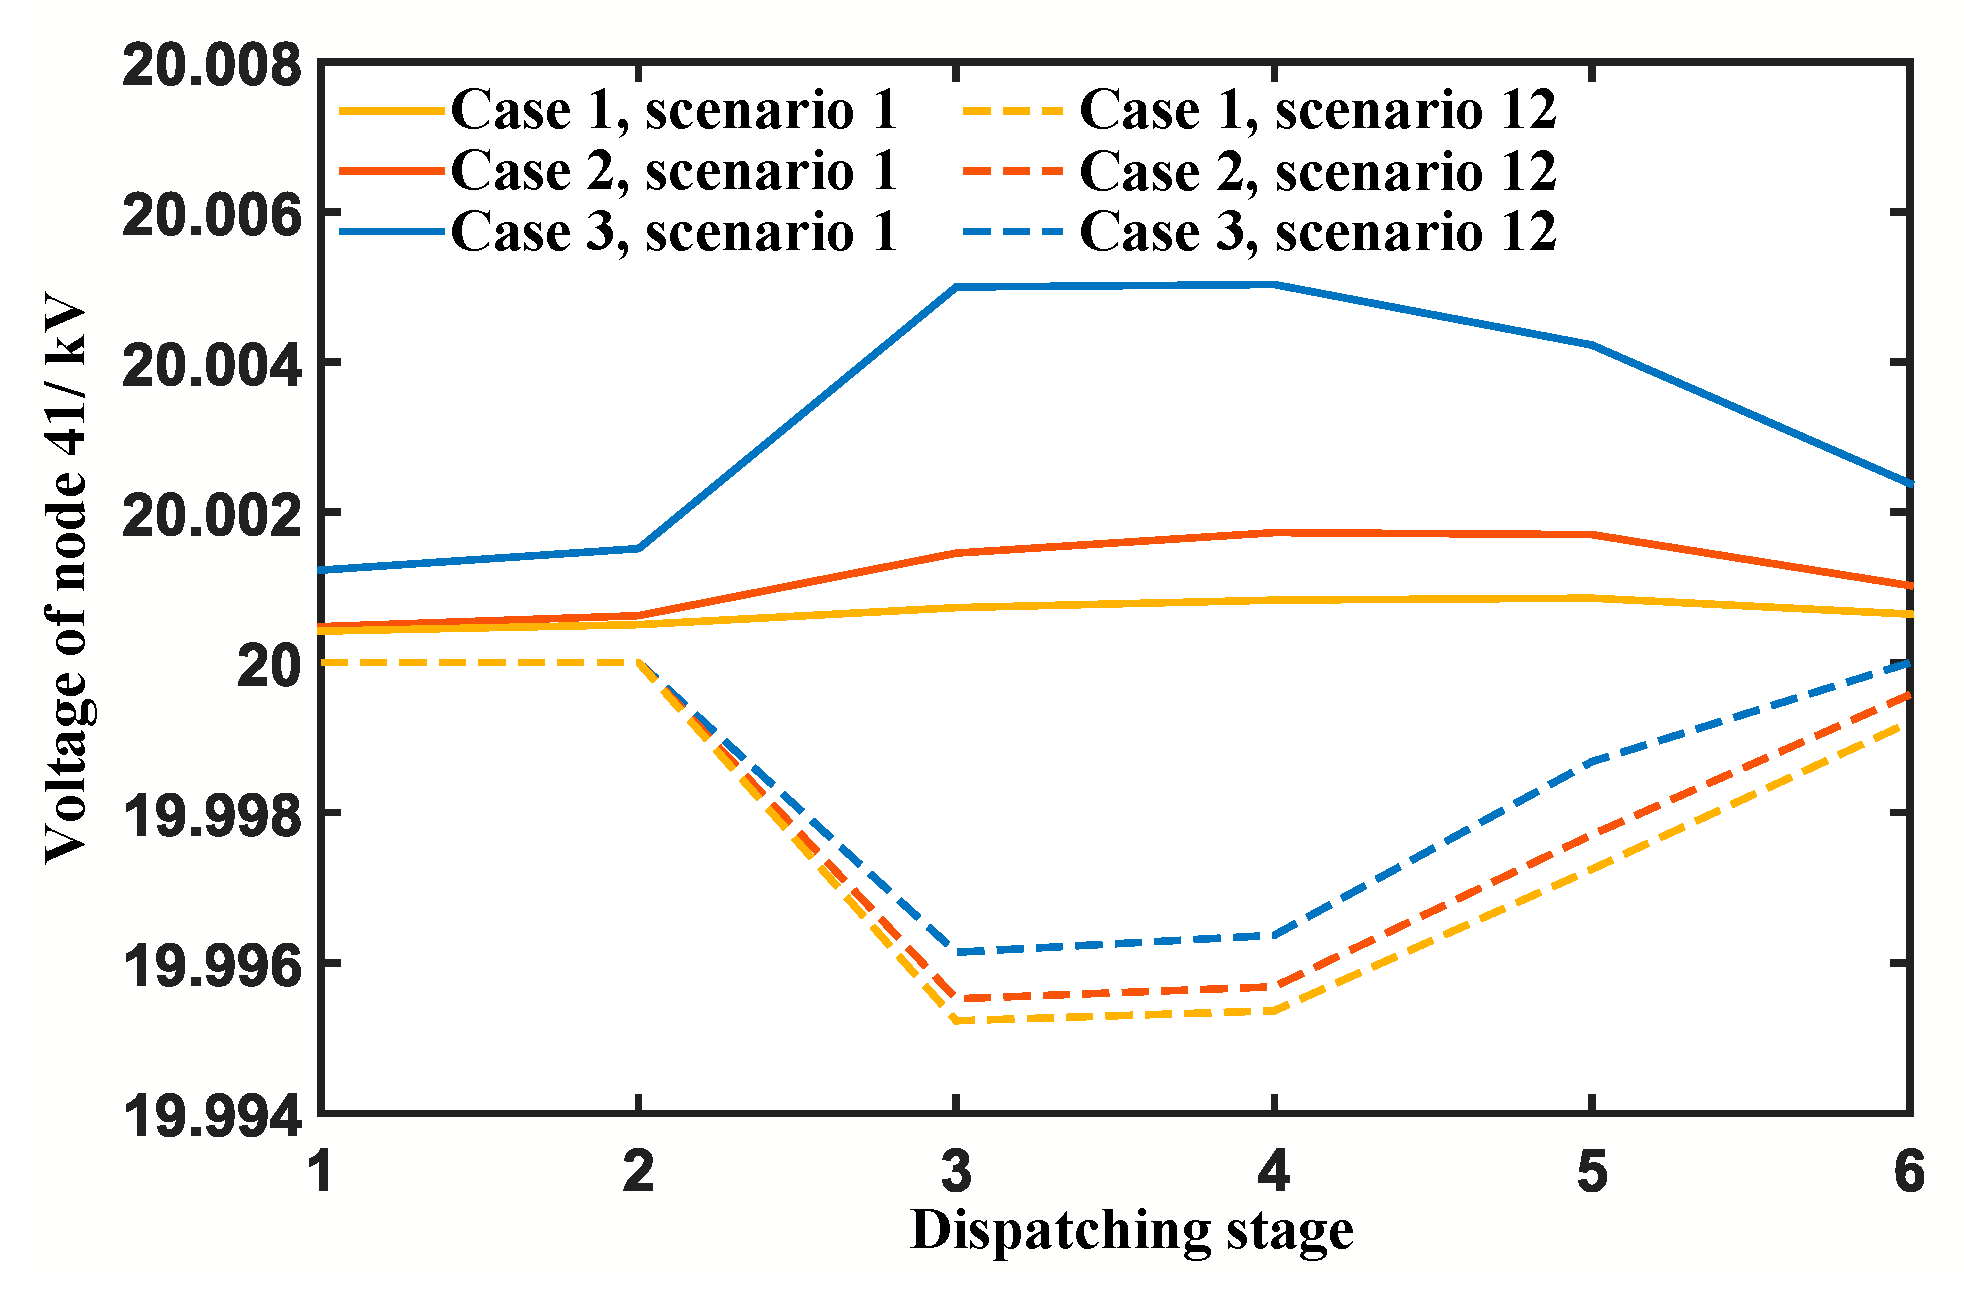
| Permissible Abandonment Rate | Case 1 (10%) | Case 2 (30%) | Case 3 (50%) |
|---|---|---|---|
| Daily energy supply of DG | 532.5 MW·h | 604.0 MW·h | 644.4 MW·h |
| Voltage amplitude deviation | 0.0933 | 0.0965 | 0.1027 |
| Line capacity margin | 56.5% | 57.0% | 57.1% |
| Total accommodation capacity of DG | 20.5 MW | 27.7 MW | 31.6 MW |
© 2019 by the authors. Licensee MDPI, Basel, Switzerland. This article is an open access article distributed under the terms and conditions of the Creative Commons Attribution (CC BY) license (http://creativecommons.org/licenses/by/4.0/).
Share and Cite
Liu, W.; Wu, J.; Wang, F.; Huang, Y.; Dai, Q.; Yang, L. Multi-objective Optimization of Accommodation Capacity for Distributed Generation Based on Mixed Strategy Nash Equilibrium, Considering Distribution Network Flexibility. Appl. Sci. 2019, 9, 4395. https://doi.org/10.3390/app9204395
Liu W, Wu J, Wang F, Huang Y, Dai Q, Yang L. Multi-objective Optimization of Accommodation Capacity for Distributed Generation Based on Mixed Strategy Nash Equilibrium, Considering Distribution Network Flexibility. Applied Sciences. 2019; 9(20):4395. https://doi.org/10.3390/app9204395
Chicago/Turabian StyleLiu, Weisheng, Jian Wu, Fei Wang, Yixin Huang, Qiongdan Dai, and Li Yang. 2019. "Multi-objective Optimization of Accommodation Capacity for Distributed Generation Based on Mixed Strategy Nash Equilibrium, Considering Distribution Network Flexibility" Applied Sciences 9, no. 20: 4395. https://doi.org/10.3390/app9204395
APA StyleLiu, W., Wu, J., Wang, F., Huang, Y., Dai, Q., & Yang, L. (2019). Multi-objective Optimization of Accommodation Capacity for Distributed Generation Based on Mixed Strategy Nash Equilibrium, Considering Distribution Network Flexibility. Applied Sciences, 9(20), 4395. https://doi.org/10.3390/app9204395