Article

Sustainable Brick Masonry Bond Design and Analysis: An Application of a Decision-Making Technique

by
Syyed Adnan Raheel Shah
1,*,
Hunain Arshad
1,
Muhammad Farhan
1,
Syed Safdar Raza
2,
Mudasser Muneer Khan
2,
Sunera Imtiaz
2,
Gullnaz Shahzadi
3,
Muhammad Ahmed Qurashi
1 and
Muhammad Waseem
4
1
Department of Civil Engineering, Pakistan Institute of Engineering & Technology, Multan 60000, Pakistan
2
University College of Engineering & Technology, Bahauddin Zakariya University, Multan 60000, Pakistan
3
Department of Mechanical Engineering, École de Technologie Supérieure, ÉTS, Montreal, QC H3C 1K3, Canada
4
Department of Environmental Chemistry, Bayreuth Centre for Ecology and Environmental Research, University of Bayreuth, 95440 Bayreuth, Germany
*
Author to whom correspondence should be addressed.
Appl. Sci. 2019, 9(20), 4313; https://doi.org/10.3390/app9204313
Submission received: 19 July 2019 / Revised: 23 September 2019 / Accepted: 1 October 2019 / Published: 14 October 2019
(This article belongs to the Special Issue New Trends of Sustainability in Civil Engineering and Architecture)

Abstract

:
This research intends to explore the sustainable masonry bond formation and interface behaviour of brick masonry bonds with different cement mortar ratios. To test the sustainable behaviour of different brick bonds, different tests were applied to evaluate the performance of the developed five brick masonry structures with the help of four mortar ratios. Following that pattern, the methodologies of a prism triplet test, a bond wrench test, a shear bond test and strength tests for brick masonry were applied. The prism triplet test explained the bonding behaviour of mortar by producing a maximum strength (0.21 MPa) with a 1:3 mix ratio, and the minimum strength (0.095 MPa) with a 1:8 mix ratio. The bond wrench test showed a bond strength of maximum 0.0685 MPa with a mortar ratio of 1:3 and a minimum of 0.035 MPa with a mortar ratio of 1:8. The strength tests for masonry structures expressed that compressive strength (0.786 MPa) and flexural strength (0.352 MPa) were found to be at maximum level with a mortar ratio (1:3) with an English bond formation. For predictions of compressive and flexural strength, artificial neural networks (ANNs) were deployed, and successful predictions of these values along with the relationships between different properties of the material, mortar combinations and bond combinations are presented to complete the exploration of the relationship. This pattern can be helpful for the selection of sustainable brick masonry formations for housing development.

1. Introduction

Brick masonry structures are an integral part of building formation due to benefits such as fire resistance, thermal abilities and sound insulation. In brick masonry, the type of brick bond plays a very important role with regard to its compressive and flexural strength. A brick bond is provided in brick masonry to achieve the following objectives [1]: (a) to break the continuity of the vertical joints in successive brick courses; (b) to enable the structure to act as a bounded mass; and (c) to provide a pleasing appearance through the laying of brick in a specific pattern. Several factors are considered to strengthen a brick wall, and some of them are highlighted here: (a) the material type and its characteristic properties; (b) workmanship during construction; (c) postconstruction environmental conditions; (d) bond strength; (e) the percentage of moisture content in the brick at the time of the laying; and (f) the age of the wall. Block water retention has a noteworthy effect on the interface bond quality: one result demonstrated that the most extreme estimation of security quality is accomplished if the dampness content in a block is around 80% [2]. When targeting an increase in bond quality, there is an increase in the quality of block workmanship that is required when bond quality and compressive strength are increased [3]. Gumeste et al. [4] summed up the supplementary outcomes: (a) crushing the weakest block in a wallet example determines the quality of the stone work, as opposed to the association between the block and the cement; (b) if a frail mortar incident should occur, the loss of bond between the block and the cement is a cause for disappointment; and (c) if there is an incidence of a solid engine, the disappointment is because of part of the block. Grenley [5] reported that the flexural and compressive quality of workmanship shifts with the utilization of various mortars. The distinctive components influencing brick mortar quality—the rate of retention in the block and the dampness held in the mortar—assume a vital part of the block stonework strength [6]. For the construction of sustainable construction masonry, it is necessary to finalize the brick bond pattern and brick mortar combination. The concept of sustainability in terms of brick bond behaviour and masonry construction is already popular in the field of construction. Moreover, researchers have tried to attain sustainable dry interlocking block masonry construction in prior studies [7]. Brick masonry has been designed for sustainable construction [8], as sustainability in construction has also been studied through masonry alternatives [9]. Sustainable strengthening techniques such as replacing greener materials or design change with carbon fibres and epoxy resins have been utilized for masonry structures [10]. Numerous attempts have been made to achieve a durable masonry structure with recycled aggregate mortars [11], and eco-friendly mortars containing either fly ash or ground brick powder as a partial replacement for cement have also been tested for sustainable masonry development [12]. The quality of the flexural bond of a brick has been tested, and it has been acknowledged that with an increase in the quality of concrete mortar, the strength of the flexural bond increases [13]. The prediction of interface behaviour in terms of the mechanical properties of sustainable brick masonry is still an open field that can help civil engineers to reduce effort according to material requirements and strength achievements, especially in terms of combinations of the effects of different factors on the mechanical properties of sustainable brick masonry structures.

2. Background

Earlier studies have shown that brick mortar strength is due to the mortar and brick surface (i.e., the contact surface of a brick) [3]. Brick material also varies during its development: for instance, clay brick can be influenced by surface polishing; the height, width and length of the specimens; the type of sampling (drilled or cut); the effect of production technology [14]; and the comparative performance of old and newly manufactured clay brick samples [15]. The moisture content of clay brick during construction has a significant effect on the strength of the bond [3]. There is no clear indication of the influence of bond strength on the compressive strength and flexural strength of masonry clay brick bonds [3]. An experimental study was conducted regarding the focused concept of an English bond by changing different mix ratios. Flexural bond quality is a vital execution standard for stonework structures, and yet there are no directions for lime-mortared stonework in configuration codes of practice. This study investigated the bond quality of normal water-powered lime (NHL) and regular bond-mortared sandstone workmanship. To this end, the flexural bond quality of brickwork couplets worked with mortars of three pressure drove qualities. Furthermore, during development of normal quantity concrete, its water content is changed to accomplish a comparative consistency and bond strength, which was measured with the bond wrench test. Workable mortar production and common curing conditions were utilized inside the test program. It was observed that the quality of the bond was clearly identified with the hydraulicity of the cover as well as the prewetting time of the sandstone, with a beneficial result due to the former and a negative impact due to the latter. The prewetting time affected the weakly water-powered lime cover (NHL 2) more than the respectably (NHL 3.5) and famously water-powered (NHL 5) lime fasteners. This helped in understanding lime-mortared brickwork and its implementation in the future [16]. In short, a prism was tested in an axial downward tap using two units of brick stone and fly ash bricks using fly ash cement mortar. The bricks were reinforced with woven wire in place, and their alternative joints were tested for axial strength and elasticity module prism specimens. This confirmed prism stones can be used to determine the compressive strength of a bond [17]. The bonding force of the bending of masonry and mortar built with three strengths (each hydraulic including the amount of water necessary to achieve three specific streams (165, 185 and 195 mm)) were measured with a test of the link key. The outcomes recommended that the mortar hold high-water-maintenance NHL, which permits a solid bond, as in Portland concrete and concrete mortars/lime. The results showed that the quality of safety was not dictated by the official reinforcement but by an increase in the maintenance of the mortar. The article stated that NHL 5 for mortar and a 185-mm stream brought about the highest ground contact, while at the same time this provided for the most astonishing maintenance of water and excellent safety. In any case, for the lower strengths (NHL 2 and NHL mortar 3.5), the water content that was important in accomplishing the stream that gave ideal mobility (165 and 165–185 mm, separately) did not prompt the most grounded connection; however, these were the most astounding stream values that gave mortars and NHL 2 and NHL 3.5 with the most grounded connection and higher water maintenance [18]. This gave a test strategy for deciding the quality of safety through bowing. The test could be utilized for research as a part of a lab to reflect the various variables, influencing the horticultural quality (and excessively expensive), thus making it impossible to deduce indicative values from stone configurations. Illustrated arrangements were made of blocks of two units: Three loading concentrations activating a twisting connection discontent parallel to the bed of the explanation; three distinct sorts of mud block, calcium silicate block and mortar; and three unique sorts were utilized as a part of the trial program. The outcomes specified the proposed new examples; moreover, the test technique could decide the flexural bond and accuracy constraint bond [19]. Strength tests were performed on couplets using a direct tensile test developed at the University of Sheffield Hallam. The results indicated that Portland cement mortar was better than hydraulic lime mortars at interpreting in terms of tensile strength; however, the results indicated that a higher mixing ratio of limes did not compare favourably to mortars based on lower proportionate cement [20].
Artificial neural networks (ANNs) have been used to study and estimate the behaviour of concrete materials, structures and buildings [21,22,23,24,25,26], and they are also applied to predict the axial behaviour of brick masonry [21,27,28] and binding materials [22]. Compressive stress was predicted with reference to biaxial patterns by using ANNs to review masonry failure [24], and a similar type of study was conducted to estimate the compressive strength of masonry developed from clay brick and cement mortar using a neural networks approach [29]. ANNs have been applied in evaluations of the moisture in saline brick walls [30], thermal bridges at wall corners [31], the level of axial compressive stress, the shear span to depth ratio, the reinforcement ratio, the anchorage end detail, the spacing of reinforcement [32] and the hydrothermal behaviour of a building component based on temperature, relative humidity and moisture content [33].
In this study, a major focus was on sustainable masonry manufacturing and engineering design. Therefore, selected brick bonds with different mortar ratios were tested to evaluate the strength of the elastic bond and the strength of the masonry share bond using five compounds. During the transformation of different bonds, the concept of contact with different levels of area was observed, while the strength of material bonding was tested by the change in the cement and sand ratio. New concepts of estimating different bonds of brick with different proportions were tested using artificial neural network techniques.

3. Materials and Methods

3.1. Materials

The present study was an attempt to present the behaviour of bond strength in the compressive and flexural capacity of five brick bonds using four types of cement mortar ratios.

3.1.1. Burnt Clay Bricks

Locally available burnt clay bricks were used in this study. Different characteristic properties of bricks are given in Table 1.

3.1.2. Cement Mortar

Four cement mortar ratios were used in this research: 1:3, 1:4, 1:6 and 1:8. Researchers have suggested that the initial flow of the mortar is the main factor in the workability of mortar. Consequently, a reasonable initial flow value of 150 ± 5 mm was fixed rather than the water cement ratio being fixed [19]. Characteristics of cement mortar are given in Table 2.

3.1.3. Brick Masonry Bonds

Brick masonry bonds are discriminated between based on brick formation patterns. Some of these bonds are utilized according to conditional requirements in developing countries. Several bonds are specified with their properties and functionality. An English bond involves a substitute course of headers and stretchers.
In an English bond arrangement, vertical joints in the header courses come over each other and the vertical joints in the stretcher course are in an undefined line (Figure 1a) [1,34]. In a Flemish bond, each course involves trade headers and stretchers, and the substitute headers of each course are engaged over the stretchers in the course underneath [1,34]. Every other course starts with a header at the corner. For the softening of vertical joints up the dynamic courses, closers are implanted in substitute courses by the quoin header, as shown in Figure 1b. Header bonds [1,34] allow for better arrangements, and all things considered, they are utilized for dividers bent on the plan. This bond is predominantly utilized as a part of this sort of holding, where every block is laid as a header on the appearance. The cover, which is, for the most part, a large portion of the width of the block, is produced by presenting a three-quarter bat in every substitute course at the quoins. Footing (in establishments) is for better transverse appropriation of the load (Figure 1c). A Dutch bond [1,34] is an alteration of the early English cross-bond and is comprised of exchange courses of headers and stretchers. In this study plan of block work, every extending course began at the quoin with a three-quarter bat, and every other extending course had a header set alongside the three-quarter block bat at the quoin (Figure 1d). A silver lock bond [1,34] is a type of holding blockwork in which tense blocks are laid. It is sparing, however, and frail in quality, and thus it is prescribed for garden dividers or parcel dividers. In this bond, the blocks are laid as headers and stretchers in interchange courses in a manner where headers are laid on a bed to help the stretchers, in such a way that headers are laid on bed aid the stretchers are laid on edge forming a continuous cavity. (Figure 1e) [1,34].

3.2. Methodology and Experimental Design

3.2.1. Casting and Curing of Prisms and Triplets

The way to orchestrate blocks in various courses with a specific end goal of tying them together to bring together a mass of brickwork is called “holding” in brickwork. Holding in blockwork is done to guarantee that there is not more than one vertical joint since brickwork having persistent vertical joints will not be a brought-together mass and will be comprised of little segments that go about as a section. In such a development, the heap on the divider might not be consistently appropriated, but rather, there are odds of the settlement of the load. In any case, if a divider is legitimately reinforced so that there are no ceaseless vertical joints, the heap will get appropriated. In this progression, the block bonds are set up for testing, and this progression proceeds with a supply of required blocks and mortars. To start, the course is laid, and then bond mortars are put on it and spread by a trowel, and then the second course is laid. With this technique, the entire wallet is ready. The level of the wallet is checked by an air pocket tube, and a mallet is utilized to solidify the block. Curing is an essential stride in the planning of block bonds. In curing, the specimens are wetted by water. Because of high temperatures, the water vanishes rapidly, and in this manner, the mortar dries: because of this, the bond cannot pick up the most extreme quality. Subsequently, by curing, we can defeat this issue. There are numerous techniques for curing: (a) straightforwardly sprinkling the water on the test samples with a pipe; (b) sprinkling the water on test samples through showers and (c) covering the specimen with splashed sacks (covers). Before testing, we affirmed the methods of soaking the blocks with water and preparation of the mortars at the required proportions, and after that, wallets were developed of the required bonds with sizes 83.82 cm high and 22.86 cm wide. Then, the curing of the test samples was accomplished for 7 days, and they were dried for 24 h preceding testing [35,36,37]. The temperature of the laboratory and the relative humidity during the curing period were 28–30 °C and 40%–65%, respectively. Moreover, during the drying processing testing, the laboratory tests were carried out at 28 °C, and the relative humidity was 55%.

3.2.2. Bond Wrench Test

The bond wrench test (Australian Standard-AS 3700-2001) [38] has relevance for both in situ and lab applications. The American Society for Testing and Materials (ASTM C 1072-00a (2000)) [39] test setup and the bond wrench test are more sensible for in situ testing [3,40]. The bond torque arm (appearing in Figure 2) was made as stipulated in Australian Standard (AS 3700-2001) [38], with a bucket displayed toward the end of the bond torque arm. A void holder was attached to the catch, and after that, a small piece was at once filled, utilizing sand to apply bowing tries to the mortar joint until flexural bond bafflement happened. The weight of the bucket and sand was measured to the nearest 0.01 gram and used to calculate the flexural bond failure stress [3].
The bond wrench test was utilized for stonework flexural bond quality. The constraint was connected through a cantilevered arm course of action, which instigated the flexural worries over the mortar bed joint (the mechanical assembly appears in Figure 2). The gross area flexural bond strength was calculated by using Equation (1):
F g = 6 P L + P 1 L 1 b d 2 P + P 1 b d ,
where, Fg = the gross area flexural bond strength (MPa); P = the maximum load applied (N); P1 = the weight of the loading arm (N); L = the distance from the centre of the prism to the loading point (mm); L1 = the distance from the letter of the prism to the centroid of the loading arm (mm); and b = the cross-sectional width of the mortar bedded area measured perpendicularly to the loading arm of the upper clamping bracket.

3.2.3. Shear Bond Test

The in situ shear test (ASTM C 1531–03) [41] and the triplet shear test (Rilem TC 127-MS.B.4) [42] were designed as a mechanism for independent lab testing, as shown in Figure 3. The in situ shear tests were performed without level jacks, and the triplet shear tests were performed with various levels of focus-point pre-weight stacks [43]. Figure 3 shows a triplet combination of three bricks which are connect with the mortars of different mix ratio combinations. Load is exerted on the middle brick with the help of compression machine to check the bond triplet based strength [43]. The commitment of the neck range joints was not considered in the bed-joint shear quality estimation, as the neck region joints were by and large deficiently laid, and therefore their devotion to the bed-joint shear quality was immaterial [43].

3.2.4. Compressive and Flexural Strength of Brick Bonds

The compressive and flexural quality of the block stonework were controlled by testing five-block high-reinforced crystal with various mortar blend proportions. The formation of compressive and flexural strength is shown in Figure 4. Wallets with different bond formations and motors of different parameters were arranged and tried for their compressive quality and flexural strength [3].

3.2.5. Statistical Model and Relationship Analysis

Artificial neural networks (ANN) are propelled by the way the human mind works. The fundamental unit is the neuron, which gets a progression of data sources, forms the data and sends back a reaction or then again yields. Two phases occur inside every neuron: in the primary phase, input esteems are joined directly per combined coefficients or pre-characterized weights (the free term of this direct blend is known as “bias”). The second stage is comprised of applying a capacity (known as the transfer function) to the outcome to acquire the neuron’s yield. This can be any sort of capacity, although straight or sigmoidal capacities are regularly utilized. Various neurons combinations make ANNs, as shown in Figure 5. The principal gathering (or input) layer contains the system contributions, with meet quantities of neurons and data sources. The last gathering (or output) layer gives the system’s yield and has an indistinguishable number of neurons from the system’s yields. The layers between the input and output layers are known as hidden layers. The quantities of the two layers and neurons may change with the extent of the measure of the issue displayed by the system. In this sort of system, the neurons in each layer are associated with those in the following layer, with the goal of the data streaming from the info to the output layer [27].
The exactness of the estimation of a system was measured by the foundation of the root mean squared error (RMSE), the difference between the actual and the predicted values, the mean absolute error (MAE) and the various coefficients of determination (R2) [44,45]:
R M S E = 1 N n = 1 N a c t u a l p r e d i c t e d ,
R 2 = 1 S S E S S y ,
where SSE is the sum of squared errors of prediction, and SSy is total variation. The mean absolute error is like the root mean square, except it uses the absolute difference instead of the squared difference. Usually, the performance of a model is compared using the coefficient of determination (R2). A classic fit would bring about an R2 of 1, and a poor fit would be almost 0 [45].

4. Results and Discussion

4.1. Prism Compressive Strength

These prisms were made with 1:3, 1:4, 1:6 and 1:8 cement mortar ratios. Their compressive values are provided in Table 3, which shows that a motor with a 1:3 ratio provided the highest strength in the case of prism strength (details can be seen in Table 3). The compressive strength with a mortar ratio of 1:3 was at a maximum at 0.577 MPa, and it was at a minimum (0.434 MPa) with a mortar ratio of 1:8.

4.2. Flexural Bond Strength

The bond wrench test was utilized for the stonework flexural bond quality. A strength comparison through the wrench test (as given in Table 4) showed that ratio-wise, 1:3 provided higher strength. The binding power between the two bricks was at a maximum (0.0685 MPa) with a mortar ratio of 1:3 and at a minimum (0.035 MPa) with a mortar ratio of 1:8.

4.3. Triplet Shear Strength

The shear bond strength of the brick mortar joints was determined by motor ratios 1:3, 1:4, 1:6 and 1:8. A brick triplet specimen with different mortar ratio waves was prepared to calculate the bond strength of the brick mortar joints. Shear resistance between bricks was tested with this test, which showed that the shear between three bricks was at a maximum (0.21 MPa) with a mortar ratio of 1:3 and at a minimum (0.095 MPa) with a mortar ratio of 1:8. The detailed output can be seen in Table 5.

4.4. Compressive Strength of Brick Bonds

In this study, compressive and flexural strength were determined by preparing five types of brick bonds with four cement mortar ratios. After application of the bond mechanism, its combinations were tested with changes in the mortar ratio. The results showed that the English bond was at a maximum (0.786 MPa) with a mortar ratio 1:3 and was at a minimum (0.492 MPa) with a mortar ratio of 1:8; the Flemish bond was at a maximum (0.538 MPa) with a mortar ratio of 1:3 and was at a minimum (0.507 MPa) with a mortar ratio of 1:8; the header bond was at a maximum (0.683 MPa) with a mortar ratio of 1:3 and was at a minimum (0.518 MPa) with a mortar ratio of 1:8; the Dutch bond was at a maximum (0.652 MPa) with a mortar ratio of 1:3 and was at a minimum (0.476 MPa) with a mortar ratio of 1:8; and the silver-lock bond was at a maximum (0.517 MPa) with a mortar ratio of 1:3 and was at a minimum (0.424 MPa) with a mortar ratio of 1:8. Overall, the English bond with a maximum of 0.786 MPa with a mortar ratio of 1:3 was the best combination. The results are shown in Table 6.
The connection between the block and the mortar is crucial for composite conduct between the two materials. Advancement of the side pressure leads to pressure in the block and cement or the other way around, keeping in mind the presumption that there is no connection weakness at the interface. It is valuable to comprehend the relationship between the bonds and the compressive quality [46]. As demonstrated, the block utilized here with an English bond had a higher value of compressive strength (0.786 MPa) in comparison to any other bond. The brick would be triaxle pressure, while the mortar would be biaxial strain and pressure. The level-pressure brick was the aftereffect of stiffer mortar pulling internally at the similarity of the strain. The shear stress of the block mortar interface prompted flat pressure in the block. Because the association with the block mortar interface broke, the flat pressure-actuated shear push additionally vanished, and the block fizzled through horizontal strain. A contour graph shows the higher-strength area clearly. A block-wise comparative assessment can be seen in Figure 6 and Figure 7.

4.5. Flexural Strength of Brick Bonds

Flexural strength was also a compulsory phase tested in the developed masonry structures. Given a mortar, an expanded restricting power perpetually prompts an expansion in the compressive quality of the stonework. For instance, when the concrete mortar (CM) 1:3 was utilized, the holding quality of 0.352 MPa led to a stonework compressive quality of 2.15 MPa as shown in Table 7. Nonetheless, when the holding quality added up to 0.387 MPa, utilizing a mortar covering led to a brickwork compressive quality of up to 4.09 MPa. This could be found overall for every one of the mortars. Figure 8 demonstrates a chart showing the relationship between the coupling quality and the compressive quality for a B1 block (utilizing four types of mortars and procedures of change necessities). The figure demonstrates that the connection was not direct, and the rate of increment of the compressive quality was more noteworthy than the region of powerless security quality. By and large, an expansion by four times the flexural bond quality prompted a multiplying of the imperviousness to pressure [44]. An investigation of this chart additionally uncovered a few different elements. The bond quality appeared to have a more grounded connection with the compressive quality of the brickwork and the quality of the mortar. The plot of quality and mortar workmanship compressive quality in Figure 9 demonstrates a total nonappearance of a relationship. Figure 9 again indicates plainly that for some mortars, an expansion in the grip compulsion unavoidably built the pressure quality of the stonework. It was additionally noticed that a little mortar with great holding could regularly show improvement over a more grounded mortar with a lower bond quality. Figure 8 demonstrates a connection between mortar combination quality and flexural quality (as shear commitments and commitment bowing), utilizing the type B1 and physical type CM2 with different holding strengths. The contour graph shown in Figure 9 shows a lesser strength in dominance, with bond type-1 and mortar ratio type-1 as highest strength zone in green. With all these outcomes, we emphatically propose that the bond quality is of principal significance in accomplishing great imperviousness to pressure in brickwork.

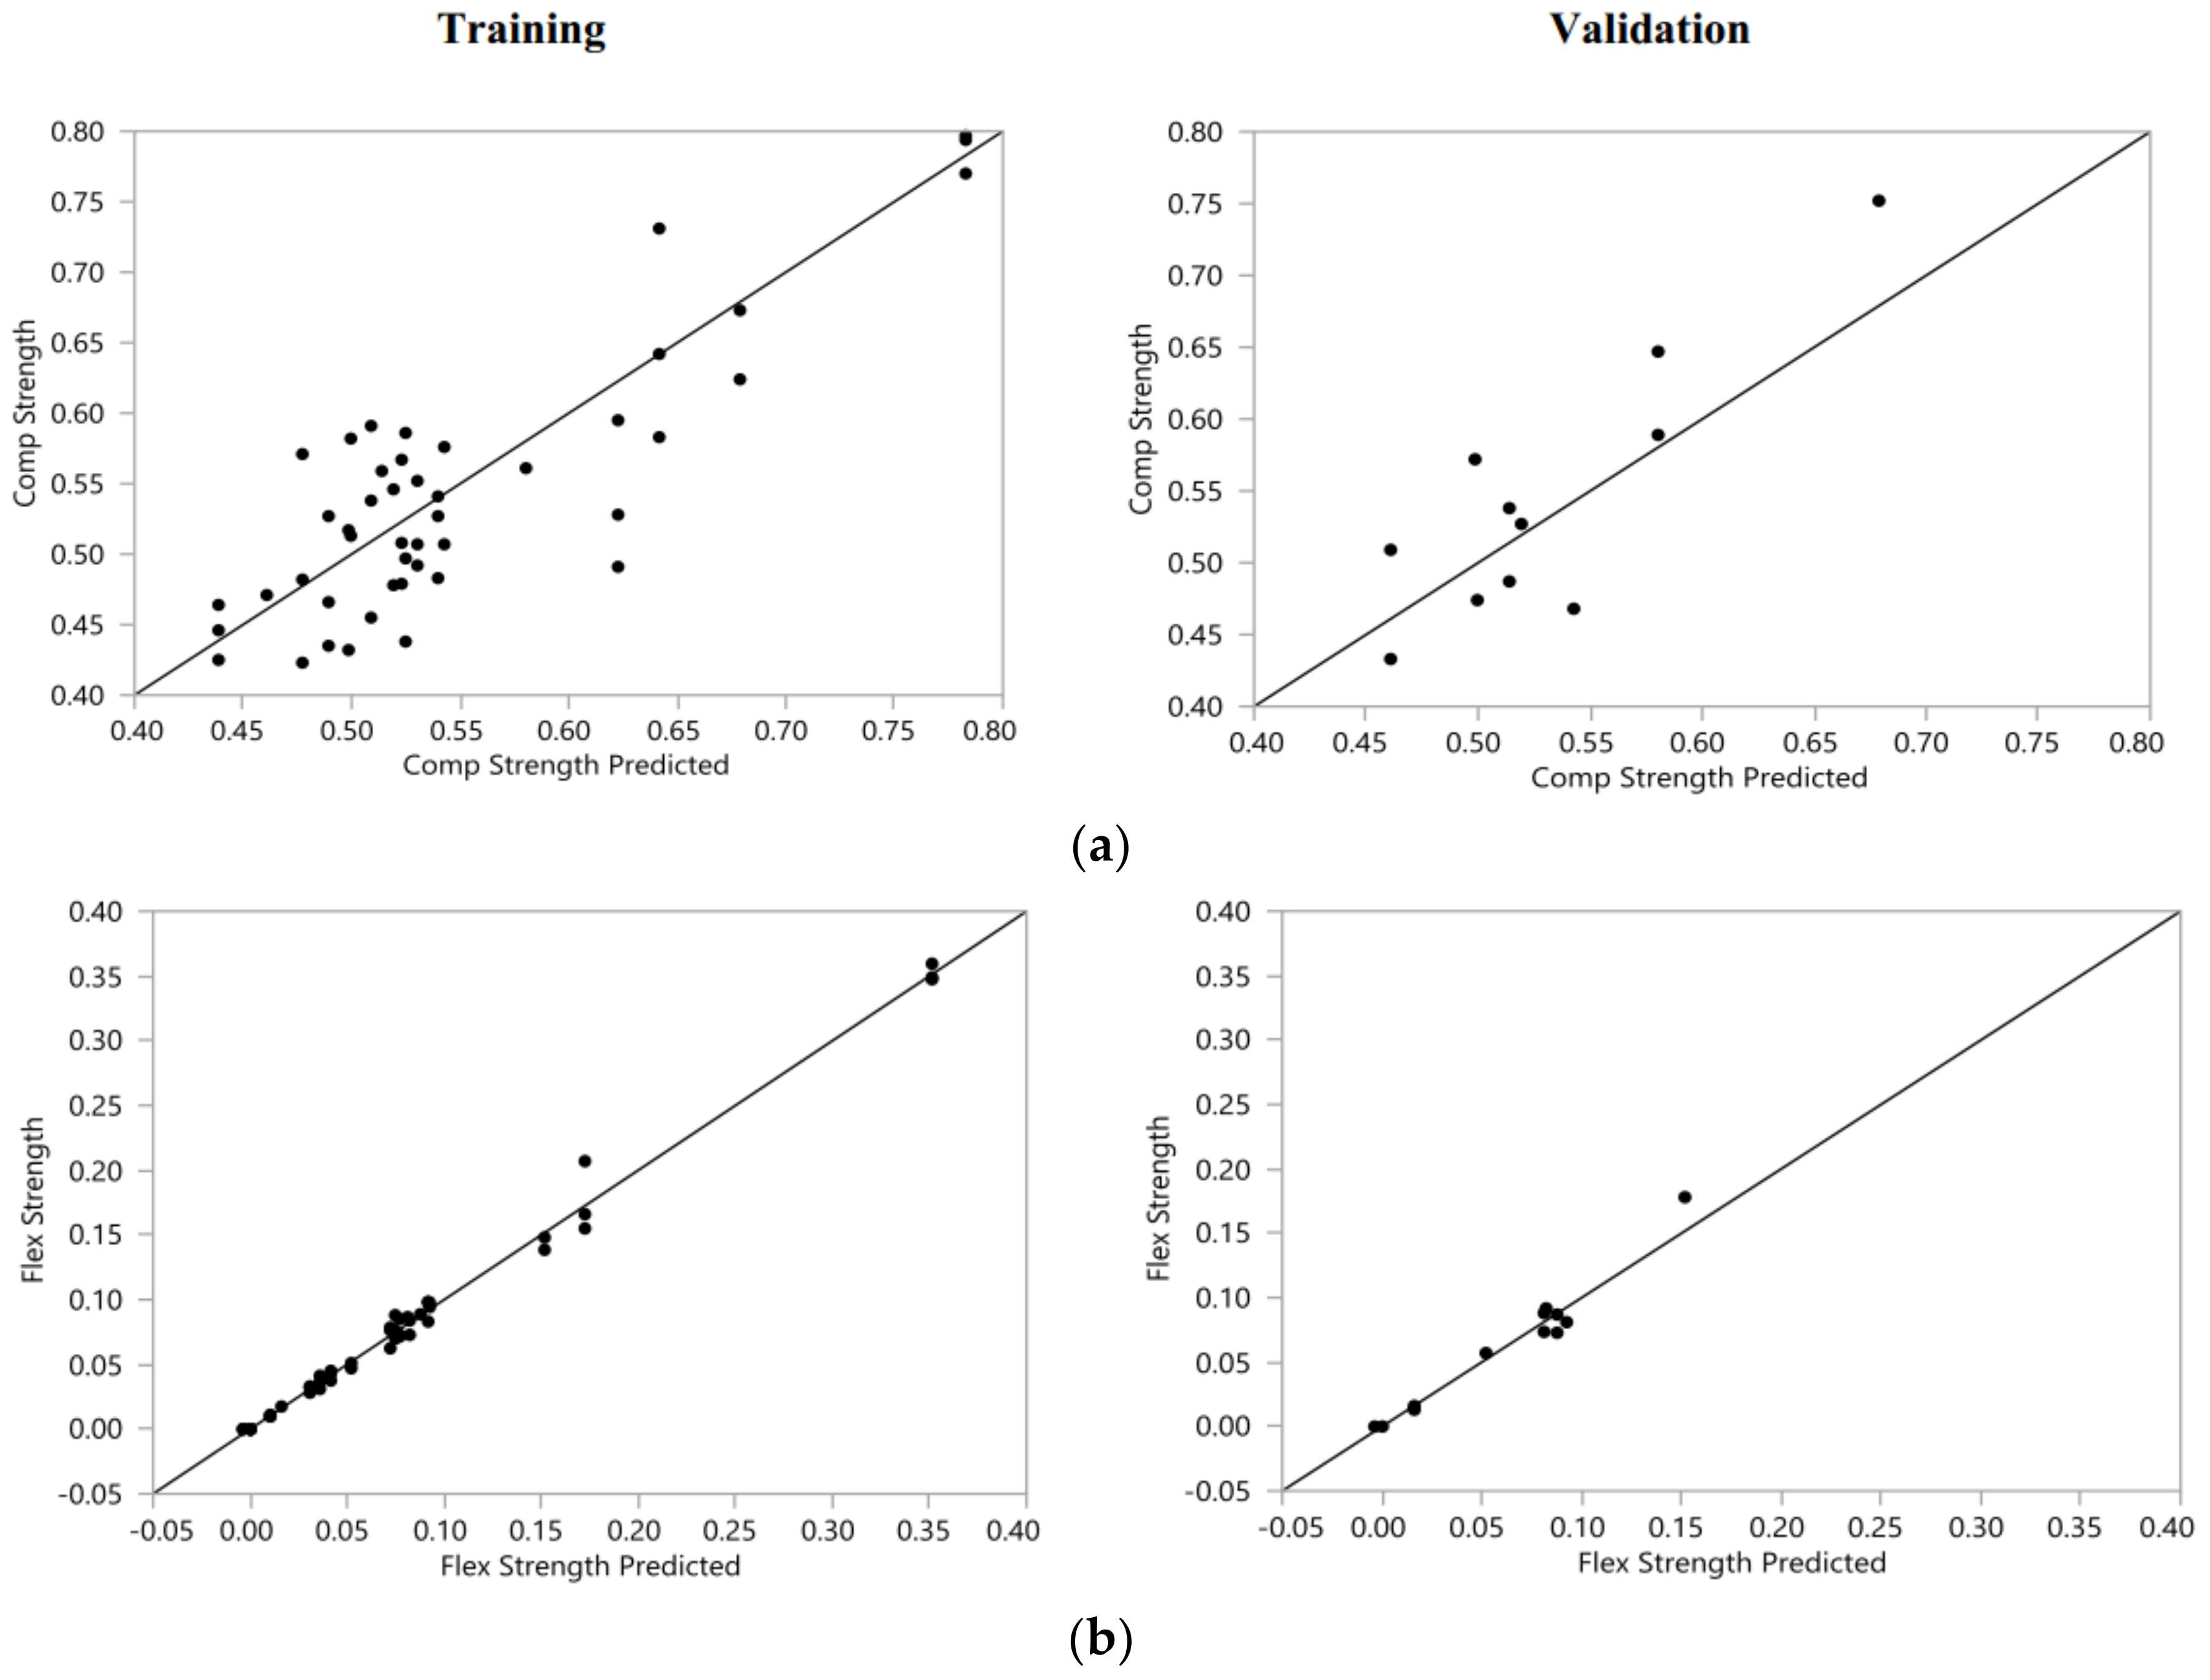
4.6. Relationship Analysis

Artificial neural networks (ANN) are propelled in the way shown in Figure 10. An artificial neural network (ANN) technique was deployed to analyse the strength behaviour of the different brick bond combinations and mortar ratios. Compressive strength (MPa) and flexural strength (MPa) are two major parameters known as decision-making indicators for the strength of a structure. These two variables were predicted in terms of cement, sand, water, the mortar ratio, the bond type, the cement/sand ratio, the water/binder ratio and the water/sand ratio. A relationship analysis of compressive and flexural strength and these variables provided a significant combination relation analysis. The data description for this study is shown in Table 8.

4.6.1. Model Parameters

The developed model was used for the estimation of the output, which was nearest to the desired variables. Altering the weights for each node provided a specific output, which was closest to the actual value. Estimated weights for the model are given in Table 9.
Usually, the performance of a model is compared using the coefficient of determination (R2). A classic fit would bring about an R2 of 1, and a poor fit would be almost 0 [45]. The model parameter estimates of the ANN model showed that for the prediction of compressive strength, the ANN model was successful up to 75.5% in the training data and 75.5% in the validation data, as shown in Table 10. For flexural strength prediction, these values were even higher, at 99% for the training data and 97% for the validation data.
The accuracy of prediction could be visualized in plots drawn for compressive and flexural strength (between actual and predicted data for both the training and validation data), as shown in Figure 11.

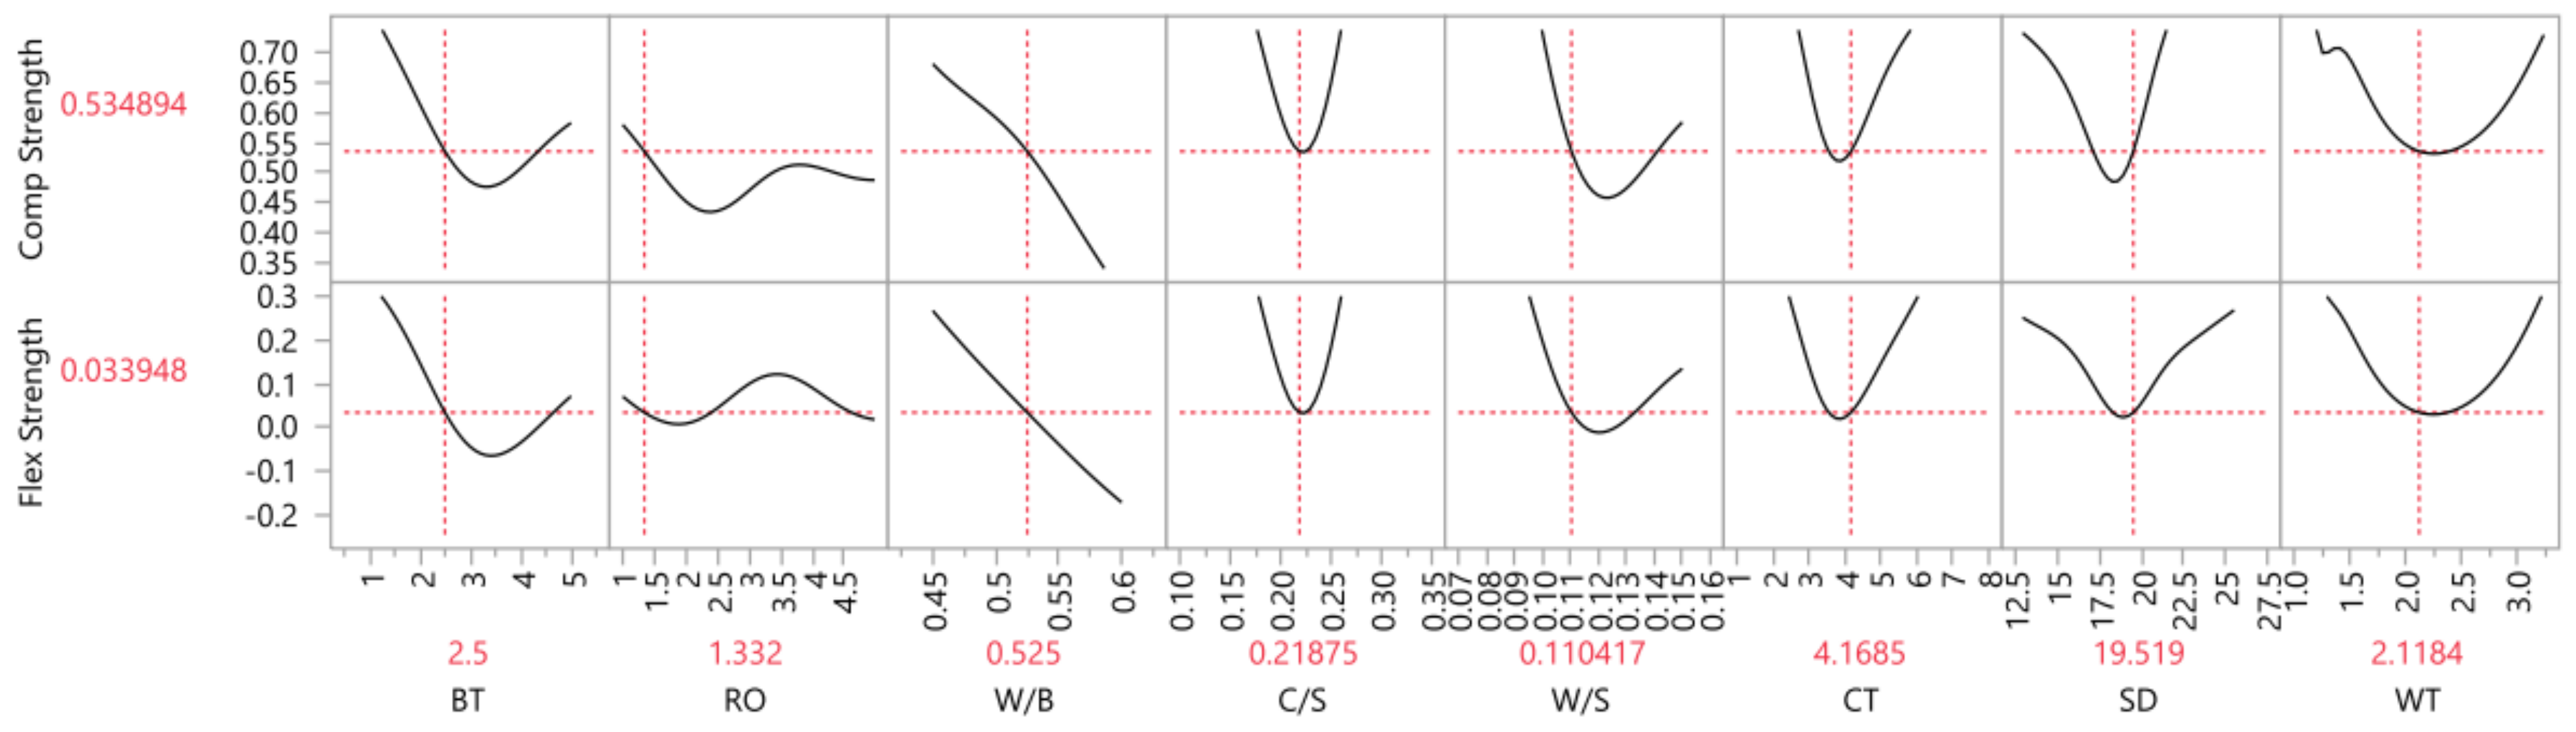
4.6.2. Prediction Profiles

Prediction profiles provided an opportunity to identify and estimate the behaviour of different variables in compressive and flexural strength, as shown in Figure 12. With an increase in the cement and sand quantity, there was an increase in strength properties, but with an increase in water strength, those properties were reduced. The cement/sand ratio also gave a significant increase in strength. Water in terms of the binder showed a decrease in the strength ratio. A mortar mix ratio of 1:3 showed the highest strength in terms of the other mix ratios.

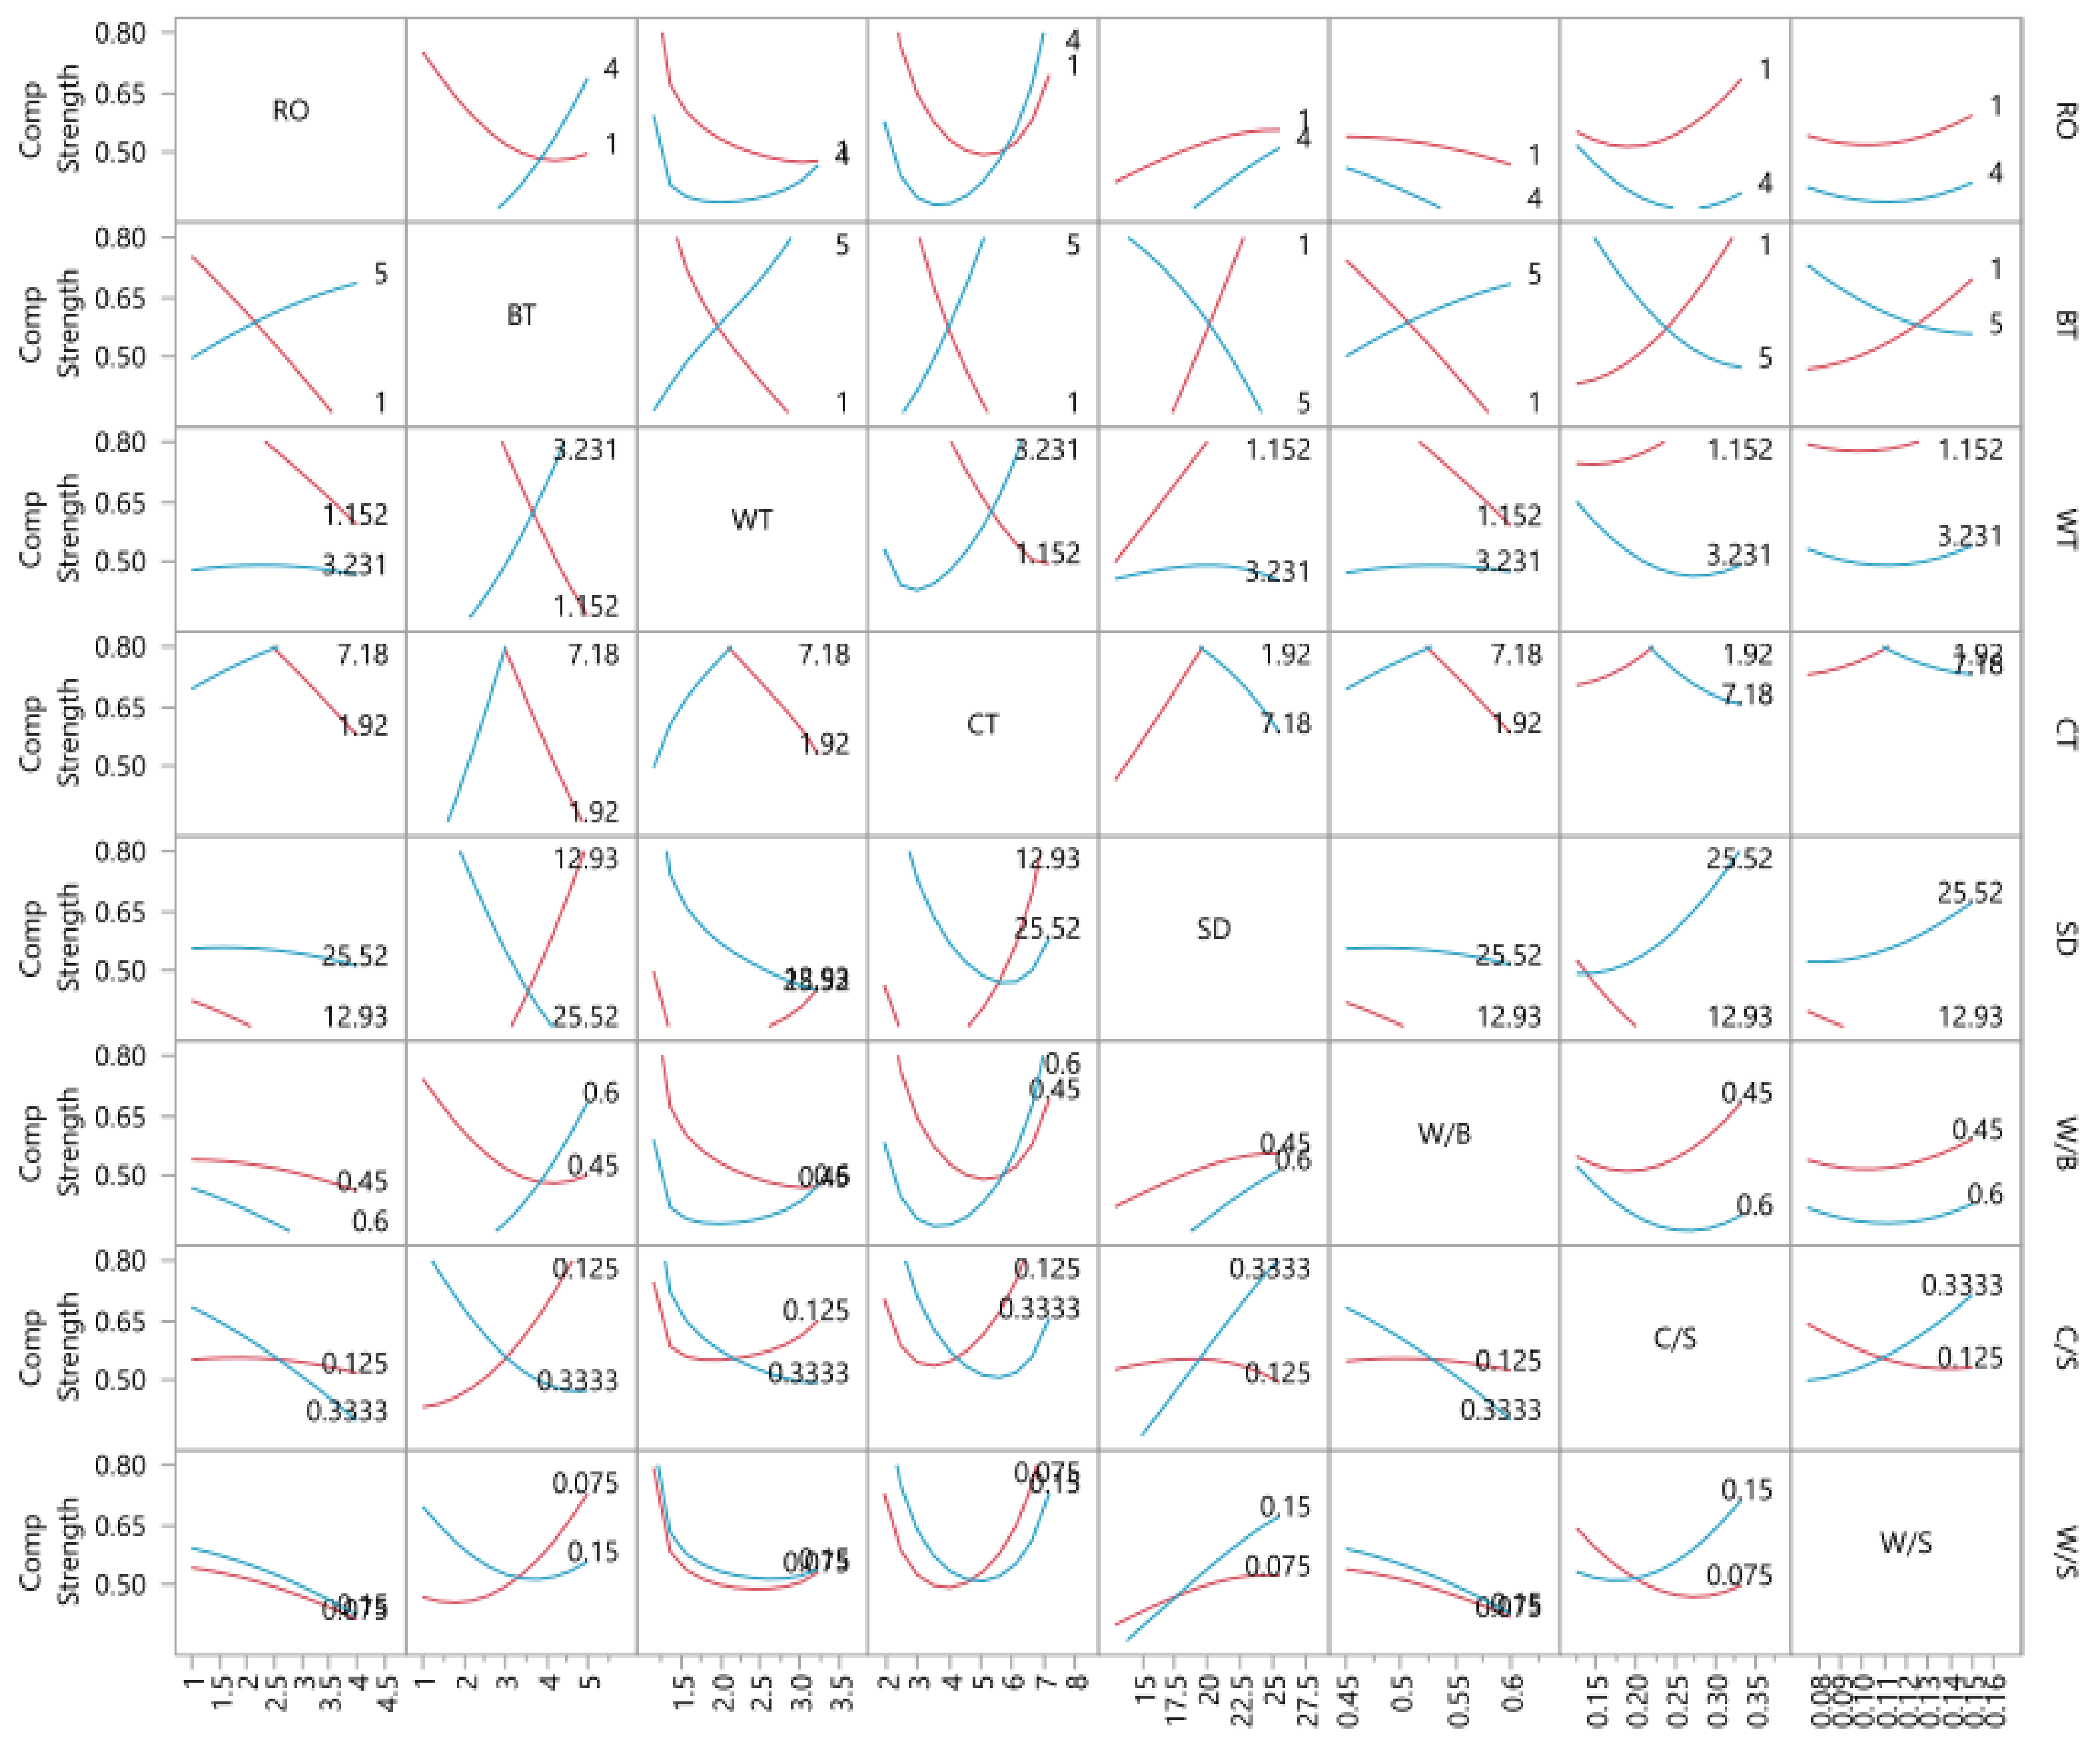
4.6.3. Interaction Profiles

Interaction profiles, as shown in Figure 13 and Figure 14, provided a triple-index-like formation where each strength parameter could be analysed in terms of visualised combinations of two variables. Furthermore, the behaviour could be studied in terms of changing patterns along with minimum and maximum values.

5. Conclusions

In the experimental analysis, the following outcome was observed during the performance analysis of brick masonry structures. The analysis indicated that the English bond gave the maximum value of compressive and flexural strength, with a cement mortar ratio of 1:3. However, with the increase of sand in the cement mortar ratio (1:8), compressive and flexural strength decreased as the cement mortar bonding capacity was reduced. Furthermore, as the flexural bond and shear bond strength increased, there was an increase in the compressive strength of the masonry prism. In the masonry prism, the compressive strength test showed that failure depended upon the brick’s bond with the mortar, i.e., it depended upon the binding strength of the mortar. Similarly, in the case of strong binding mortar, failure shifted to brick strength. An ANN technique was deployed to analyse the strength behaviour of the different brick bond combinations and mortar ratios. Compressive strength (MPa) and flexural strength (MPa) are two major parameters known as decision-making indicators for the strength of a structure. These two variables were predicted in terms of cement, sand, water, the mortar ratio, the bond type, the cement/sand ratio, the water/binder ratio and the water/sand ratio. A relationship analysis of the compressive and flexural strength and these variables provided a significant combination relation analysis. Changing trends indicated that a certain quantity of cement and water provided a higher strength and that an increase could reduce strength. A prediction model was more significant in the case of flexural strength than in the case of compressive strength. Finally, it was observed that an English bond in combination with a 1:3 (C/S) ratio provided the maximum strength. Changing requirements could be observed from the graphs shown in an analysis of the combinations of different properties and materials.

Author Contributions

Conceptualization, S.A.R.S. and S.S.R.; Methodology, S.S.R. and M.M.K.; Software, S.A.R.S. and H.A.; Validation, M.F., S.I. and G.S.; Formal Analysis, S.S.R. and M.M.K.; Investigation, S.S.R. and H.A.; Resources, S.A.R.S. and S.S.R.; Data Curation, S.A.R.S. and H.A.; Writing-Original Draft Preparation, S.A.R.S., S.S.R. and M.F.; Writing-Review & Editing, M.A.Q. and M.W.; Visualization, S.A.R.S.; Supervision, S.S.R. and M.M.K.; Project Administration, S.A.R.S. and S.S.R.

Funding

This research received no external funding.

Acknowledgments

We whole-heartedly acknowledge the testing contributions of Khalid, Tausif, Mumtaz and Javed.

Conflicts of Interest

The authors declare no conflict of interest.

References

  1. Arora, N.; Gupta, B. Building Construction; M/S Satya Prakashan: New Dehli, India, 1997. [Google Scholar]
  2. Hogberg, E. Mortar Bond; Report No. 40; National Swedish Institute for Building Research: Stockholm, Sweden, 1967. [Google Scholar]
  3. Sarangapani, G.; Reddy, B.V.; Jagadish, K. Brick-mortar bond and masonry compressive strength. J. Mater. Civ. Eng. 2005, 17, 229–237. [Google Scholar] [CrossRef]
  4. Gumaste, K.S.; Rao, K.N.; Reddy, B.V.; Jagadish, K.S. Strength and elasticity of brick masonry prisms and wallettes under compression. Mater. Struct. 2007, 40, 241–253. [Google Scholar] [CrossRef]
  5. Grenley, D. Study of the Effect of Certain Modified Mortars on Compressive and Flexural Strength of Masonry; Johnson, F.B., Ed.; Gulf Publishing Company: Houston, TX, USA, 1969; pp. 28–33. [Google Scholar]
  6. Groot, C. Eflbct of Water on Mortar-Brick Bond; Delft University of Technology: Delft, The Netherlands, 1993. [Google Scholar]
  7. Deepak, B. Sustainable dry interlocking block masonry construction. In Proceedings of the 15th International Brick and Block Masonry Conference, Florianópolis, Brazil, 3 June 2012. [Google Scholar]
  8. El-adaway, I.; Breakah, T.; Khedr, S. Brick Masonry and Sustainable Construction. In Proceedings of the ICSDC 2011: Integrating Sustainability Practices in the Construction Industry, Kansas City, MO, USA, 18 January 2012; pp. 524–534. [Google Scholar]
  9. Rakesh, K.M.; Sanjay, S.J. Sustainability in Construction through Masonry Alternatives. Int. J. Innov. Res. Sci. Eng. Technol. 2017, 6, 12836–12844. [Google Scholar]
  10. Righetti, L.; Borri, A.; Corradi, M. Sustainable strengthening techniques for masonry structures. In Proceedings of the Cinpar 2016—XII International Conference on Structural Repair and Rehabilitation, Porto, Portugal, 26–29 October 2016. [Google Scholar]
  11. Corinaldesi, V. Mechanical behavior of masonry assemblages manufactured with recycled-aggregate mortars. Cem. Concr. Compos. 2009, 31, 505–510. [Google Scholar] [CrossRef]
  12. Moriconi, G.; Corinaldesi, V.; Antonucci, R. Environmentally-friendly mortars: a way to improve bond between mortar and brick. Mater. Struct. 2003, 36, 702–708. [Google Scholar] [CrossRef]
  13. Reddy, V.B.; Gupta, A. Strength and elastic properties of stabilized mud block masonry using cement-soil mortars. J. Mater. Civ. Eng. 2006, 18, 472–476. [Google Scholar] [CrossRef]
  14. Fódi, A. Effects influencing the compressive strength of a solid, fired clay brick. Periodica Polytechnica Civ. Eng. 2011, 55, 117–128. [Google Scholar] [CrossRef]
  15. Suciu, O.; Cruciat, R.; Ghindea, C.L. Experimental case studies on clay fired bricks compressive strength. In Key Engineering Materials; Trans Tech Publications: Baech, Switzerland, 2014. [Google Scholar]
  16. Barr, S.; McCarter, W.J.; Suryanto, B. Bond-strength performance of hydraulic lime and natural cement mortared sandstone masonry. Construct. Build. Mater. 2015, 84, 128–135. [Google Scholar] [CrossRef]
  17. Tensing, D. Experimental study on axial compressive strength and elastic modulus of the clay and fly ash brick masonry. J. Civ. Eng. Construct. Technol. 2013, 4, 134–141. [Google Scholar]
  18. Pavía, S.; Hanley, R. Flexural bond strength of natural hydraulic lime mortar and clay brick. Mater. Struct. 2010, 43, 913–922. [Google Scholar] [CrossRef]
  19. Khalaf, F.M. New test for determination of masonry tensile bond strength. J. Mater. Civ. Eng. 2005, 17, 725–732. [Google Scholar] [CrossRef]
  20. Hetherington, S. A comparative study into the tensile bond strength of the brick mortar interface of Naturally Hydraulic lime and Portland cement mortars. Masonry Int. 2015, 28, 37–43. [Google Scholar]
  21. Asteris, G.P.; Plevris, V. Anisotropic masonry failure criterion using artificial neural networks. Neural Comput. Appl. 2017, 28, 2207–2229. [Google Scholar] [CrossRef]
  22. Asteris, P.; Roussis, P.; Douvika, M. Feed-forward neural network prediction of the mechanical properties of sandcrete materials. Sensors 2017, 17, 1344. [Google Scholar] [CrossRef] [PubMed]
  23. Asteris, P.G.; Nozhati, S.; Nikoo, M.; Cavaleri, L.; Nikoo, M. Krill herd algorithm-based neural network in structural seismic reliability evaluation. Mech. Adv. Mater. Struct. 2018, 1–8. [Google Scholar] [CrossRef]
  24. Plevris, V.; Asteris, P.G. Modeling of masonry failure surface under biaxial compressive stress using Neural Networks. Constr. Build. Mater. 2014, 55, 447–461. [Google Scholar] [CrossRef]
  25. Asteris, P.; Kolovos, K.G.; Douvika, M.G.; Roinos, K. Prediction of self-compacting concrete strength using artificial neural networks. Eur. J. Environ. Civ. Eng. 2016, 20, s102–s122. [Google Scholar] [CrossRef]
  26. Asteris, P.G.; Tsaris, A.K.; Cavaleri, L.; Repapis, C.C.; Papalou, A.; Di Trapani, F.; Karypidis, D.F. Prediction of the fundamental period of infilled RC frame structures using artificial neural networks. Comput. Intell. Neurosci. 2016, 2016, 20. [Google Scholar] [CrossRef]
  27. Garzón-Roca, J.; Adam, J.M.; Sandoval, C.; Roca, P. Estimation of the axial behaviour of masonry walls based on artificial neural networks. Comput. Struct. 2013, 125, 145–152. [Google Scholar] [CrossRef]
  28. Thaickavil, N.N.; Thomas, J. Behaviour and strength assessment of masonry prisms. Case Stud. Construct. Mater. 2018, 8, 23–38. [Google Scholar] [CrossRef]
  29. Garzón-Roca, J.; Marco, C.O.; Adam, J.M. Compressive strength of masonry made of clay bricks and cement mortar: Estimation based on neural networks and fuzzy logic. Eng. Struct. 2013, 48, 21–27. [Google Scholar] [CrossRef]
  30. Goetzke-Pala, A.; Hoła, A.; Sadowski, Ł. A non-destructive method of the evaluation of the moisture in saline brick walls using artificial neural networks. Arch. Civ. Mech. Eng. 2018, 18, 1729–1742. [Google Scholar] [CrossRef]
  31. Orosz, M.; Csanaky, J. Estimating the thermal bridge at wall corners with artificial neural network. Acta Tech. Jaurinensis 2015, 8, 230–239. [Google Scholar] [CrossRef]
  32. Seif ElDin, H.M.; Aly, N.; Galal, K. In-plane shear strength equation for fully grouted reinforced masonry shear walls. Eng. Struct. 2019, 190, 319–332. [Google Scholar] [CrossRef]
  33. Tijskens, A.; Roels, S.; Janssen, H. Neural networks for meta modelling the hygrothermal behaviour of building components. Build. Environ. 2019, 162, 106282. [Google Scholar] [CrossRef]
  34. Constructor. Civil Engineering Home. Types of Bonds in Brick Masonry Wall Construction. 2016. Available online: https://theconstructor.org/building/types-bonds-brick-masonry-flemish-english-wall/11616/ (accessed on 18 May 2016).
  35. BSI. Methods of Test for Masonry Units Part 11: Determination of Water Absorption of Aggregate Concrete, Auto Claved Aerated Concrete, Manufactured Stone and Natural Stone Masonry Units Due to Capillary Action and the Initial Rate of Water Absorption of Clay Masonry Units; BS EN.772-11: 2011; British Standards Institution: London, UK, 2011. [Google Scholar]
  36. BSI. Methods of Test for Mortar for Masonry–Part 3: Determination of Consistence of Fresh Mortar (by Flow Table); BS EN 1015-3:1999; British Standards Institution: London, UK, 1999. [Google Scholar]
  37. BSI. Methods of Test for Mortar for Masonry—Part 11: Determination of Flexural and Compressive Strength of Hardened Mortar; BS EN 1015-11:1999; British Standards Institution: London, UK, 1999. [Google Scholar]
  38. AS. Masonry Structures; Australia Standards: Sydney, Australia, 2001. [Google Scholar]
  39. ASTM. C 1072-00a, Standard Test Method for Measurement of Masonry Flexural Bond Strength; ASTM International: Pennsylvania, PA, USA, 2000. [Google Scholar]
  40. BSI. Methods of Test for Masonry—Part 5: Determination of Bond Strength by the Bond Wrench Method; BS EN 1052-5:2005; British Standards Institution: London, UK, 2005. [Google Scholar]
  41. ASTM. C 1531-03-Standard Test Methods for In Situ Measurement of Masonry Mortar Joint Shear Strength Index; ASTM International: Pennsylvania, PA, USA, 2003. [Google Scholar]
  42. Rilem, M.B. Determination of shear strength index for masonry unit/mortar junction. Mater. Struct. 1996, 29, 459–475. [Google Scholar]
  43. Lumantarna, R.; Biggs, D.T.; Ingham, J.M. Compressive, flexural bond, and shear bond strengths of in situ New Zealand unreinforced clay brick masonry constructed using lime mortar between the 1880s and 1940s. J. Mater. Civ. Eng. 2012, 26, 559–566. [Google Scholar] [CrossRef]
  44. Siddique, R.; Aggarwal, P.; Aggarwal, Y. Prediction of compressive strength of self-compacting concrete containing bottom ash using artificial neural networks. Adv. Eng. Softw. 2011, 42, 780–786. [Google Scholar] [CrossRef]
  45. Mansoor, J.; Shah, S.; Khan, M.; Sadiq, A.; Anwar, M.; Siddiq, M.; Ahmad, H. Analysis of Mechanical Properties of Self Compacted Concrete by Partial Replacement of Cement with Industrial Wastes under Elevated Temperature. Appl. Sci. 2018, 8, 364. [Google Scholar] [CrossRef]
  46. Zhou, Q.; Wang, F.; Zhu, F. Estimation of compressive strength of hollow concrete masonry prisms using artificial neural networks and adaptive neuro-fuzzy inference systems. Construct. Build. Mater. 2016, 125, 417–426. [Google Scholar] [CrossRef]
Figure 1. Types of masonry bonds [1,34]: (a) English bond; (b) Flemish bond; (c) header bond; (d) Dutch bond; (e) silver-lock bond. Note: Changes in colour do not represent any change in brick type and are only to distinguish between bond figures.
Applsci 09 04313 g001
Figure 2. Wrench test assembly.
Applsci 09 04313 g002
Figure 3. Triple shear test mechanism.
Applsci 09 04313 g003
Figure 4. Test mechanism for brick masonry: (a) compressive strength; (b) flexural strength.
Applsci 09 04313 g004
Figure 5. Basic artificial neural network (ANN) structure.
Applsci 09 04313 g005
Figure 6. Compressive strength for the (a) English bond; (b) Flemish bond; (c) header bond; (d) Dutch bond; and (e) silver-lock bond.
Applsci 09 04313 g006
Figure 7. Compressive strength with reference to bond type and mortar ratio.
Applsci 09 04313 g007
Figure 8. Flexural strength for (a) English bond; (b) Flemish bond; (c) header bond; (d) Dutch bond; and (e) silver-lock bond.
Applsci 09 04313 g008aApplsci 09 04313 g008b
Figure 9. Flexural strength with reference to bond type and mortar ratio.
Applsci 09 04313 g009
Figure 10. Artificial neural network structure for brick bond strength estimation.
Applsci 09 04313 g010
Figure 11. Training and validation plots for (a) compressive strength and (b) flexural strength.
Applsci 09 04313 g011
Figure 12. Prediction profiles for compressive and flexural strength with respect to factors.
Applsci 09 04313 g012
Figure 13. Interaction profile ranges for compressive strength with respect to factors.
Applsci 09 04313 g013
Figure 14. Interaction profile ranges for flexural strength with respect to factors.
Applsci 09 04313 g014
Table 1. Basic properties of the bricks used.
PropertyStandardValue
Compressive Strength (MPa)ASTM C6711.6
Water Absorption (%)17.5%
Flexural Strength (MPa)1.8
ASTM: American Society for Testing and Materials (Standard Followed).
Table 2. Basic properties of mortar.
PropertyType of Mortar/Ratio
Proportion (cement/sand) by weight 1:3, 1:4, 1:6, 1:8
Initial flow (mm)150, 150, 150, 150
Compressive strength (MPa) 18, 17.2, 16.6, 16
Table 3. Prism brick masonry bond strength.
Mortar RatioLoad (N)Contact Area (mm2)Compressive Strength (MPa)
1:31047617,4200.577
1:48899.417,4200.516
1:6878217,4200.501
1:87568.517,4200.434
Table 4. Brick masonry bond strength.
Mortar RatioP (N)L (mm)L1 (mm)P1 (N)Fg (MPa)
1:3150.9220363.50.2470.0685
1:4116.1220363.50.2470.0618
1:6107.820363.50.2470.0489
1:878.420363.50.2470.035
Table 5. Brick masonry triplet shear strength.
RatioLoad (N)Contact Area (mm2)Bond Shear Strength (MPa)
1:311,00052,2580.21
1:4900052,2580.17
1:6750052,2580.14
1:8500052,2580.095
Table 6. Compression strength (MPa) of different brick masonry bonds.
Brick Bond/Mortar RatioCompressive Strength (MPa)
1:31:41:61:8
English bond0.7860.5990.5170.492
Flemish bond0.5380.5280.5170.507
Header bond0.6830.5280.5230.518
Dutch bond0.6520.5170.5070.476
Silver-lock bond0.5170.4710.4450.424
Table 7. Flexural strength (MPa) of different brick masonry bonds.
Brick Bond/Mortar RatioFlexural Strength (MPa)
1:31:41:61:8
English bond0.3520.0820.0780.0724
Flemish bond0.1760.0930.0910.0828
Header bond0.1550.0828<0.005<0.005
Dutch bond0.0760.05170.04190.0362
Silver-lock bond0.0310.01550.0103<0.005
Table 8. Description of variables for brick bond strength estimation.
VariableDescriptionMeanSDMinMax
CSCompressive strength (MPa)0.53730.09320.4150.7969
FSFlexural strength (MPa)0.07640.079700.3595
ROMortar mix ratio (1–1:3, 2–1:4, 3–1:6, 1–1:8)--14
BTBond type (1: English; 2: Flemish; 3: header; 4: Dutch; 5: silver)--15
WTWater (L)2.11840.54871.1523.231
CTCement (Kg)4.1681.4491.927.18
SDSand (Kg)19.5193.37212.9325.52
W/BWater/binder ratio0.5250.056370.450.6
C/SCement/sand ratio0.21880.08070.1250.3333
W/SWater/sand ratio0.110420.029340.0750.15
Note: SD: standard deviation; Min: minimum; Max: maximum.
Table 9. Parameter estimates for artificial neural network (ANN) model.
Hidden LayerInput Layer
ROBTWTCTSDW/BC/SW/SIntercept
Node.11.1194380.9176960.847112−1.89394−13.49080.9310489.86406149.80315−129.322
Node.20.213831−0.26982−0.41637−0.740983.621221.50400421.65496−10.235626.70857
Node.30.3127750.3831610.162746−0.053810.13549111.99971−18.325560.20646−7.13486
Node.4−0.009440.072808−1.54386−0.844438.723323−10.89650.897476−1.1919177.70851
Node.5−0.17237−0.372290.566364−1.064377.19747410.92726−9.6987830.9601655.7529
Node.61.2476160.5729480.72043−0.58762.991934−18.2851−13.8395−7.8564836.09561
Node.7−1.24127−0.3231−1.0167−0.19620.8834340.556477−2.52614−11.399913.79037
Node.80.889906−1.0768−0.53730.033132−10.2503−13.0231−3.7330421.12806−83.0187
Output Node (C.S.)−0.23215−0.507440.6192370.1271340.1793120.1997910.086341−0.001640.778489
Note: C.S-Compressive Strength, RO-Ratio of Mortar, BT-Bond Type, WT-Water, CT-Cement, SD-Sand, W/B-Water/Binder, C/S- Cement/Sand ratio, W/S-Water/Sand ratio.
Table 10. Model parameter estimates for training and validation.
MeasuresTraining ValueValidation Value
Compressive Strength (MPa)
R20.75579540.755093
RMSE0.04597830.0445664
Mean abs dev0.03709280.0393228
Sum frequency4812
Flexural Strength (MPa)
R20.990540.9661535
RMSE0.00831360.008139
Mean abs dev0.00578550.0055983
Sum frequency4812

