Article

Determination of the Optimal State of Dough Fermentation in Bread Production by Using Optical Sensors and Deep Learning

1
Faculty of Production Engineering, University of Bremen, Badgasteiner Str. 1, 28359 Bremen, Germany
2
BIBA—Bremer Institut für Produktion und Logistik GmbH, University of Bremen, Hochschulring 20, 28359 Bremen, Germany
*
Author to whom correspondence should be addressed.
Appl. Sci. 2019, 9(20), 4266; https://doi.org/10.3390/app9204266
Submission received: 24 July 2019 / Revised: 30 September 2019 / Accepted: 8 October 2019 / Published: 11 October 2019
(This article belongs to the Special Issue Intelligent Processing on Image and Optical Information)

Abstract

:
Dough fermentation plays an essential role in the bread production process, and its success is critical to producing high-quality products. In Germany, the number of stores per bakery chain has increased within the last years as well as the trend to finish the bakery products local at the stores. There is an unsatisfied demand for skilled workers, which leads to an increasing number of untrained and inexperienced employees at the stores. This paper proposes a method for the automatic monitoring of the fermentation process based on optical techniques. By using a combination of machine learning and superellipsoid model fitting, we have developed an instance segmentation and parameter estimation method for dough objects that are positioned inside a fermentation chamber. In our method we measure the given topography at discrete points in time using a movable laser sensor system that is located at the back of the fermentation chamber. By applying the superellipsoid model fitting method, we estimated the volume of each object and achieved results with a deviation of approximately 10% on average. Thereby, the volume gradient is monitored continuously and represents the progress of the fermentation state. Exploratory tests show the reliability and the potential of our method, which is particularly suitable for local stores but also for high volume production in bakery plants.

1. Introduction

The bakery trade has experienced significant changes in recent years. While the amount of sales locations in Germany remained at a constant level, the diversity of bakeries decreased significantly [1]. That effect reflects a sharply increasing branch network structure of the whole industry, which is directly related to an increase of fermentation and baking at the sales location. Thereby, the bakeries compete directly with the fast food economy of McDonald’s and Burger King [2]. A bread manufacturing process of branch network structures roughly follows the steps that are illustrated in Figure 1, whereby the primary products are produced at a central production bakery and then transported to the branches.
In detail, the preparation of the dough represents the start of the bread manufacturing process chain, where the raw materials are mixed up and finished dough is divided into rations. In the next step, the shape of the desired product is given to each ration, followed by its cooling down to approximately −4 °C, which interrupts the fermentation. In that way, the dough is prepared for its cold storage and transportation inside of special refrigerated vans to the particular stores. This process is called proofing retardation [3]. In the branches, the fermentation process is initiated at defined conditions (e.g., discrete-time control of warmth and humidity) in special fermentation chambers. Usually, this process step ends after a defined time and the baking step follows, before the final product is produced. The proposed method is applied within the process step ‘fermentation’ and helps to achieve a higher process quality by using automation techniques.
Chemically, fermentation means the process of the production of carbon dioxide and ethyl alcohol by the transformation of assimilable carbohydrates and amino acids induced by the metabolism of yeast [4]. This process leads to a volume increase of the dough due to the development of gas cells. Figure 2 illustrates the expected volume development of fermenting dough schematically [5]. Herein, the area of optimal mellowness may be identified.
Typically, when the volume gradient approaches zero, the optimal fermenting state is reached, which has to be detected ideally by the staff. Traditionally, the staff evaluates the fermenting state of the dough and estimates the perfect time for ending the fermentation phase. That requires long experience, intuition, and time from the staff. However, today there is an unsatisfied demand for skilled workers, which has lead to an increasing number of untrained and inexperienced employees at the stores. The result is a fixed standard time for the dough, which can be easily programmed and helps to get operationalizable processes. Since the main component of the dough is flour and as its fermentation ability is based on the special cultivation and growing conditions of the grain, this component massively affects the fermentation process and leads consequently to sub-optimal product qualities. By assuming a normal distribution, nearly 15% of the sold products have not only sub-optimal product qualities in taste but are also too small.
Currently, a pre-derivation of the flour properties using effective analysis is not feasible. Additionally, changes in the uniform circulation of temperature or humidity caused by the volume increase of the doughs induce an unpredictable change of the process parameters. The detection and counteracting of these impingements are requirements for high quality. In summary, it is generally not possible to reach the optimal fermenting state only by controlling the time and complying with the machine parameters. Computer-vision based-systems have become increasingly reliant on the production and logistics sector and represent one of the core concepts of the industry 4.0. The usage of image processing and machine learning techniques in the food industry is a relatively new field and offers a vast potential to control processes that are traditionally based on human observation [6]. The following paper covers the detection and control of the temporal volume growth of pieces of dough out of three-dimensional point clouds. The motivation is to create a method that is not only capable of predicting the optimal fermenting state based on the volume gradient but can also serve as the basis for other systems that control a change in the volume of objects. An additional process parameter that is used in some fermentation chambers is the insertion of aerosol mist, which consists of water drops with a diameter of few micrometers. Using that technique, humidity of nearly 100% can be achieved without, unlike with the use of steam, the problem of condensation, which can lead to hygienic risk due to the growth of mold [7]. Our proposed system should be able to perform a proper measurement despite the aerosol, which is not possible for the human eye.
A patent application for the system for the automatic capturing of the fermentation chamber topology and the determination of the volume of dough pieces has been lodged [8].

2. State of the Art

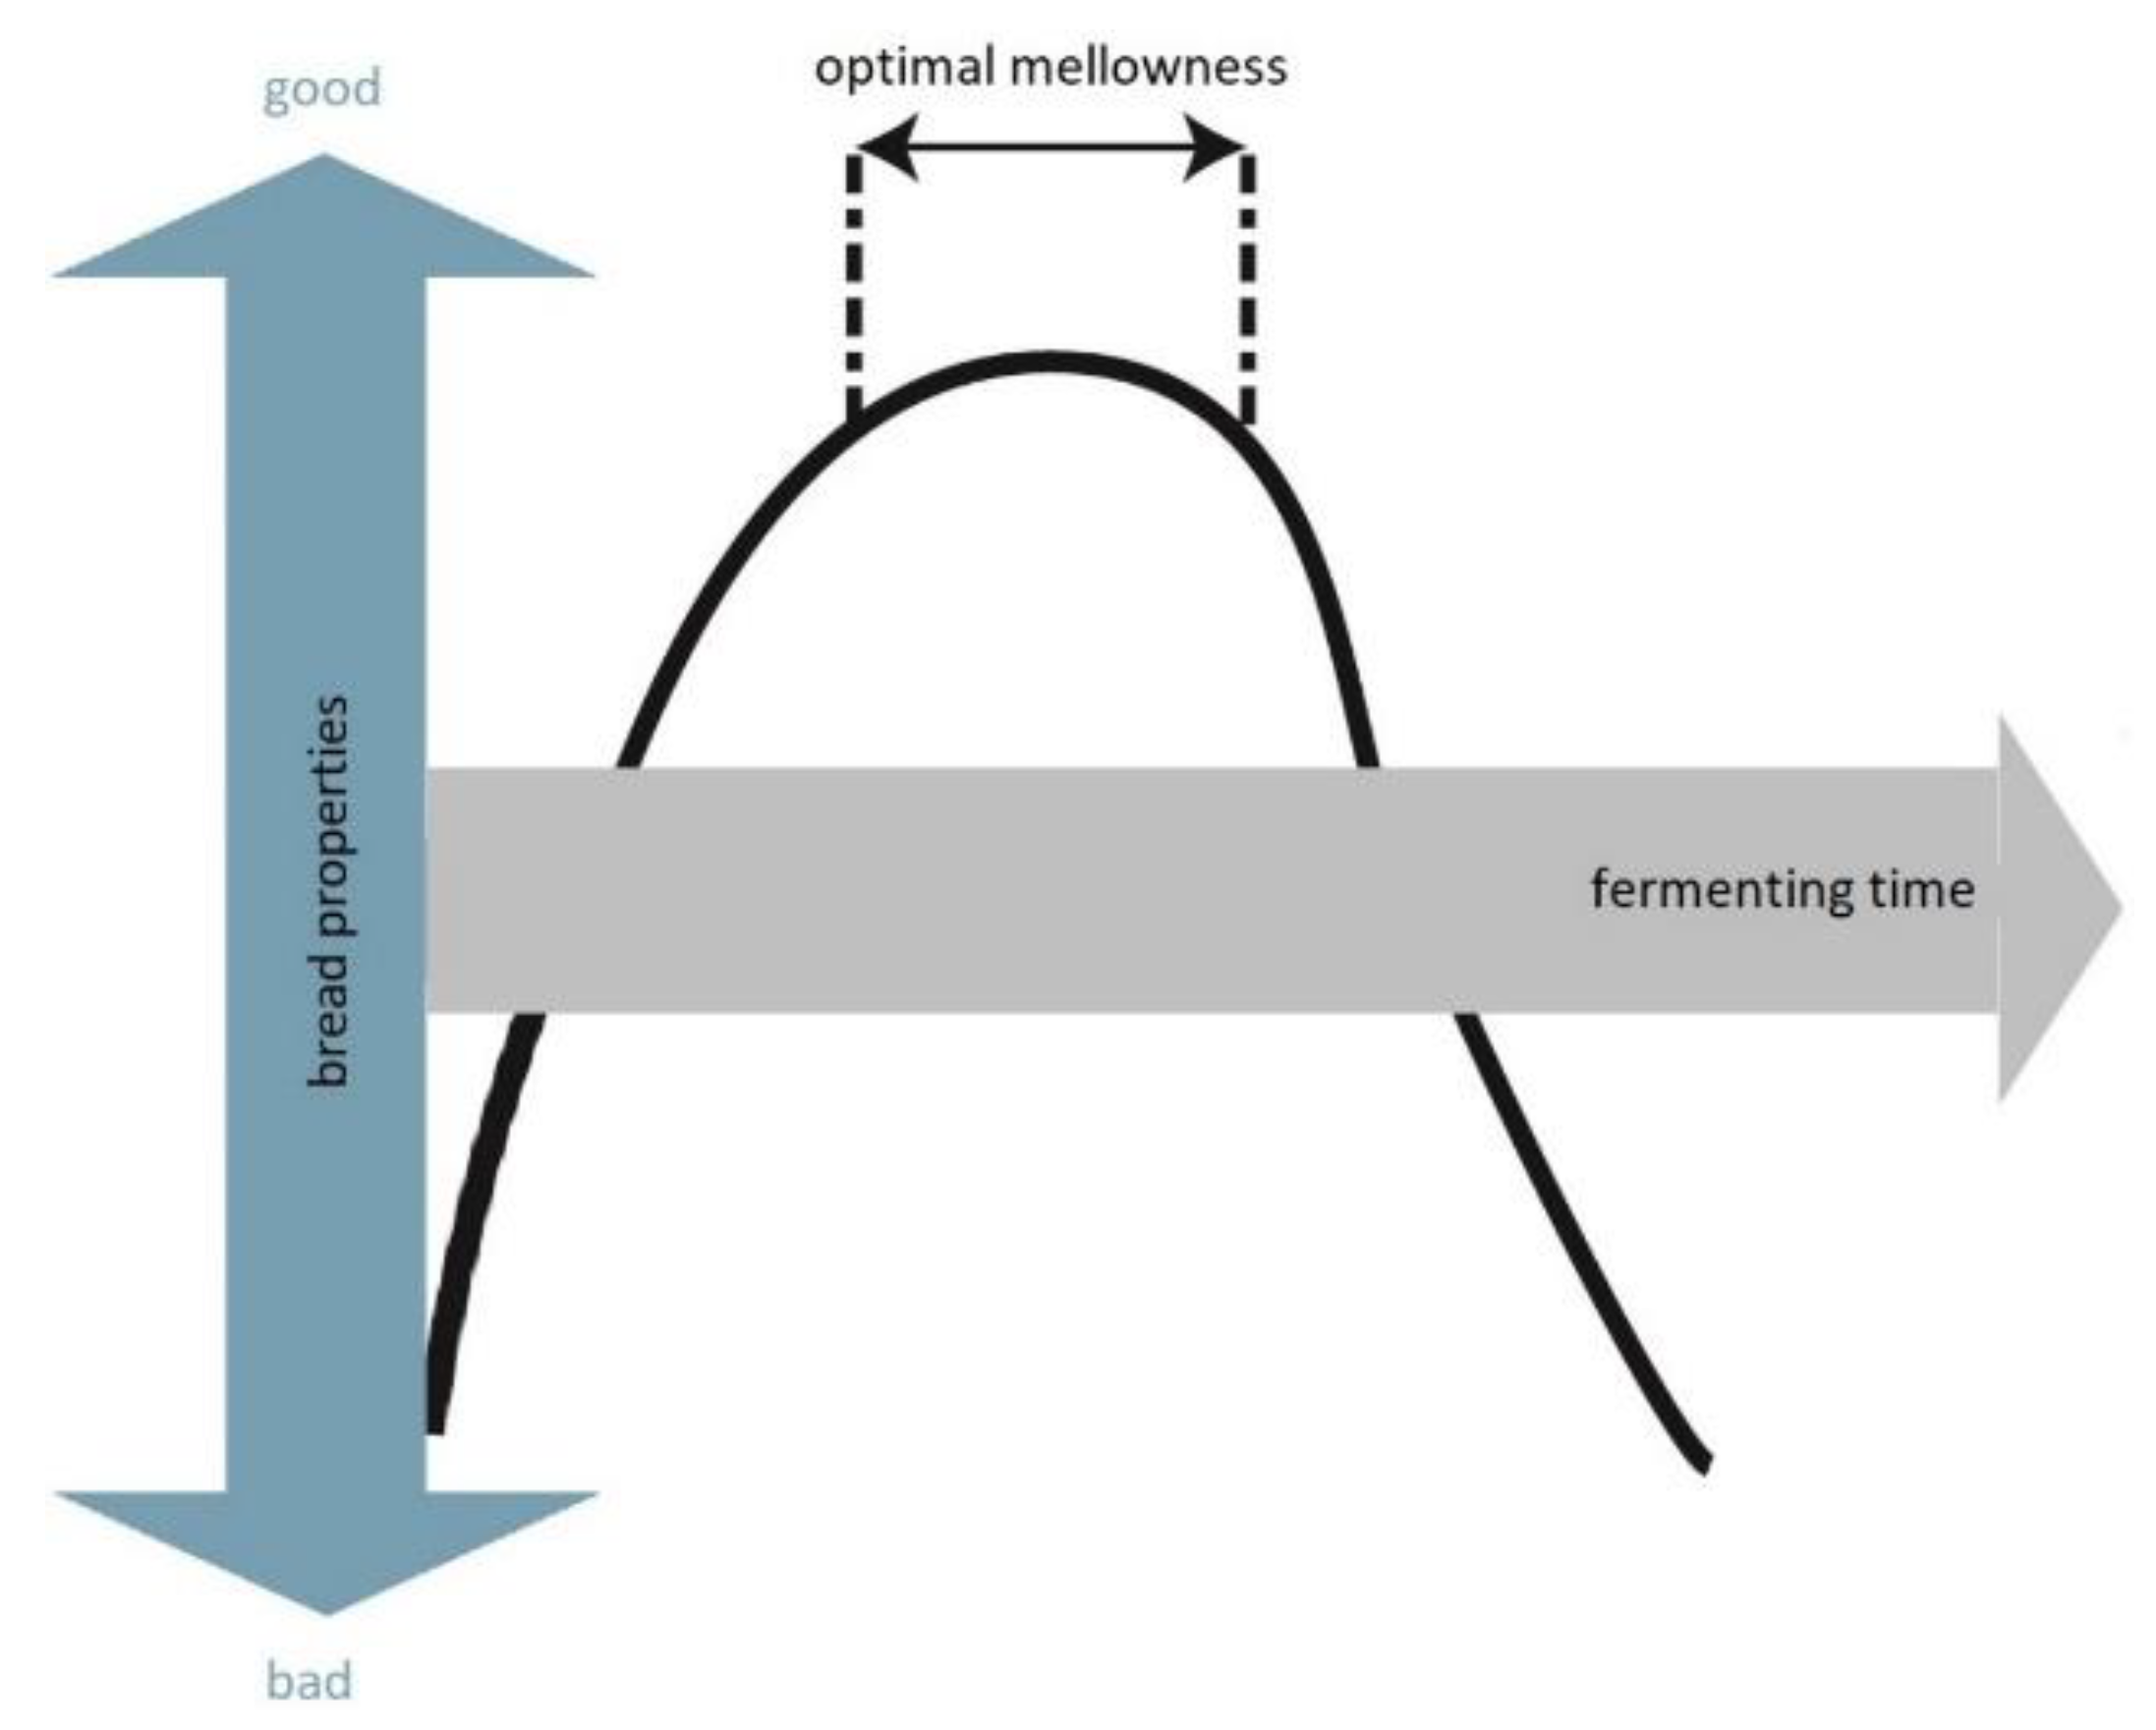
2.1. Fermentation Monitoring

Few studies deal with the topic of monitoring the fermentation state of dough pieces. Elmehdi et al. propose a non-destructive method for real-time information gaining of changes in the structure of dough during the fermentation using low-intensity ultrasonic waves [9]. Utilizing that, a correlation between the fermentation time and the ultrasonic velocity and attenuation can be observed. Increasing fermentation time leads to an increasing attenuation due to the density change of the dough, and hence leads to a decreasing speed of the ultrasonic waves. Skaf et al. describe a sensor that generates low-frequency acoustic waves through an oscillating piezoelectric element to validate the kinetics of bread dough during fermentation [10]. An emitter and a receiver are brought into contact with a piece of dough, and the attenuation of the emitted acoustic signal that changes due to the formation and growth of gas bubbles during the fermentation is measured. By means of that method, the influence of different process parameters such as temperature and humidity can be observed. Both of these proposed methods have the disadvantage of being restricted to only one dough sample at a time and hence being inappropriate for the control of a whole batch of fermenting bread without human supervision. Bajd et al. use magnetic resonance microscopy for the continuous control of dough fermentation and bread baking [11]. The proposed method delivers good results for the monitoring of dough pore distribution and dough volume regarding one dough piece but can theoretically be scaled up to more dough pieces at a time laying in one plane. A significant disadvantage is the complex measurement setup and the missing possibility for being used to upgrade existing fermentation chambers. Ivorra et al. propose an optical method of continuous fermentation state monitoring using a 3D vision system composed of a line laser and a camera and installed inside a fermentation chamber [4]. By means of this method, the height and transversal area of only one dough sample can be measured, and thus the fermentation state controlled. Pour-Damanab et al. use a digital imaging method to monitor the dynamic density of dough during fermentation [12]. The fermenting dough is taken out of the fermentation chamber to take a picture with a camera positioned orthogonal to the object. With that method, conclusions about the density by means of the calculated volume of the dough can be drawn. The technique is invasive and not practicable for multiple samples.
A restriction of all existing methods is the limitation to be only applicable in one plane. Standard fermentation chambers consist of multiple layers of metal sheets containing many dough pieces. The monitoring of one sample and even of one layer representatively is not sufficient because parameters like temperature and humidity can vary at different areas within the fermentation environment, leading to a different fermentation mellowness.

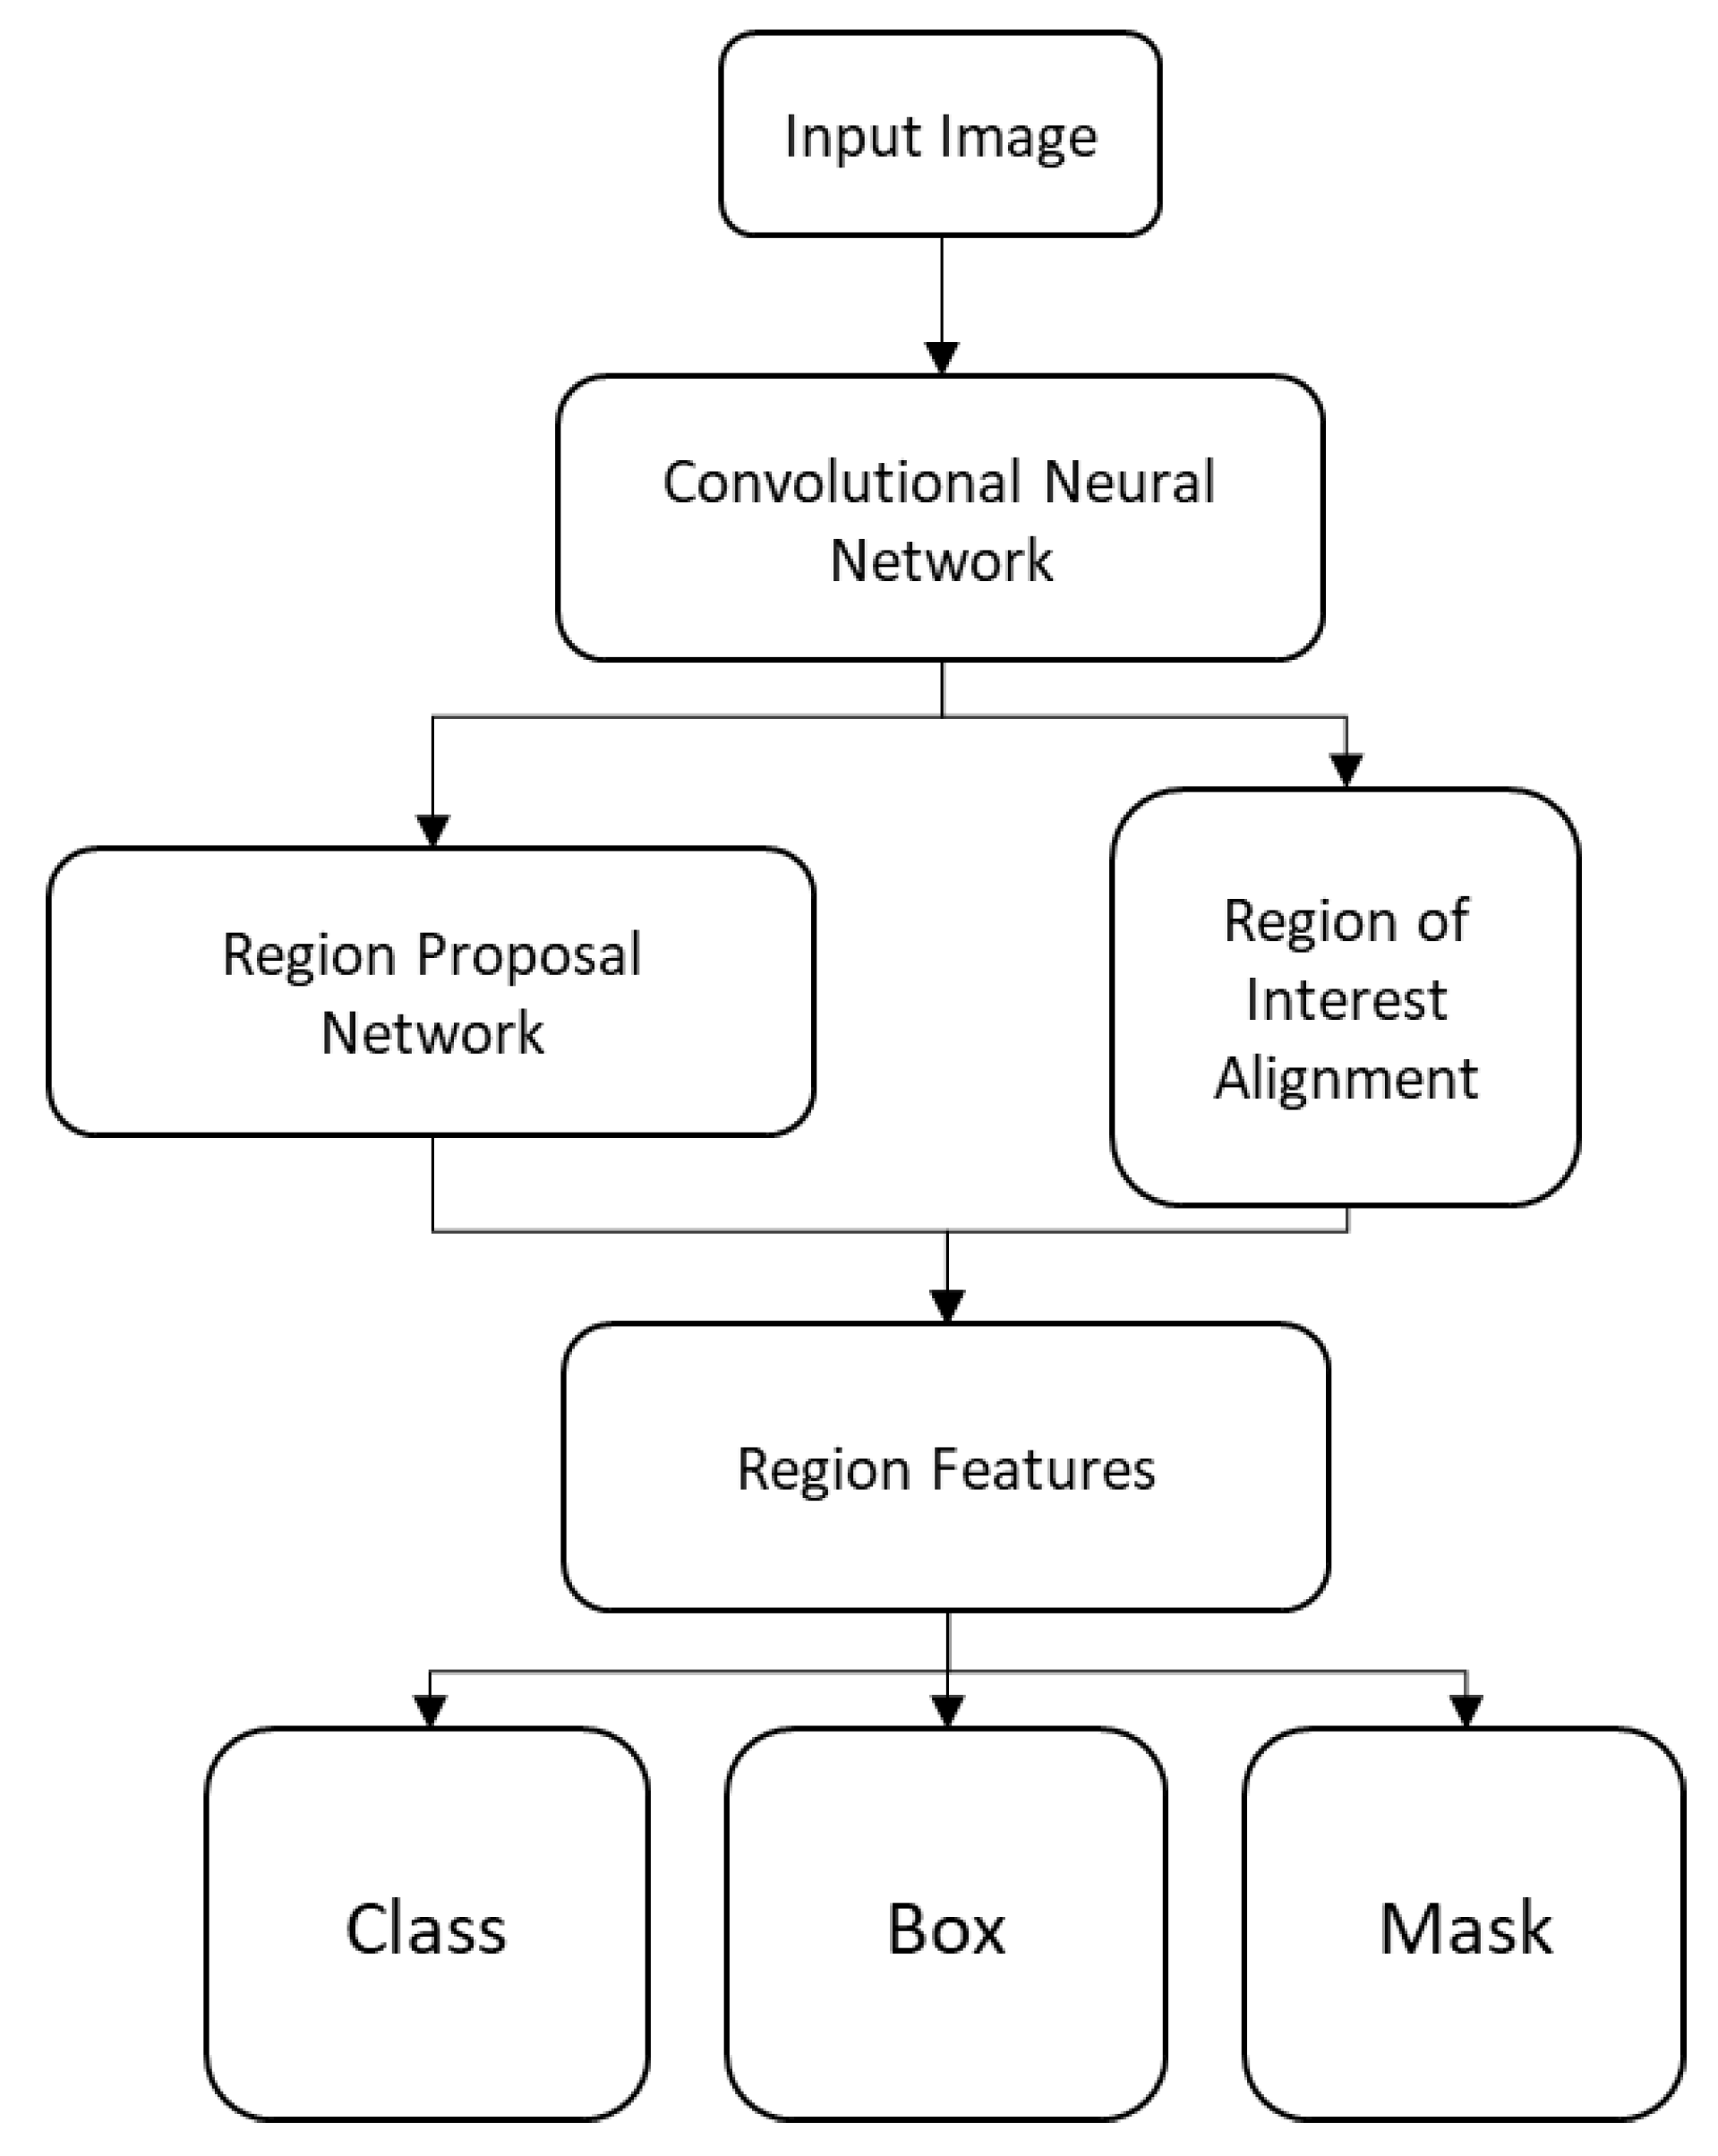
2.2. Robust Object Recognition

The approach used of monitoring multiple layers requires more robust object recognition techniques because the metal surfaces of the fermentation chambers. Several publications deal with object detection and recognition of three-dimensional point clouds. Scholz-Reiter and Thamer present a simulation platform for multi-view sensor fusion of synthetic time-of-flight (ToF) images to serve as the base for following object recognition tasks [13]. The sensor outputs are fused to one three-dimensional point cloud to obtain a suitable field of view. Qi et al. propose a novel structure of a neural network called PointNet, which allows a direct object recognition and segmentation of three-dimensional point clouds [14]. The generation of training data is very time-consuming because the ground-truth data has to be generated manually, which means that every point belonging to a particular object has to be marked as such. In comparison to the mentioned methods, we use an instance segmentation network Mask Region-based Convolutional Neural Network (Mask R-CNN), proposed by He et al. and originally developed for RGB-images [15]. To our knowledge, we are among the first who propose an approach of using this network structure for the instance segmentation of depth images for a tangible application.
Different kinds of shape representations have been developed for object recovery, such as the extruded generalized cylinder [16], the recognition-by-components based on so-called geons [17], or the representation by superquadrics [18,19]. Due to the flexibility and simplicity, superquadrics are currently used most frequently in computer graphics and computer vision. In Thamer and Scholz-Reiter, a method for the segmentation and object recognition of point clouds generated by laser scanners is proposed [20]. The segmentation is based on the local curvature using the surface normal. By fitting superquadrics to the segmented data, the type of the object is detected based on the shape. Vezzani et al. present a method for a superquadric fitting of objects to serve as a base for robot grasping applications and achieve promising results. We chose the approach of superquadric fitting to estimate the shape parameters and hence the volume of detected objects.

3. Materials and Methods

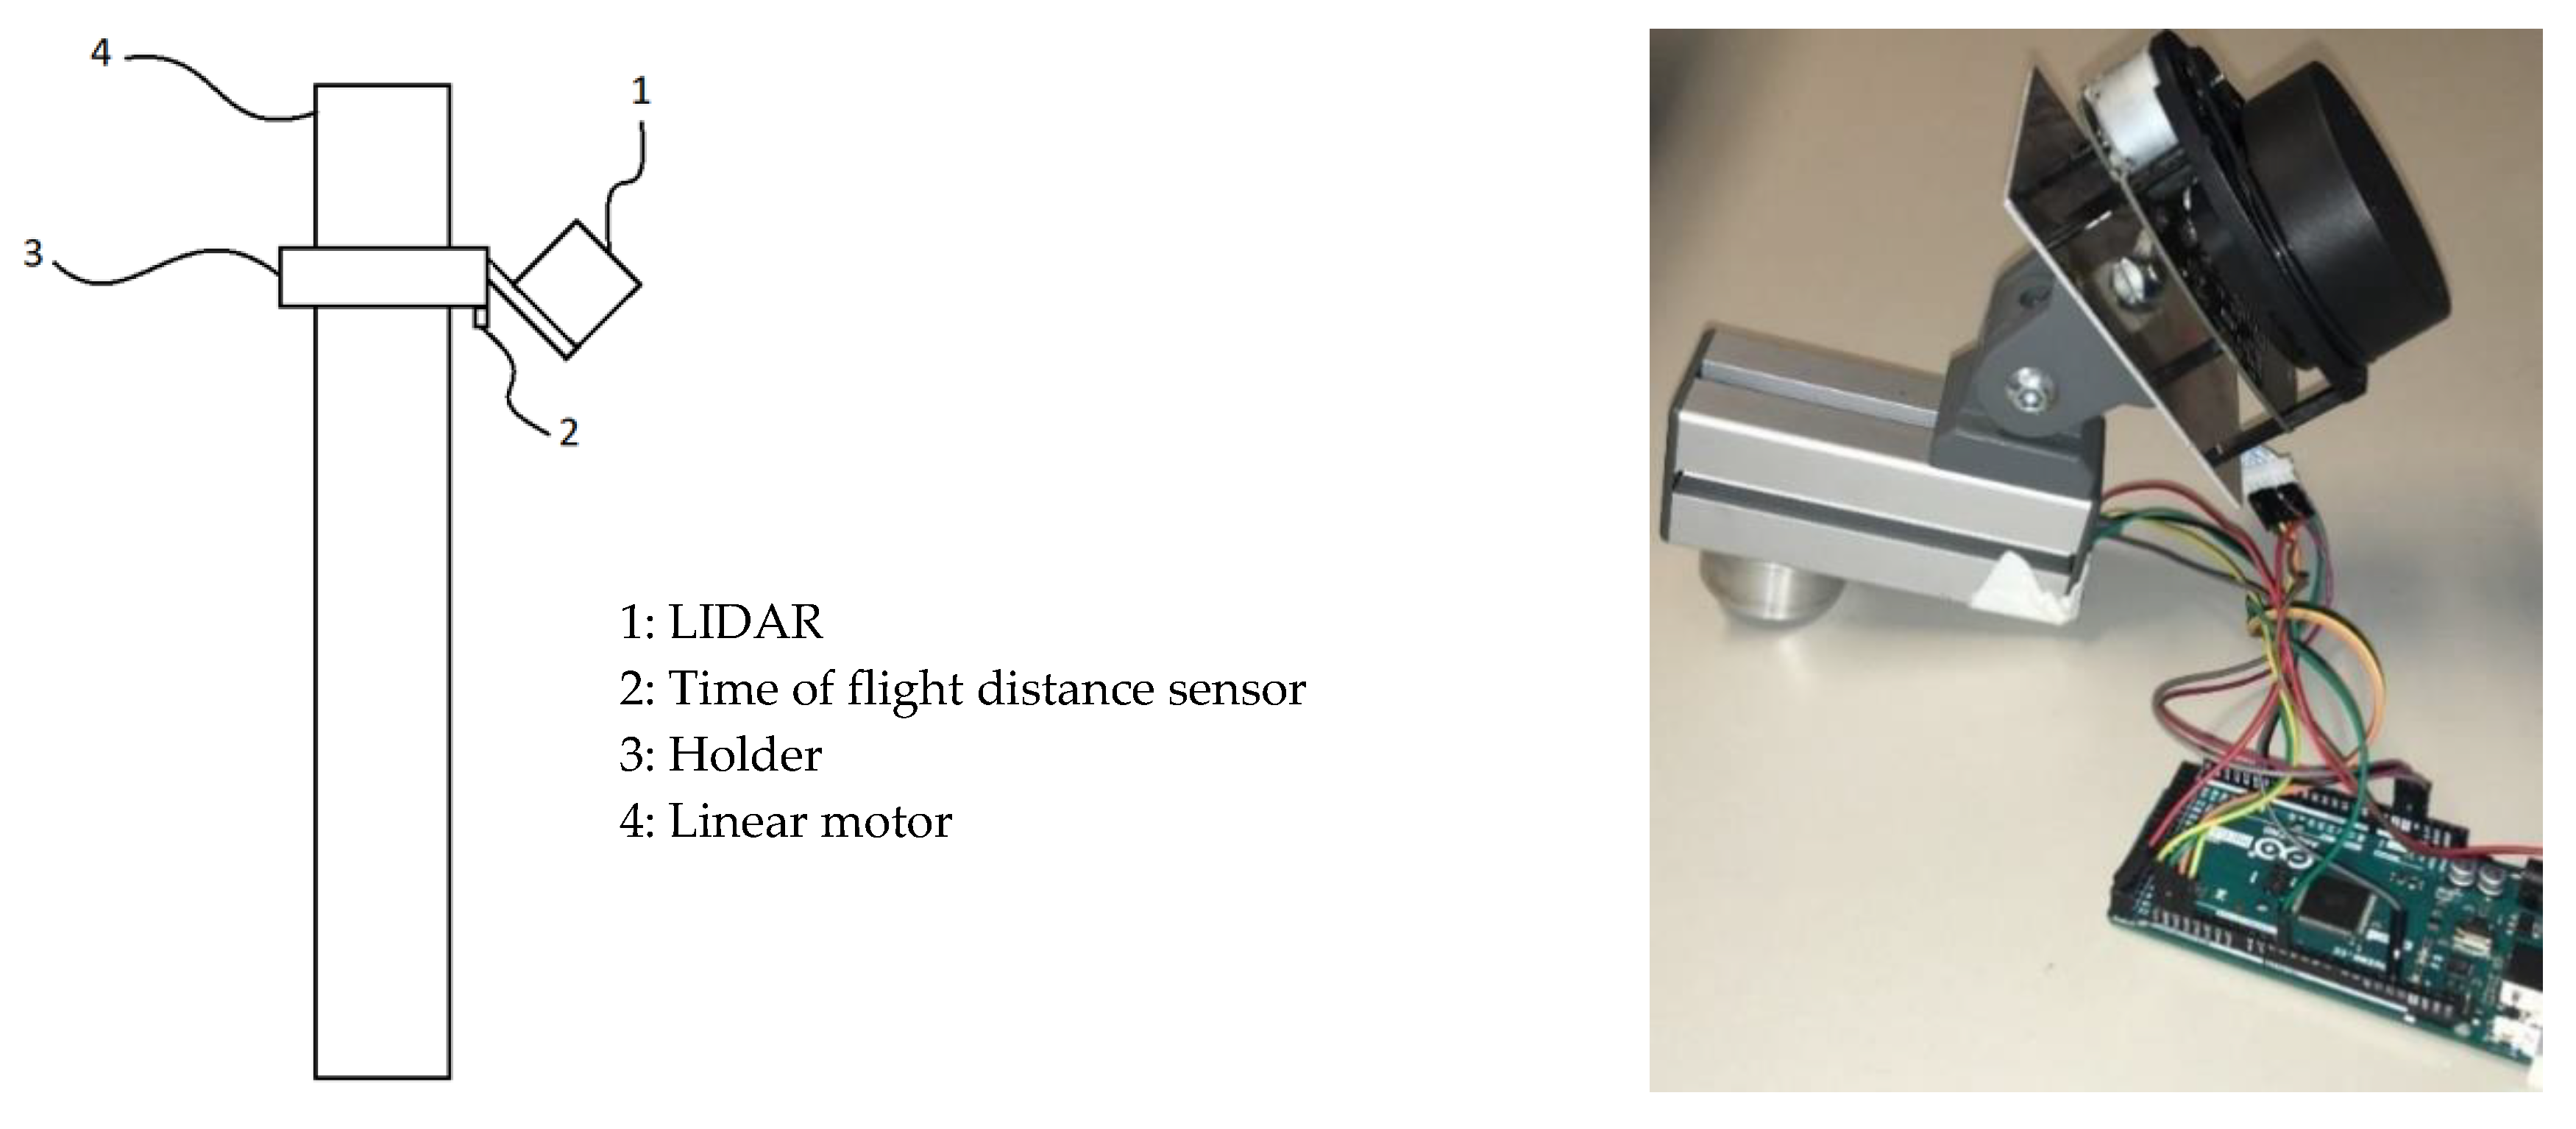
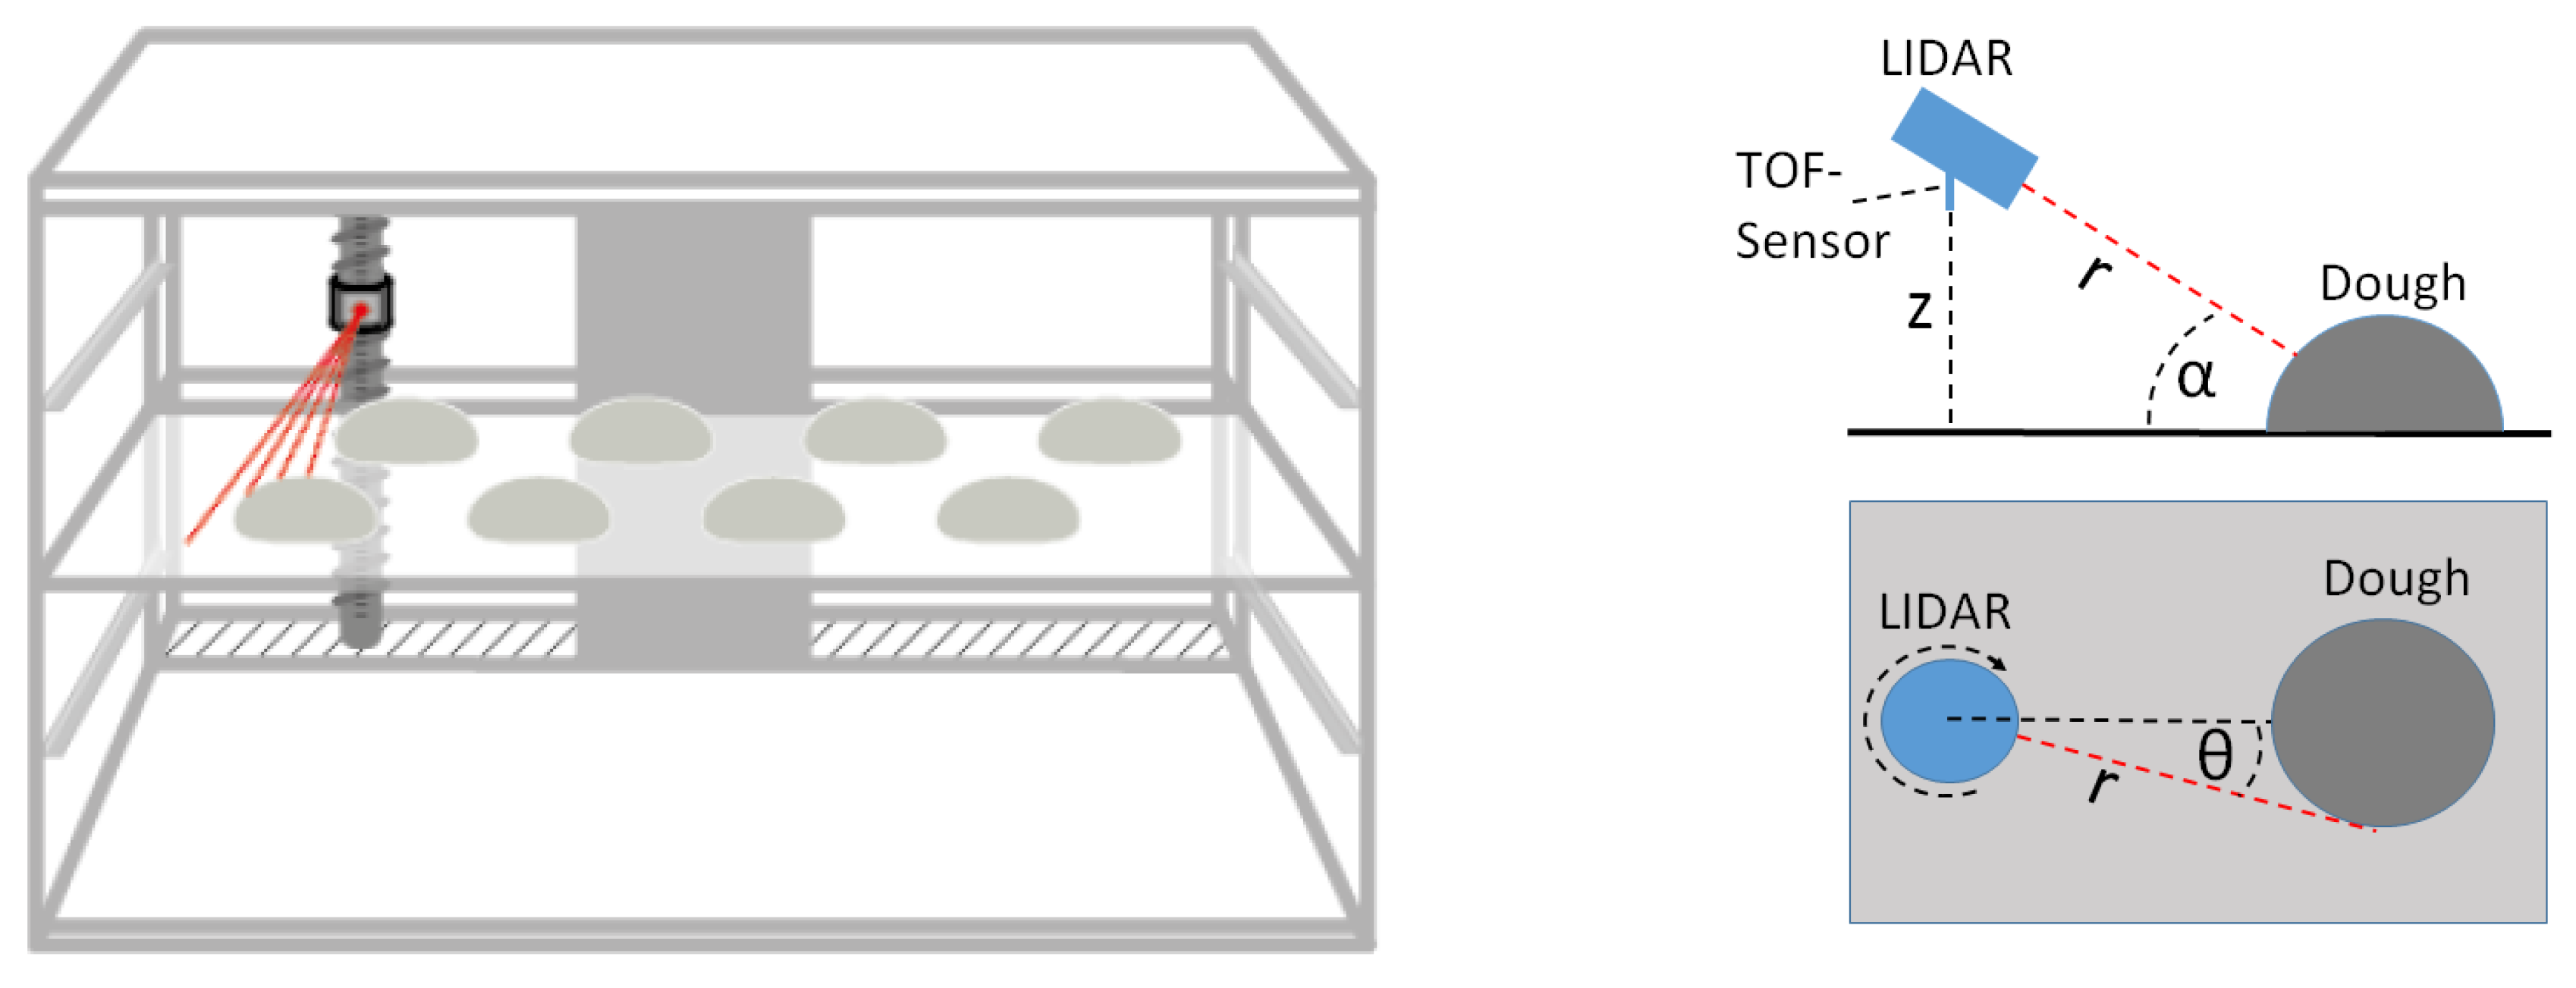
3.1. Dough Volume Monitoring

To create a topology of the inside of the fermentation chamber, we developed a three-dimensional measuring system consisting of a linear motor (Figure 3: Linear motor), a holder with adjustable angle around the x-axis (Figure 3: Holder), a two-dimensional light detection and ranging (LIDAR) scanner (RPLidar A1M8) (Figure 3: LIDAR), and a time of flight distance sensor (Adafruit VL53L0X) (Figure 3: Time of flight distance sensor) to extend the LIDAR data to the third dimension. The system needed to be as rigid as possible to obtain highly accurate measurements. We integrated the measurement system to the back of the chamber interior. Figure 3 illustrates the system schematically on the left and shows the real module on the right side.
The two sensor outputs were fused by means of an Arduino microcontroller to create a single data stream containing the X, Y, and Z-coordinate of a measurement point. Therefore, the polar coordinates that are generated by the LIDAR and represented by the particular angle θ and the corresponding distance r are transformed into Cartesian coordinates by means of the transformation:
x = r c o s ( θ )
y = r s i n ( θ )
The distance sensor directing vertically to the bottom of the fermentation chamber returns measurements of the current height of the measurement sensor system. By moving the system along the Z-axis, a complete topology of one row of the observed situation is captured and serves as the basis for further image processing that detects and investigates the volume of each dough piece. The tilting of the LIDAR scanner by the angle α enables the possibility of monitoring multiple rows of dough pieces laying behind each other. In Figure 4, the general setup of the measurement system is illustrated. This represents the real setup of bread dough pieces within a typical fermentation setup on the left and the schematic overview of the measurement process on the right side.
In the example of one object (Figure 4 right), the measurement can be described as follows. Due to the known height of the sensor system z and the tilt angle α, the height of an object z d o u g h at a certain position can be calculated as equation 3 by using simple trigonometric relationships:
z d o u g h = z r × cos ( 90 ° α )
The motion of the linear motor in the Z-direction is performed automatically by means of a continuous loop moving between the maximal top and bottom positions with a step speed of 2 m m s to generate a sufficiently dense point cloud. In order to analyze the gradient of the volume development of the dough pieces, the topology of the fermentation chamber is measured continuously in five-minute steps. The underlying setup of the measurements in this paper generates point cloud files of approximately 6500 three-dimensional coordinate points in that way with an accuracy of 0.5-1% of the range, respectively 0.5 mm when measuring within 1.5 m, which is mostly the case in our setup. In comparison to the use of a camera, we are able to obtain depth information of the whole fermentation chamber interior, which allowed us to perform three-dimensional object recognition directly.

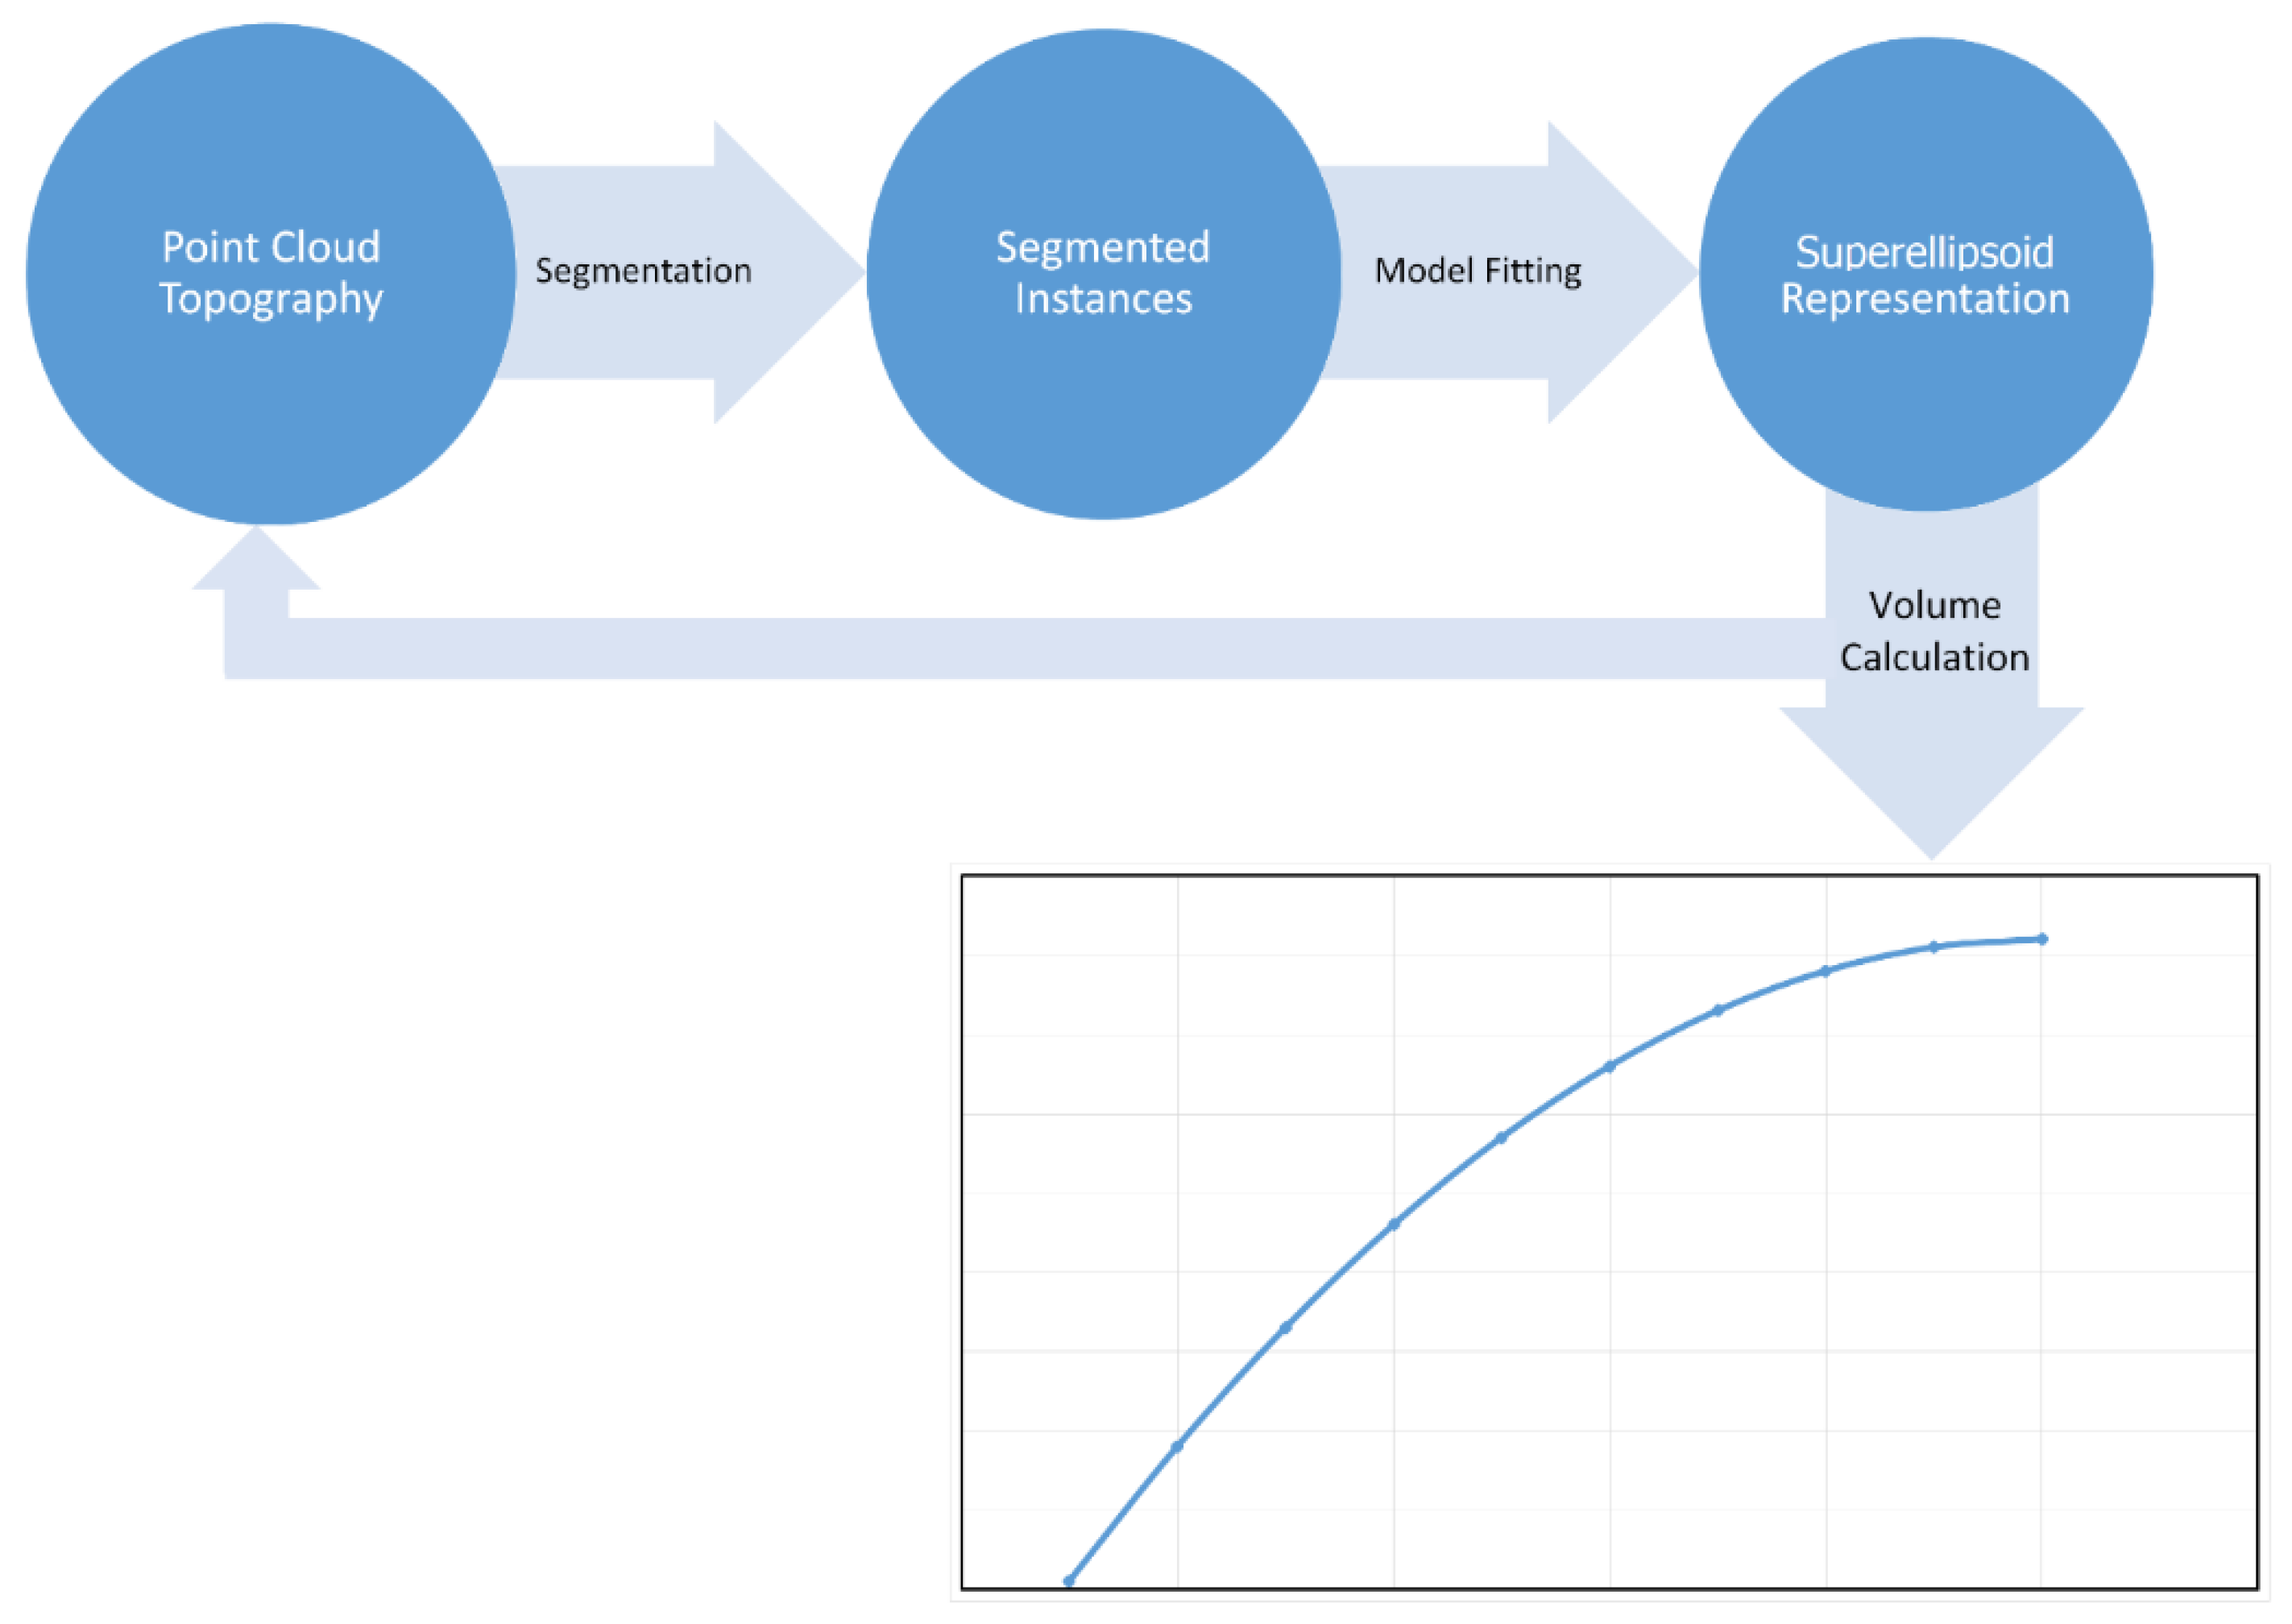
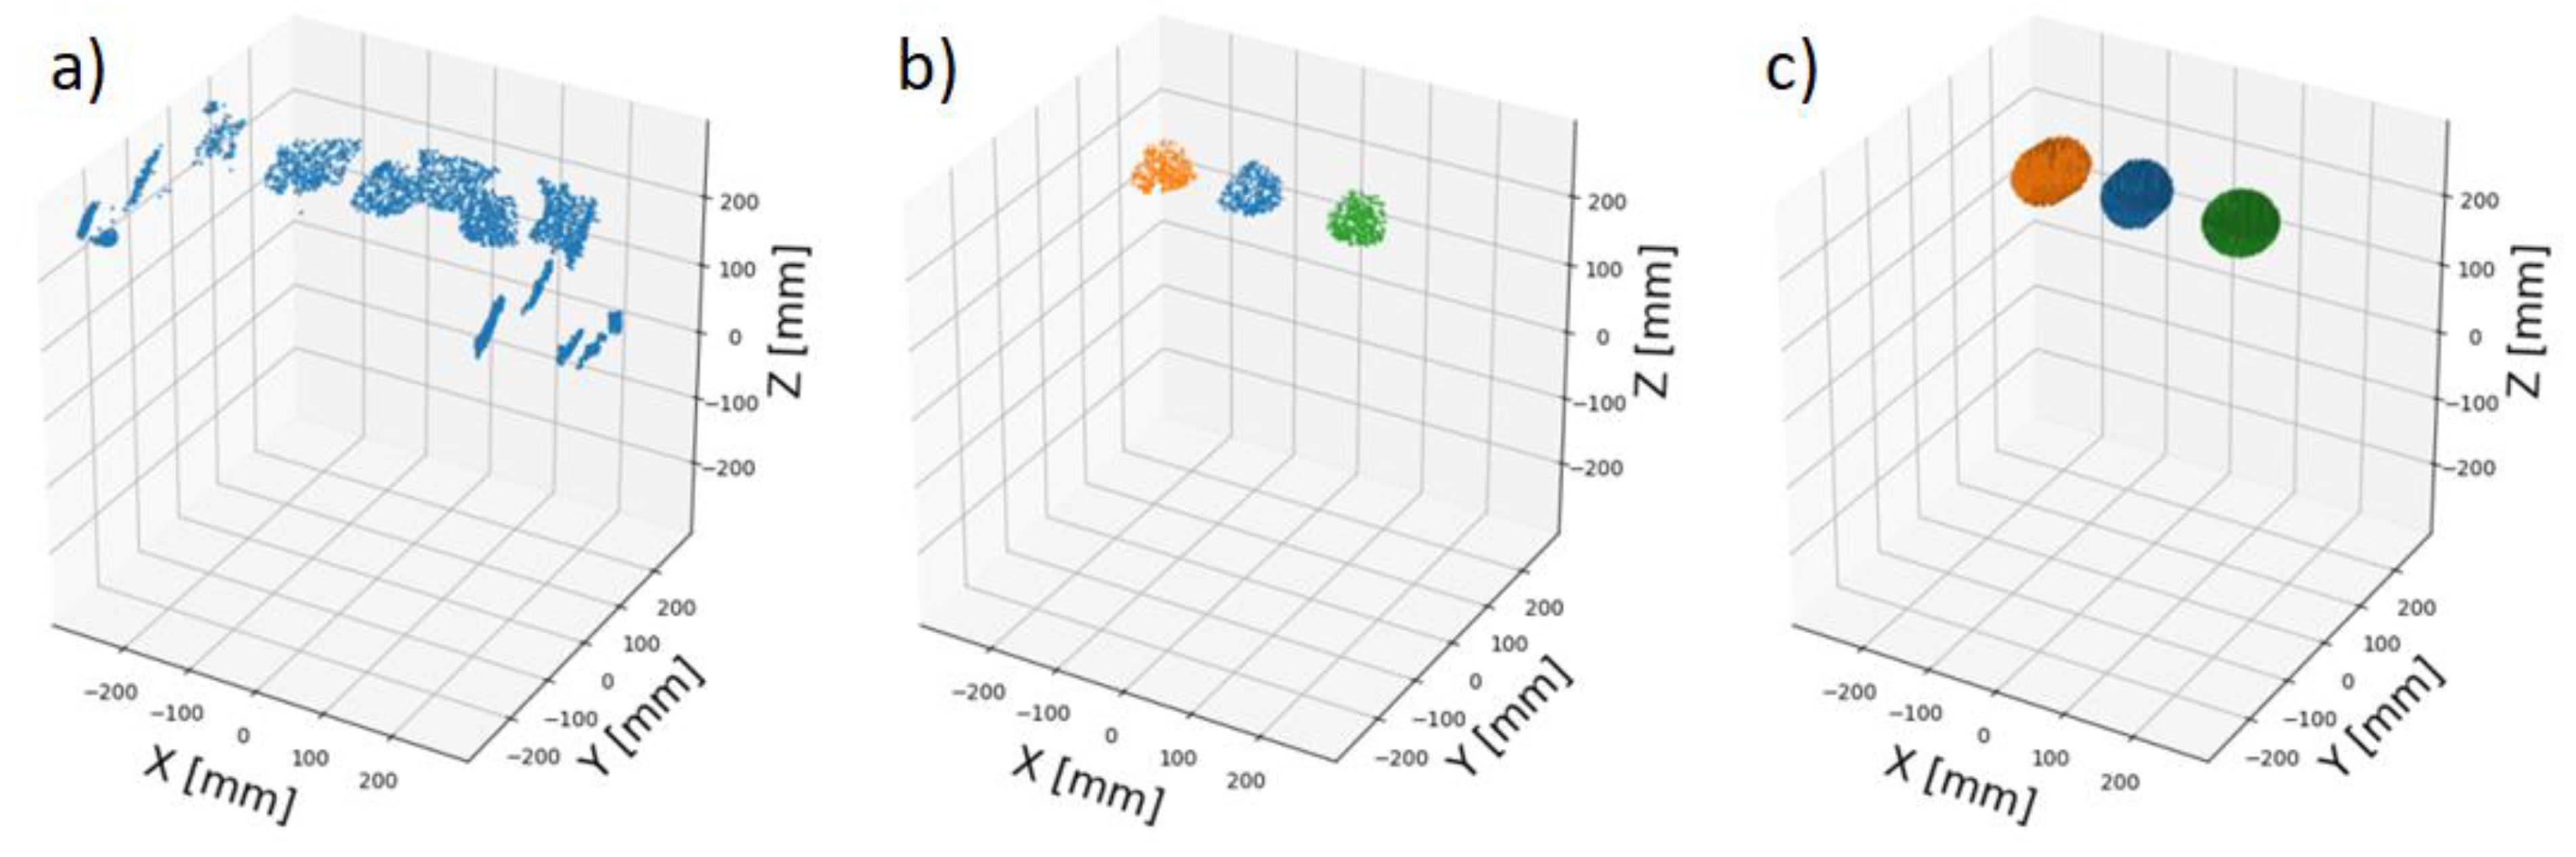
3.2. Data Processing

The information extraction of the measured topography of the setting is performed by executing the procedure illustrated in Figure 5. The difficulty is in obtaining a highly accurate segmentation with the number of outliers reduced to a minimum. Otherwise, false models are fitted to the segmented points leading to an inaccurate volume estimation.
Initially, the point cloud is segmented by means of a machine learning approach using a Mask Region-based convolutional neural network [15]. This neural network simultaneously performs the tasks of classification, bounding box regression, and mask estimation. The architecture of the Mask R-CNN is illustrated in Figure 6 in an abstracted form. For detailed information the reader is referred to [15].
Classification means the ability to recognize and understand different objects. In this paper, we use this function to predict if any bread dough is present in the current topography or not. The bounding box regression determines the rectangle that frames an object, in our case one piece of dough. By means of the estimated mask, the bounding of the particular object is precisely detected. To fit the neural network to our task, a training dataset containing example topographies that were generated during a real fermentation process was built-up and projected into depth maps by taking the x- and z-coordinates as the particular pixel positions and by normalizing the y-value to an 8-bit linear scale representing the depth. These depth maps were masked with an image annotation tool by defining the regions, and hence all pixels that contain bread. In that way, a dataset of 50 images with the corresponding ground-truth was generated. Due to the small amount of training data, the so-called ‘transfer learning method’ was applied [21]. Therefore, a weight file that was pre-trained on the huge COCO-dataset (Common Objects in Context dataset) containing 2.5 million labeled instances in 328.000 images was used [22]. With this status, the neural network was already able to recognize common image features. Afterward, the dataset was fed with training material for the bread instance segmentation. The output of the network was a set of images containing the particular segmented bread instances. The images were transformed back to a point cloud by converting the depth value back to the y-coordinate representation. The results of this process step are the segmented points belonging to a particular instance that can be used for the further processing steps.
After the segmentation, model fitting by means of superellipsoids is applied to achieve an implicit representation of the object that allows an analytical volume calculation. The surfaces of superellipsoids fulfill the equation
F ( X , Y , Z ) = ( ( X A ) 2 ε 2 + ( Y B ) 2 ε 2 ) ε 2 ε 1 + ( Z C ) 2 ε 1 = 1
where A, B and C define the axis-scaling and ε 1 and ε 2 the deformation parameters. By means of that equation a large amount of different bodies can be represented. To achieve a complete pose estimation, the translation and rotation by quaternions are added which leads to [23]:
[ x y z ] = R Q u a t [ X X 0 Y Y 0 Z Z 0 ] = [ a 2 + b 2 c 2 d 2 2 b c 2 a d 2 b d + 2 a c 2 a d + 2 b c a 2 b 2 + c 2 d 2 2 a b + 2 c d 2 a c + 2 b d 2 a b + 2 c d a 2 b 2 c 2 + d 2 ] [ X X 0 Y Y 0 Z Z 0 ]
The parameters a, b, c and d represent the quaternion components. In order to find the superellipsoid that fits best regarding a given point cloud, we minimize the objective function
m i n λ i = 1 n ( λ 1 λ 2 λ 3 ( F λ 4 ( p i , λ   ) 1 ) ) 2
where the set λ defines the parameters A, B, C, ε 1 , ε 2 , X 0 , Y 0 , Z 0 , a, b, c, d of the 12-dimensional optimization problem and p i with i = 1 , n a particular point of the point cloud. The factor λ 1 λ 2 λ 3 accelerates the convergence of the minimization algorithm by increasing the gradients around deep minima of the fitting function parameter space [19]. To achieve better numerical value stability, the fitting function is raised to the power of ε 1 as Whaite and Ferrie propose in [24]. In contrast to most of the other researches regarding superellisoid-, or the more general superquadric-model-fitting, where the Levenberg-Marquardt algorithm is used for solving the nonlinear optimization problem ([25,26,27]), we chose the interior point optimizer (IPOPT) software library. The underlying method applies a primal-dual interior-point algorithm with a filter line-search method and is specially designed for solving large-scale problems [28]. For a detailed explanation of the mathematical background, reference to the literature is provided.
On the basis of the model parameters determined, the volume of the particular superellipsoid is calculated using the equation:
V = 2 A B C ε 1 ε 2 β ( ε 1 2 + 1 , ε 1 ) β ( ε 2 2 , ε 2 2 )
where β ( x , y ) represents the beta-function defined by [29]:
β ( x , y ) = 2 0 π 2 s i n 2 x 1 ϕ c o s 2 y 1 ϕ d ϕ

3.3. Preparation of the Dough Pieces and Fermentation Process
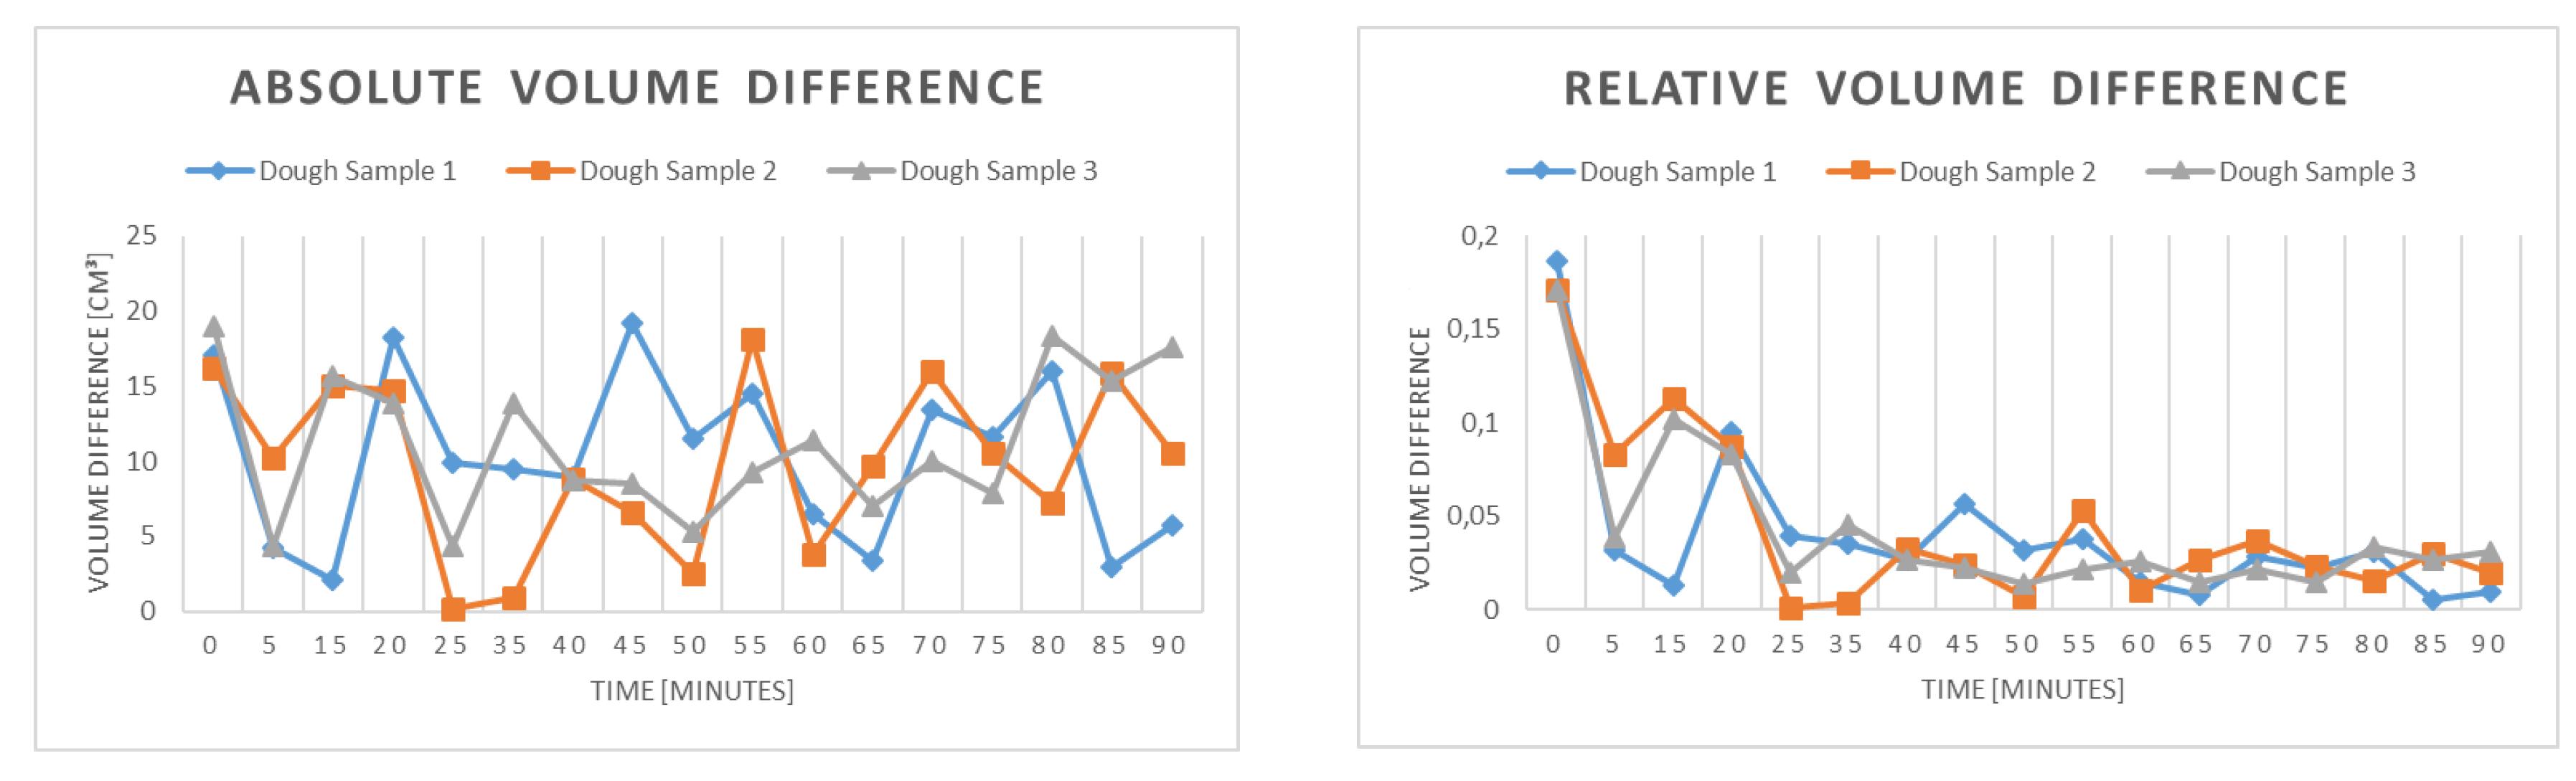
We produced standard pieces of dough made of wheat flour. It is of great importance in this process to produce equal pieces of dough with the same rheological properties. Accordingly, the dough production parameters have to be followed accurately. The following percentages of the particular ingredients were used for our recipe: 61% wheat flour Type 550, 34% water, 1.8% gold malt, 1.8% yeast, and 1.4% salt. Wheat flour Type 550 has a mineral content between 0.51% and 0.63% in dry mass and is well suited for fine-pored dough. All ingredients were combined and kneaded with a kneading machine (Diosna Dierks & Söhne GmbH Type SP24F/TEU) for two minutes at first and after a short break for an additional six minutes at room temperature. After kneading, the temperature of the dough was 24 °C, and it was left to rest for ten minutes. The dough was divided into equal dough pieces and set to the intermediate proofing for ten minutes before the final molding of the single dough pieces that were performed by using a dough press (Fortuna). Inside a fermentation chamber (MIWE GR) the temperature was set to 35 °C and the humidity to 95%, which are common process parameters to optimize the growth of the yeast species Saccharomyces cerevisiae [30].

4. Results

We evaluated the functionality of our proposed method firstly by means of an experimental setup consisting of a measurement chamber, a CNC (Computerized Numerical Control) positioning unit and a compressor nebulizer (Hangsun CN560) to simulate the real ambient conditions existing in real fermentation chambers. To obtain static measurement objects, we produced salt dough pieces, which were hardened and hence keep their shape during the whole measurement procedure. We measured the topology of the chamber interior containing different dough shapes for two minutes continuously, first without the addition of aerosol, and segmented the points belonging to a certain dough object by means of our instance segmentation neural network. Figure 7 shows the extracted dough surface measurements of two different dough shapes laid over images taken manually from the same perspective as from the sensor system. For better visualization, we reconstructed the surface structure by means of a subdivision surface modifier to obtain a denser mesh.
The illustration clarifies the limitations of our measurement system regarding the measurable surface part of the objects. Due to the surface curvature of the dough pieces, the reflections of the emitted light pulses outside of the red area do not reach the sensors receiving optics and hence do not generate a measurement point.
To analyze the impact of a present aerosol atmosphere, we measured dough objects with different shapes ones with and ones without induced aerosol. We again segmented the measured dough surfaces and apply a subdivision surface modifier whereby we increased the number of points with a factor of approximately 100. The resulting surface meshes allowed a superimposition to examine the deviations. Figure 8 shows the meshes of three different dough pieces.
It is observable that the aerosol particles do not have an impact on the quality of the measurement. Both measurements map a comparable surface area of the dough pieces without large deviations. By applying the iterative closest point algorithm of the point clouds generated with and the one without aerosol addition, we obtained a quality measure of the similarity. All point cloud pairs achieved a Euclidean fitness score smaller than one, which proves the high congruence of measurements with and without added aerosol. Due to measurement inaccuracies of our measurement system, a certain degree of variance is not avoidable. So-called Mie scattering does not occur because the wavelength of the used LIDAR is, with ~785 nm, much smaller than the aerosol particle size of around 10 µm [31]. The effect of optical scattering is not observable in the measurements, which could stem from the weak signal strength of the beams reflected from the particles.
In comparison to our proposed method, the existing monitoring methods using optical measurement techniques are not able to work properly under the influence of aerosol. For example, the method used in [12] would not be able to catch an image by a digital camera because the light of the object would not reach the camera sensor. The structured light technique described in [4] might be able to obtain some information due to the strength of the line laser but only when being used on a short distance.
After proving the suitability of our measurement system, we evaluated the quality of our model fitting algorithm to determine the volume of dough. Therefore, we performed ten measurements of our chamber interior with ten different hardened dough pieces, each a member of either the class round or long, and determine the real volume values by means of the water displacement method to obtain a reference value. We fit superellipsoidal models to the segmented dough surface parts and compared the accuracies to the determined reference values. Thereby, the rheological properties of dough have to be taken into consideration. The dough represents a non-Newtonian fluid and dough pieces, that are placed on a surface, show a flow behavior which results in a flat base area [32]. Measurements on the ten dough pieces prepared show that the relation between height and width of the minor-axis is approximately 0.5. Because the surface area that is measured by our measurement system does not contain information about that change of shape, our algorithm would fit a model of a whole superellipsoid to the points. Therefore, we multiplied the calculated volume with the factor 0.5 to obtain the final value. Table 1 represents the reference and the calculated volume values of the ten examined dough pieces and, additionally, the deviation between the two values. In Figure 9, we compare the statistical distributions of the volume deviations of the round and the long dough test pieces by means of boxplots.
One can observe the higher median volume deviation of the elongated dough pieces (12.2% for the long compared to 8.6% for the round dough pieces), although the interquartile and the absolute ranges are smaller. The reason for that is that the surface area, which is captured by our measurement system is not unambiguous and too small to allow proper and accurate modeling. The fact that the volume of long dough test pieces is always calculated lower than the reference values supports this assumption. Nevertheless, the volumes determined represent a good approximation for our purpose.
After verifying the applicability of our volume calculation algorithm, we initiated the fermentation of three dough pieces of round shape inside a fermentation chamber and captured the topology of the interior continuously for 90 min. We determined a time step of five minutes to be appropriate to create a topology that is dense enough for a proper segmentation and model-fitting. Each five minutes, the measured points are assigned to a new topology state cloud to reproduce the volume expansion. In Figure 10, the processing steps performed are illustrated.
Proper segmentation and plausible model-fitting of the points by means of superellipsoids could be seen. The metallic interior surface of the fermentation chamber does not disturb the measurement because the light scatters and bounces in uncontrollable directions. This fact improves the function of the segmentation neural network because of the more precise point cloud structure. The processing time results from the sum of the segmentation and the model fitting time. Currently, the former amounts to less than one second due to the use of an NVIDIA GeForce GTX 1060 GPU. The latter highly depends on the number of points that have to be taken into consideration during the minimization of the objective function. With the current configuration and a number of approximately 100 points per dough piece, a processing time of fewer than three seconds on average was achieved.
To obtain a ground-truth representation of the dough development, we measured the width and height of each dough piece once every five minutes and calculated the volumes assuming an ellipsoidal shape with circular base area by means of:
V = 4 3 × π × ( W h ) 2 × h
Figure 11 represents our ground truth values of the width, height, the quotient width/height and the volume to be compared with our results.
The results contradict the assumptions about the determination of the optimal fermentation state made in the introduction of this work. According to a baking expert who was consulted during the experiment, the fermentation would have been stopped after 55 min to obtain an optimal fermentation state. Both the widths and the heights of the dough samples increased approximately linearly also after the designated optimal time and no notable change in the courses, which also caused a nearly linear volume increase. Figure 12 shows the difference between the reference and the calculated volume using our method and the relative deviation with regard to the dough volume.
We obtained median volume differences of approximately 10 cm3 for the three dough pieces during the fermentation period of 90 min, which resembles our measurement of the static test objects. Furthermore, the relative volume difference with regards to the dough volume decreased with increasing fermentation time, which resulted in more accurate volume estimation when the process approaches the optimal state. The method for estimating the volume of watermelons by means of image processing proposed in [33] achieves a deviation of approximately 7.7 % on average. Approximately the same deviation (7.8 %) is stated by the authors in [34] while estimating the volume of kiwi fruits using image processing techniques. Compared to those, our method performs slightly weaker at the beginning with a small object volume, but with increasing fermentation time we obtain more accurate volume estimations because the relative volume error decreases.
The results show that, contrary to the assumptions, the optimal fermentation state cannot be determined only by considering the dough volume gradient. Nevertheless, a pre-defined volume growth factor, which is set by an expert before the start of fermentation, that signifies an optimal state, can be detected properly using our method. In our case, we obtain a factor of approximately three that signifies the desired state.

5. Conclusions and Future Work

In this paper, we proposed a novel method for the continuous monitoring of the volumetric parameters of dough piece during fermentation. We showed that a proper segmentation of a three-dimensional topography and a reliable volume estimation could be achieved by the combination of machine learning and 3D model fitting. Using our proposed method, an essential and promising advancement of the current state of the art has been proposed, which finally enables the possibility of parallel monitoring of multiple dough pieces, instead of single ones, to get a better overview of the complete fermentation interior. In that way, certain planes of fermenting dough pieces can be analyzed individually and independently from each other. We found out that the optimal fermentation state cannot be determined only by considering the volume gradient. It remains to be examined whether other parameters like the surface moisture of the dough can be analyzed to obtain the optimal time automatically. With our method, a predefined desired final volume can be detected automatically, which already can relieve the baking staff. Due to the fact that, using our system, the fermentation chamber does not have to be opened during the fermentation to check the state, a much smoother process without interruptions can be established.
Future work will concentrate on optimizing the model fitting method and minimizing the processing time, which currently takes approximately three seconds on average per object. That is of great interest, since a fermentation chamber contains several dozens of dough pieces whose volumes have to be monitored simultaneously. A difference of one second of computation time for one object applied to 50 dough pieces would lead to a reduction of 50 s altogether, which could make the difference between optimal and over-fermentation. For the acceleration of the calculation, the complete transfer of the process to hardware, like field programmable gate array (FPGA), is conceivable. Another future research task lies in the concurrent detection of different kinds of dough object types like pretzels, donuts, and so on. Therefore, more data has to be captured and our neural network has to be trained to be able to perform the classification of different classes with a high classification rate and accuracy. It should be examined if it is possible to use simulated point clouds for the training, which would lead to an unlimited amount of training data and hence to a much more precise network.

6. Patents

A patent application for the system for the automatic capturing of the fermentation chamber topology and the determination of the volume of dough pieces has been lodged [8].

Author Contributions

Conceptualization, L.A.G. and A.-K.R.; methodology, L.A.G.; software, L.A.G.; validation, L.A.G.; writing—original draft preparation, L.A.G.; writing—review and editing, M.L., A.-K.R. and M.F.; visualization, L.A.G.; supervision, M.L. and M.F.; project administration, L.A.G., M.L., A.-K.R. and M.F..; funding acquisition, M.L., A.-K.R. and M.F.

Funding

This work is part of the research project F.I.T. Fully-Automated Fermentation System, funded by the German Federal Ministry of Economic Affairs and Energy (BMWi, funding code 16KN057228).

Conflicts of Interest

The authors declare no conflict of interest.

References

  1. Zentralverband des Deutschen Bäckerhandwerks e. V. Entwicklung Beschäftigte & Betriebe: Beschäftigtenzahlen im Bäckerhandwerk. Available online: https://www.baeckerhandwerk.de/baeckerhandwerk/zahlen-fakten/entwicklung-beschaeftigte-betriebe/ (accessed on 13 December 2018).
  2. HuffPost Deutschland. Konkurrenz für McDonald’s und Burger King: Das ist der überraschende Spitzenreiter bei Schnell-Restaurants. Available online: https://www.huffingtonpost.de/2015/05/04/schnell-restaurant-spitzenreiter_n_7205306.html (accessed on 15 March 2019).
  3. Wing, D.; Scott, A. The Bread Builders: Hearth Loaves and Masonry Ovens; Chelsea Green Publishing: White River Junction, VT, USA, 1999; ISBN 1890132055. [Google Scholar]
  4. Ivorra, E.; Amat, S.V.; Sánchez, A.J.; Barat, J.M.; Grau, R. Continuous monitoring of bread dough fermentation using a 3D vision Structured Light technique. J. Food Eng. 2014, 130, 8–13. [Google Scholar] [CrossRef]
  5. Benz, F. Backwarenherstellung. Fachkunde für Bäcker, 6; Dr Schroedel: Hannover, Germany, 1986; ISBN 350791414X. [Google Scholar]
  6. Priyadharshini, K.; Akila, R. A Survey on Computer Vision Technology for Food Quality Evaluation. Int. J. Innov. Res. Comput. Commun. Eng. 2016, 4, 14860–14865. [Google Scholar]
  7. Lösche, K.; Reichenbach, A. Aerosole & Bio-Additive in der Bäckerei: Innovative Wege zur Verbesserung von Qualität, Haltbarkeit und Energieeffizienz. In Bäckereitechnologie: Forschung und Innovationen; f2m Food multimedia Gmbh: Hamburg, Germany, 2015; pp. 50–59. [Google Scholar]
  8. BIBA—Bremer Institut für Produktion und Logistik GmbH, ttz Bremerhaven. Vorrichtung und Verfahren zur Prozessüberwachung mehrerer Teiglinge in einer Prozesskammer (Pending), 2018; 102018124378.2.
  9. Elmehdi, H.M.; Page, J.H.; Scanlon, M.G. Monitoring Dough Fermentation Using Acoustic Waves. Food Bioprod. Process. 2003, 81, 217–223. [Google Scholar] [CrossRef] [Green Version]
  10. Skaf, A.; Nassar, G.; Lefebvre, F.; Nongaillard, B. A new acoustic technique to monitor bread dough during the fermentation phase. J. Food Eng. 2009, 93, 365–378. [Google Scholar] [CrossRef]
  11. Bajd, F.; Serša, I. Continuous monitoring of dough fermentation and bread baking by magnetic resonance microscopy. Magn. Reson. Imaging 2011, 29, 434–442. [Google Scholar] [CrossRef] [PubMed]
  12. Pour-Damanab, A.S.; Jafary, A.; Rafiee, S. Monitoring the dynamic density of dough during fermentation using digital imaging method. J. Food Eng. 2011, 107, 8–13. [Google Scholar] [CrossRef]
  13. Scholz-Reiter, B.; Thamer, H. Multi-View Sensor Fusion of Synthetic ToF Images for Object Recognition of Universal Logistic Goods; GfaI: Berlin, Germany, 2011. [Google Scholar]
  14. Qi, C.R.; Su, H.; Mo, K.; Guibas, L.J. Pointnet: Deep learning on point sets for 3d classification and segmentation. In Proceedings of the IEEE Conference on Computer Vision and Pattern Recognition, Honolulu, HI, USA, 21–26 July 2017. [Google Scholar]
  15. He, K.; Gkioxari, G.; Dollar, P.; Girshick, R. Mask R-CNN. In Proceedings of the 2017 IEEE International Conference on Computer Vision, ICCV, Venice, Italy, 22–29 October 2017; IEEE: Piscataway, NJ, USA, 2017; pp. 2980–2988, ISBN 978-1-5386-1032-9. [Google Scholar]
  16. Fang, X.S. The extruded generalized cylinder: A deformable model for object recovery. In Proceedings of the IEEE Conference on Computer Vision and Pattern Recognition, Seattle, WA, USA, 21–23 June 1994; IEEE: Piscataway, NJ, USA, 1994. [Google Scholar]
  17. Biederman, I. Recognition-by-components: A theory of human image understanding. Psychol. Rev. 1987, 94, 115–147. [Google Scholar] [CrossRef] [PubMed]
  18. Barr, A.H. Superquadrics and angle-preserving transformations. IEEE Comput. Graph. Appl. 1981, 1, 11–23. [Google Scholar] [CrossRef]
  19. Solina, F.; Bajcsy, R. Recovery of parametric models from range images: The case for superquadrics with global deformations. IEEE Trans. Pattern Anal. Mach. Intell. 1990, 12, 131–147. [Google Scholar] [CrossRef]
  20. Thamer, H.; Scholz-Reiter, B. 3D-Objekterkennung von heterogenen Stückgütern—Flexible Automatisierung basierend auf 3D-Bildverarbeitung. Ind. Manag. 2014, 31, 35–38. [Google Scholar]
  21. West, J.; Ventura, D.; Warnick, S. Spring Research Presentation: A Theoretical Foundation for Inductive Transfer; Brigham Young University, College of Physical and Mathematical Sciences: Provo, UT, USA, 2007; Volume 1. [Google Scholar]
  22. Lin, T.-Y.; Maire, M.; Belongie, S.; Bourdev, L.; Girshick, R.; Hays, J.; Perona, P.; Ramanan, D.; Zitnick, C.L.; Dollár, P. Microsoft COCO: Common Objects in Context. 2014. Available online: http://arxiv.org/pdf/1405.0312v3 (accessed on 11 October 2019).
  23. Perumal, L. Quaternion and its application in rotation using sets of regions. Int. J. Eng. Technol. Innov. 2016, 1, 35–52. [Google Scholar]
  24. Whaite, P.; Ferrie, F.P. From uncertainty to visual exploration. In Proceedings of the Third International Conference on Computer Vision, Osaka, Japan, 4–7 December 1990; Kak, A.C., Tsuji, S., Eklundh, J.-O., Eds.; IEEE: Piscataway, NJ, USA, 1990; pp. 690–697, ISBN 0-8186-2057-9. [Google Scholar]
  25. Bardinet, E.; Ayache, N.; Cohen, L.D. Fitting of iso-surfaces using superquadrics and free-form deformations. In Proceedings of the IEEE Workshop on Biomedical Image Analysis, Seattle, WA, USA, 24–25 June 1994; IEEE Computer Society Press: Washington, D.C., USA, 1994; pp. 184–193, ISBN 0-8186-5802-9. [Google Scholar]
  26. Duncan, K.; Sarkar, S.; Alqasemi, R.; Dubey, R. Multi-scale superquadric fitting for efficient shape and pose recovery of unknown objects. In Proceedings of the IEEE International Conference on Robotics and Automation (ICRA), Karlsruhe, Germany, 6–10 May 2013; IEEE: Piscataway, NJ, USA, 2013; pp. 4238–4243, ISBN 978-1-4673-5643-5. [Google Scholar]
  27. Biegelbauer, G.; Vincze, M. Efficient 3D Object Detection by Fitting Superquadrics to Range Image Data for Robot’s Object Manipulation. In Proceedings of the 2007 IEEE International Conference on Robotics and Automation, Rome, Italy, 10–14 April 2007; IEEE: Piscataway, NJ, USA, 2006; pp. 1086–1091, ISBN 1-4244-0602-1. [Google Scholar]
  28. Wächter, A.; Biegler, L.T. On the implementation of an interior-point filter line-search algorithm for large-scale nonlinear programming. Math. Program. 2006, 106, 25–57. [Google Scholar] [CrossRef]
  29. Jaklič, A.; Leonardis, A.; Solina, F. Superquadrics and their geometric properties. In Segmentation and Recovery of Superquadrics; Springer: Berlin/Heidelberg, Germany, 2000; pp. 13–39. [Google Scholar]
  30. Sinha, N. Handbook of Food Products Manufacturing, 2 Volume Set; John Wiley & Sons: Hoboken, NJ, USA, 2007; ISBN 0470113545. [Google Scholar]
  31. Kerker, M. The Scattering of Light and other Electromagnetic Radiation: Physical Chemistry: A Series of Monographs; Academic Press: Cambridge, MA, USA, 2013; ISBN 1483191745. [Google Scholar]
  32. Bhattacharya, M.; Hanna, M.A. Viscosity modelling of dough in extrusion. Int. J. Food Sci. Technol. 1986, 21, 167–174. [Google Scholar] [CrossRef]
  33. Koc, A. Determination of watermelon volume using ellipsoid approximation and image processing. In Postharvest Biology and Technology; Elsevier: Amsterdam, The Netherlands, 2007; pp. 366–371. [Google Scholar]
  34. Rashidi, M.; Gholami, M. Determination of kiwifruit volume using ellipsoid approximation and image-processing methods. Int. J. Agric. Biol. 2008, 10, 375–380, ISSN 1560-8530. [Google Scholar]
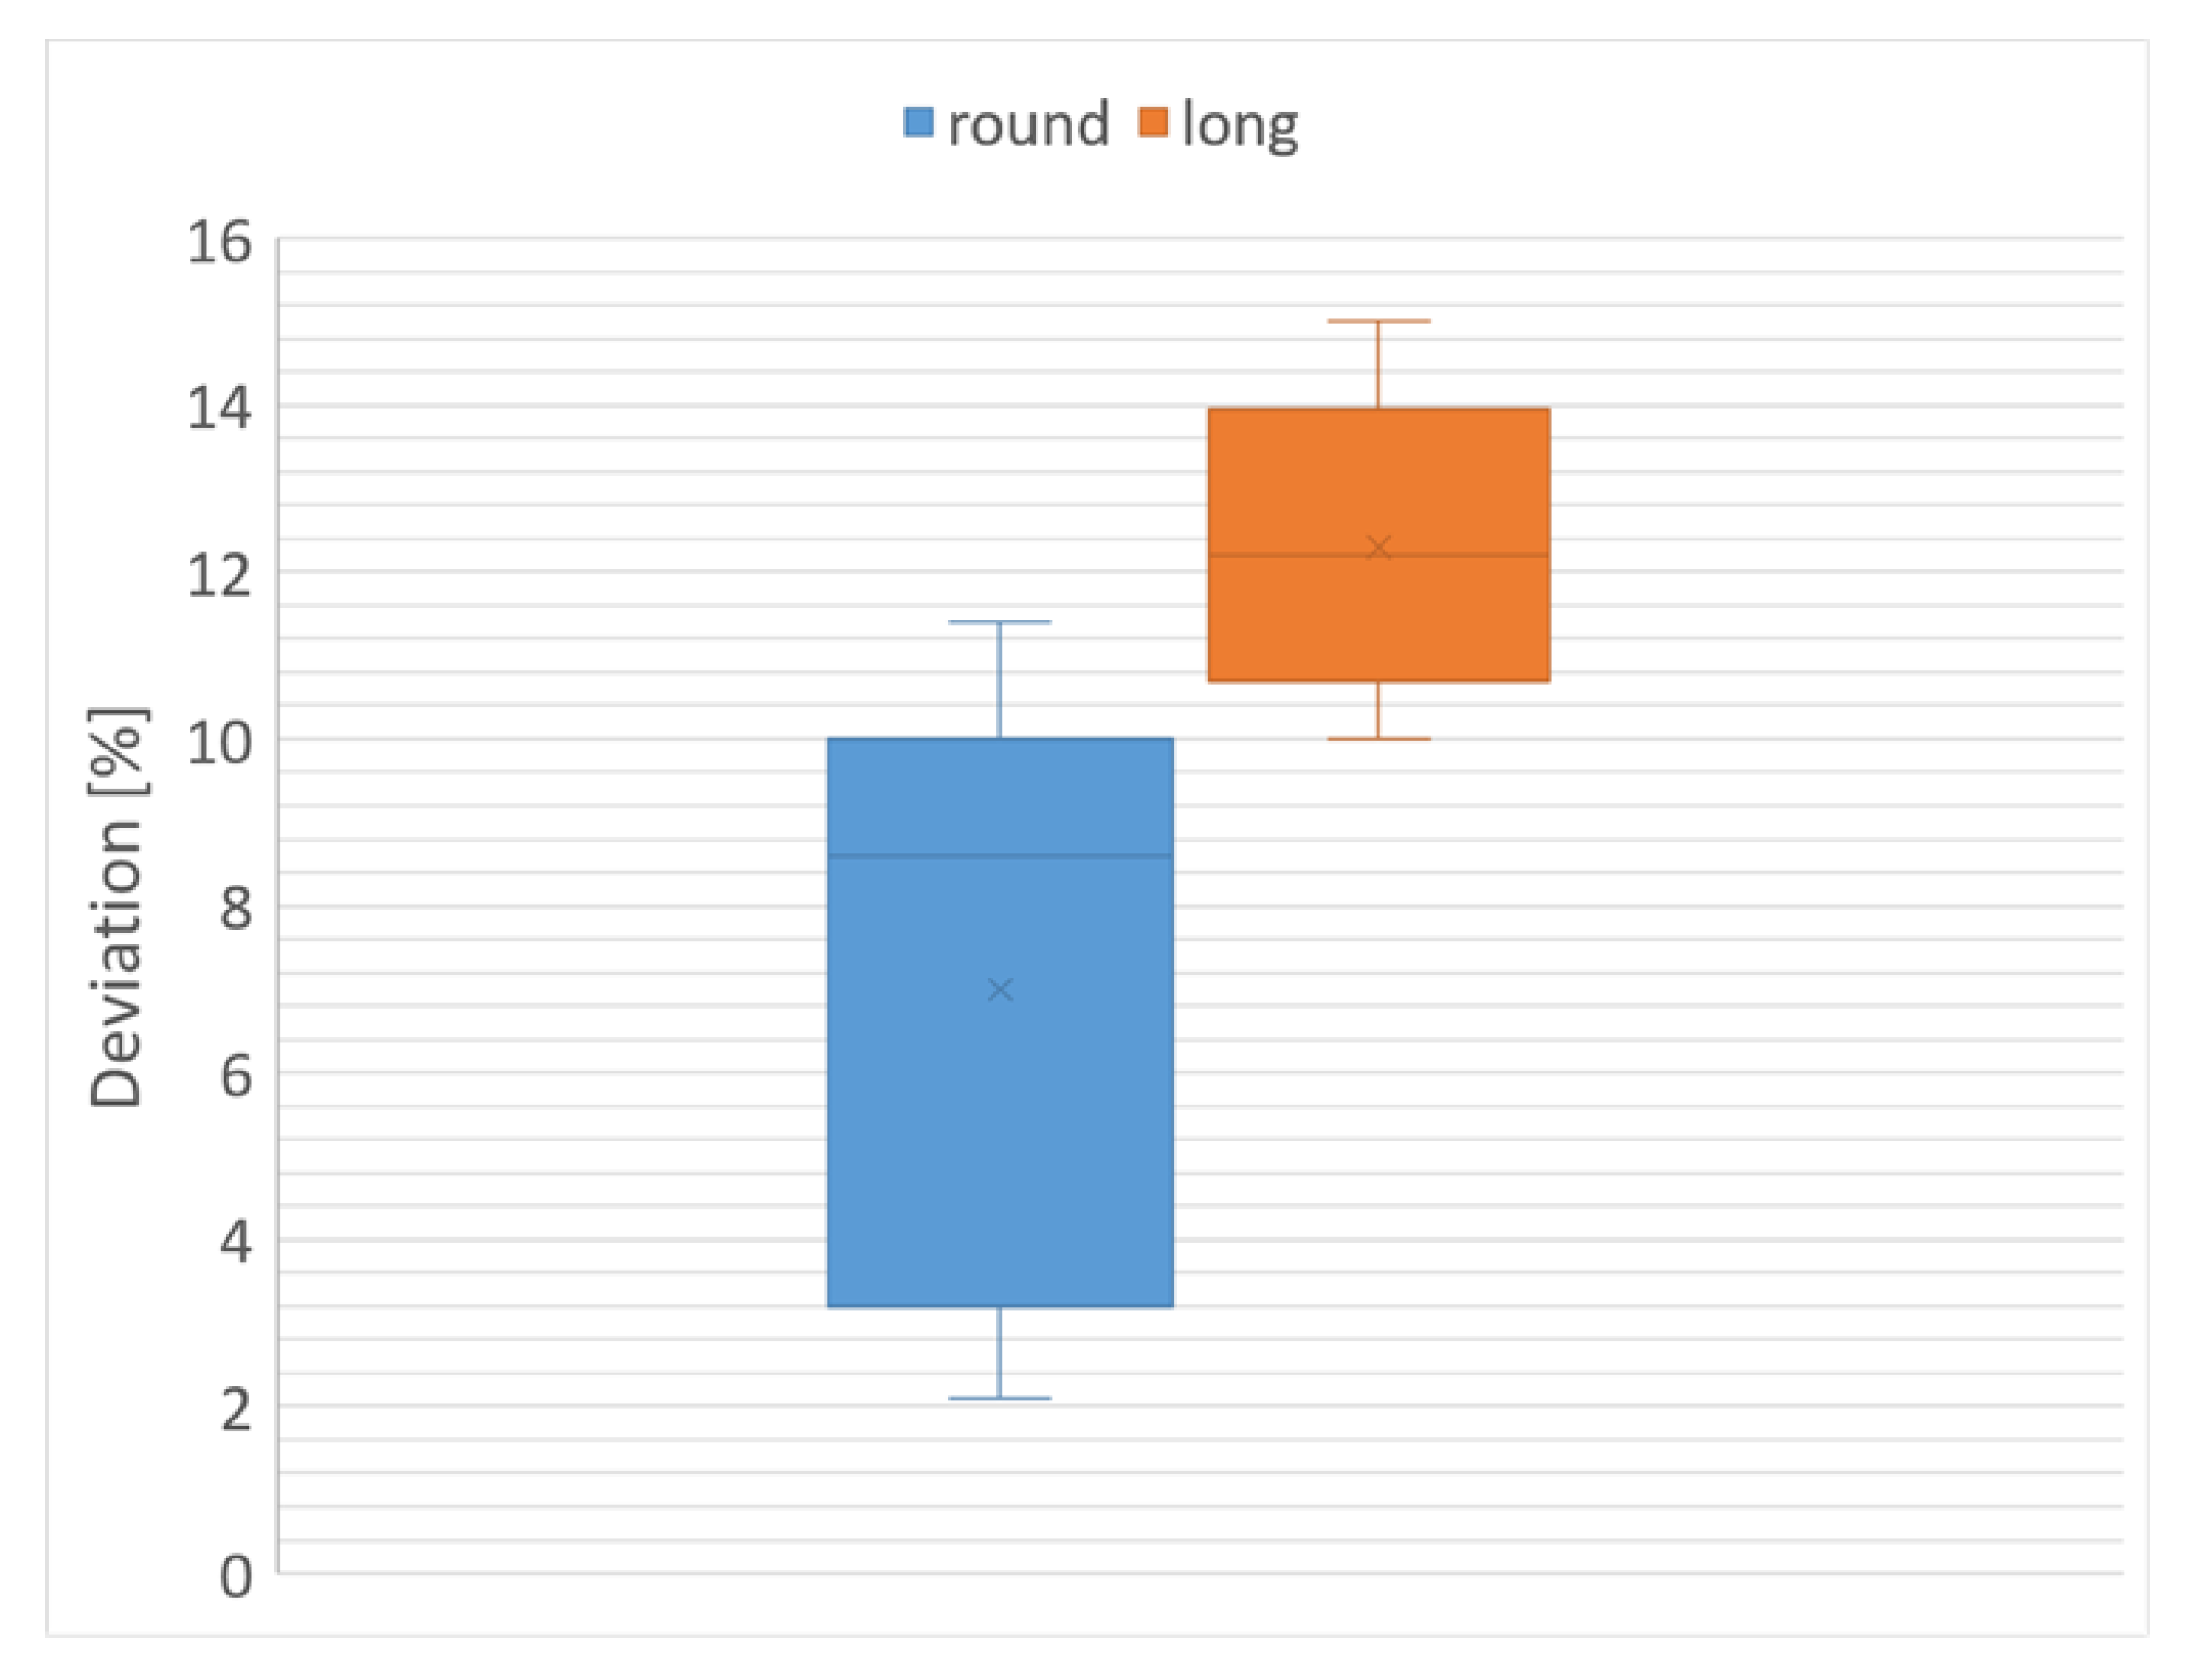
Figure 1. Bread manufacturing process.
Applsci 09 04266 g001
Figure 2. Volume development during fermentation (own illustration based on [5]).
Applsci 09 04266 g002
Figure 3. Schematical illustration of the measurement system (left) and real measurement module (right).
Applsci 09 04266 g003
Figure 4. Test setup (left) and schematic (right).
Applsci 09 04266 g004
Figure 5. Processing Sequence.
Applsci 09 04266 g005
Figure 6. Architecture of Mask R-CNN (own illustration based on [15]).
Applsci 09 04266 g006
Figure 7. Surface measurement laid over scene images.
Applsci 09 04266 g007
Figure 8. Superimposition of dough surface with (pink) and without induced aerosol (purple) of three different dough objects (ac).
Applsci 09 04266 g008
Figure 9. Boxplots for different dough shapes.
Applsci 09 04266 g009
Figure 10. Processing steps: (a) Measured topography point cloud of the fermentation chamber inside; (b) Segmented dough pieces; (c) Model-fitted dough pieces.
Applsci 09 04266 g010
Figure 11. Course of width (upper left) and height (upper right) of three dough objects, the quotient W/h (lower left) and calculated volume (lower right).
Applsci 09 04266 g011
Figure 12. Volume Difference: absolute (left) and relative (right).
Applsci 09 04266 g012
Table 1. Volume calculation.
Test dough PieceShapeReal Dough Volume Calculated Dough VolumeDeviation [%]
1Round707811.4
2Round70768.6
3Long14011915.0
4Long14012212.9
5Long907912.2
6Round70734.3
7Long908110.0
8Long706211.4
9Round1401432.1
10Round70768.6

