Article

Distinct Bacterial Consortia Established in ETBE-Degrading Enrichments from a Polluted Aquifer

by
Martina Kyselková
1,2,*,
Joana Falcão Salles
1,3,
Alain Dumestre
4,
Yves Benoit
5 and
Geneviève L. Grundmann
1
1
Université Lyon1, CNRS, UMR5557, Ecologie Microbienne, INRA, 69622 Villeurbanne CEDEX, France
2
Biology Centre of the Czech Academy of Sciences, Institute of Soil Biology, 37005 České Budějovice, Czech Republic
3
University of Groningen, Groningen Institute for Evolutionary Life Sciences, 9747 AG Groningen, The Netherlands
4
SERPOL, 69200 Vénissieux, France
5
IFP Energies Nouvelles, 92852 Rueil-Malmaison, France
*
Author to whom correspondence should be addressed.
Appl. Sci. 2019, 9(20), 4247; https://doi.org/10.3390/app9204247
Submission received: 16 August 2019 / Revised: 27 September 2019 / Accepted: 2 October 2019 / Published: 11 October 2019
(This article belongs to the Special Issue Environmental Fate of Emerging Organic Micro-Contaminants)

Abstract

:
Ethyl tert-butyl ether (ETBE) is a gasoline additive that became an important aquifer pollutant. The information about natural bacterial consortia with a capacity for complete ETBE degradation is limited. Here we assess the taxonomical composition of bacterial communities and diversity of the ethB gene (involved in ETBE biodegradation) in ETBE-enrichment cultures that were established from a gasoline-polluted aquifer, either from anoxic ETBE-polluted plume water (PW), or from an upstream non-polluted water (UW). We used a 16S rRNA microarray, and 16S rRNA and ethB gene sequencing. Despite the dissimilar initial chemical conditions and microbial composition, ETBE-degrading consortia were obtained from both PW and UW. The composition of ETBE-enrichment cultures was distinct from their initial water samples, reflecting the importance of the rare biosphere as a reservoir of potential ETBE degraders. No convergence was observed between the enrichment cultures originating from UW and PW, which were dominated by Mesorhizobium and Hydrogenophaga, respectively, indicating that distinct consortia with the same functional properties may be present at one site. Conserved ethB genes were evidenced in both PW and UW ETBE-enrichment cultures and in PW water. Our results suggest that the presence of ethB genes rather than the taxonomical composition of in situ bacterial communities indicate the potential for the ETBE degradation at a given site.

Graphical Abstract

1. Introduction

Oxygenates methyl tert-butyl ether (MTBE) and ethyl tert-butyl ether (ETBE) are widely used as enhancers of gasoline octane index, replacing previously used lead tetraethyl. These chemicals are, however, highly soluble in water and became a major pollutant in aquifers after accidental gasoline spills. Both compounds are poorly biodegradable and potentially carcinogenic. Their biodegradation often terminates with a toxic compound tert-butyl alcohol (TBA) [1,2]. The biodegradation of ETBE, in comparison to MTBE, has been studied less [3], but is of concern because ETBE has been found as an aquifer pollutant in some cases in Europe, especially in France [4].
Few bacterial isolates have been shown to degrade ETBE so far, belonging either to Betaproteobacteria, for example, Aquincola tertiaricarbonis L108, Comamonas testosteroni E1 and Rubrivivax sp. IFP 2047, or to Actinobacteria, for example, Mycobacterium sp. IFP 2009, Rhodococcus equii IFP 2002, Rhodococcus zopfii IFP 2005, Rhodococcus ruber IFP 2001, Rhodococcus aetherivorans IFP 2017, Rhodococcus sp. IFP 2042 and other strains, Pseudonocardia tetrahydrofuranoxydans K1 and Pseudonocardia sp. IFP 2050 [5,6,7,8,9,10,11,12]. The betaproteobacterial degraders were also able to degrade MTBE and TBA [6,8,12]. In all cases, the degradation of ETBE was observed only under aerobic conditions. In situ and microcosm studies, however, indicated that ETBE-degradation may also proceed under anaerobic conditions [13,14].
In Rhodococcus ruber IFP2001, it was shown that the operon ethABCD was essential for ETBE degradation [15]. The operon codes for a cytochrome P450 monooxygenase system involved in the initial oxydation of ETBE [1]. The expression of the gene ethB, encoding the cytochrome P450, is inducible by ETBE [16]. The ethABCD operon is flanked by class II transposon sequences, indicating that it may be horizontally transferred to other bacterial species. Indeed, highly conserved (>99% identity) eth genes were found in Rhodococcus zopfii IFP2005 and Mycobacterium sp. IFP2009 [7]. All these strains were able to grow on ETBE but accumulated TBA, showing that this operon itself is not sufficient to achieve complete ETBE mineralization.
The accumulation of TBA may present a problem for in situ treatments because of its toxicity. The co-culture with microorganisms able to grow on TBA may be required for successful bioremediation of oxygenate-contaminated sites. Indeed, a complete degradation of ETBE by a bacterial consortium was obtained from a polluted aquifer, in which Rhodococcus sp. degraded ETBE to TBA and Bradyrhizobium sp. further degraded TBA to CO2 [13]. In addition, oxygenates in aquifers are usually accompanied by BTEX and other gasoline compounds, which implies that large bacterial consortia may be required for a full depollution of contaminated sites. Mentioned and other observations suggest the use of a community-based rather than a one-strain-based approach, as the best alternative to study these processes in the environment [17].
Few studies evaluated the composition of microbial consortia presenting oxygenate degradation. They indicated that the potential for intrinsic oxygenate degradation was dependent on the composition of the indigenous aquifer community, in combination with site-specific geochemical conditions [18,19,20]. These studies mainly focused on MTBE, while the information on the composition of microbial communities in ETBE polluted sites and natural consortia capable for ETBE biodegradation remain scarce [11,12,21,22]. In a study on bacterial enrichment cultures from five different aquifers, Le Digabel et al. [12] showed that the ETBE-degrading consortia had distinct taxonomical composition with prevailing Proteobacteria in three of them, and with Actinobacteria occurring in all of them. This confirmed the importance of the composition of the original aquifer communities, and also indicated which taxa might play a crucial role in ETBE degradation. Indeed, several actinobacterial and betaproteobacterial strains capable for partial or full ETBE degradation were isolated from these enrichment cultures [12]. The recent study of van der Walls et al. [22] has shown that algae (Scenedesmus, Chlorella) may be a part of natural microbial consortia from contaminated groundwater and, under light conditions, supply oxygen needed for bacterial ETBE degradation. They identified Comamonadaceae and Candidatus Moranbacteria as the most abundant bacterial groups in algal-bacterial culture that degraded ETBE under fed-batch conditions.
The present study was carried out in the context of the bioremediation of a gasoline-polluted aquifer in France, described by Fayolle-Guichard et al. [4]. Although BTEX have been already largely consumed in the plume at the time of sampling, ETBE remained as the prevailing pollutant, together with MTBE and TBA. Due to oxygen consumption in the course of BTEX biodegradation, the conditions in the plume became anoxic and therefore unfavorable for oxygenate biodegradation. Oxygenation of the aquifer is an option for ETBE bioremediation in such cases [4]. The main objective of this study was to establish aerobic ETBE-enrichment cultures from the studied aquifer that could later serve for bioaugmentation and assess their ETBE-degradation capacity and taxonomical composition. To this end, the ETBE-enrichment cultures were established from water samples from the anoxic plume of the studied aquifer and from the upstream zone where the conditions were aerobic. Taxonomical composition of the original water samples and of the enrichment cultures was assessed with a 16S rRNA gene-based microarray, and the major taxa were confirmed by cloning and sequencing of the 16S rRNA genes. In addition, we assessed the presence and diversity of the ethB gene in original water samples and ETBE-enrichment cultures by cloning and sequencing.

2. Materials and Methods

2.1. Site Characteristics and Water Sample Collection

The experimental field was a leaking gas-station implemented with 40 piezometers, situated 10 km in the south of Lyon, Rhône region, France. The detailed geological, hydrodynamic and physico-chemical characterization of the field was done previously [4]. Water from two wells, one located at about 120 m upstream of the polluted zone and thus referred to as upstream well (UW; denoted Pz-1 in [4]) and another one within the polluted zone referred to as polluted well (PW; denoted P2 in [4]), was sampled for (i) bacterial community assessment (in June 2008, November 2008, March 2009 and April 2009) and (ii) the establishment of ETBE-enrichment cultures (in June 2008). The sampling depth was 2.7 and 1.9 meters for UW and PW, respectively. Water was first pumped out of the wells and one liter of water was then sampled after the wells were spontaneously re-filled. Water was kept at 4 °C until subsequent analyses (done on the next day). The chemical composition of water sampled in the two wells is indicated in Table 1.

2.2. Enrichment Cultures and Their Biodegradation Potential

Initial enrichment cultures and subsequent subcultures were carried out as follows (Figure S1). ETBE-enrichment samples are labeled I1 to I3 for the initial cultures and S1 to S3 for the subcultures. UW ETBE-enrichment subcultures S1–S3 were obtained from the initial UW culture I1, whereas PW ETBE-enrichment subcultures S1–S3 were obtained from the initial PW culture I3 (Figure S1). The establishment and handling of enrichment cultures was done in a laminar flow hood to maintain sterile conditions. For initial enrichment cultures, water samples (20 mL) from UW and PW were filtered (0.22 µm) to discard any pollutant that could be dissolved in water. The filters were introduced to air-tight 500 mL-Schott flasks containing 150 mL mineral medium (KH2PO4 1.4 g/L; K2HPO4 1.7 g/L; MgSO4 × 7 H2O 0.5 g/L; NH4NO3 1.5 g/L; CaCl2 × 2 H2O 0.04 g/L; FeSO4 × 7 H2O 1 mg/L) with 100 mg/L ETBE representing the sole source of carbon. A vitamin solution and an oligo-element solution were added as previously described [23]. The headspace in the flasks was calculated so that oxygen was in a large excess with regard to the theoretical oxygen demand of ETBE. The initial enrichment cultures were set in triplicates and incubated under agitation at 30 °C. The flasks were closed with a stopper and equipped with a side-arm enabling sampling in the course of incubation. Samples of 2 mL were regularly withdrawn to measure ETBE and TBA concentrations (see further). When ETBE was fully consumed, the cultures were spiked with ETBE so as to reach the initial concentration (1 to 3 times). The initial enrichment cultures were sampled (40 mL) at 67 days (replicate I3 of PW initial enrichment culture) and 253 days (the other replicates), centrifuged, and cell pellets were stored at −80 °C for DNA extraction.
After the complete biodegradation of ETBE in the initial enrichment cultures, triplicate enrichment subcultures were established from one flask for UW (I1) and PW (I3), by transferring 30 mL of the initial enrichment cultures into 150 mL fresh minimal medium containing 100 mg/L ETBE (Figure S1). After 1 week, 40 mL of the enrichment subcultures were centrifuged and the bacterial pellets were stored at −80 °C until DNA extraction. After the complete ETBE biodegradation, the enrichment subcultures were spiked with ETBE so as to reach the initial concentration and the oxygenate concentrations were further monitored. This was done twice in order to confirm the biodegradation capacities of the established community.
ETBE and TBA were quantified by flame ionization detection on a Varian 3300 gas chromatograph (Varian, Les Ulis, France) equipped with a 0.32 mm × 25 m Porabond-Q capillary column (J&W Scientific, Chromoptic, Auxerre, France), using a two-step temperature gradient ranging from 105 °C to 210 °C at 10 °C/min. The column was then maintained at 210 °C for 20 min. Helium (1.6 mL/min) was used as the carrier gas. Samples were filtered through 0.22 µm filters (Prolabo, Fontenay-sous-Bois, France) and injected without further treatment.

2.3. DNA Extraction

One liter of water collected from the wells was filtered through sterile 0.2 µm nylon filter (Millipore, Molsheim, France) and water DNA was extracted from the filters with UltraClean Water DNA kit (MoBio Laboratories, Carlsbad, CA, USA) according to the manufacturer’s protocol.
The enrichment cultures (notably those originating from UW) contained visible flocks suggesting the presence of actinomycetes. Therefore, a modified method of Pospiech and Neumann [24] was used for total DNA extraction from all enrichment cultures. Bacterial pellets from 40 mL of enrichment cultures were resuspended in 162 µl SET buffer (75 mM NaCl, 25 mM EDTA, 20 mM Tris, pH 8.0) with lysozyme (Sigma, L’Isle d’Abeau, France; 1 mg/mL) and transferred to 1.5 mL Eppendorf tubes. Immediately, 16 µL of lysostaphin (Sigma; 50 µg/mL in 10 mM Tris-HCl, pH 7.5) were added to each tube and the tubes were incubated at 37 °C for 1h. The remaining flocks were disintegrated by forcing the samples through 0.4 mm diameter syringe needles. After addition of 20 µL SDS (10%) and 12 µL proteinase K (23 mg/mL; NucleoSpin Tissue kit, Macherey-Nagel, Hoerdt, France), the samples were incubated at 55 °C for 2 h. DNA extraction and purification was carried out with NucleoSpin Tissue kit (Macherey-Nagel, Hoerdt, France) from step 3 according to the manufacturer’s instructions. DNA concentrations were assessed using Nanodrop ND-100 spectrophotometer (Labtech, Palaiseau, France).

2.4. PCR Amplification of 16S rRNA (rrs) Genes and ethB Genes

The universal eubacterial primers T7-pA (forward; TAATACGACTCACTATAGAGAGTTTGATCCTGGCTCAG) and pH (reverse; AAGGAGGTGATCCAGCCGCA) were used to amplify almost full-length 16S rRNA gene [25]. Primer T7-pA includes the sequence of T7 promoter (in italics) at the 5’ end, which enabled T7 RNA polymerase-mediated in vitro transcription using the PCR products as templates. PCR reactions were carried out in a total volume of 50 µL and the reaction mixture prepared as in [26].
The ethB genes from UW and PW water samples (sampled in June 2008), and from UW ETBE-enrichment subculture S1 and PW ETBE-enrichment subculture S3 (Figure S1) were amplified with primers ethB-F2 (forward; CACGCGCTCGGCGACTGGCAGACGTTCAGT) and ethB-R2 (reverse; TCCGACGCACATGTGCGGGCCGTACCCGAA) [19]. The primers were defined based on known ethB sequences from Mycobacterium sp. IFP2009, Rhodococcus zopfii IFP2005 and Rhodococcus ruber IFP2001 [7]. The primers anneal to the Mycobacterium sp. IFP2009 ethB sequence positions 175 and 1027, yielding a 897 bp-long fragment. PCR reactions were carried out in 50 µL total volume. PCR reaction mixtures contained 1 × reaction buffer for Taq DNA Polymerase (Invitrogen, Cergy Pontoise, France), 1.5 mM MgCl2 (Invitrogen, Cergy Pontoise, France), 0.5 µM of each primer (Invitrogen, Cergy Pontoise, France), 50 µM of each dNTP, 20 ng of template DNA, 0.025 mg of T4 gene 32 protein (Roche, Meylan, France), 2% dimethyl sulfoxide and 10 U of Taq DNA Polymerase (Invitrogen, Cergy Pontoise, France). Negative controls (sterile ultra-pure water pipetted to PCR reactions instead of template DNA) and positive controls (20 ng of Rhodococcus ruber IFP 2001 genomic DNA as template) were always included. Thermal cycling was carried out with an initial denaturation step of 95 °C for 7 min, followed by 30 cycles with 30 s denaturation at 94 °C, 30 s annealing at 68 °C, 60 s elongation at 72 °C, and a final elongation step for 7 min at 72 °C. When no visible PCR products were obtained (water samples), the PCR was repeated using 7 µL from the previous PCR mix as a template. PCR products were purified with MinElute PCR purification kit (Qiagen, Hilden, Germany) and DNA concentrations were assessed with Nanodrop ND-100 spectrophotometer (Labtech, Palaiseau, France).

2.5. Sequencing and Sequence Analysis

Purified rrs PCR products obtained from UW and PW water sampled in June 2008, and from UW ETBE-enrichment subculture S1 and PW ETBE-enrichment subculture S3 (Figure S1), and ethB PCR products obtained from PW water (June 2008) and UW ETBE-enrichment subculture S1 and PW ETBE-enrichment subculture S3 were cloned into the cloning vector pGEM-T (pGEM-T Easy Vector System kit; Promega, Charbonnieres, France) according to the manufacturer’s protocol. For rrs genes, 96 clones per sample were sequenced on both strands using Sanger sequencing (AGOWA, Berlin, Germany). For ethB genes, 48 clones per sample were sequenced on one strand (AGOWA). Sequences were checked and edited with BioEdit version 5.0.9 (http://www.mbio.ncsu.edu/BioEdit/BioEdit.html). Chimeric 16S rRNA gene sequences were identified using the chimera detection program Bellerophon [27]. The good quality sequences of rrs (63, 65, 66 and 74 sequences from PW water, UW water, PW ETBE-enrichment subculture S3 and UW ETBE-enrichment subculture S1, respectively) and ethB (23, 42 and 45 sequences from PW ETBE-enrichment subculture S3, UW ETBE-enrichment subculture S1 and PW water, respectively) are available at GenBank (accession numbers KP636042-KP636419).
Sequence affiliation was performed using RDP Classifier [28] at Ribosomal RDP Release 11 (http://rdp.cme.msu.edu/index.jsp; Update 5, 30 September 2016) and algorithm BlastN with default parameters at NCBI Blast (http://www.ncbi.nlm.nih.gov/blast/Blast.cgi). Phylogeny reconstructions were done with MEGA4 software version 4.0.2 (Center for Evolutionary Medicine and Informatics, Tempe, AZ) [29], based on sequence alignments done with ClustalW version 1.83 (Conway Institute UCD, Dublin, Ireland), using default settings. Neighbor-joining trees were built based on phylogenetic distances calculated with Kimura 2 parameter [30,31]. Diversity indices (Shannon index and Chao1 richness estimator) were calculated with RAMI software (Björn Canbäck Bioinformatics, Lund, Sweden) [32].

2.6. Definition of New Probes for 16S rRNA Gene-Based Taxonomical Microarray

Sixty-eight new 16S rRNA probes were defined (Table S1) and added to the previous probe set [33] containing 1033 probes targeting 19 bacterial phyla at different taxonomic levels in order to improve microarray detection potential of bacteria associated to oxygenate pollution. The probes (20mers) were designed using ARB software (http://www.arb-home.de) [34], based on 16S rRNA sequences recovered from the aquifer and the enrichment cultures (see above) as well as 16S rRNA sequences of known ETBE and MTBE degrading species (e.g., Aquicola tertiaricarbonis, Variovorax paradoxus, Rhodococcus aetherivorans, Rhodococcus ruber, Mycobacterium austroafricanum and Pseudonocardia spp.), using the previously defined parameters of the Probe Design function [26,35]. The probe specificity was tested with the Probe Match function against the reference Silva-94 database [36], and only the probes that displayed weighted mismatch value above 1.5 with the non-targeted taxa [33] were retained. The hybridization properties of probes (e.g., melting temperature, potential formation of secondary structures and 3’dimers) were further tested in silico, according to [26,35].

2.7. In Vitro Transcription, Microarray Hybridization, Scanning and Image Analysis

In vitro transcription of 16S rRNA genes was performed on the purified PCR products (400 ng) to obtain fluorescently (Cy3) labeled 16S rRNA for microarray hybridization [37]. This procedure and 16S rRNA fragmentation are described in [35]. Labeled samples were hybridized to the 16S rRNA gene-based taxonomic microarray (containing 1033 probes from [33] and 68 new probes). This microarray has been previously validated by 16S rRNA gene sequencing and qPCR [33,38]. Each microarray probe was present in four copies per slide. Hybridization and image analysis were carried out according to [35].

2.8. Microarray Data Filtration and Statistical Analysis

Data filtration and normalization was conducted as in [33]. Differences in bacterial community composition were statistically assessed with analysis of similarities (ANOSIM) using Primer6 software (PRIMER-E Ltd., Plymouth, UK) [39]. Distances between the groups of samples were analyzed by multidimensional scaling (MDS; Primer6, based on Bray-Curtis similarity matrix) [40]. The probe contribution to the differences between significantly different groups was assessed by similarity percentage analysis (SIMPER; Primer6). Probes giving the cumulative contribution up to 50% were retained and their significance for distinguishing between the groups was further tested with Wilcoxon rank sum tests (P < 0.05), using R (http://www.r-project.org).

3. Results

3.1. Bacterial Communities in Polluted and Upstream Well Water

MDS (Figure 1) and ANOSIM on microarray data showed that bacterial communities in UW and PW water significantly differed (P < 0.05) (the four sampling dates were grouped together). There were 99 positive probes in common between UW and PW water, 99 probes were positive only in UW water and 41 were positive only in PW water. SIMPER analysis together with Wilcoxon rank sum tests showed which probes significantly (P < 0.05) contributed to up to 50% of the differences in bacterial community composition between UW and PW (Figure S2). Notably, the signal intensities from probes targeting sequences affiliated to Spirochates (trepncln), alphaproteobacterial genus Azoarcus (Arcus1, Arcus2, AZA463), betaproteobacterial genera Nitrosospira (Nit1A, Nit1C), Acidovorax (AcidP2cln, Acave3, Acave4), Polaromonas (Polarcln), and family Comamonadaceae (Rhodofcln; with highest identities to Albidiferax), and deltaproteobacterial genus Desulfovibrio (DVLVT222f) were higher in PW water than UW water. In contrast, signals from probes affiliated to the family Rhizobiaceae (Rzbc1247, Alphaproteobacteria), family Oxalobacteraceae (Dugacln, Betaproteobacteria), betaproteobacterial genera Ralstonia/Cupriavidus/Wautersia (Ralstcln2) and Janthinobacterium (Janaga3), Pseudomonas (PseuD; Gammaproteobacteria) and Nitrospira (NSR1156 and NSR826) were higher in UW water than in PW water.
Bacterial communities from PW and UW water sampled in June 2008 were analyzed by 16S rRNA gene sequencing to confirm the presence of the distinguishing bacterial taxa between the two wells. The bacterial community in UW water was more diverse (Shannon index 2.97, 48 OTUs estimated with Chao1 at 97% level of sequence identity) than in PW water (Shannon index 2.61, 34 OTUs estimated) (Figure S3). The only known genus shared by UW and PW water, based on 16S rRNA gene sequencing, was Opitutus (Verrucomicrobia) (Figure S4). The UW water was dominated by Alphaproteobacteria (mainly Sphingomonas and Methylocystis), while sequences related to known anaerobes (e.g., epsilonproteobacterium Arcobacter) and Betaproteobacteria (unclassified Betaproteobacteria, Rhodocyclaceae and Commamonadaceae) prevailed in PW. This is concordant with microarray results. Microarray probes targeting these groups, that is, Sphingo4 and Sphingo5A for Sphingomonadaceae, Methylocyst1 for Methylocystaceae, Rhodofcln for sequences related to Comamonadaceae and Arco1 for Arcobacter were always positive when these taxa were found with the 16S rRNA sequencing approach, although they were not always revealed by SIMPER as the most contributing to the differences between UW and PW.

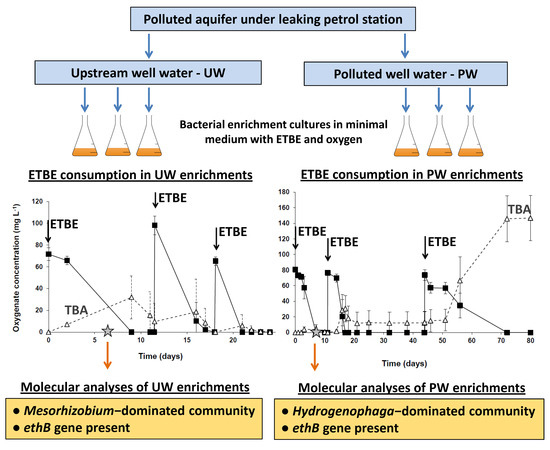
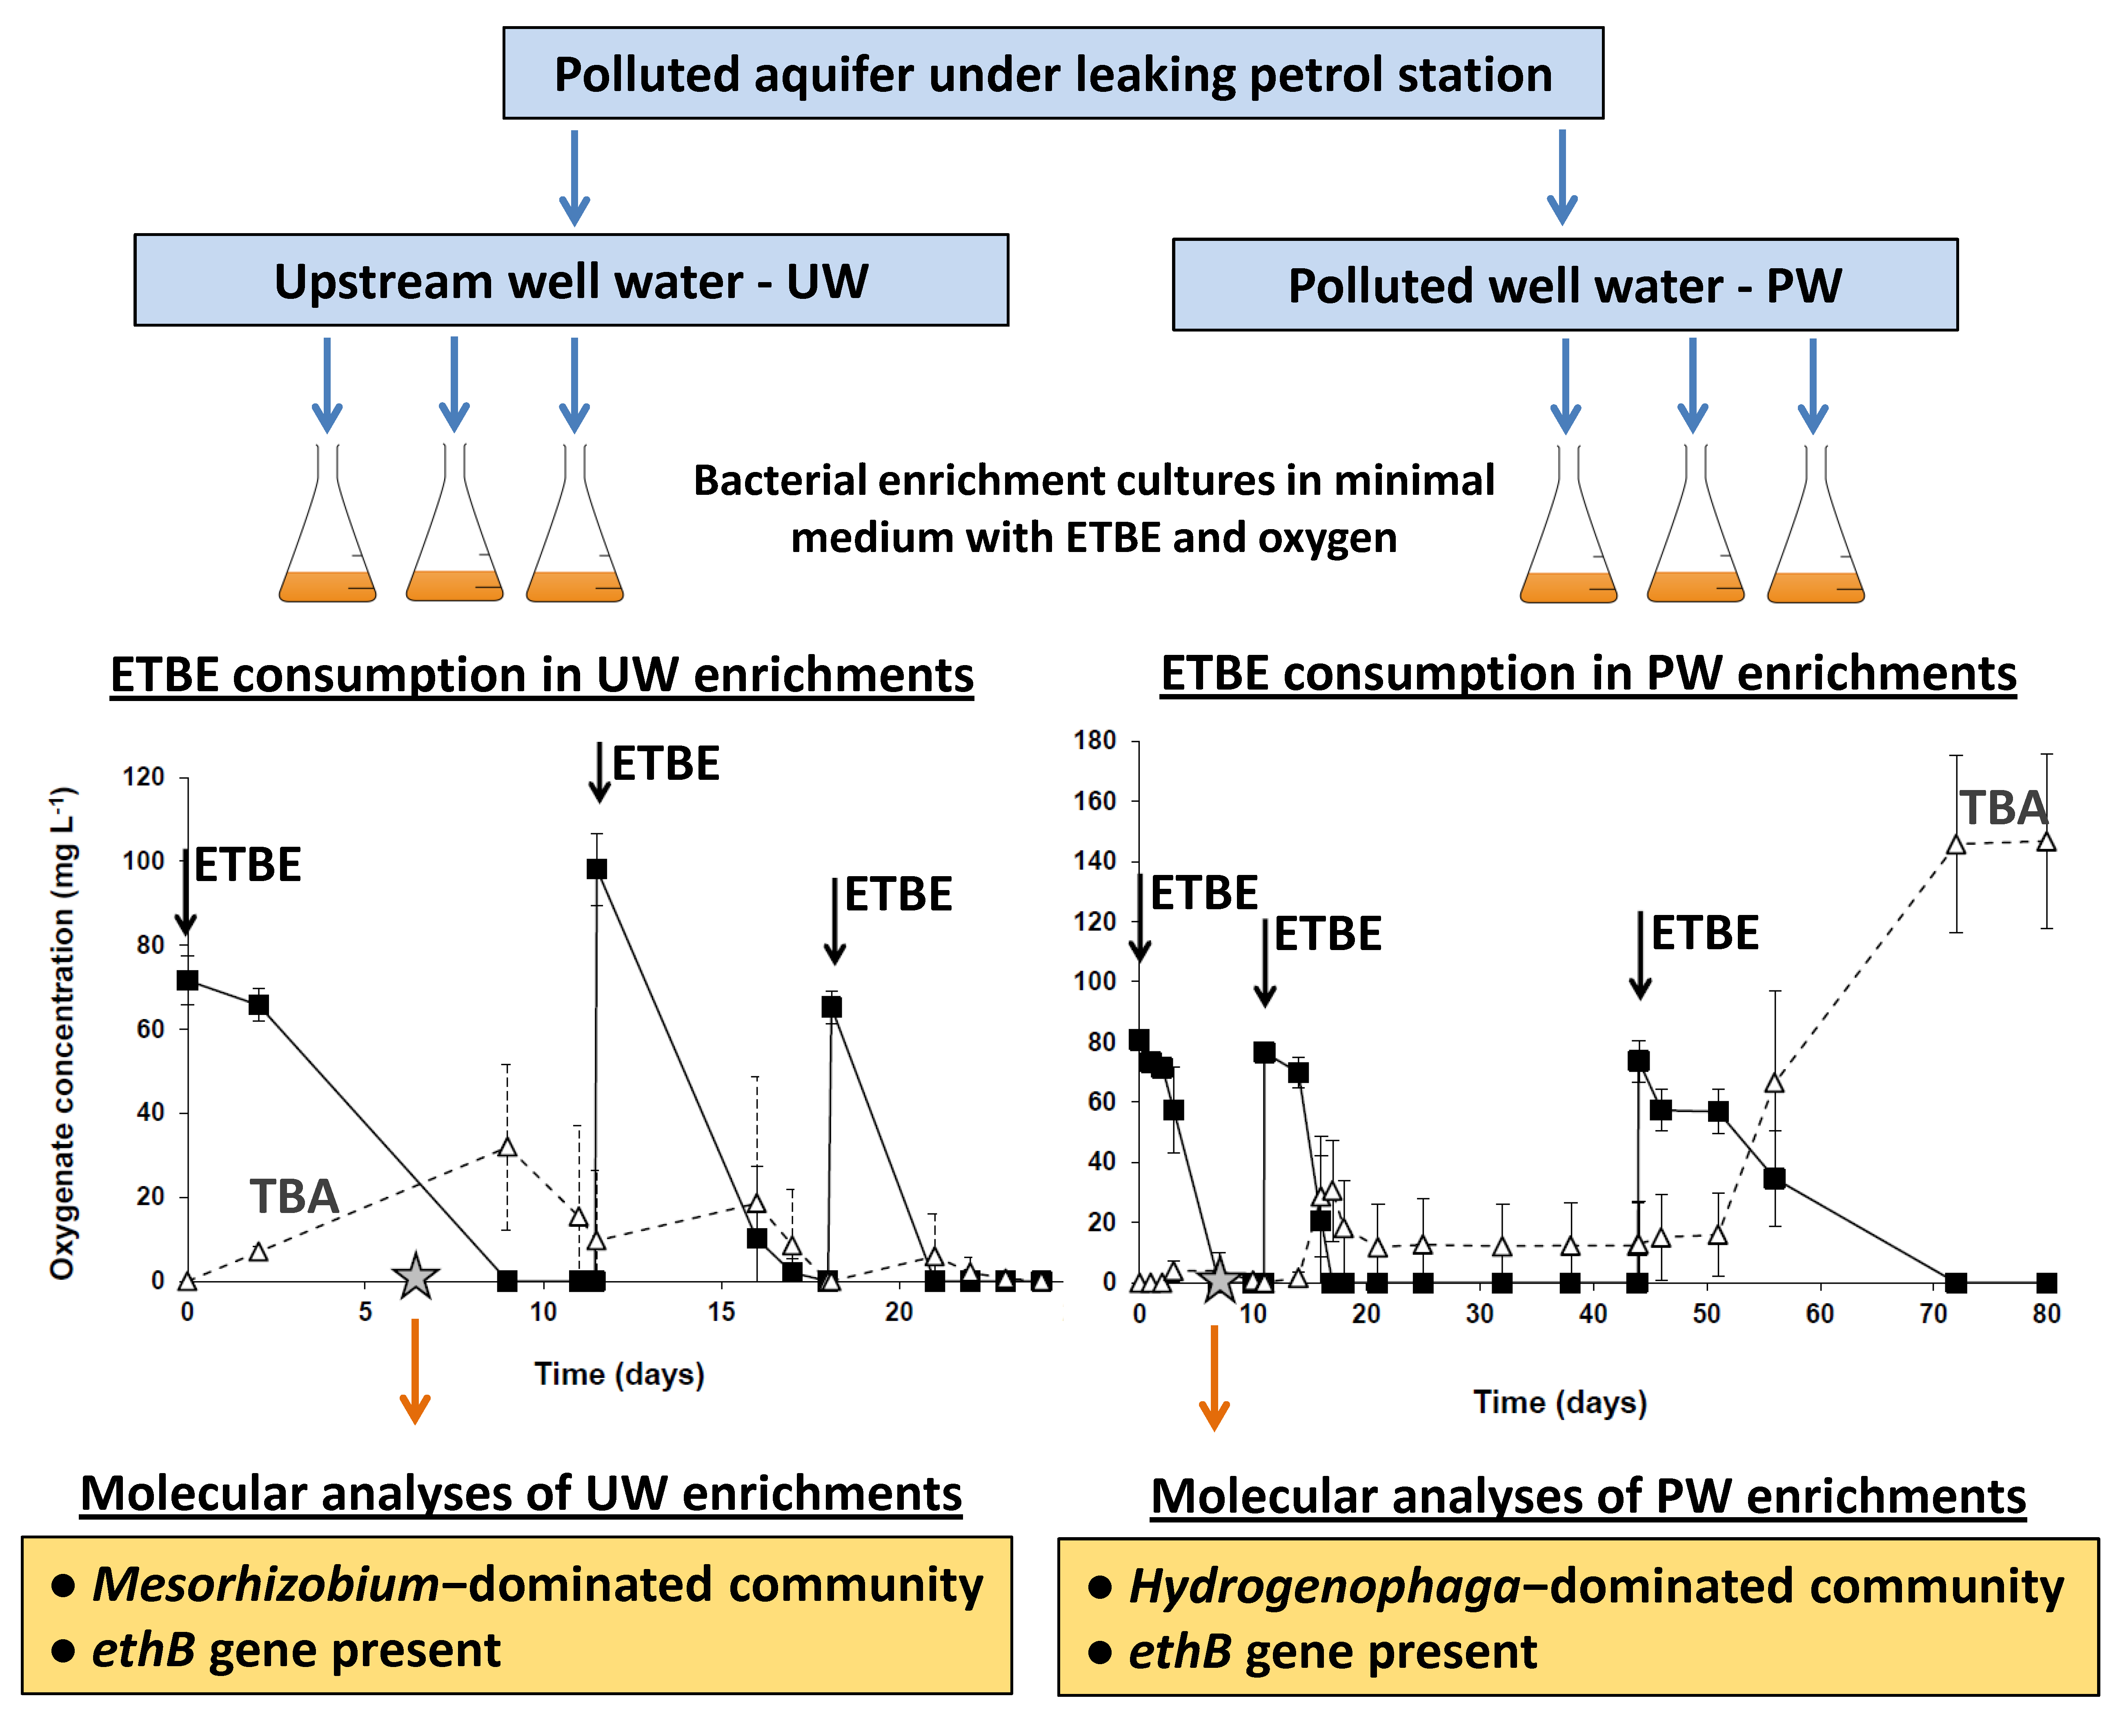
3.2. ETBE Biodegradation Potential in the ETBE Enrichments from the Upstream and the Polluted Well

Both UW and PW initial enrichment cultures degraded ETBE, though the initial enrichment cultures from UW showed heterogeneous biodegradation characteristics (i.e., the time after which the biodegradation occurred and whether they accumulated TBA in the course of ETBE degradation; Figure S1). One of the initial enrichment cultures from each well that showed a complete biodegradation of at least two doses of 100 mg/L ETBE, was then used to establish the enrichment subcultures to confirm the biodegradation capacities and to measure the ETBE biodegradation rates (Figure S1). The mean biodegradation rates in the UW and PW subcultures were 19.6 and 24.7 mg ETBE L−1 × d−1, respectively (Figure S5). TBA accumulated only transiently during ETBE biodegradation in UW subcultures (Figure S5A ) and reached a maximum concentration of 53.9 mg/L during the first ETBE dose degradation. In contrast, TBA concentrations increased with time in all PW subcultures, reaching a maximum of 180.3 mg/L after the consumption of the third ETBE dose (Figure S5B).

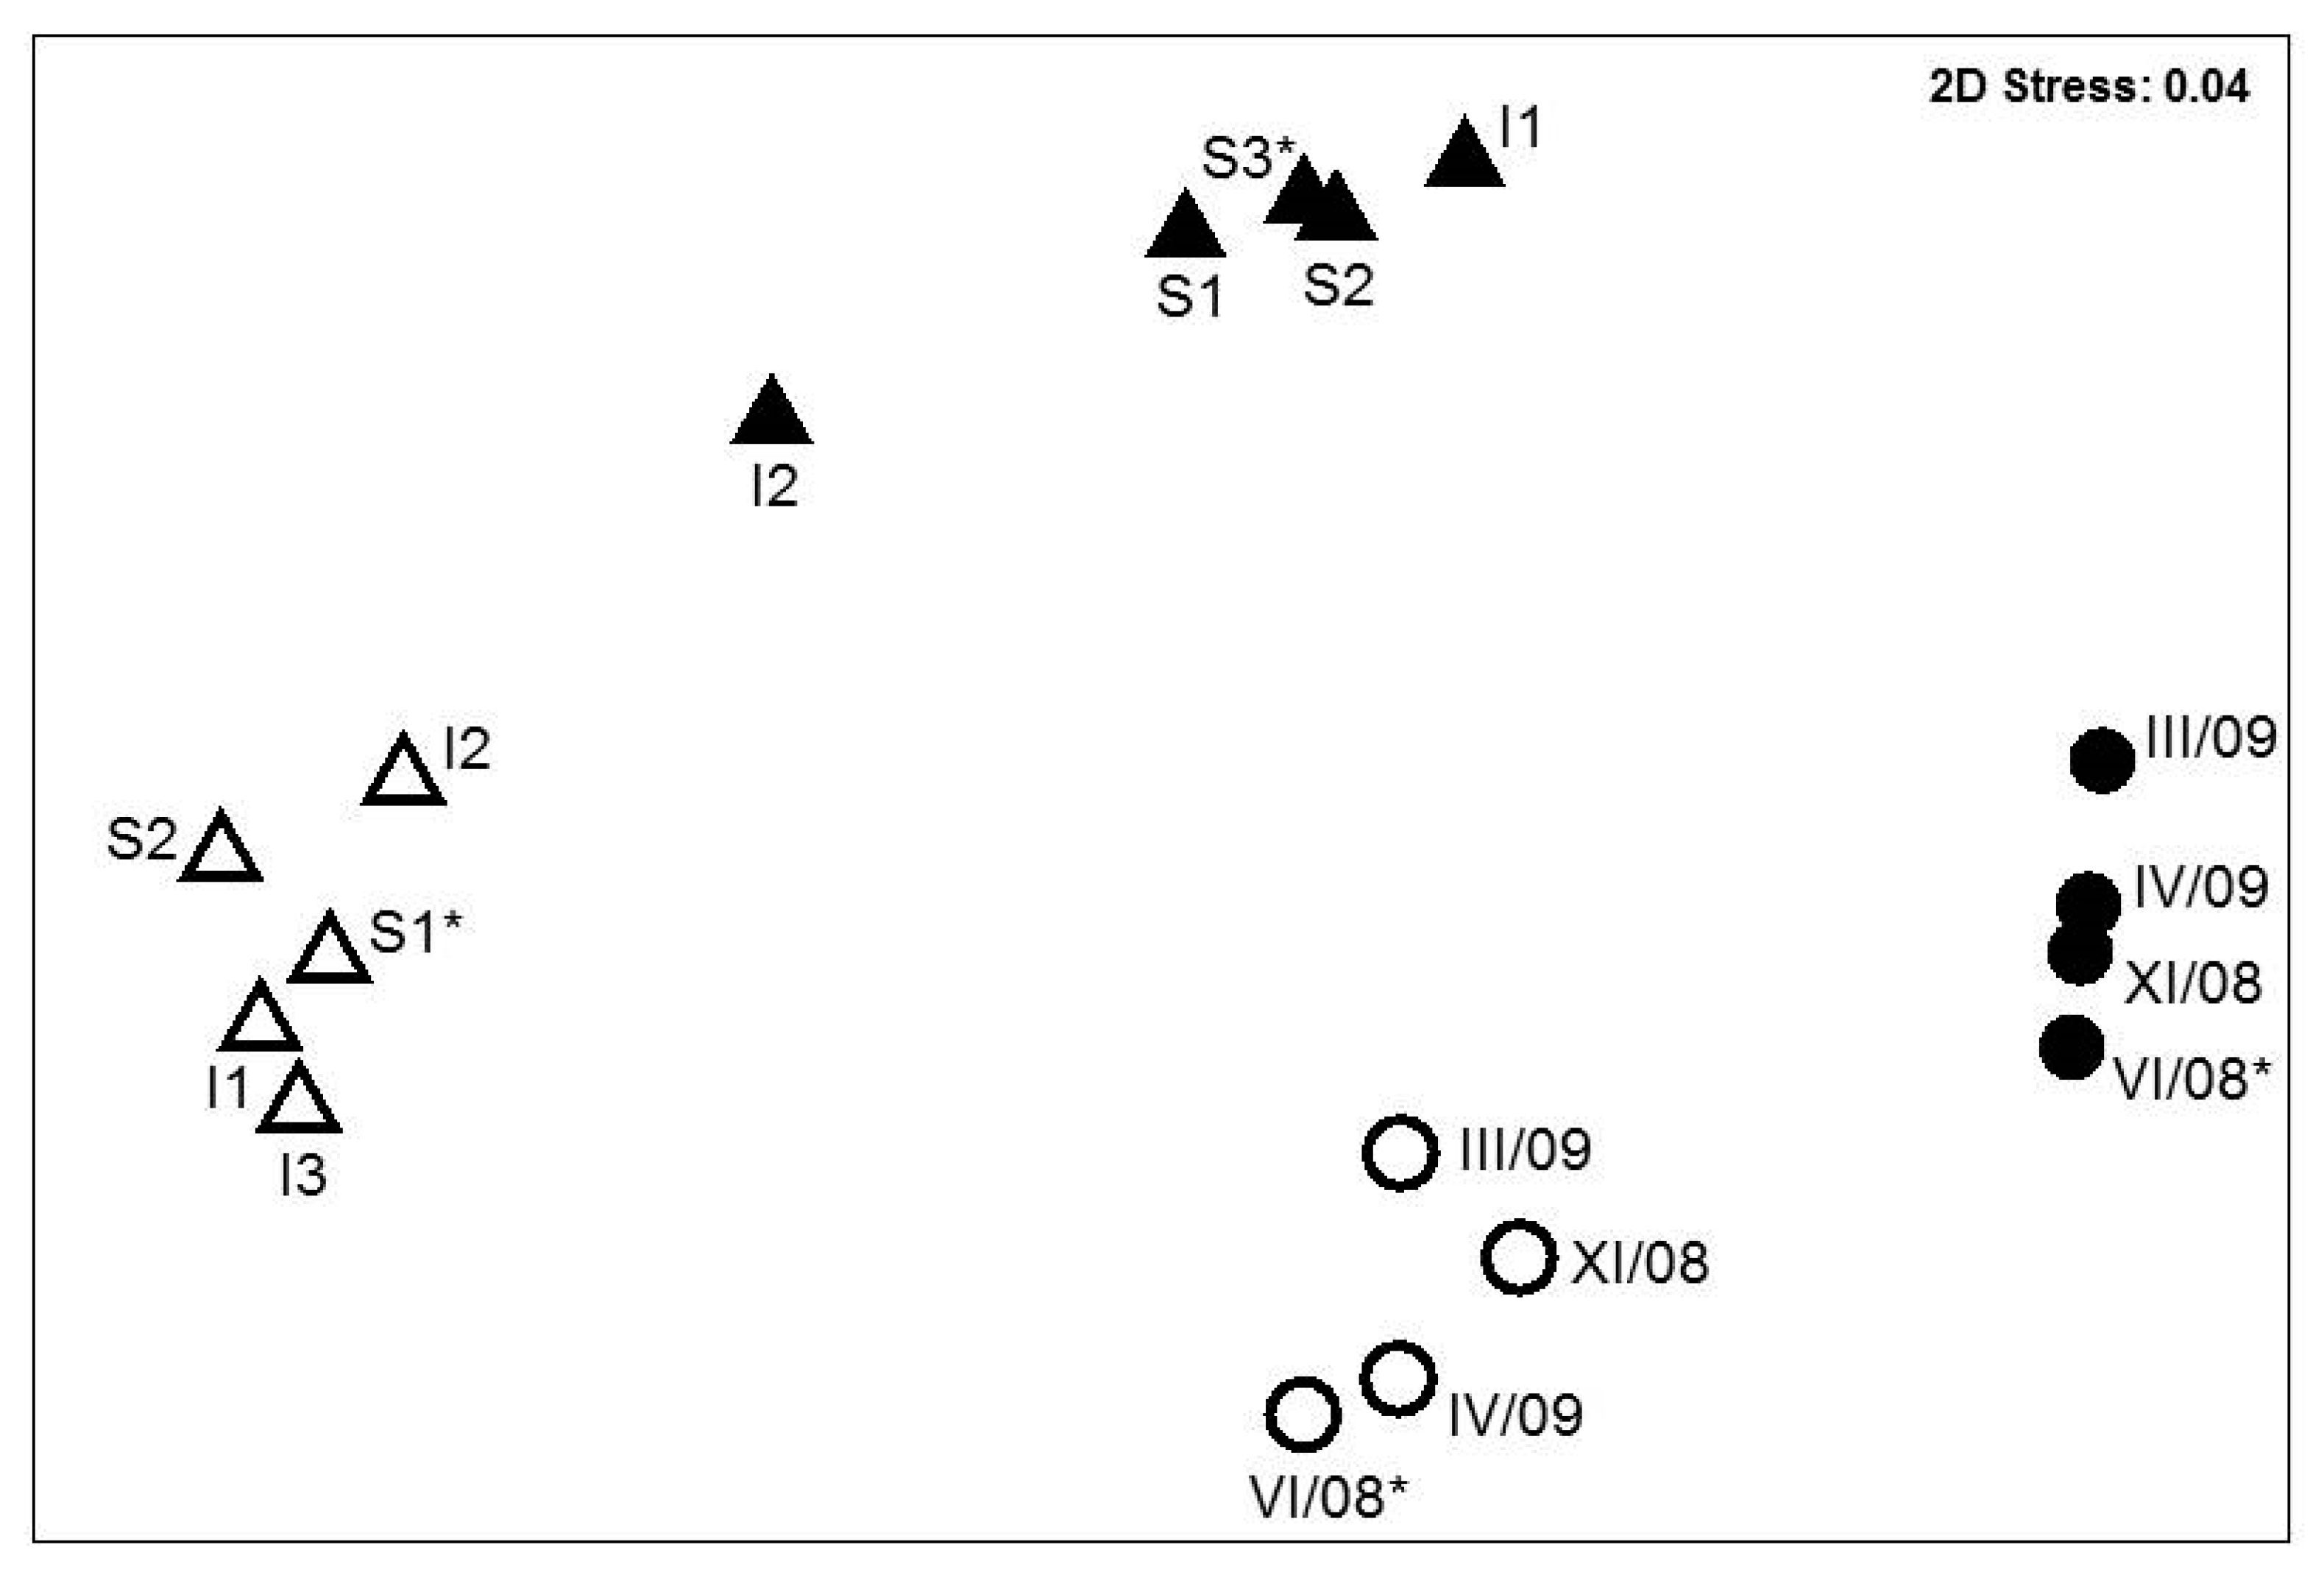
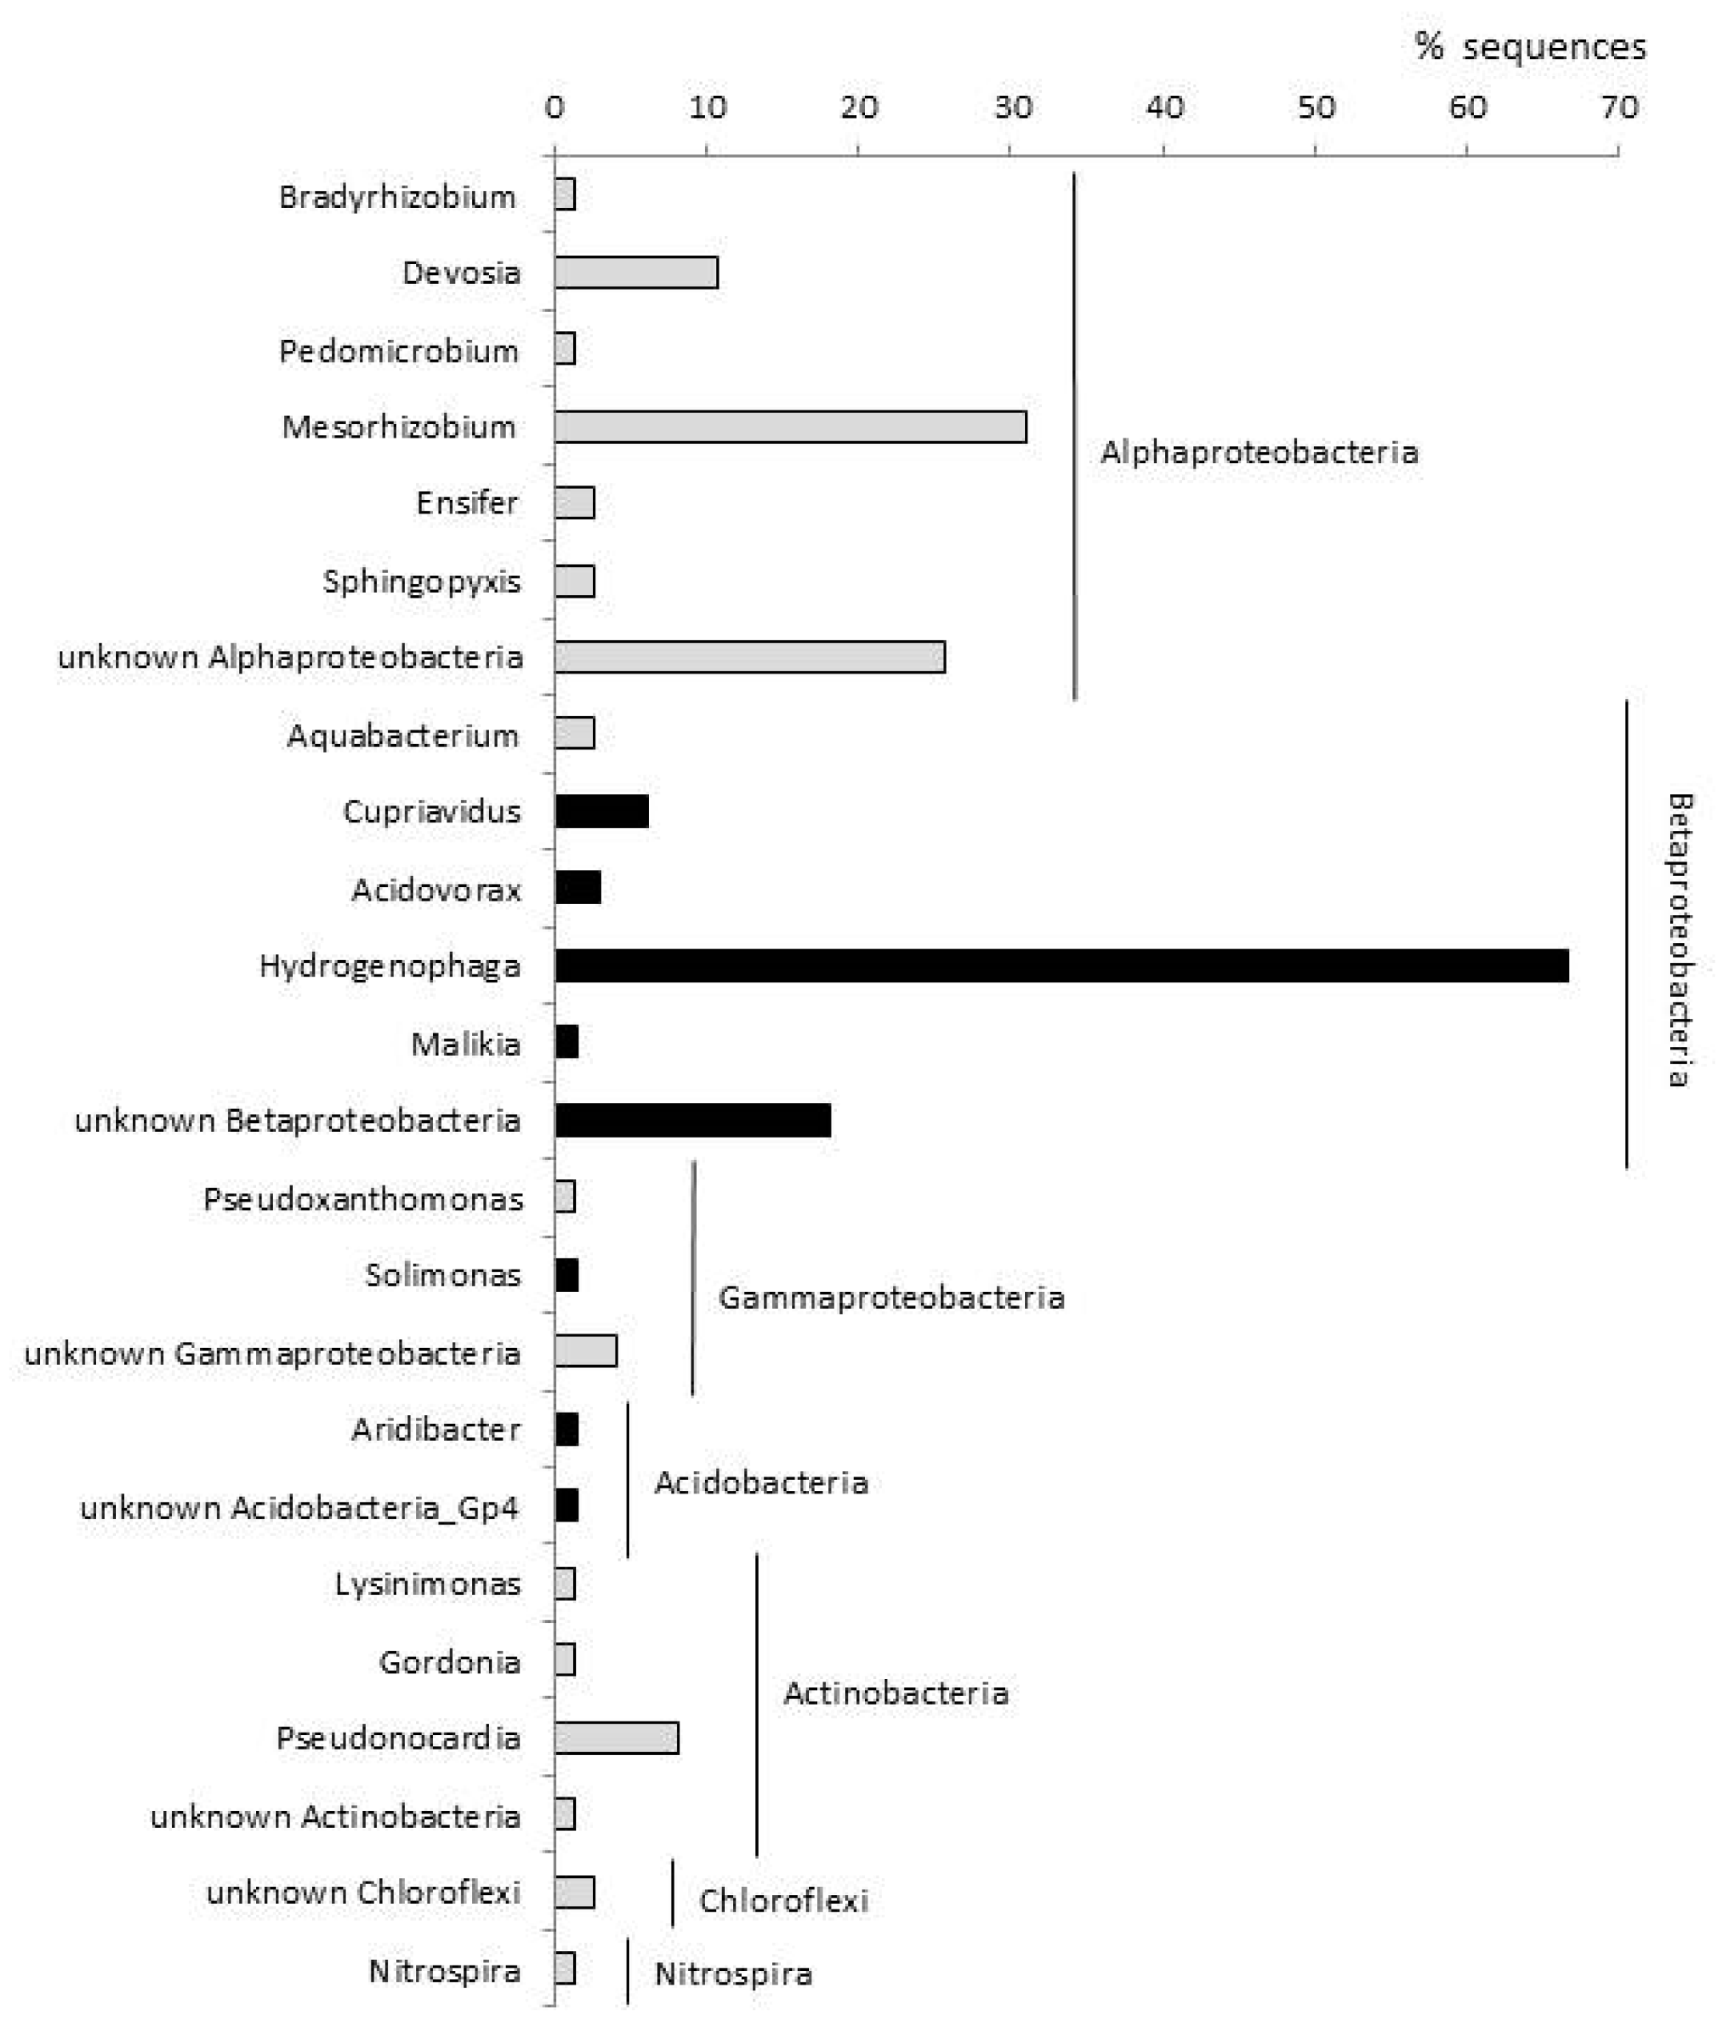
3.3. Bacterial Communities in the ETBE-Enrichment Cultures

The microarray analysis of the ETBE-enrichment communities originating from UW and PW wells revealed that they differed significantly from the corresponding water communities as well as from each other (Figure 1; ANOSIM, P < 0.01 in all cases). There was no convergence between the ETBE-enrichment communities originating from UW and PW (Figure 1). The initial enrichment cultures and the subcultures originating from the same well grouped together, showing little turnover in the course of the experiment. Also, the three initial enrichment cultures from UW grouped together (Figure 1), despite their distinct biodegradation rates and differences in their TBA biodegradation potential (Figure S1).
SIMPER analysis together with Wilcoxon rank sum tests showed which probes significantly (P < 0.05) contributed to up to 50% differences in bacterial community composition between UW- and PW-enrichment cultures (Figure S2). Notably, the enrichments (initial cultures and subcultures grouped together) from PW, in comparison to the UW enrichments, had higher signals for probes targeting Betaproteobacteria belonging to Hydrogenophaga (HyMa2, HydETBE1, HydETBE3), Nitrosospira (Nit1B, Nit1C), Variovorax (Varpar) and Aquabacterium (Aquacln2), Gammaproteobacteria Nitrosococcus (Nibmob) and Eikenella/Neisseria (Eikcor2), and Paenibacillus (Palv, Palv2; Firmicutes). In contrast, the UW enrichment cultures had higher signals for probes targeting Alphaproteobacteria from the family Rhizobiaceae (Rhizo157, Rhi) related to Mesorhizobium/Rhizobium/Devosia (Phyllobact, Mesocln1, Davocln1), from Actinobacteria Pseudonocardia (Psdonoca), Gordonia (Gordcln3) and Mycobacterium (Mycoba2), and from Chloroflexi (Dehacln5, Dehacln6), as compared to PW enrichments. These probes distinguishing the UW and PW enrichments also significantly contributed to the differences between the enrichments and their respective initial water samples (Figure S2). Though there were no overall differences in the community composition between the three initial ETBE enrichment cultures from UW (Figure 1), it is interesting to note that the enrichment culture I3, which showed only a slight ETBE biodegradation activity at the time of sampling, lacked signal from the probe Mesocln1 for Mesorhizobium (Figure S2).
There was no significant difference in bacterial community composition between the enrichments that completely degraded ETBE and those that degraded ETBE but accumulated TBA, based on ANOSIM analysis of microarray data. When individual probes were analyzed with Wilcoxon rank sum tests (P < 0.05), only XAX818 (for Xanthomonas) gave significantly higher signals in the enrichments that showed a complete ETBE degradation, while Ralstcln2 (for Ralstonia/Cupriavidus/Wautersia, including certain clones from UW) gave significantly lower signals.
The dominating taxa in the two ETBE-enrichment subculture communities originating from UW and PW that were able to degrade ETBE were further studied by sequencing the 16S rRNA gene. The diversity in the UW ETBE-enrichment subculture S1 was higher (Shannon index 2.23 and 26 estimated OTUs) than the diversity in the PW ETBE-enrichment subculture S3 (Shannon index 1.03, 7 estimated OTUs) (Figure S3). As far as could be concluded from the number of analyzed clones, no genus was shared by the two enrichment subcultures (Figure 2). According to the 16S rRNA gene-sequencing, the UW ETBE-subculture community was enriched in alphaproteobacterial taxa different from those found in the well water community, with prevailing Mesorhizobium clones (31% of all clones) (Figure 2). Phylogenetic analysis (Figure S6) showed that the putative Mesorhizobium strains were diverse, with one sequence close to M. plurifarium, two sequences close to M. loti et M. ciceri and 33 sequences clustering apart from the established Mesorhizobium species. Besides, the presence of Betaproteobacteria, Gammaproteobacteria, Actinomycetes, Chloroflexi and Nitrospira was confirmed by 16S rRNA gene-sequencing in the UW ETBE-enrichment subculture S1. The ETBE-enrichment subculture S3 from PW was dominated by Betaproteobacteria differing from those found in PW water, mainly by Hydrogenophaga (67% of all clones) (Figure 2). The Hydrogenophaga sequences, clustering apart from the established Hydrogenophaga species, showed little diversity (Figure S7) and the majority of sequences were identical to the Hydrogenophaga sp. Rs71 found in a BTEX-enrichment culture from a gasoline-contaminated site in the UK [41]. Acidovorax and three unknown clades of Betaproteobacteria (with the closest relatives identified by BLAST as Hydrogenophaga, Cupriavidus and Ralstonia at about 95% sequence identity levels), as well as a few Gammaproteobacteria and Acidobacteria were also found in the PW ETBE-enrichment subculture S3.
The prevailing taxa in the PW and UW ETBE-enrichment subcultures, according to 16S rRNA gene sequencing, were targeted by the probes HydETBE3 and HydETBE1 (for Hydrogenophaga) and Mesocln1 (for Mesorhizobium). Based on signals from these probes, Hydrogenophaga was also detected in UW and PW water, while Mesorhizobium was not detected in any water sample.

3.4. Genetic Diversity of the ethB Gene

The ethB gene primers we used generated a positive signal in PW water and in ETBE-enrichment subcultures originating from both UW and PW. In PW water, however, the PCR product was obtained only after re-amplification of the first PCR reaction, indicating that the abundance of ethB targeted by these primers in PW water was low. All efforts to amplify ethB from UW water samples were unsuccessful. All obtained ethB sequences shared about 99% identity. Based on nucleotide blast, they were highly similar (99% identity) to ethB genes of R. ruber IFP2007 (accession number FJ481920), R. zopfii (FJ481919), Rhodococcus sp. PEG604 (DQ847178), Mycobacterium sp. IFP2009 (FJ481921) and Aquincola tertiaricarbonis L108 (KC333876), and had a high G+C content (about 68%). The ethB sequences recovered from UW ETBE-enrichment subculture S1 could be distinguished by phylogenetic analysis from those recovered from PW ETBE-enrichment subculture S3, but the bootstrap value was low (i.e., 47; Figure 3). The sequences obtained from PW water clustered together either with UW ETBE-enrichment subculture S1 sequences or with PW ETBE-enrichment subculture S3 sequences or separately. However, none of the sequences recovered from the ETBE-enrichment subcultures was 100% identical to those recovered from PW water.

4. Discussion

We used aerobic enrichment cultures with ETBE as sole source of carbon to reveal the potential for aerobic ETBE degradation at the studied aquifer, and to identify ETBE-degrading consortia. Water from two wells, one from the anoxic plume of the aquifer, and one situated upstream the polluted zone were used to establish the enrichment cultures. Distinct consortia with ETBE-biodegradation potential could establish from the two wells. Moreover, the ethB gene was distributed independently of the communities’ taxonomic composition. From an ecological perspective, these results highlight the importance of the so-called rare biosphere as a potential reservoir of ETBE degraders.
This work has been done in a context of a large bioremediation study on a gasoline-polluted aquifer, where bacterial communities and chosen biodegradation genes were monitored in situ over time, using a high-throughput taxonomic microarray and PCR of functional genes (not shown). The microarray has been previously developed to target 19 bacterial phyla at different taxonomic levels [34,39], and it was implemented with 68 new probes targeting uncultured bacteria from the studied aquifer as well as known ETBE and MTBE degrading isolates. The microarray has been previously validated with sequencing and qPCR. It has been shown that the microarray was semi-quantitative, enabling between-sample comparisons based on signal intensities from individual probes [33,38,42]. Between-probe comparisons (i.e., between-taxon comparisons) are, however, not quantitative. Therefore, we used cloning-sequencing of chosen samples to reveal the main taxa present. Though both methods bring some bias due to PCR, there was a good agreement between the two methods concerning the presence of bacterial taxa. Not surprisingly, microarray revealed some taxa that were not shown by cloning-sequencing, which is consistent with its higher sensitivity [42].
This study has shown that the bacterial community in the polluted well, compared to the upstream well, had a reduced diversity, which is consistent with previous studies on BTEX contaminated sites [41,43]. It was enriched in Betaproteobacteria and in anaerobe-like taxa, in line with the anaerobic character of the well (Table 1). Similar results were obtained with water from other wells situated in the plume (not shown). The depletion of oxygen in BTEX-contaminated sites is a common state and the redox potential seems to be the main factor driving the composition of bacterial communities in such sites [44]. Despite the distinct initial conditions, ETBE-degrading consortia could be established from water of both aerobic unpolluted well and the anaerobic polluted well.
Comparison of the original aquifer communities with their respective enrichment cultures showed that the biodegradation consortia might represent only a minor part of the original aquifer community. Deeper techniques such as next-generation sequencing could be helpful to estimate the relative abundance of the rare taxa in original aquifer samples. The failure of biostimulation approach (either oxygen or oxygen and salt addition) in further laboratory experiments with polluted water from the studied aquifer [4] confirms the scarcity of the ETBE-degrading bacteria. In contrast, bioaugmentation using the UW ETBE-enrichment culture characterized in this study led to the complete ETBE biodegradation of polluted water under laboratory conditions at 15 °C, which is the mean aquifer temperature [4].
The taxonomical composition of the enrichment communities did not reflect their biodegradation potential. On the one hand, the initial ETBE-enrichment cultures from the UW had very similar taxonomical composition, while they differed in their capacity of ETBE and TBA degradation. On the other hand, enrichment cultures from UW and PW that degraded ETBE were composed by completely distinct bacterial taxa. These results highlight the high degree of functional redundancy of the aquifer and enrichment communities. The lack of convergence in bacterial community composition in contaminated aquifers or soils was also noted in other studies [44,45], indicating that distinct consortia with the same functional properties may be present at one site. Consequently, similarities in taxonomical composition of ETBE-degrading bacterial consortia from different studies and sites can be seen only on high taxonomic levels. Alpha-, Beta- and Gammaproteobacteria, Actinobacteria, Acidobacteria and Chloroflexi are reported in this and other studies [12,22], prompting to search candidate biodegrading bacteria within these groups.
We did not aim to test individual strains from ETBE-enrichment cultures for their biodegradation potential, it is worth noting, however, that several bacterial genera that include strains with ETBE-biodegradation properties such as Mycobacterium, Pseudonocardia and Variovorax were detected in the ETBE-enrichment cultures by microarray. Pseudonocardia was additionally confirmed in UW ETBE-enrichment culture by sequencing. It is not known whether the Mesorhizobium and Hydrogenophaga spp. dominating in the UW and PW ETBE-enrichment clone libraries, respectively, were involved in the initial ETBE oxygenation step or in the degradation of other compounds occurring in the course of ETBE biodegradation, such as TBA. A slight ETBE- (and no TBA-) degradation capacity was reported once in an isolate of Mesorhizobium from a bacterial enrichment culture degrading mixture of hydrocarbons and gasoline additives [46]. Mesorhizobium spp. were also detected in three out of five ETBE-enrichments originating from different aquifers in the study of Le Digabel et al. [12], and once they even reached the relative abundance of 22%, but no ETBE-degrading strain was obtained in their study. ETBEdegradation was never reported in Hydrogenophaga, although one Hydrogenophaga strain (ENV735) was shown to be able to degrade MTBE and TBA [47]. Hydrogenophaga was suggested to have the main role in MTBE biodegradation in the presence of BTEX [48], while it was considered only as an accompanying microflora in a MTBE-enrichment culture from a gasoline-polluted site [49]. In our study, Hydrogenophaga was enriched from the BTEX-polluted plume of the aquifer and its ability to degrade oxygenates merits further studies.
The successful amplification of ethB genes from both types of enrichments as well as from the polluted well confirms that the gene ethB is a good candidate for an in situ marker of the ETBE biodegradation potential, as suggested in [4]. The great level of conservation observed for the ethB gene obtained from highly distinct bacterial communities and consortia noticed in this study further indicates that this gene may be horizontally transferred among different hosts. The natural diversity of ethB may, however, remain hidden as the currently used ethB primers [7] are based on only three sequences. Indeed, van der Waals et al. [22] did not detect ethB, when using primers based on A. tertiaricarbonis L108 sequence [50], in their ETBE-degrading cultures from polluted groundwater, despite the fact that ETBE-degradation was shown to be cytochrome P450-dependent. Besides the possibility that other than EthABCD system was involved, it is also conceivable that the primers used had not enough sequence complementarity with the ethB gene present. We suggest that ethB gene diversity, abundance and expression should be taken into consideration when evaluating in situ potential for ETBE degradation.

5. Conclusions

The functional redundancy of ETBE-degrading bacterial consortia observed in this work shows that the taxonomical composition provides little information regarding potential for the ETBE degradation at a given site, while the gene ethB appears to be a good indicator of ETBE-degradation potential for further in situ operations.

Supplementary Materials

The following are available online at https://www.mdpi.com/2076-3417/9/20/4247/s1, Figure S1: A simplified overview of the ETBE-enrichment cultures from PW and UW water and their biodegradation properties, Figure S2: Microarray comparisons of bacterial communities between PW and UP water, PW water and PW ETBE-enrichments, UP water and UP ETBE-enrichments, and PW ETBE-enrichments and UW ETBE-enrichments, Figure S3: Analysis of the 16S rRNA gene diversity in UW and PW water and ETBE-enrichment subcultures based on cloning-sequencing, Figure S4: Comparison of UW and PW water bacterial communities by 16S rRNA gene sequencing, Figure S5: Degradation of ETBE and TBA in UW ETBE-enrichment subcultures S1–S3 and PW ETBE-enrichment subcultures S1–S3, Figure S6: Phylogeny analysis of 16S rRNA clones from the UW ETBE-enrichment subculture S1, Figure S7: Phylogeny analysis of 16S rRNA clones from the PW ETBE-enrichment subculture S3, Table S1: List of new microarray probes designed in this study and their targets.

Author Contributions

Conceptualization, M.K., J.F.S., A.D., Y.B. and G.L.G. Methodology, M.K., J.F.S., Y.B. and G.L.G.; Validation, M.K., Y.B. and G.L.G.; Formal Analysis, M.K.; Investigation, M.K., J.F.S. and Y.B.; Resources, A.D., Y.B. and G.L.G.; Data Curation, M.K.; Writing–Original Draft Preparation, M.K. and G.L.G.; Visualization, M.K.; Supervision, A.D. and G.L.G.; Project Administration, A.D.; Funding Acquisition, A.D.

Funding

This work was funded by the project TISATIE (Traitements in situ alternatifs: Traçabilité, Innocuité, Efficacité: Application aux polluants pétroliers type MTBE, ETBE), funded by VALORSITES AXELERA, a French competitiveness cluster.

Acknowledgments

We thank Jacqueline Haurat (CNRS, UMR5557, Écologie Microbienne; Villeurbanne; France), and Jean Philippe Tracol (SERPOL; Vénissieux, France) and SERPOL technical team for technical help.

Conflicts of Interest

The authors declare no conflict of interest.

References

  1. Lopes Ferreira, N.; Malandain, C.; Fayolle-Guichard, F. Enzymes and genes involved in the aerobic biodegradation of methyl tert-butyl ether (MTBE). Appl. Microbiol. Biot. 2006, 72, 252–262. [Google Scholar] [CrossRef] [PubMed]
  2. Rosell i Linares, M. Vigilencia Ambiental de Metil Tert-Butil eer (MTBE) un Additiu de la Gasolina en Aigües i Sols. Ph.D. Thesis, Université de Barcelone Faculté de Chimie, Barcelona, Spain, July 2006. [Google Scholar]
  3. Hyman, M. Biodegradation of gasoline ether oxygenates. Curr. Opin. Biotechnol. 2013, 24, 443–450. [Google Scholar] [CrossRef] [PubMed]
  4. Fayolle-Guichard, F.; Durand, J.; Cheucle, M.; Rosell, M.; Michelland, R.J.; Tracol, J.P.; Le Roux, F.; Grundmann, G.; Atteia, O.; Richnow, H.H.; et al. Study of an aquifer contaminated by ethyl tert-butyl ether (ETBE): Site characterization and on-site bioremediation. J. Hazard. Mater. 2012, 201, 236–243. [Google Scholar] [CrossRef] [PubMed]
  5. Fayolle, F.; Hernandez, G.; Le Roux, F.; Vandecasteele, J.P. Isolation of two aerobic strains that degrade efficiently ethyl t-butyl ether (ETBE). Biotechnol. Lett. 1998, 20, 283–286. [Google Scholar] [CrossRef]
  6. Kharoune, M.; Kharoune, L.; Lebeault, J.M.; Pauss, A. Isolation and characterization of two aerobic bacterial strains that completely degrade ethyl tert-butyl ether (ETBE). Appl. Microbiol. Biot. 2001, 55, 348–353. [Google Scholar] [CrossRef] [PubMed]
  7. Béguin, P.; Chauvaux, S.; Miras, I.; Francois, A.; Fayolle, F.; Monot, F. Genes involved in the degradation of ether fuels by bacteria of the Mycobacterium/Rhodococcus group. Oil Gas Sci. Technol. 2003, 58, 489–495. [Google Scholar] [CrossRef]
  8. Müller, R.H.; Rohwerder, T.; Harms, H. Degradation of fuel oxygenates and their main intermediates by Aquincola tertiaricarbonis L108. Microbiology 2008, 154, 1414–1421. [Google Scholar] [CrossRef] [PubMed]
  9. Auffret, M.; Labbé, D.; Thouand, G.; Greer, C.W.; Fayolle-Guichard, F. Degradation of a mixture of hydrocarbons, gasoline, and diesel oil additives by Rhodococcus aetherivorans and Rhodococcus wratislaviensis. Appl. Environ. Microbiol. 2009, 75, 7774–7782. [Google Scholar] [CrossRef]
  10. McKelvie, J.R.; Hyman, M.R.; Elsner, M.; Smith, C.; Aslett, D.M.; Lacrampe-Couloume, G.; Lollar, B.S. Isotopic fractionation of methyl tert-butyl ether suggests different initial reaction mechanisms during aerobic biodegradation. Environ. Sci. Technol. 2009, 43, 2793–2799. [Google Scholar] [CrossRef]
  11. Le Digabel, Y.; Demanèche, S.; Benoit, Y.; Vogel, T.M.; Fayolle-Guichard, F. Ethyl tert-butyl ether (ETBE) biodegradation by a syntrophic association of Rhodococcus sp. IFP 2042 and Bradyrhizobium sp. IFP 2049 isolated from a polluted aquifer. Appl. Microbiol. Biot. 2013, 97, 10531–10539. [Google Scholar] [CrossRef]
  12. Le Digabel, Y.; Demanèche, S.; Benoit, Y.; Fayolle-Guichard, F.; Vogel, T.M. Ethyl tert-butyl ether (ETBE)-degrading microbial communities in enrichments from polluted environments. J. Hazard. Mater. 2014, 279, 502–510. [Google Scholar] [CrossRef] [PubMed]
  13. Bombach, P.; Nägele, N.; Rosell, M.; Richnow, H.H.; Fischer, A. Evaluation of ethyl tert-butyl ether biodegradation in a contaminated aquifer by compound-specific isotope analysis and in situ microcosms. J. Hazard. Mater. 2015, 286, 100–106. [Google Scholar] [CrossRef]
  14. Van der Waals, M.J.; Pijls, C.; Sinke, A.J.; Langenhoff, A.A.; Smidt, H.; Gerritse, J. Anaerobic degradation of a mixture of MtBE, EtBE, TBA, and benzene under different redox conditions. Appl. Microbiol. Biot. 2018, 102, 3387–3397. [Google Scholar] [CrossRef] [Green Version]
  15. Chauvaux, S.; Chevalier, F.; Le Dantec, C.; Fayolle, F.; Miras, I.; Kunst, F.; Beguin, P. Cloning of a genetically unstable cytochrome P-450 gene cluster involved in degradation of the pollutant ethyl tert-butyl ether by Rhodococcus ruber. J. Bacteriol. 2001, 183, 6551–6557. [Google Scholar] [CrossRef]
  16. Malandain, C.; Fayolle-Guichard, F.; Vogel, T.M. Cytochromes P450-mediated degradation of fuel oxygenates by environmental isolates. FEMS Microbiol. Ecol. 2010, 72, 289–296. [Google Scholar] [CrossRef] [PubMed] [Green Version]
  17. Mikesková, H.; Novotný, Č.; Svobodová, K. Interspecific interactions in mixed microbial cultures in a biodegradation perspective. Appl. Microbiol. Biot. 2012, 95, 861–870. [Google Scholar] [CrossRef] [PubMed]
  18. Schmidt, T.C.; Schirmer, M.; Weiss, H.; Haderlein, S.B. Microbial degradation of methyl tert-butyl ether and tert-butyl alcohol in the subsurface. J. Contam. Hydrol. 2004, 70, 173–203. [Google Scholar] [CrossRef] [PubMed]
  19. Babé, A.; Labbé, D.; Monot, F.; Greer, C.; Fayolle-Guichard, F. Biodegradability of Oxygenates by Microflora from MTBE-Contaminated Sites: New Molecular Tools. In Fuel Oxygenates. The Handbook of Environmental Chemistry; Barceló, D., Ed.; Springer: Berlin/Heidelberg, Germany, 2007. [Google Scholar]
  20. Lin, C.W.; Tsai, S.L.; Hou, S.N. Effects of environmental settings on MTBE removal for a mixed culture and its monoculture isolation. Appl. Microbiol. Biot. 2007, 74, 194–201. [Google Scholar] [CrossRef]
  21. Kharoune, M.; Kharoune, L.; Lebeault, J.M.; Pauss, A. Aerobic degradation of ethyl-tert-butyl ether by a microbial consortium: Selection and evaluation of biodegradation ability. Environ. Toxicol. Chem. 2002, 21, 2052–2058. [Google Scholar] [CrossRef]
  22. Van der Waals, M.J.; Plugge, C.; Meima-Franke, M.; de Waard, P.; Bodelier, P.L.; Smidt, H.; Gerritse, J. Ethyl tert-butyl ether (EtBE) degradation by an algal-bacterial culture obtained from contaminated groundwater. Water Res. 2019, 148, 314–323. [Google Scholar] [CrossRef]
  23. Piveteau, P.; Fayolle, F.; Vandecasteele, J.P.; Monot, F. Biodegradation of tert-butyl alcohol and related xenobiotics by a methylotrophic bacterial isolate. Appl. Microbiol. Biot. 2001, 55, 369–373. [Google Scholar] [CrossRef] [PubMed]
  24. Pospiech, A.; Neumann, B. A versatile quick-prep of genomic DNA from gram-positive bacteria. Trends Genet. 1995, 66, 217–218. [Google Scholar] [CrossRef]
  25. Bruce, K.D.; Hiorns, W.D.; Hobman, J.L.; Osborn, A.M.; Strike, P.; Ritchie, D.A. Amplification of DNA from native populations of soil bacteria by using the polymerase chain-reaction. Appl. Environ. Microbiol. 1992, 58, 3413–3416. [Google Scholar] [PubMed]
  26. Sanguin, H.; Herrera, A.; Oger-Desfeux, C.; Dechesne, A.; Simonet, P.; Navarro, E.; Vogel, T.M.; Moënne-Loccoz, Y.; Nesme, X.; Grundmann, G.L. Development and validation of a prototype 16S rRNA-based taxonomic microarray for Alphaproteobacteria. Environ. Microbiol. 2006, 8, 289–307. [Google Scholar] [CrossRef]
  27. Huber, T.; Faulkner, G.; Hugenholtz, P. Bellerophon: A program to detect chimeric sequences in multiple sequence alignments. Bioinformatics 2004, 20, 2317–2319. [Google Scholar] [CrossRef] [PubMed]
  28. Wang, Q.; Garrity, G.M.; Tiedje, J.M.; Cole, J.R. Naive bayesian classifier for rapid assignment of rRNA sequences into the new bacterial taxonomy. Appl. Environ. Microbiol. 2007, 73, 5261–5267. [Google Scholar] [CrossRef]
  29. Tamura, K.; Dudley, J.; Nei, M.; Kumar, S. MEGA4: Molecular Evolutionary Genetics Analysis (MEGA) Software Version 4.0. Mol. Biol. Evol. 2007, 24, 1596–1599. [Google Scholar] [CrossRef]
  30. Kimura, M. A simple method for estimating evolutionary rate of base substitutions through comparative studies of nucleotide sequences. J. Mol. Evol. 1980, 16, 111–120. [Google Scholar] [CrossRef]
  31. Saitou, N.; Nei, M. The neighbor-joining method: A new method for reconstructing phylogenetic trees. Mol. Biol. Evol. 1987, 4, 406–425. [Google Scholar]
  32. Pommier, T.; Canback, B.; Lundberg, P.; Hagström, A.; Tunlid, A. RAMI: A tool for identification and characterization of phylogenetic clusters in microbial communities. Bioinformatics 2009, 25, 736–742. [Google Scholar] [CrossRef]
  33. Kyselková, M.; Kopecký, J.; Frapolli, M.; Défago, G.; Ságová-Marečková, M.; Grundmann, G.L.; Moënne-Loccoz, Y. Comparison of rhizobacterial community composition in soil suppressive or conducive to tobacco black root rot disease. ISME J. 2009, 3, 1127–1138. [Google Scholar] [CrossRef] [PubMed] [Green Version]
  34. Ludwig, W.; Strunk, O.; Westram, R.; Richter, L.; Meier, H.; Yadhukumar Buchner, A.; Lai, T.; Steppi, S.; Jobb, G.; Förster, W.; et al. ARB: A software environment for sequence data. Nucl. Acids Res. 2004, 32, 1363–1371. [Google Scholar] [CrossRef]
  35. Sanguin, H.; Remenant, B.; Dechesne, A.; Thioulouse, J.; Vogel, T.M.; Nesme, X.; Moënne-Loccoz, Y.; Grundmann, G.L. Potential of a 16S rRNA-based taxonomic microarray for analyzing the rhizosphere effects of maize on Agrobacterium spp. and bacterial communities. Appl. Environ. Microbiol. 2006, 72, 4302–4312. [Google Scholar] [CrossRef] [PubMed]
  36. Pruesse, E.; Quast, C.; Knittel, K.; Fuchs, B.M.; Ludwig, W.; Peplies, J.; Gloeckner, F.O. SILVA: A comprehensive online resource for quality checked and aligned ribosomal RNA sequence data compatible with ARB. Nucl. Acids Res. 2007, 35, 7188–7196. [Google Scholar] [CrossRef] [PubMed]
  37. Stralis-Pavese, N.; Sessitsch, A.; Weilharter, A.; Reichenauer, T.; Riesing, J.; Csontos, J.; Murrell, J.C.; Bodrossy, L. Optimization of diagnostic microarray for application in analysing landfill methanotroph communities under different plant covers. Environ. Microbiol. 2004, 6, 347–363. [Google Scholar] [CrossRef] [PubMed]
  38. Bouffaud, M.L.; Kyselková, M.; Gouesnard, B.; Grundmann, G.; Muller, D.; Moënne-Loccoz, Y. Is diversification history of maize influencing selection of soil bacteria by roots? Mol. Ecol. 2012, 21, 195–206. [Google Scholar] [CrossRef] [PubMed]
  39. Clarke, K.R.; Gorley, R.N. PRIMER V6: User Manual/Tutorial, PRIMER-E Plymouth; Plymouth Marine Laboratory: Plymouth, UK, 2006. [Google Scholar]
  40. Clarke, K.R. Non-parametric multivariate analyses of changes in community structure. Aust. J. Ecol. 1993, 18, 117–143. [Google Scholar] [CrossRef]
  41. Fahy, A.; McGenity, T.J.; Timmis, K.N.; Ball, A.S. Heterogeneous aerobic benzene-degrading communities in oxygen-depleted groundwaters. FEMS Microbiol. Ecol. 2006, 58, 260–270. [Google Scholar] [CrossRef] [PubMed] [Green Version]
  42. Kyselková, M.; Kopecký, J.; Ságová-Marečková, M.; Grundmann, G.L.; Moënne-Loccoz, Y. Oligonucleotide microarray methodology for taxonomic and functional monitoring of microbial community composition. Plant Soil Environ. 2009, 55, 379–388. [Google Scholar] [CrossRef]
  43. Hendrickx, B.; Dejonghe, W.; Boënne, M.; Brennerova, M.; Cernik, M.; Lederer, T.; Bucheli-Witschel, M.; Bastiaens, L.; Verstraete, W.; Top, E.M.; et al. Dynamics of an oligotrophic bacterial aquifer community during contact with a groundwater plume contaminated with benzene toluene ethylbenzene and xylenes: An in situ mesocosm study. Appl. Environ. Microbiol. 2005, 71, 3815–3825. [Google Scholar] [CrossRef]
  44. Fahy, A.; Lethbridge, G.; Earle, R.; Ball, A.S.; Timmis, K.N.; McGenity, T.J. Effects of long-term benzene pollution on bacterial diversity and community structure in groundwater. Environ. Microbiol. 2005, 7, 1192–1199. [Google Scholar] [CrossRef] [PubMed]
  45. Bundy, J.G.; Paton, G.I.; Campbell, C.D. Microbial communities in different soil types do not converge after diesel contamination. J. Appl. Microbiol. 2002, 92, 276–288. [Google Scholar] [CrossRef] [PubMed]
  46. Auffret, M.D.; Yergeau, E.; Labbé, D.; Fayolle-Guichard, F.; Greer, C.W. Importance of Rhodococcus strains in a bacterial consortium degrading a mixture of hydrocarbons, gasoline, and diesel oil additives revealed by metatranscriptomic analysis. Appl. Microbiol. Biotechnol. 2015, 99, 2419–2430. [Google Scholar] [CrossRef] [PubMed]
  47. Hatzinger, P.B.; McClay, K.; Vainberg, S.; Tugusheva, M.; Condee, C.W.; Steffan, R.J. Biodegradation of methyl tert-butyl ether by a pure bacterial culture. Appl. Environ. Microbiol. 2001, 67, 5601–5607. [Google Scholar] [CrossRef] [PubMed]
  48. Raynal, M.; Pruden, A. Aerobic MTBE biodegradation in the presence of BTEX by two consortia under batch and semi-batch conditions. Biodegradation 2008, 19, 269–282. [Google Scholar] [CrossRef]
  49. Bastida, F.; Rosell, M.; Franchini, A.G.; Seifert, J.; Finsterbusch, S.; Jehmlich, N.; Jechalke, S.; von Bergen, M.; Richnow, H.H. Elucidating MTBE degradation in a mixed consortium using a multidisciplinary approach. FEMS Microbiol. Ecol. 2010, 73, 370–384. [Google Scholar] [CrossRef] [PubMed]
  50. Schuster, J.; Purswani, J.; Breuer, U.; Pozo, C.; Harms, H.; Mï, R.H.; Rohwerder, T. Constitutive expression of the cytochrome P450 EthABCD monooxygenase system enables degradation of synthetic dialkyl ethers in Aquincola tertiaricarbonis L108. Appl. Environ. Microbiol. 2013, 79, 2321–2327. [Google Scholar] [CrossRef]
Figure 1. Multidimensional Scaling of bacterial communities from PW water (black circles), UW water (white circles), PW ETBE-enrichment cultures (black triangles) and UW ETBE-enrichment cultures (white triangles). Water samples are labeled with month/year of sampling. ETBE-enrichment samples are labeled I1-I3 for the initial cultures and S1–S3 the subcultures (see Figure S1 for more details). Samples that were used for 16S rRNA and ethB gene sequencing are marked with an asterisk. The distances between samples were based on Bray-Curtis similarity matrix, which was calculated from normalized probe signals. Low 2D stress value (<0.1) indicates that the distances between samples in reduced 2-dimensional space correspond well with the actual multivariate distance between the samples.
Applsci 09 04247 g001
Figure 2. Comparison of PW and UW ETBE-enrichment subculture communities by 16S rRNA gene sequencing (based on 66 and 74 clones, respectively). Bars represents per cents of recovered clones from PW (black) and UW (white) ETBE-enrichment subcultures affiliated to the indicated bacterial taxa.
Applsci 09 04247 g002
Figure 3. Phylogenetic tree based on ethB sequences recovered from PW ETBE-enrichment subculture S3 (23 sequences), UW ETBE-enrichment subculture S1 (42 sequences) and PW water (45 sequences), and highly similar (>99% identity, according to blastn) ethB sequences from published strains. The Neighbor-Joining tree was constructed based on phylogenetic distances calculated with Kimura-2 parameter (816 nucleotide positions included in the analysis), and bootstrapped over 1000 replicates. The collapsed parts of the tree (presented as black triangles) are labeled with the corresponding samples and numbers of clones (in brackets). Bootstrap values are marked in bold next to the branches. The scale bar shows phylogenetic distance.
Applsci 09 04247 g003
Table 1. Chemical analysis of water from the upstream (UW) and the polluted (PW) well.
ETBE
(mg/L)
MTBE
(mg/L)
TBA
(mg/L)
BTEX
(mg/L)
TOC a
(mg/L)
Nitrates
(mg/L)
Sulfates
(mg/L)
Oxygen
(mg/L)
PW160.82.51.94.4204ND b70.33
UWNDNDNDNDND3252.54
a Total organic carbon, b ND—not detected.

