1. Introduction
After Ferrybridge Cooling Tower failures in the UK in 1965 [
1], the international wind engineering circle began to conduct studies in the following topics: influence of tower group and surrounding structures on wind pressure distribution on the surface of the tower body [
2,
3], buckling stability, and ultimate bearing capacity of the tower body under wind load [
4,
5], finite element analysis of responses of large cooling towers considering the tower defect and soil–structure interaction [
6,
7], and random dynamic responses of tower body induced by pulsating wind pressure [
8]. Wind-induced damage and subsequent evolution of the damage during the construction process are considered [
9] responsible for the collapse of three cooling towers (at Ardeer Power Station in Scotland in 1973, power plant in Bouchain, Franch in 1979, and Fiddlers Ferry Power Station in 1984). This is closely related to the wind loads, concrete performance, and crack evolution during the construction process of the cooling tower. We have also found through the overall and local stability performance of China’s tallest exhaust cooling tower during the construction process that the wind vibration coefficient changes with the construction height and evolution of material properties. Moreover, dynamic wind pressure inside the cooling tower also has a non-negligible impact on the wind-induced stability performance during the construction process.
In China, the height of newly built thermal and nuclear power plants has far exceeded the upper limit of standard or broken the world’s record. This directly leads to substantial 3D dynamic wind load effect [
10,
11]. The construction period of the main structure and the construction difficulty also increase [
12]. For the template of the cooling tower, the concrete strength may be insufficient before the concrete pouring of the cooling tower is complete. The concrete, though having a relatively low strength during the construction process, is subjected to dead load, wind load, and construction load. The strength and modulus of elasticity of concrete will increase with the construction height, which results in the constant evolution of stiffness and stress performance of the overall tower. Changes in the morphology and mechanical performance of the cooling tower during this process will further lead to alterations of static and dynamic wind pressure distribution on tower surface, wind-induced response, and wind vibration coefficient. As a result, the calculation of internal force of the structure and analysis of stability performance and ultimate bearing capacity will be also affected. In light of this, it is of high importance to discuss the evolution and non-linear influence of wind-induced stability of super large cooling towers during the construction process.
Few studies have been devoted to the wind-induced stability performance of large cooling towers during the construction process so far. In one literature report [
13], buckling failure and ultimate bearing capacity of cooling tower during the whole construction process were analyzed based on secondary development of the ANSYS and wind tunnel test. Ke employed self-written preprocessing and post-processing programs for checking computation of the local and overall ultimate bearing capacity of the exhaust cooling tower. The variation of critical wind speed with construction height was also discussed [
14].
In this study, we focused on a 210 m super large cooling tower under construction, the tallest tower ever built in the world. We built the 3D physical model separately for all eight construction stages. The dynamic characteristics of the cooling tower were analyzed in each stage. First, the flow field information and 3D time history of aerodynamic force were obtained for the whole construction process using large eddy simulation. The wind pressure distributions of the constructed tower were compared against the standard and measured curves to validate the numerical simulation. Full transient dynamic finite element analysis was used to calculate the dynamic responses of the tower under the real-time changes of wind load during the whole construction process. Five calculation methods were used to trace the evolution of wind vibration coefficient during the whole construction process of the super large cooling tower. Then the formula for wind vibration coefficient changing with the construction height was fitted. The differential values of wind vibration coefficient during the whole construction process of the cooling tower were discussed by taking the meridional axial force as the objective function. On this basis, the influence and working mechanism of wind vibration coefficient, concrete age, construction load, geometric nonlinearity, and internal suction force on buckling stability and ultimate bearing capacity of the cooling tower were investigated.
2. An Illustrative Example
2.1. An Overview of the Project
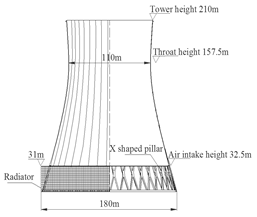
This super large cooling tower stood 210.0 m, with a throat height of 157.5 m and air inlet height of 32.5 m. The top section had a diameter of 115.8 m, and the throat section in the middle portion had a diameter of 110 m. The zero-meter diameter was 180. The tower body was connected to the annular plate resting on the foundation with 52 pairs of X-shaped pillars. The X-shaped pillars had a rectangular cross section, which measured 1.2 m × 1.8 m. The foundation was a cast-in-situ reinforced concrete structure with a width of 12.0 m and a height of 2.5 m. The terrain category was B, with a basic wind velocity of 23.7 m/s.
Table 1 shows the main parameters of the super large cooling tower.
2.2. Modeling of the Whole Construction Process
The construction process was divided into eight stages based on the progress of construction and calculation precision. Evolution of wind-induced stability performance was analyzed for each stage.
Table 2 shows the parameters of each working condition.
3. Numerical Simulation
3.1. Methodology
Fluid is considered to be incompressible viscous flow in anti-wind design of structures. Spatial averaging of transient N–S equation can yield the governing equation in large eddy simulation (LES):
where
ρ is air density,
t is time,
v is kinematic viscosity coefficient of air,
and
are velocities in three directions after filtering, and
is non-closed term in the N–S equation after spatial averaging, i.e., subgrid scale stress.
Boussinesq approximation was introduced according to Smagorinsky subgrid–scale model based on eddy viscosity assumption. Thus, the subgrid–scale stress is written as
e tensor of solvable scale,
τkk is the isotropic component of subgrid–scale stress, which is contained in the pressure item after filtering,
δij is Kronecker delta function,
μt is subgrid–scale turbulence eddy viscosity coefficient, generally using the Smagorinsky assumption:
where
Cs is Smagorinsky constant, generally taken as 0.1–0.23 and being 0.1 in this study. Strain rate tensor
.
is grid scale,
, where
,
, and
are the grid size in
x,
y, and
z directions, respectively. This is the standard Smagorinsky subgrid–scale model. Some researchers propose dynamic determination of
Cs value to better characterize collision, separation, free shear layer, and vortex shedding of the flow field around the blunt body. It is known as the dynamic Smagorinsky model.
However, both the Smagorinsky model and dynamic Smagorinsky model are algebraic models, which assume a local equilibrium between the generation and dissipation of subgrid–scale turbulent kinetic energy. These models are not fit for simulating structures with a high Reynolds number, such as the cooling towers. To solve this problem, we proposed a new form of subgrid–scale model based on literature [
15]:
where,
Ksgs is the kinetic energy of transportation equation SGS,
Cs is Smagorinsky constant, and
v is positive. Here,
Cs will reduce the amplitude of
Ksgs, and a Gaussian filter is needed for finite difference.
This model is better applied to engineering applications. There is no need for experimental filtering, and the computational load is small. So, it can be used to simulate structures with a high Reynolds number, such as cooling towers [
10].
3.2. Parameter Configuration and Grid Generation
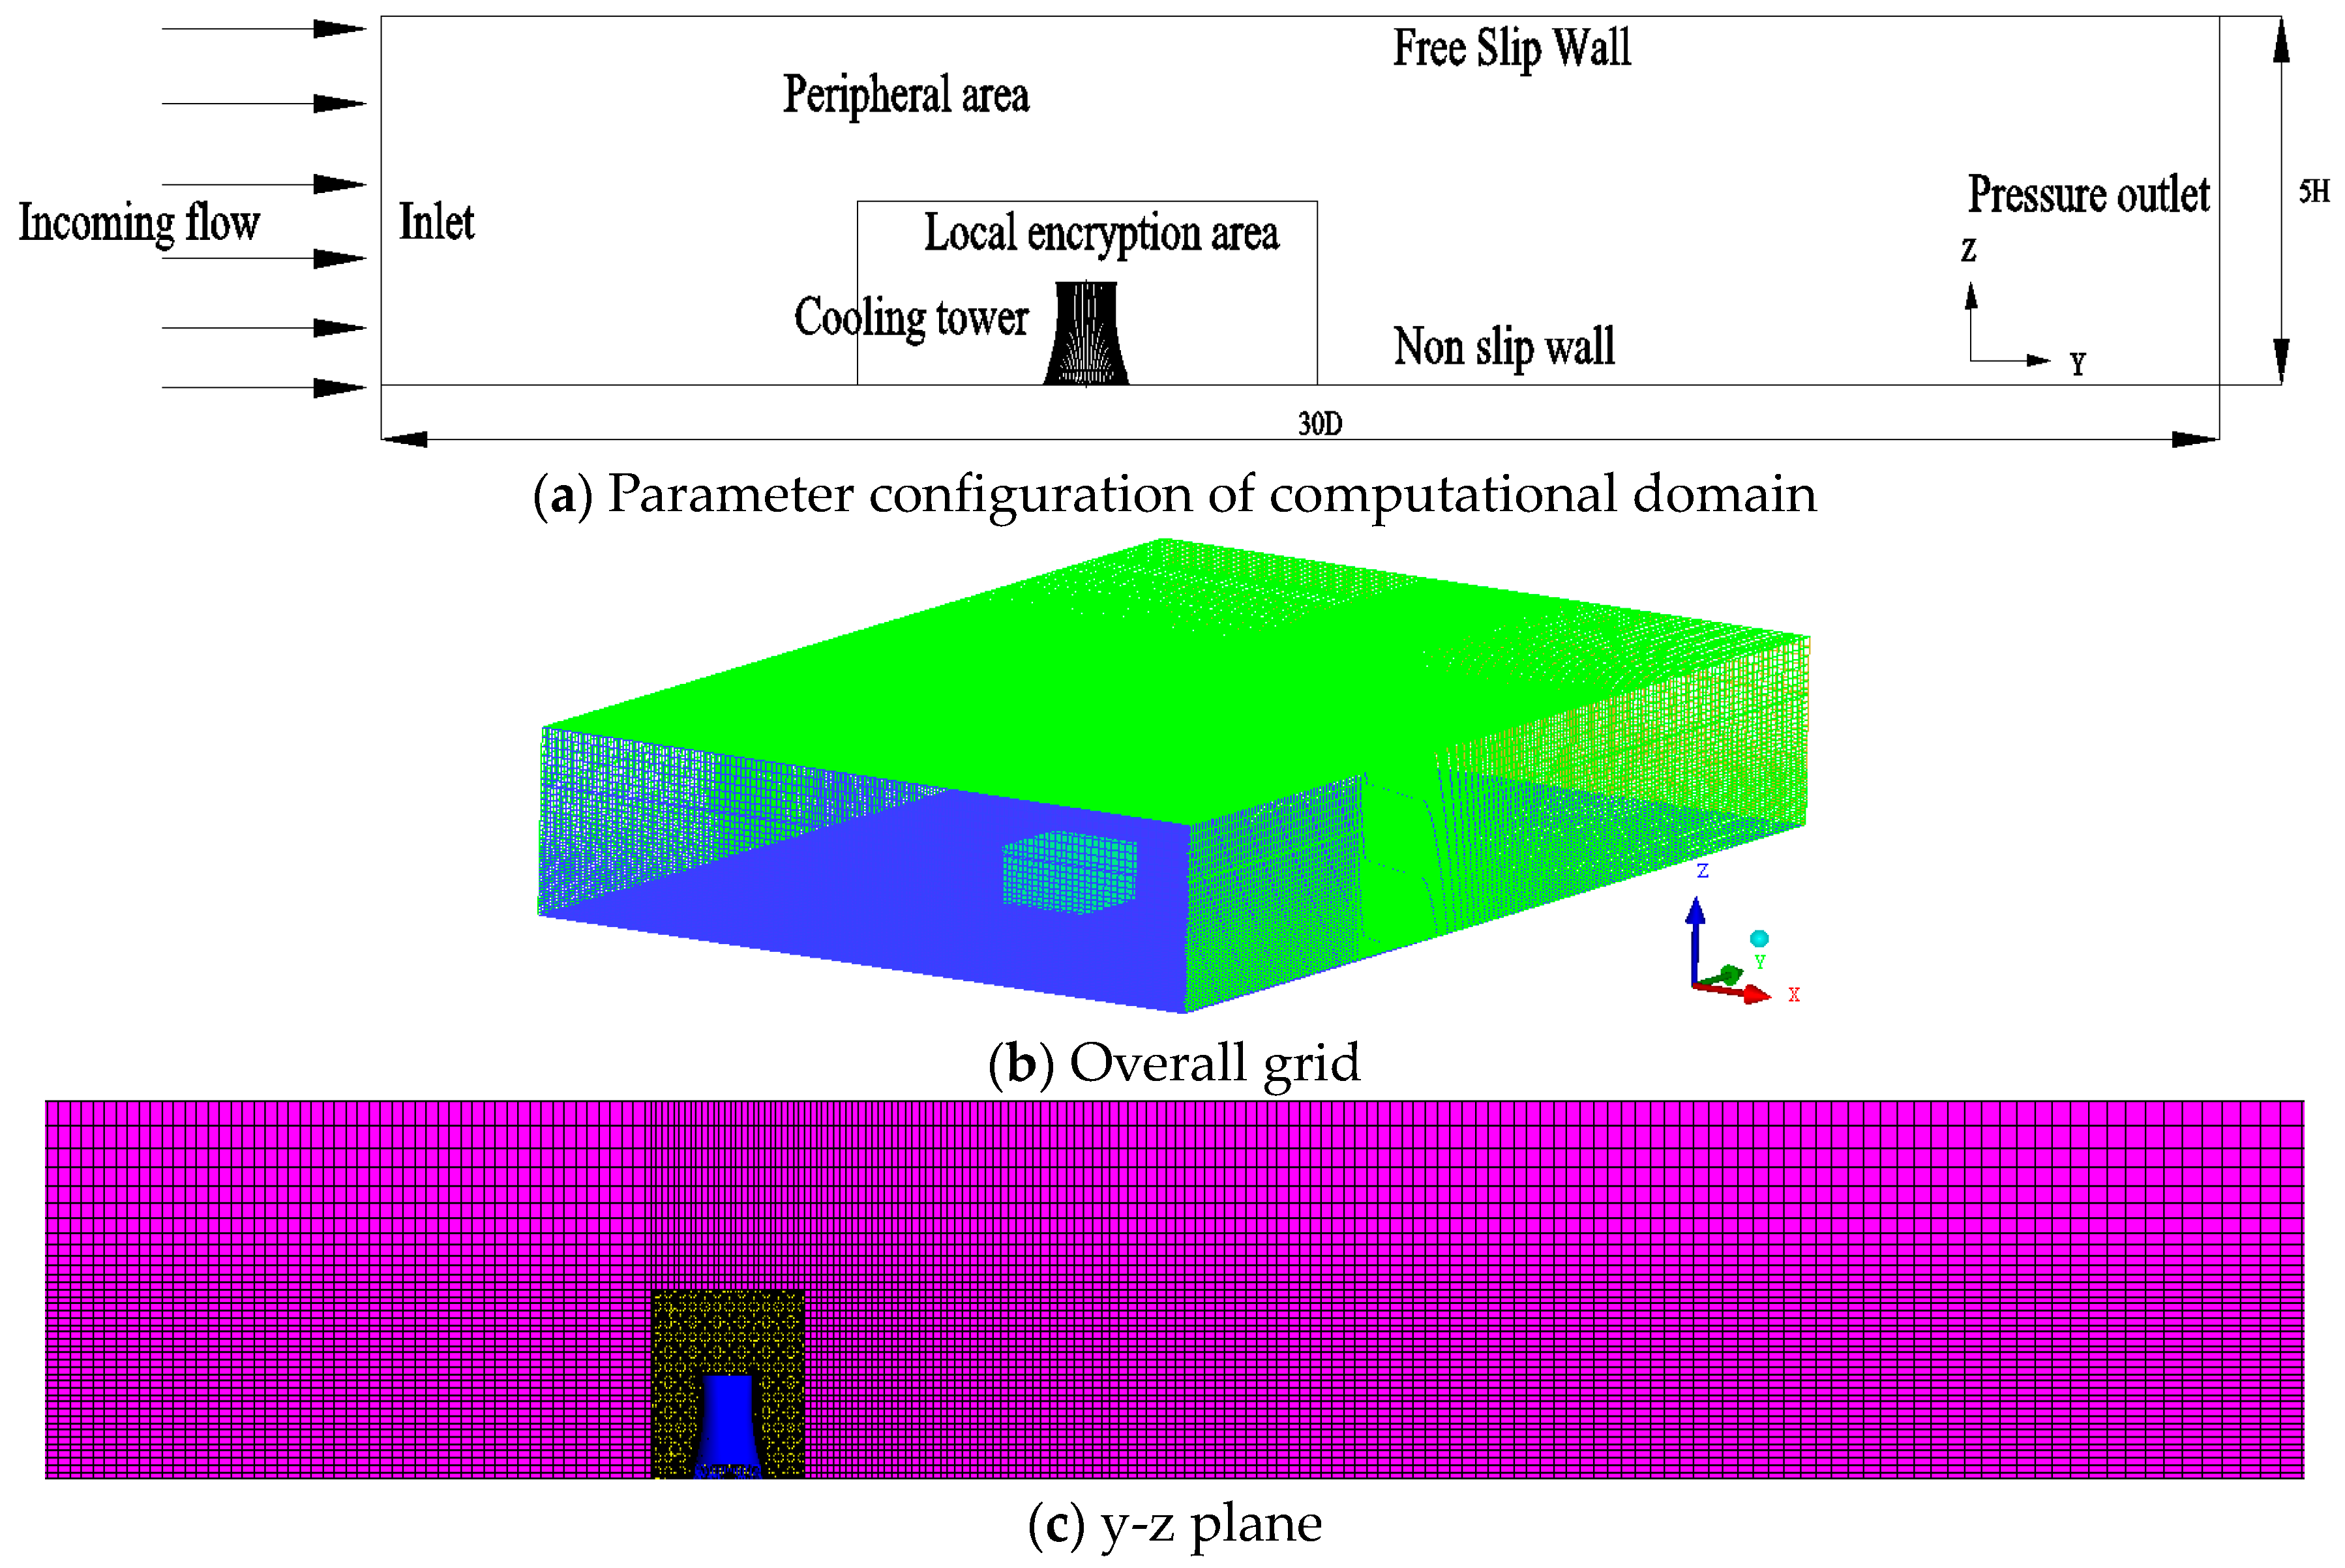
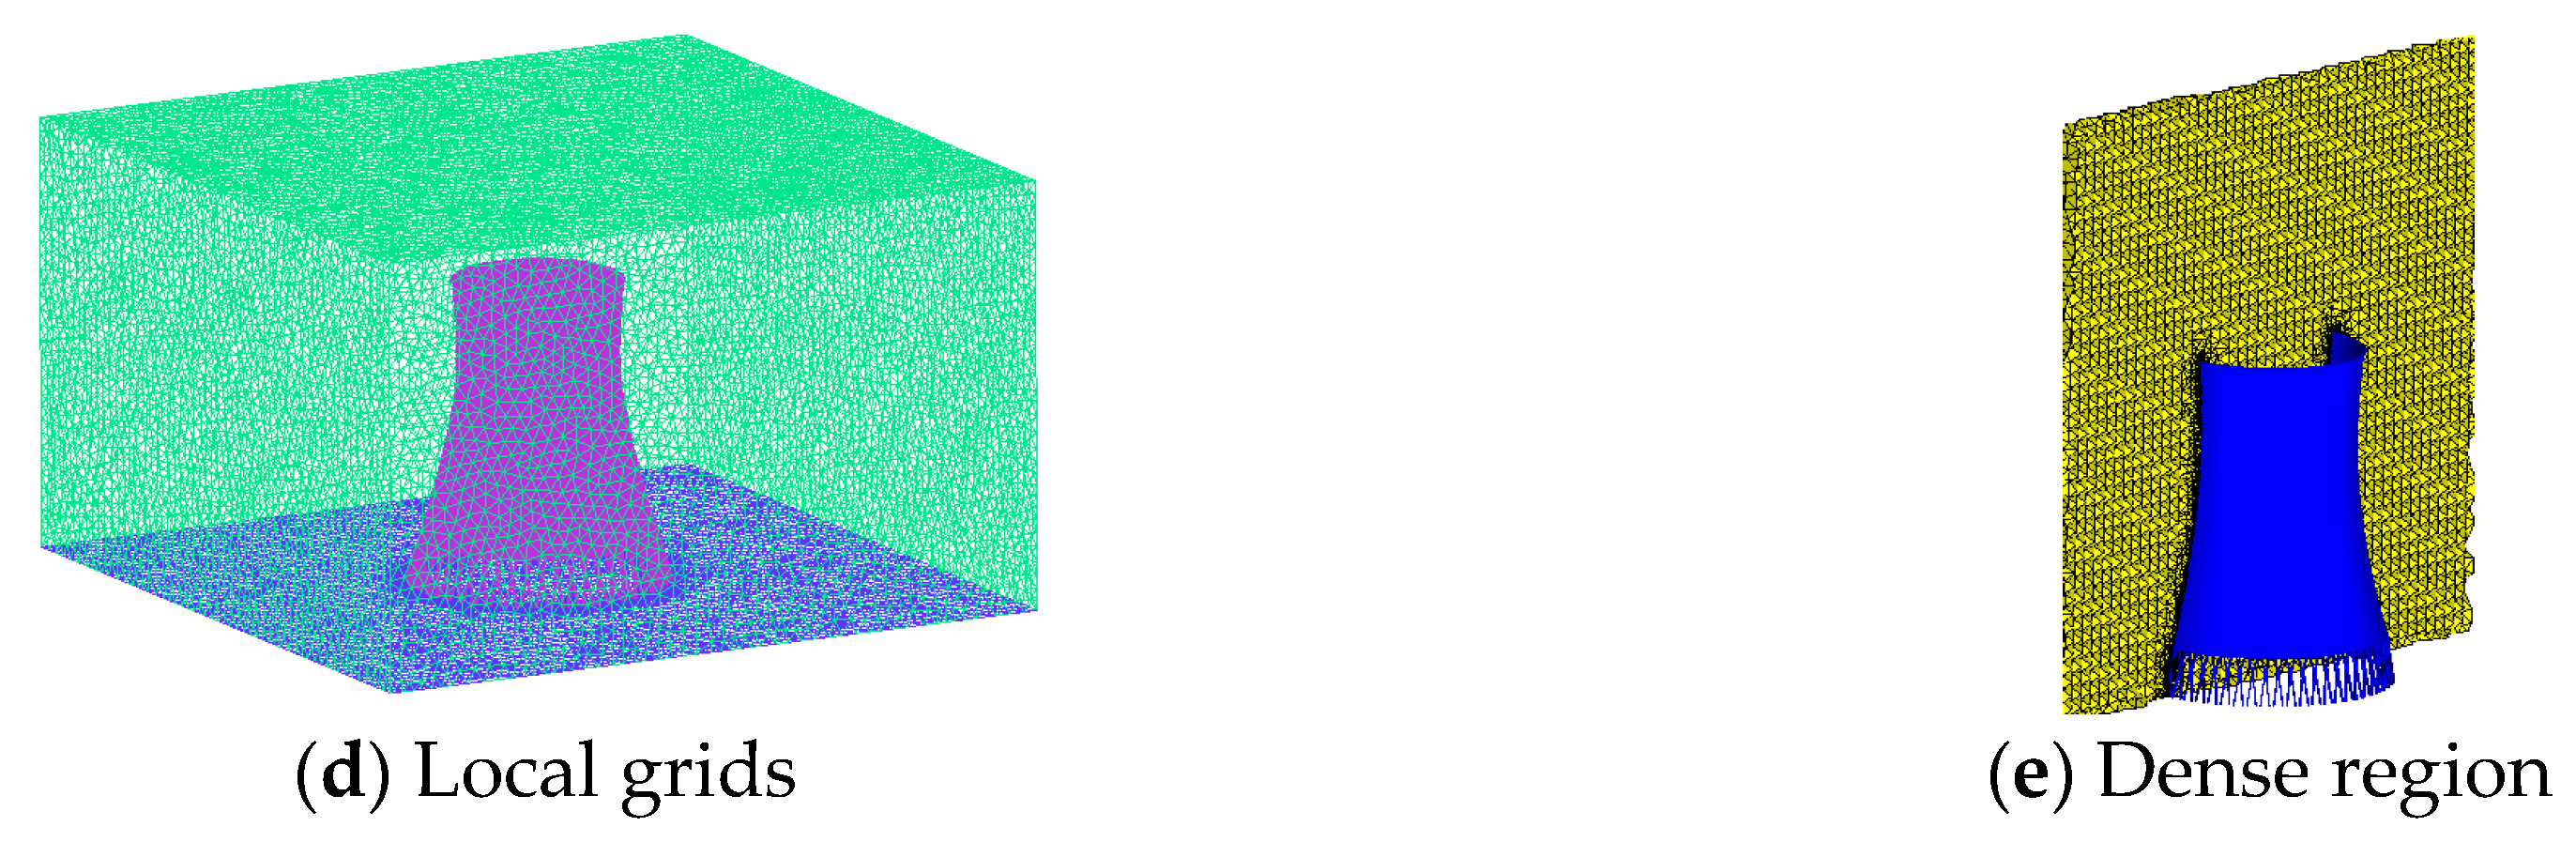
A physical model of the super large cooling tower was built according to original size, so that the Reynolds number used in numerical simulation would be comparable to that in the actual project. The size of the computational domain was X × Y × Z = 6000 m × 4000 m × 1000 m (X is across-wind direction, Y is along-wind direction, and Z is height direction). The blocking rate of the model was below 1%. The computational domain was divided into dense region and peripheral region so as to ensure both computational efficiency and precision. Non-structured grids with a high adaptability were used for the region near the cooling tower; for the peripheral space further away from the cooling tower, structured grids having a regular topology were used for the discretization. Therefore, the total number of grids was reduced, which improved the computational efficiency. The minimum grid size was 0.2 m in the core region. The model of the built-up tower had approximately 12.8 million grids.
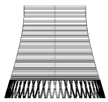
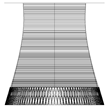
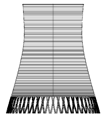
Boundary conditions were defined using UDF (User define function) file. Inlet boundary condition was velocity inlet, and the outlet boundary condition was pressure outlet. The top and sides of the computational domain were equivalent to free slip walls, the symmetry boundary conditions (Symmetry). The floor and structure surface were equivalent to no-slip wall boundary condition. The wind field was considered as incompressible flow field. Discrete equations were solved using SIMPLEC. This calculation method has good convergence performance and applies to LES (Large eddy simulation) with small time step. The time step of LES was set to 0.05 s. Here, only the schematic for the computational domain and grid generation of the model of the built-up tower is provided, as shown in
Figure 1.
3.3. Validation
The design code for cooling towers [
16,
17,
18,
19] only provides the average and pulsating wind pressure distribution curves of the built-up towers. Therefore, we only validated the numerical simulation for the built-up tower.
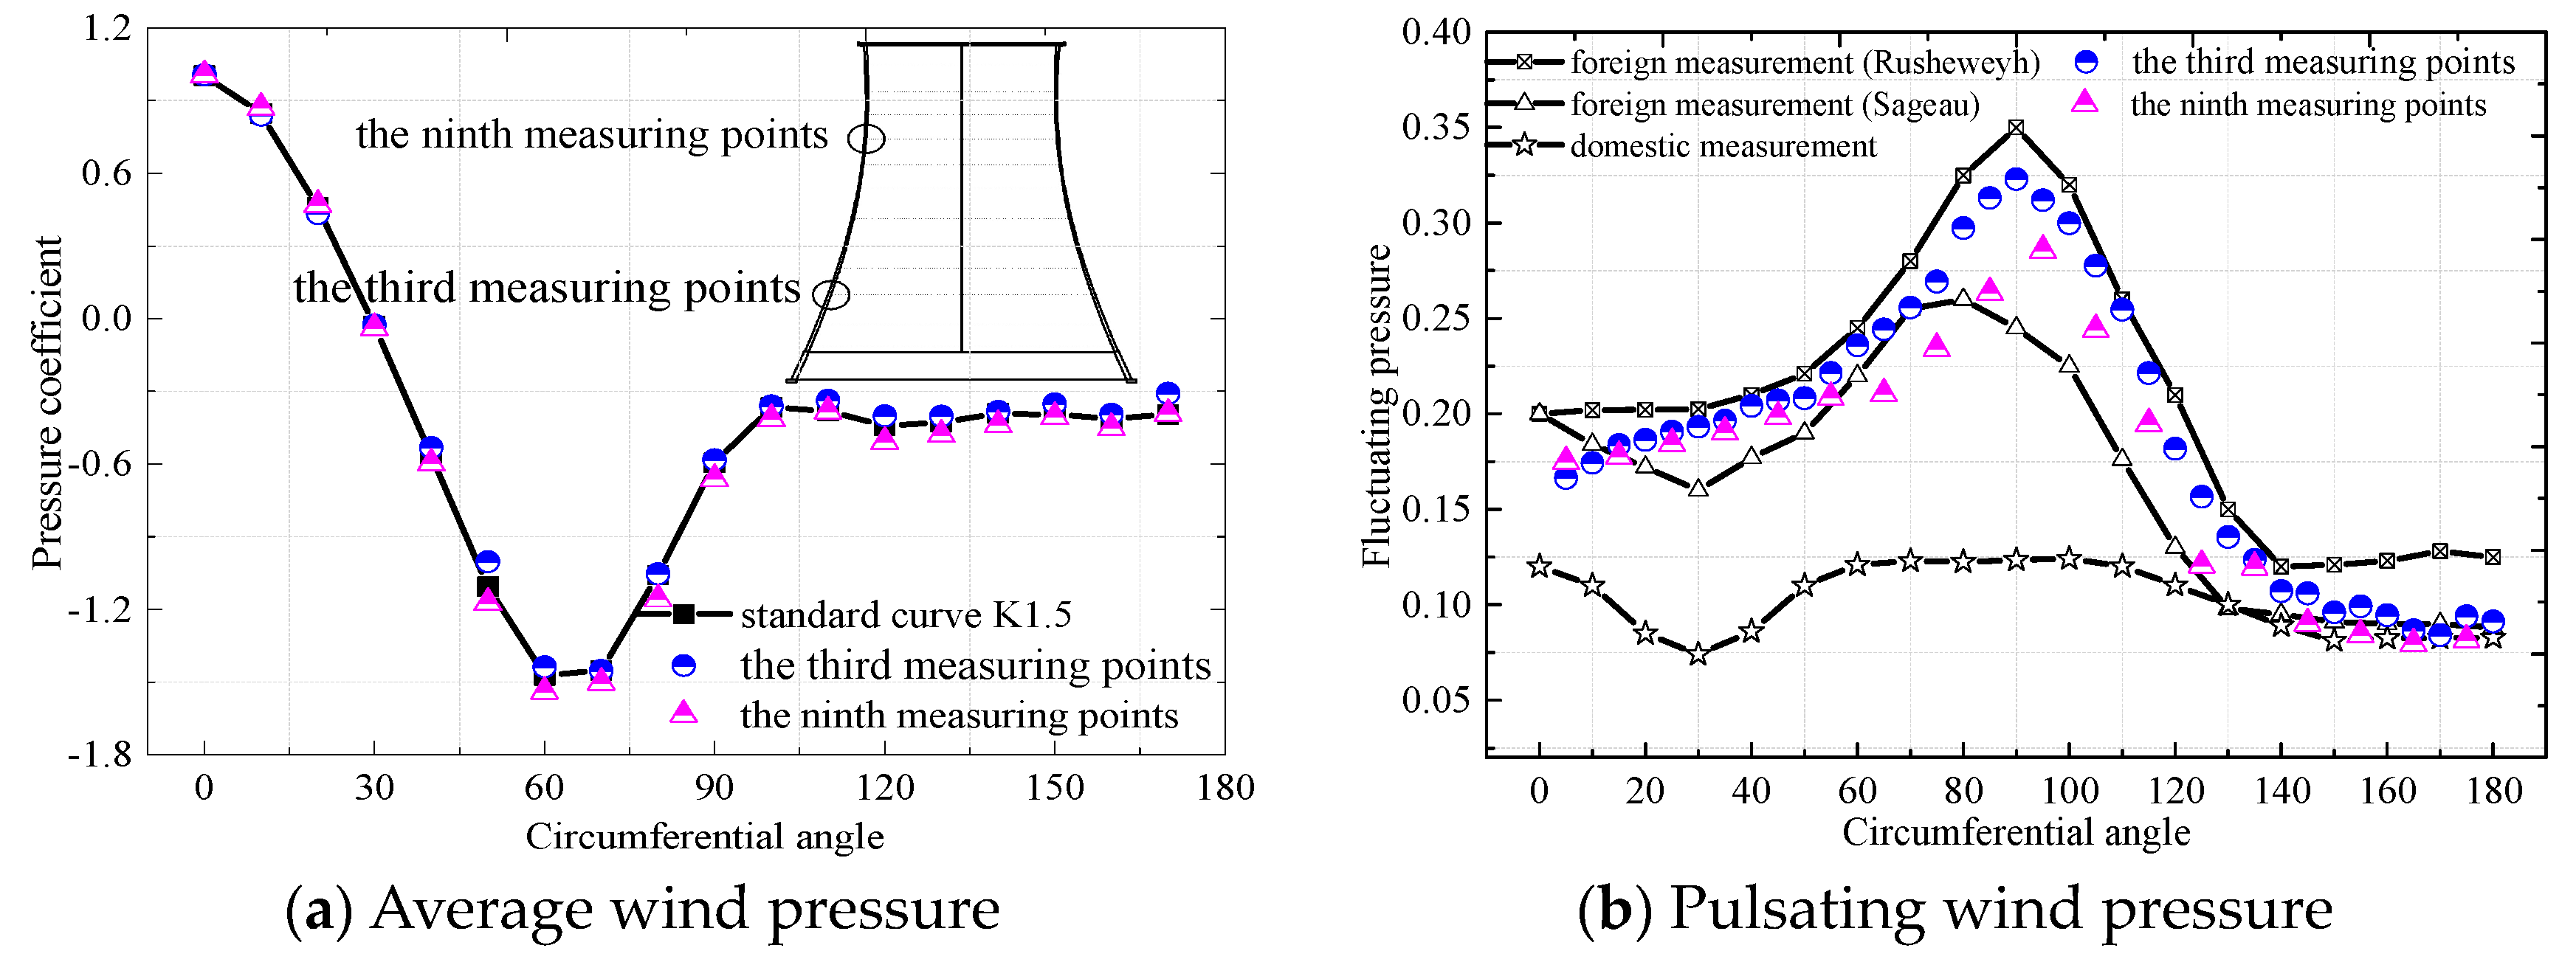
Figure 2 shows the comparison of simulated average and pulsating wind pressure distributions of a cross section of the built-up tower against the measured and standard curves. It can be seen that the simulated average wind pressure distribution curve agreed well with the standard curve. The pressure coefficients in the upwind side, region of extreme negative pressure, and at the separation point on the leeward side were consistent with the standard curve. This validated the average wind pressures obtained by LES.
Moreover, the simulated pulsating wind pressure distribution curve basically coincided with the measured curve and the curve of wind tunnel test. The values lay between the results measured at home and abroad. Five curves are presented respectively in
Figure 2b, among which three are the measured pulsating wind pressure curves in domestic and foreign regulations (VGB–R 610Ue 2005, Blanchette et al. 2013, DL/T 5339–2006, GB/T 50102–2014), and two are the measuring points of the third and ninth floors of the full-size cooling tower in this paper. Pulsating wind pressure distribution is closely associated with the terrain, incoming turbulent flow, and surrounding interference. The trend and values of pulsating wind pressure distribution estimated by LES were close or fell into the range of the measured values. Therefore, the pulsating wind pressures simulated by LES were reliable and suitable for subsequent analysis of wind-induced vibration and stability performance.
3.4. Simulation Results
3.4.1. Pulsating Wind Pressure
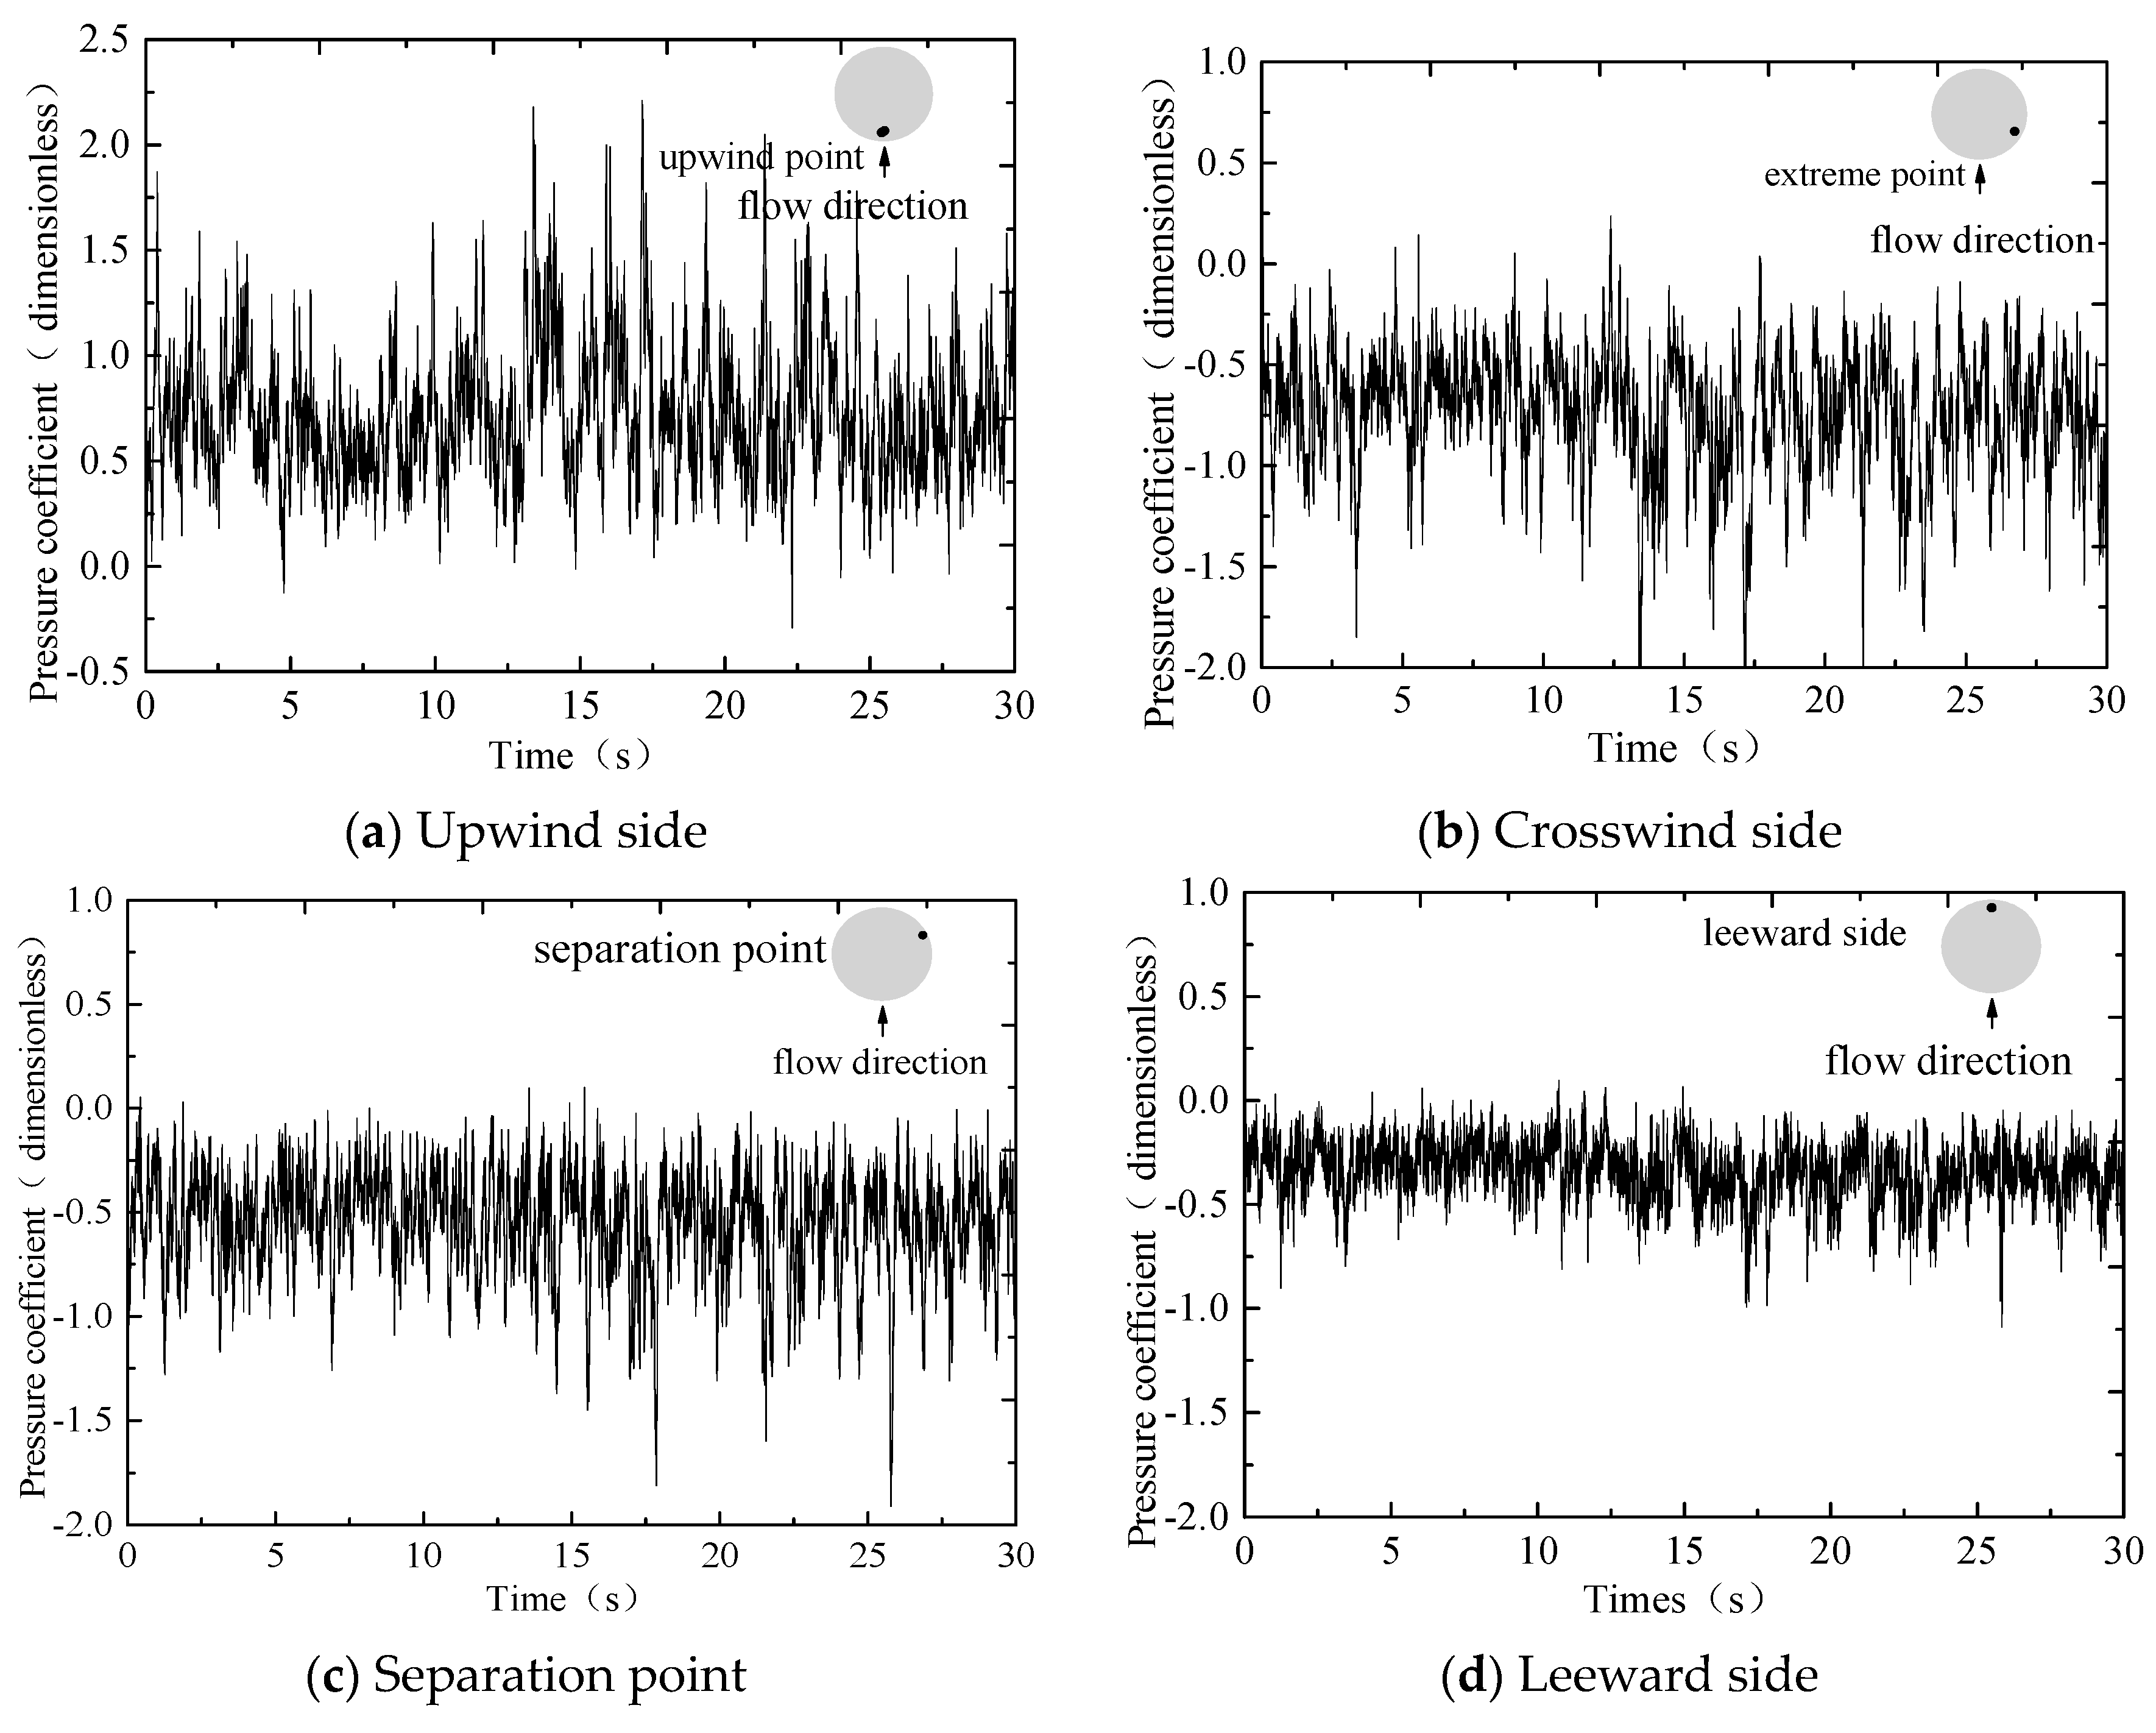
The same parameter configuration as the numerical simulation for the built-up tower was used for LES under the other seven working conditions. Thus, the flow field on the surface of the tower and the time history of pulsating wind pressure were obtained for the whole construction process. Due to limited space,
Figure 3 only provides the time history of pressure coefficient at the upwind side, crosswind side, separation point and leeward side for the built-up model.
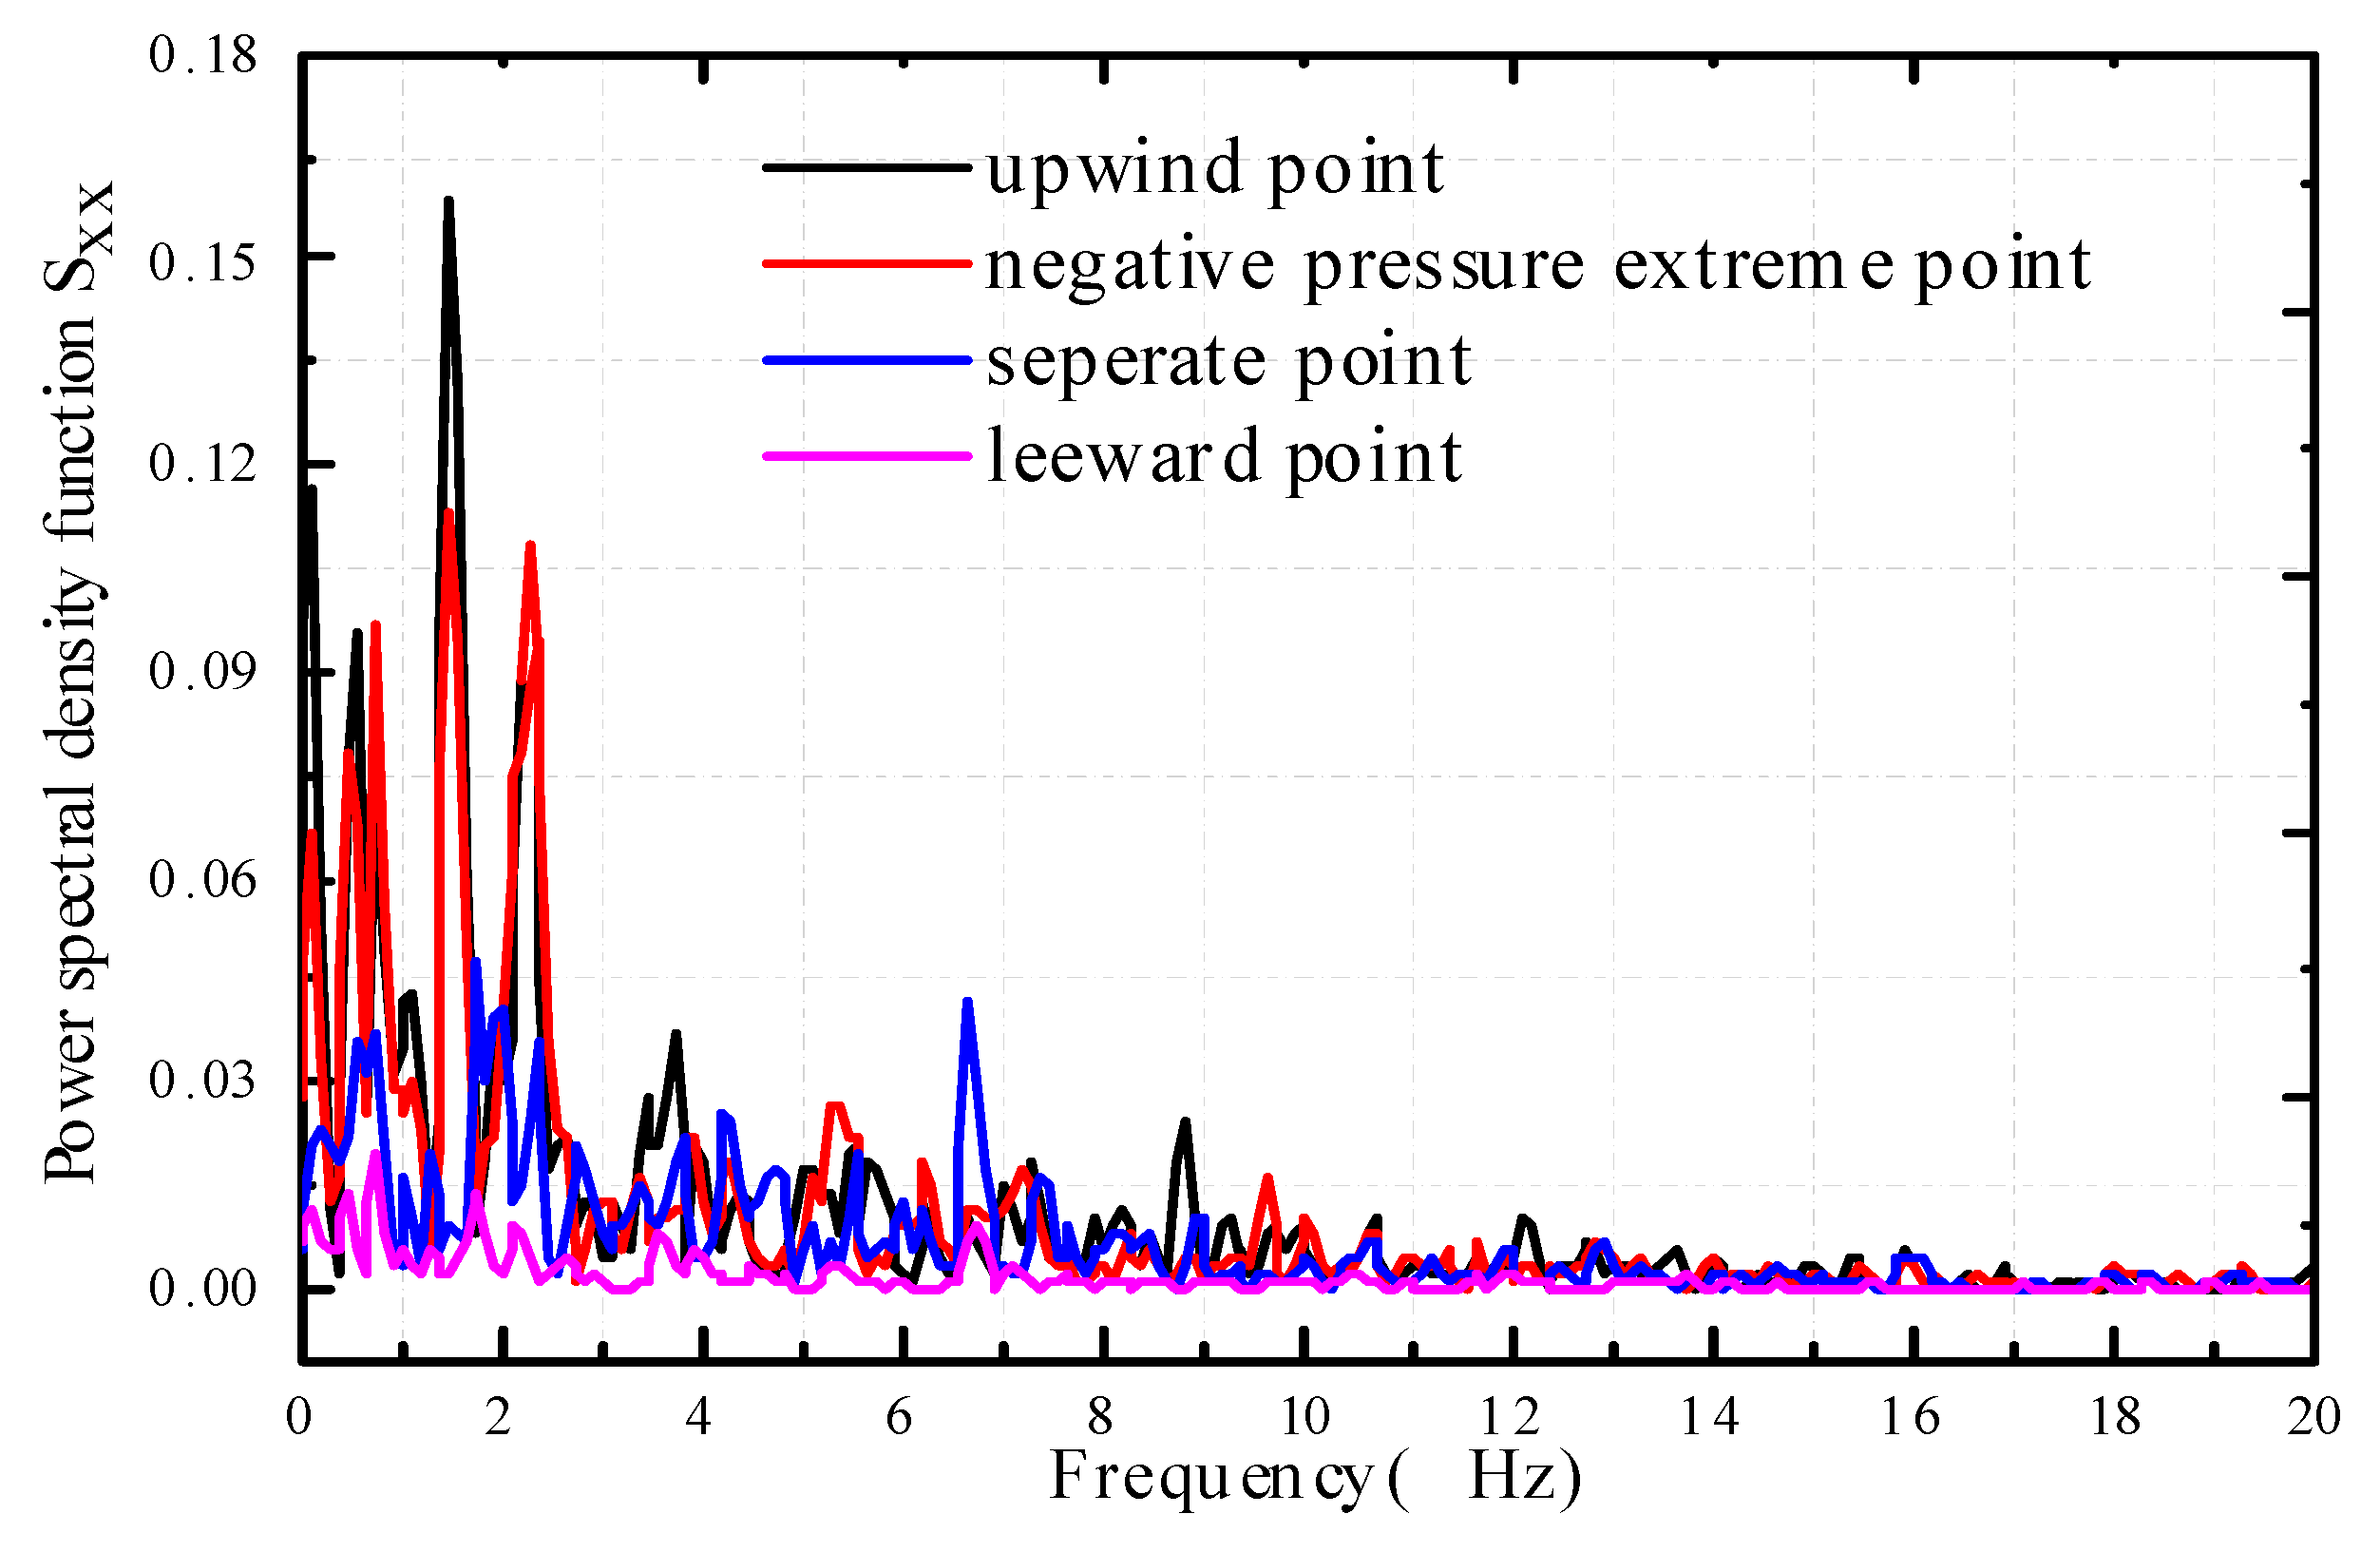
Figure 4 provides the power spectral density curves of pulsating wind pressure at the representative measuring points. Comparison showed that for different positions, the peaks of the power spectral density function all occurred in the low frequency range. The energy of the pulsating wind pressure was mainly concentrated in low frequencies. The values of the power spectral density function were slightly higher on the upward side than at the separation point and leeward side.
3.4.2. Pressure Coefficients on the Tower Surface
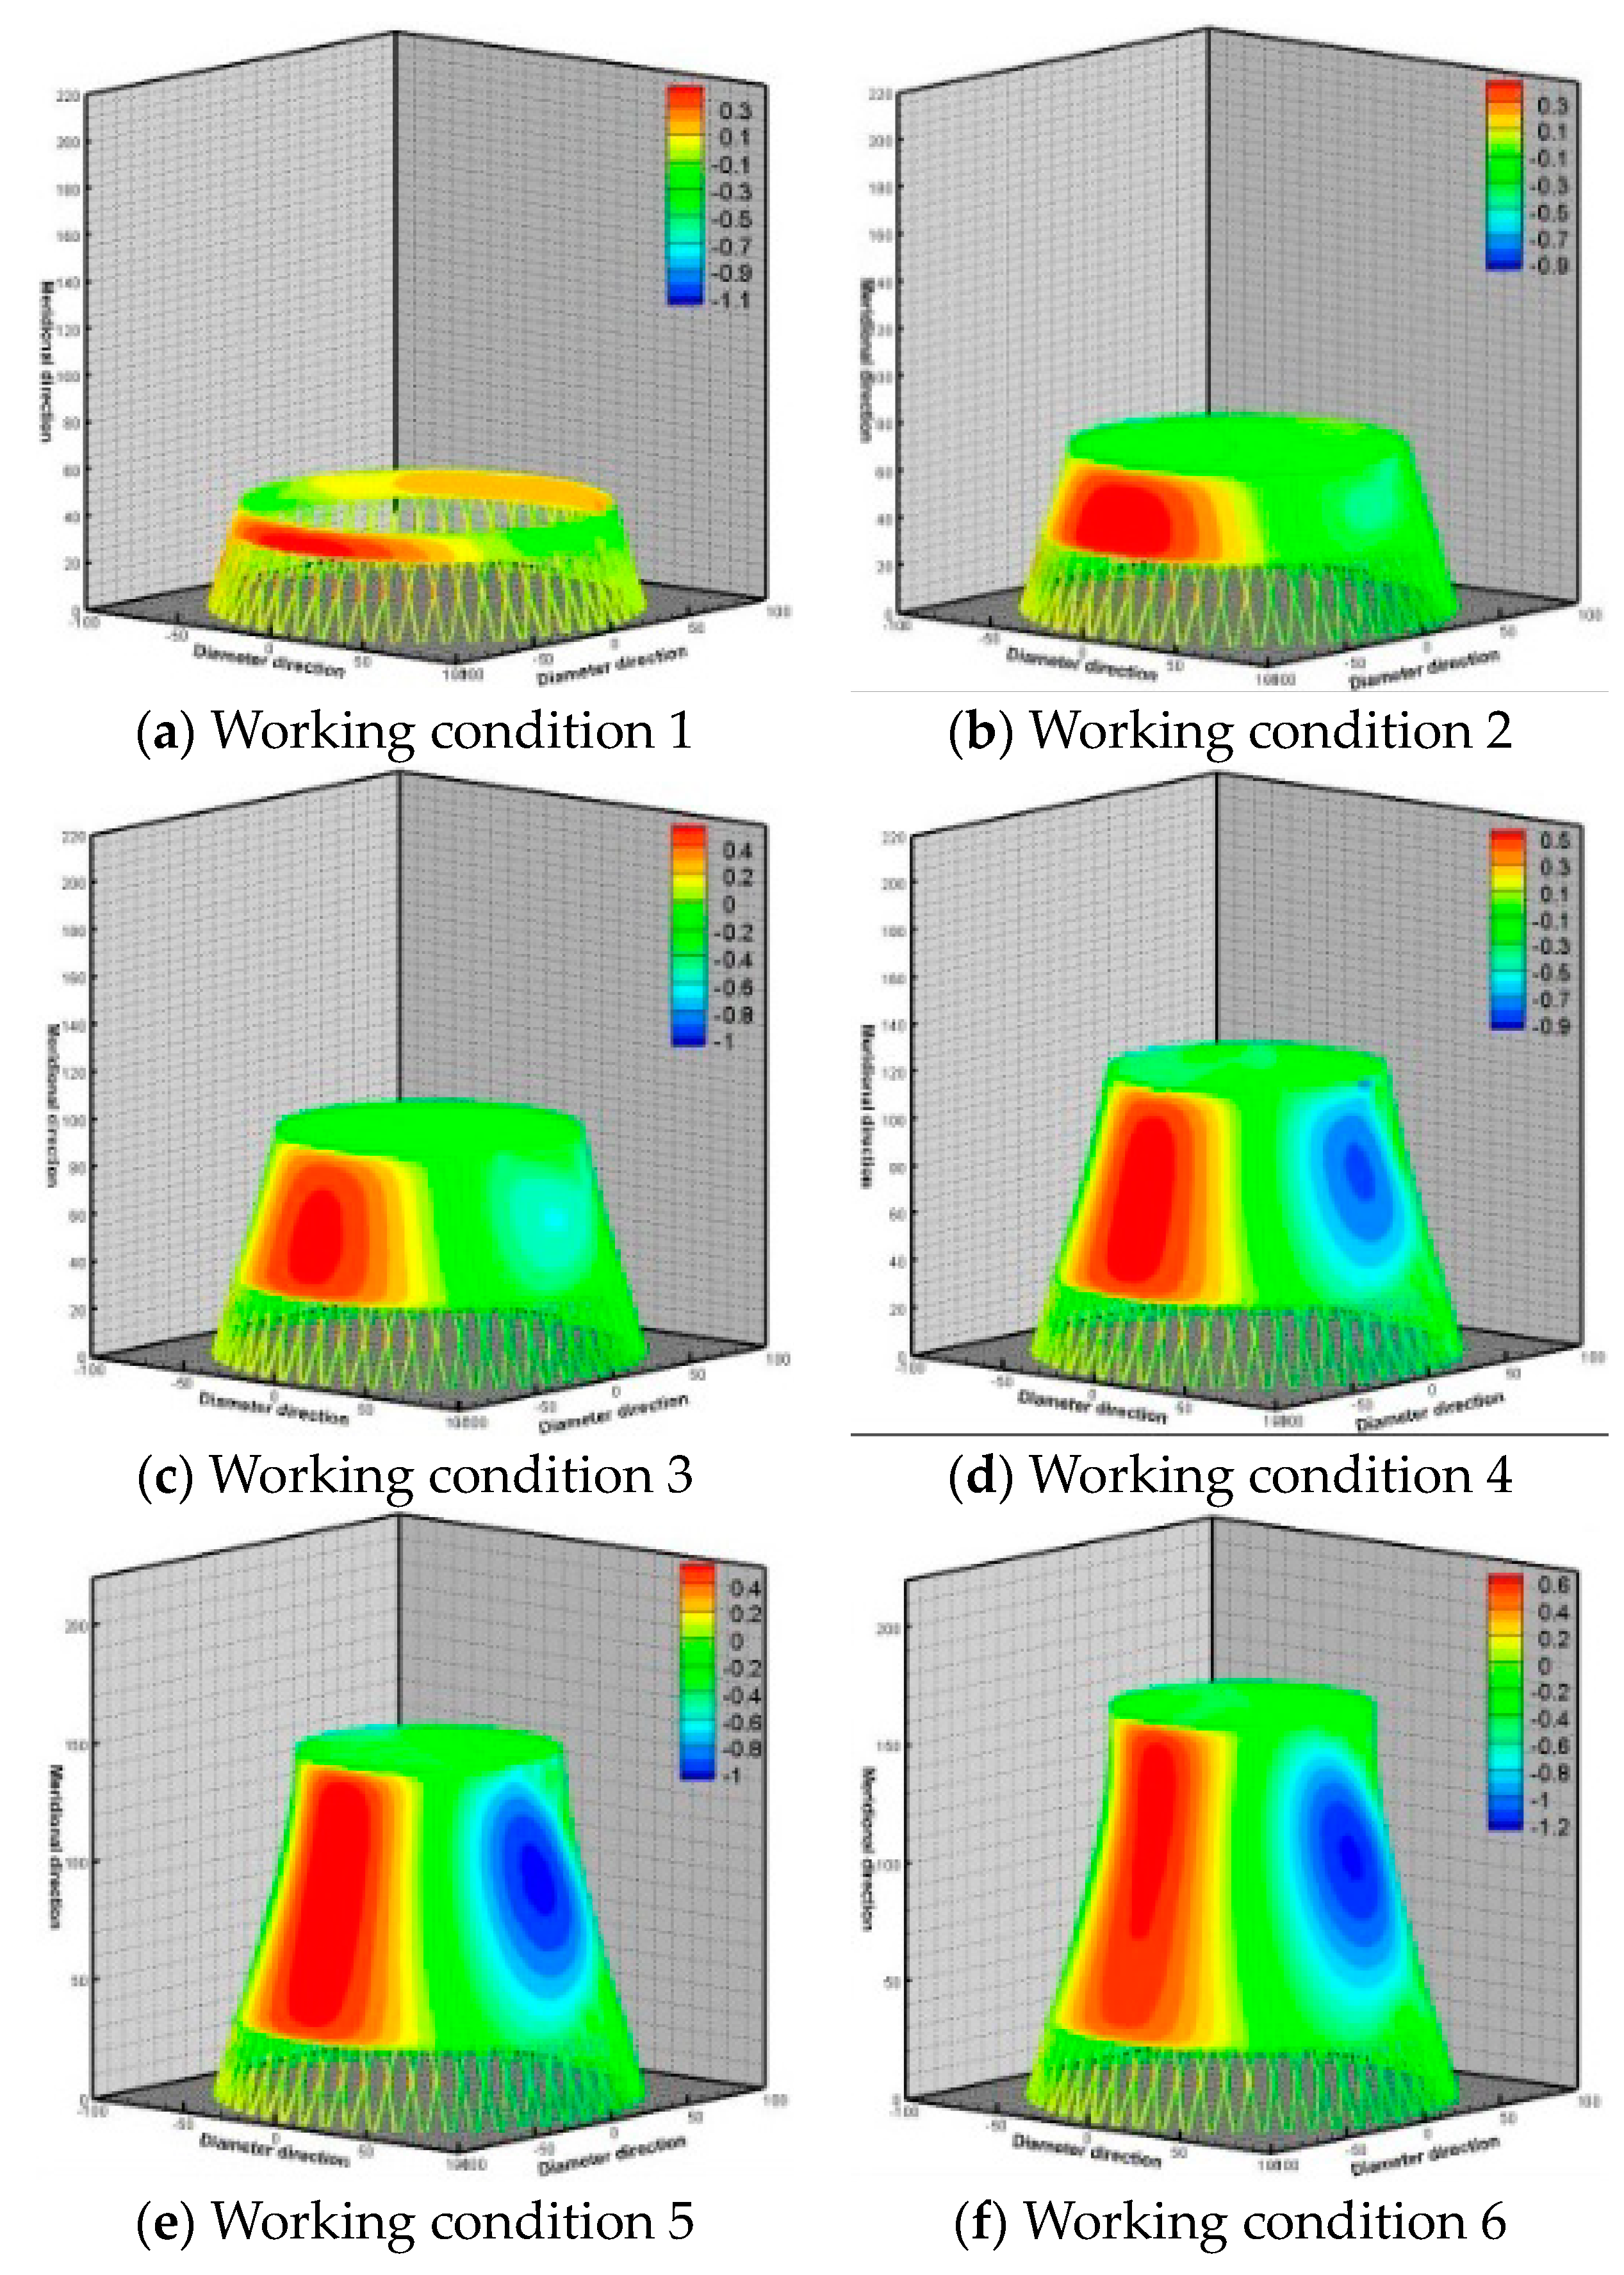
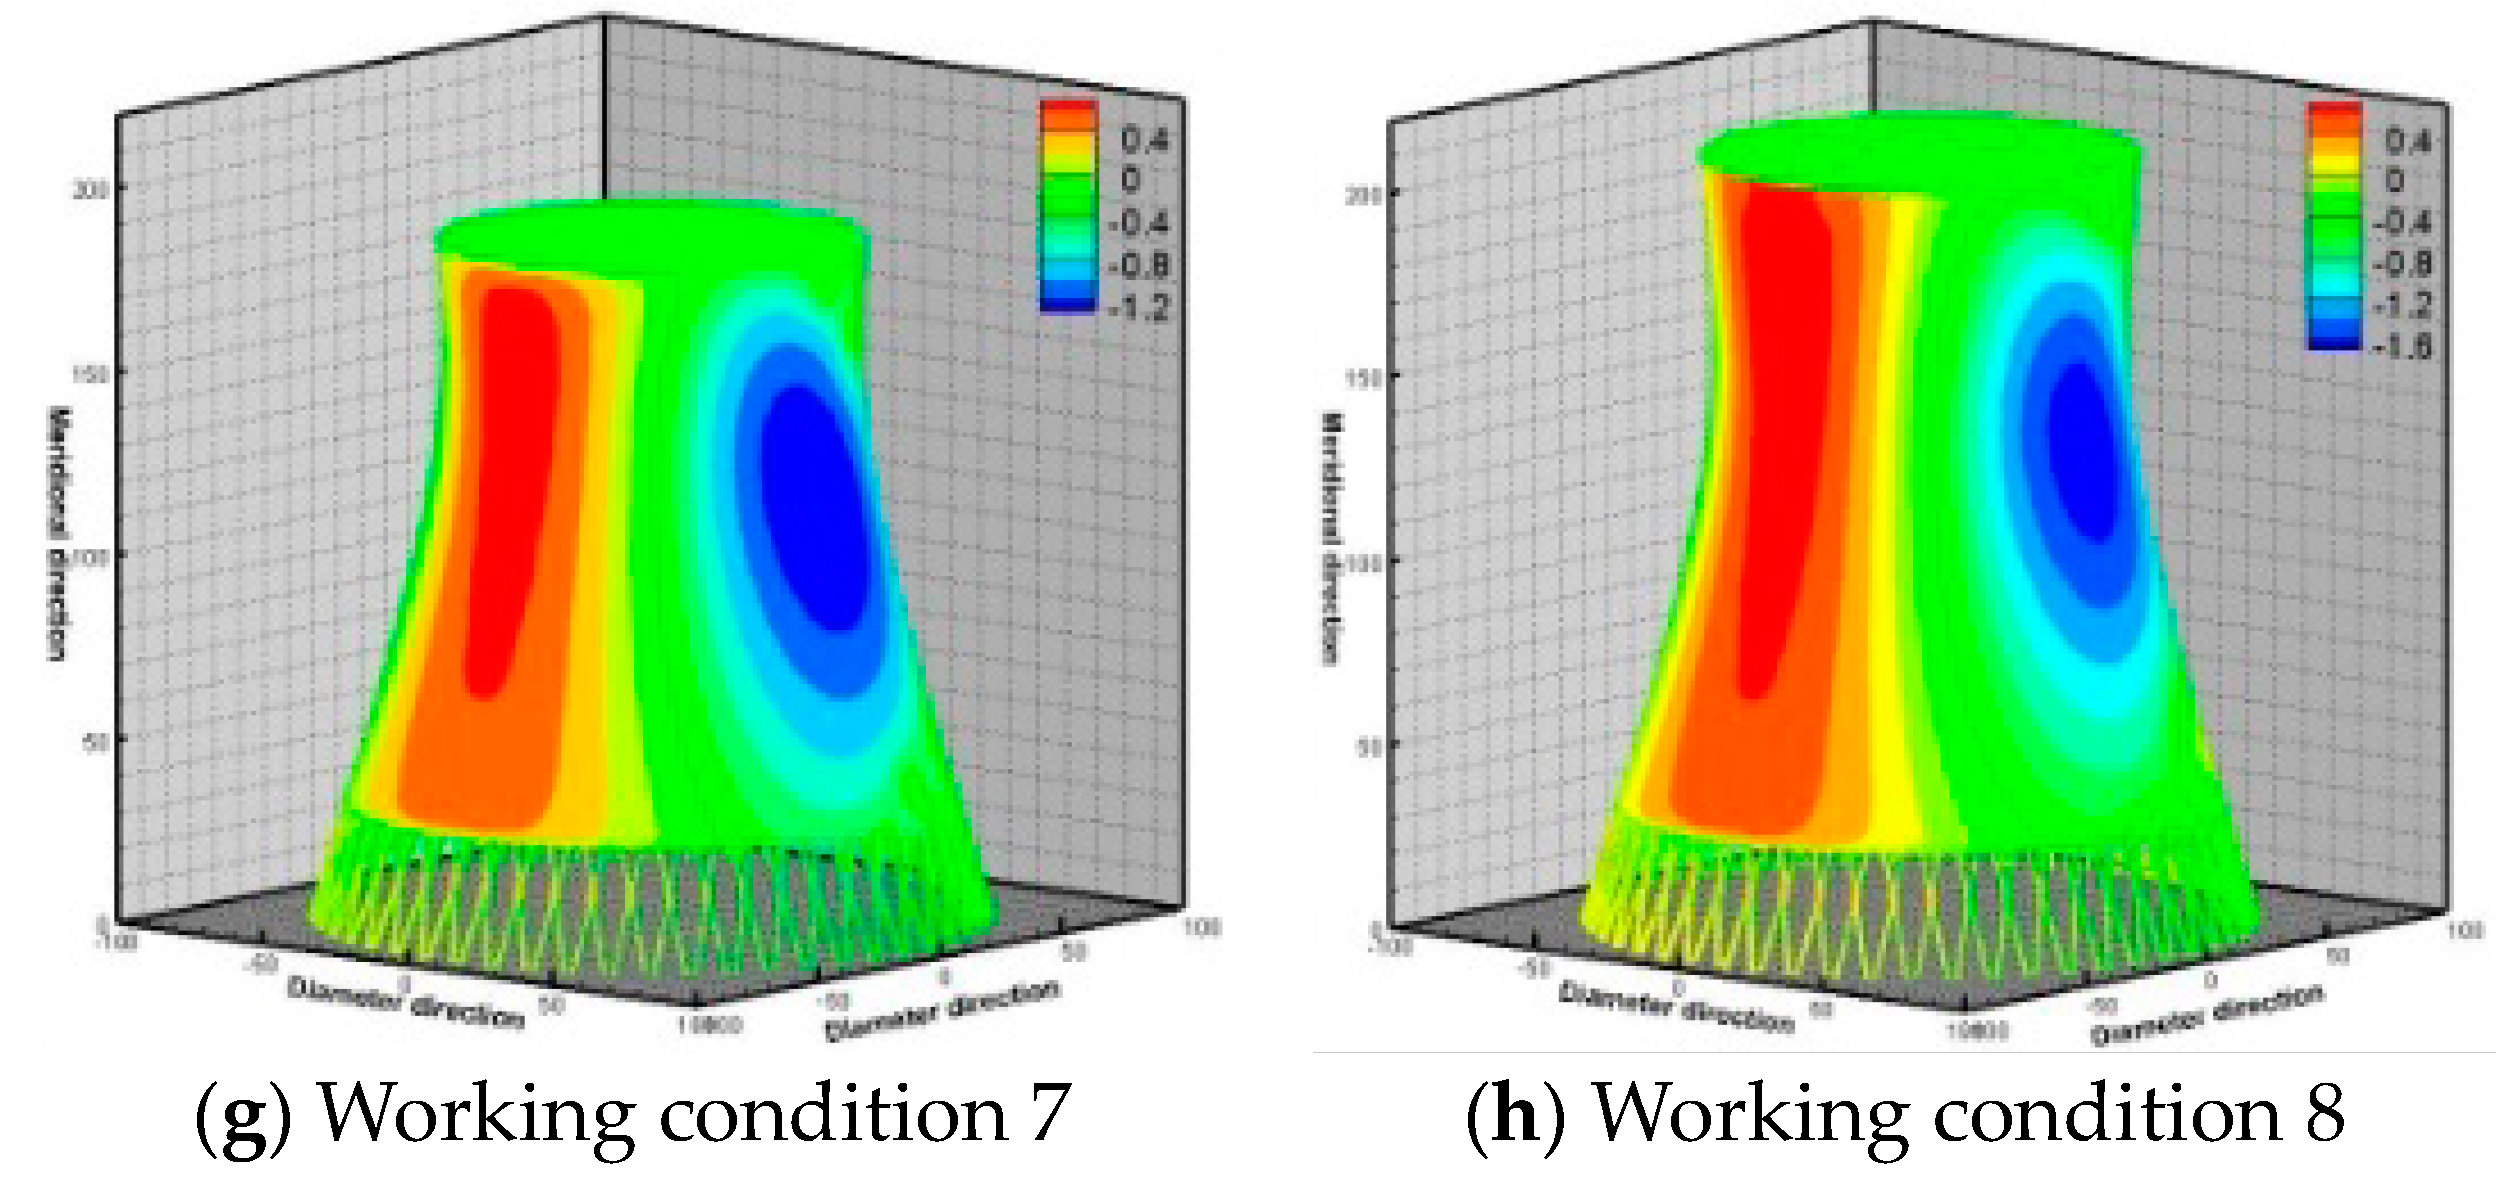
Figure 5 shows the nephograms of pressure coefficients on tower surface under eight typical working conditions. The distributions of pressure coefficient were basically consistent under different working conditions. The increase of construction height did not change the wind field characteristics of cylindrical structure. The flow separated in front of the tower body due to collision, which resulted in the separation bubble, and the bubble shedded off from the crosswind side. Consequently, there were positive and negative pressure distributions on the upward and crosswind sides of the tower body. The increase in the construction height greatly decreased the negative pressure on the crosswind and leeward sides, especially for the built-up tower.
3.4.3. Turbulent Kinetic Energy
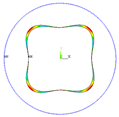
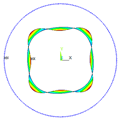
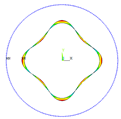
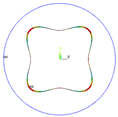
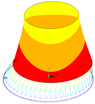
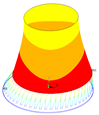
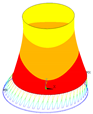
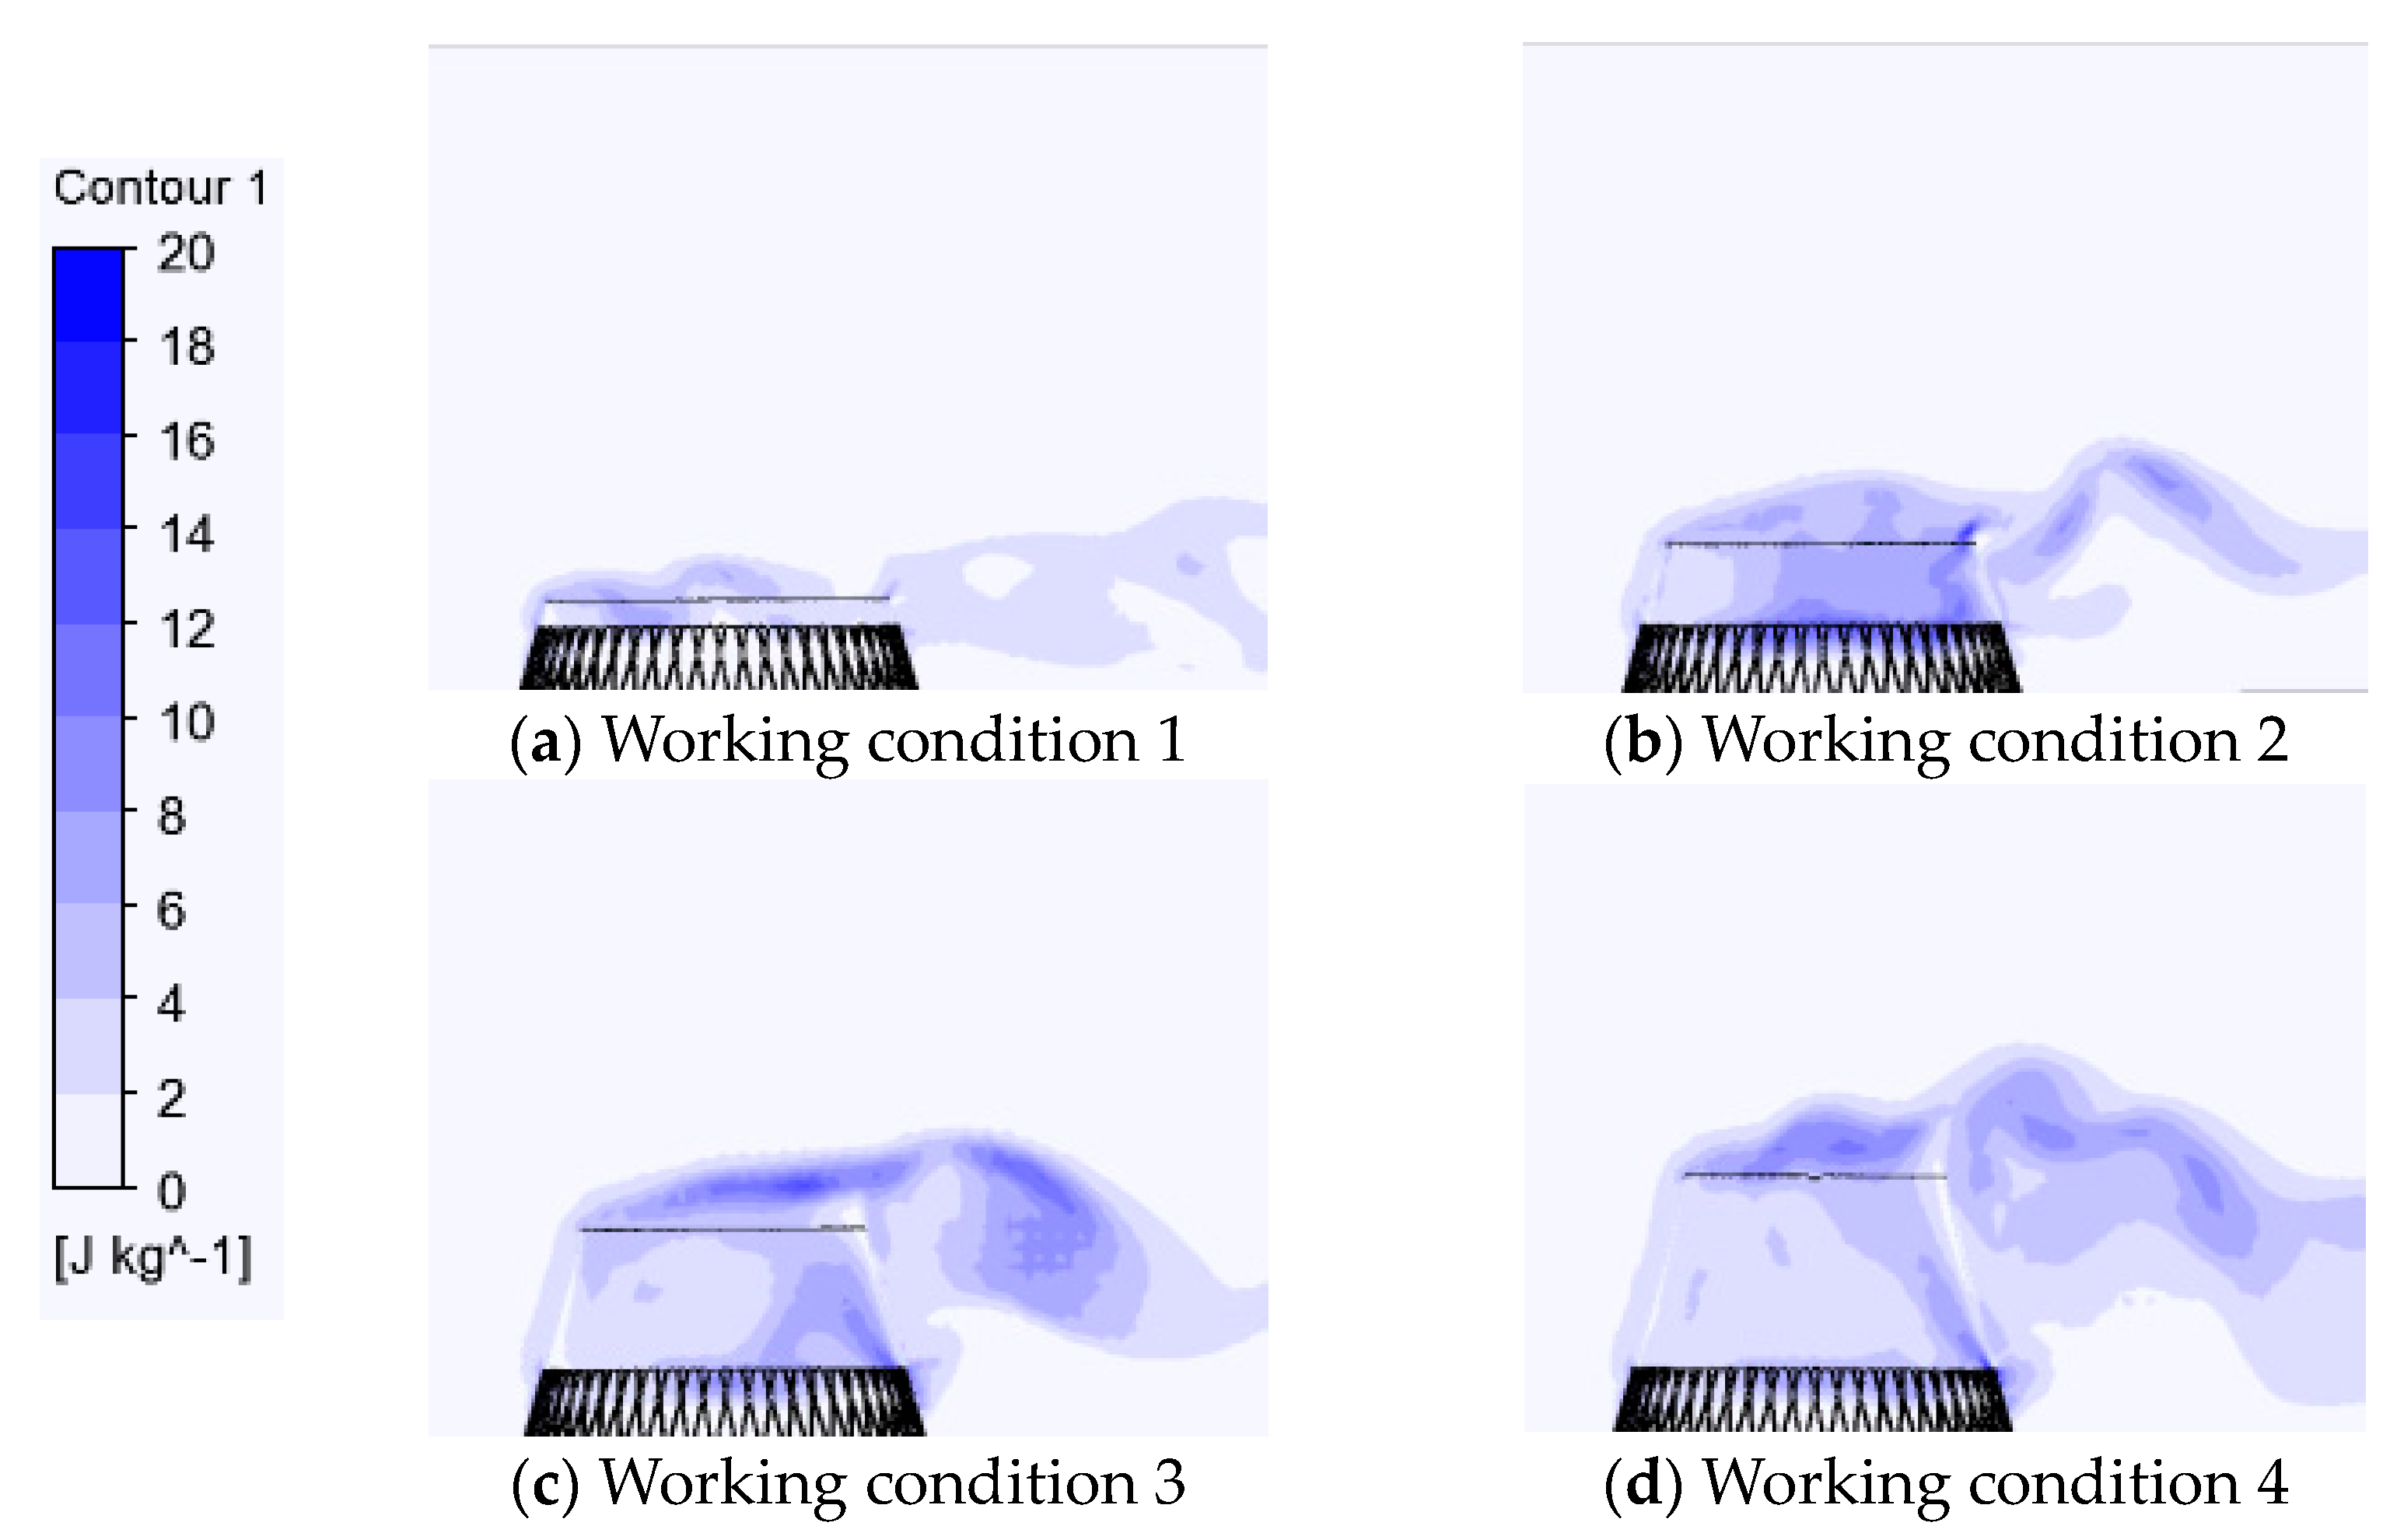
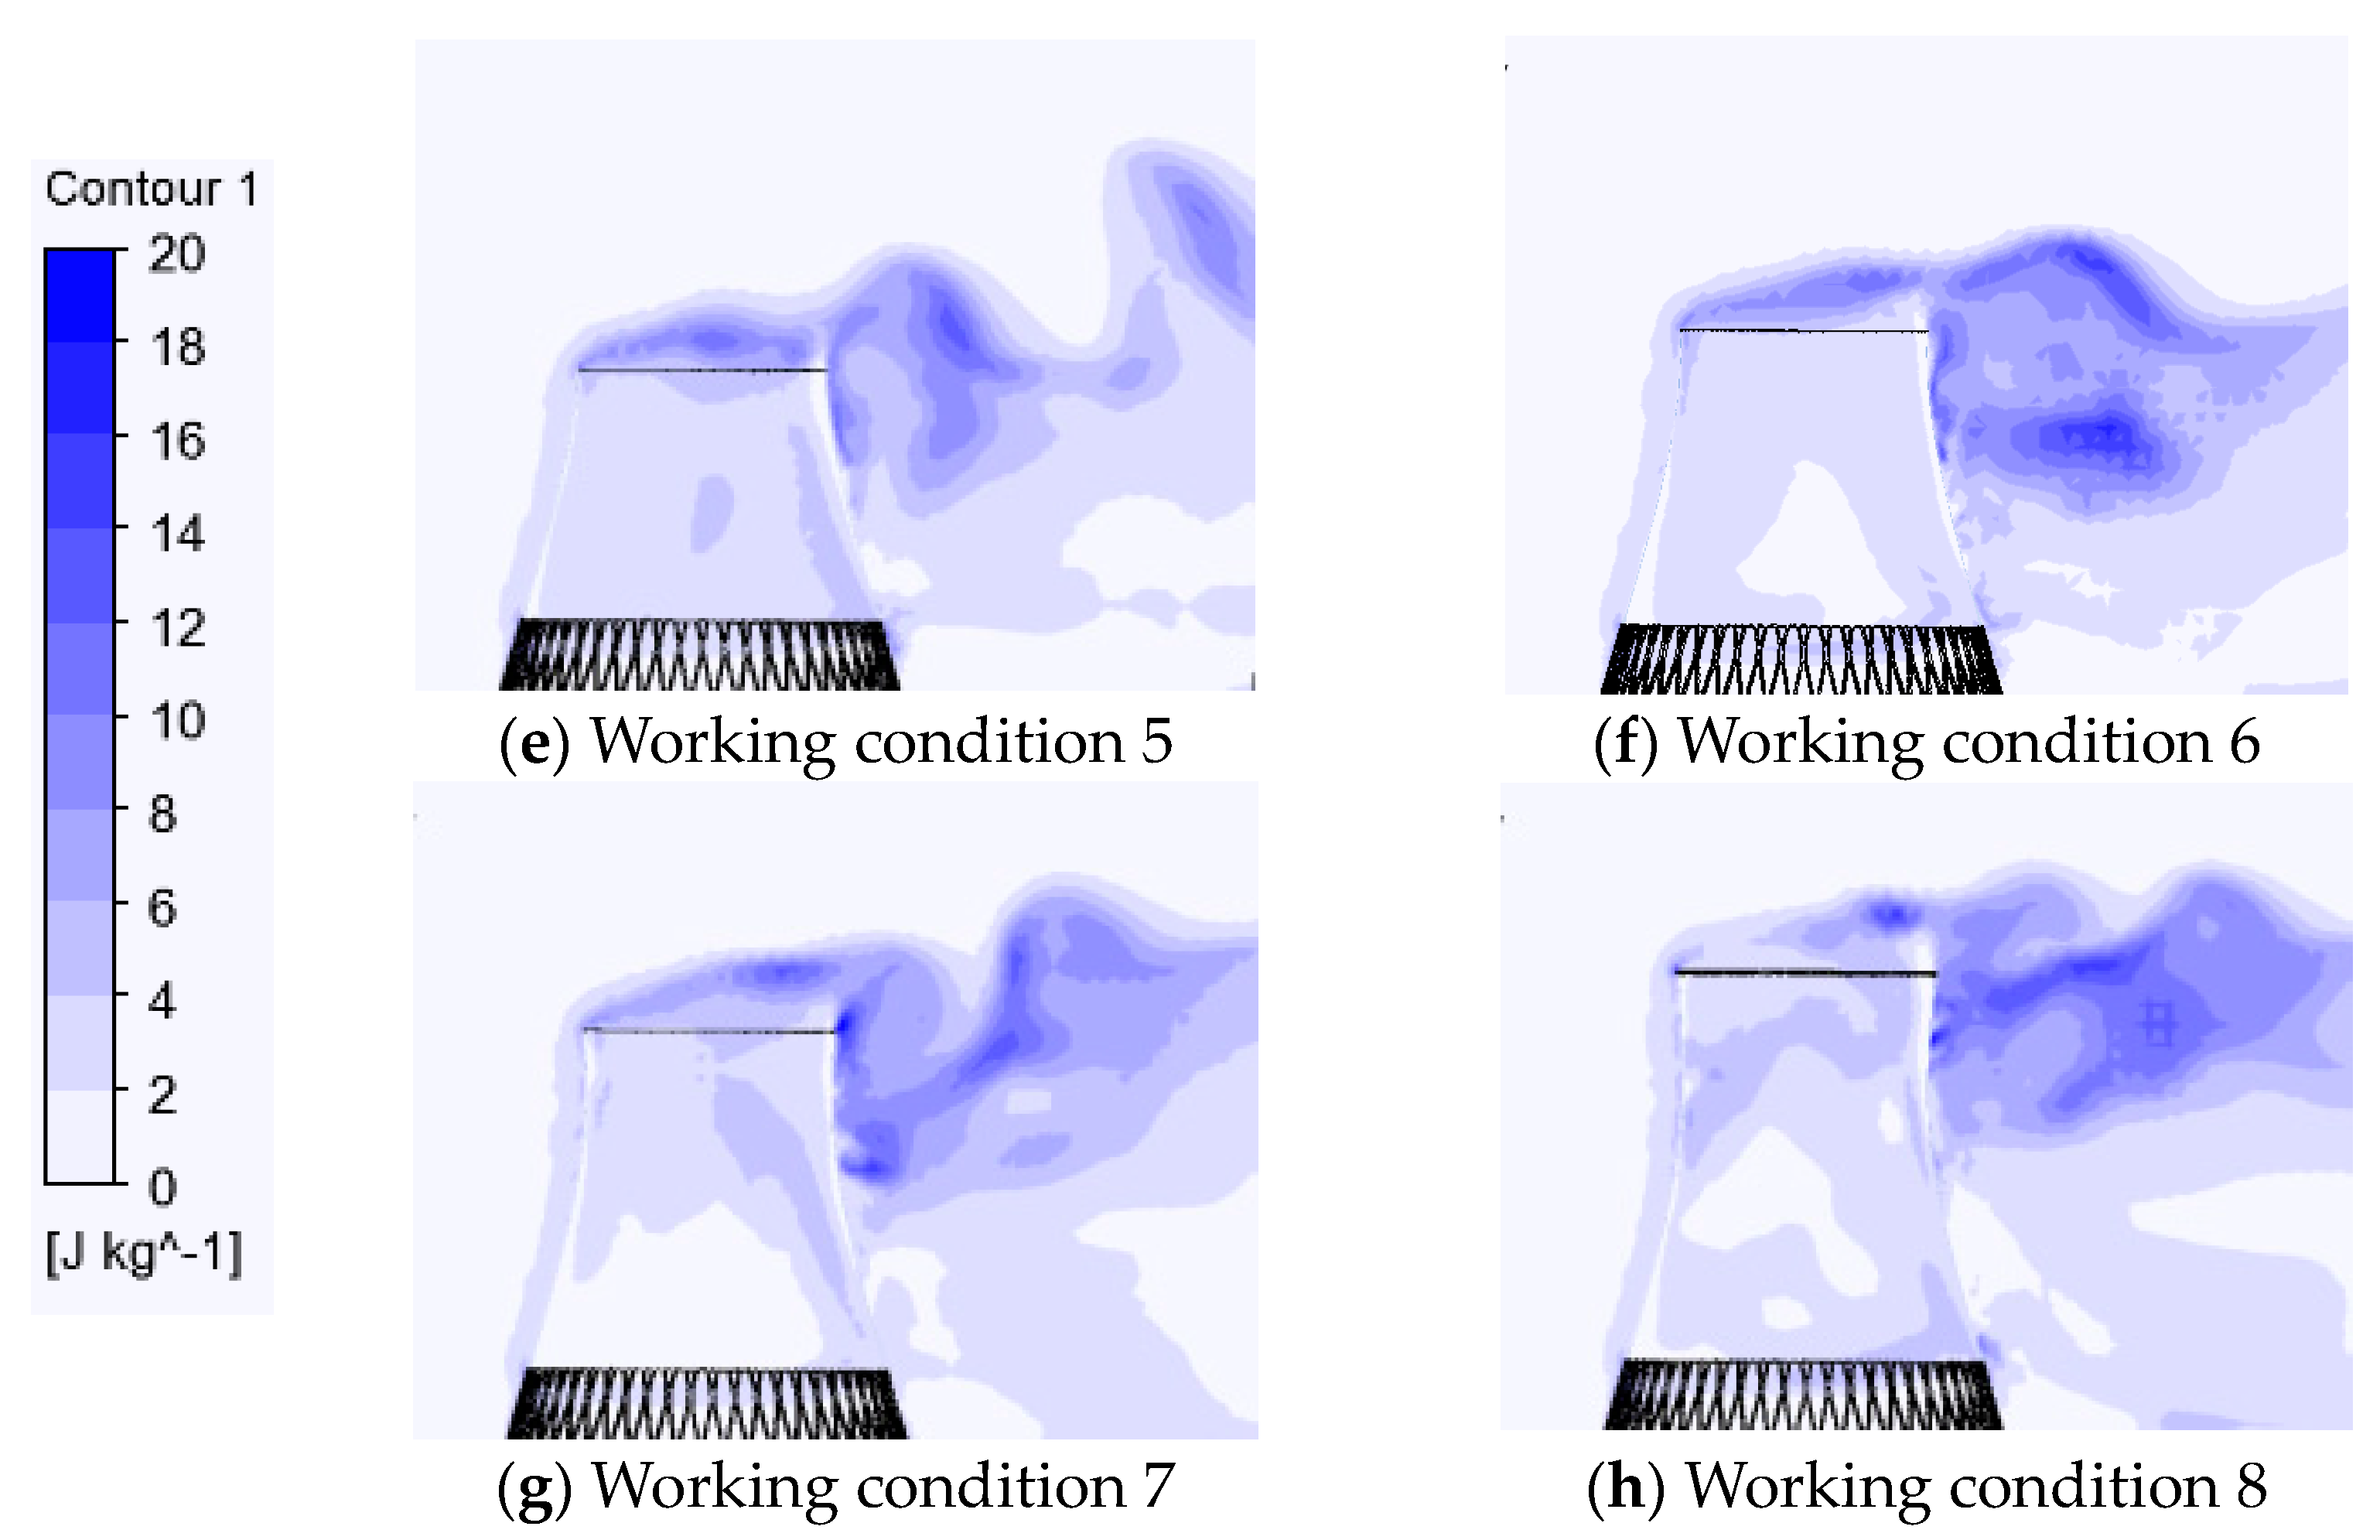
Figure 6 is the schematic for the turbulent kinetic energy distribution under the eight working conditions. There were significant differences between the eight working conditions. As the construction height increased, the scale component of maximum turbulent kinetic energy deviated from the upper end of the air inlet to the wake stream. In addition, as the construction height increased, the turbulent kinetic energy of fluid inside the tower decreased. This resulted in uniform distribution of internal pressure of the built-up tower along the circumferential and meridional directions.
4. Analysis of Dynamic Characteristics
The integrated model of the tower body–pillar–circular foundation was built using ANSYS software. The tower body, pillar, circular foundation, and elastic foundation were simulated with shell element, beam element, and spring element, respectively. The connections of circular foundation to the tower body and pillars were simulated using multi-point constraint and rigid domain, respectively. Block Lanczos method was employed to analyze the dynamic characteristics of finite element (FE) model of the cooling tower through the whole construction process.
Table 3 shows the fundamental frequencies and vibration mode distribution under each working condition.
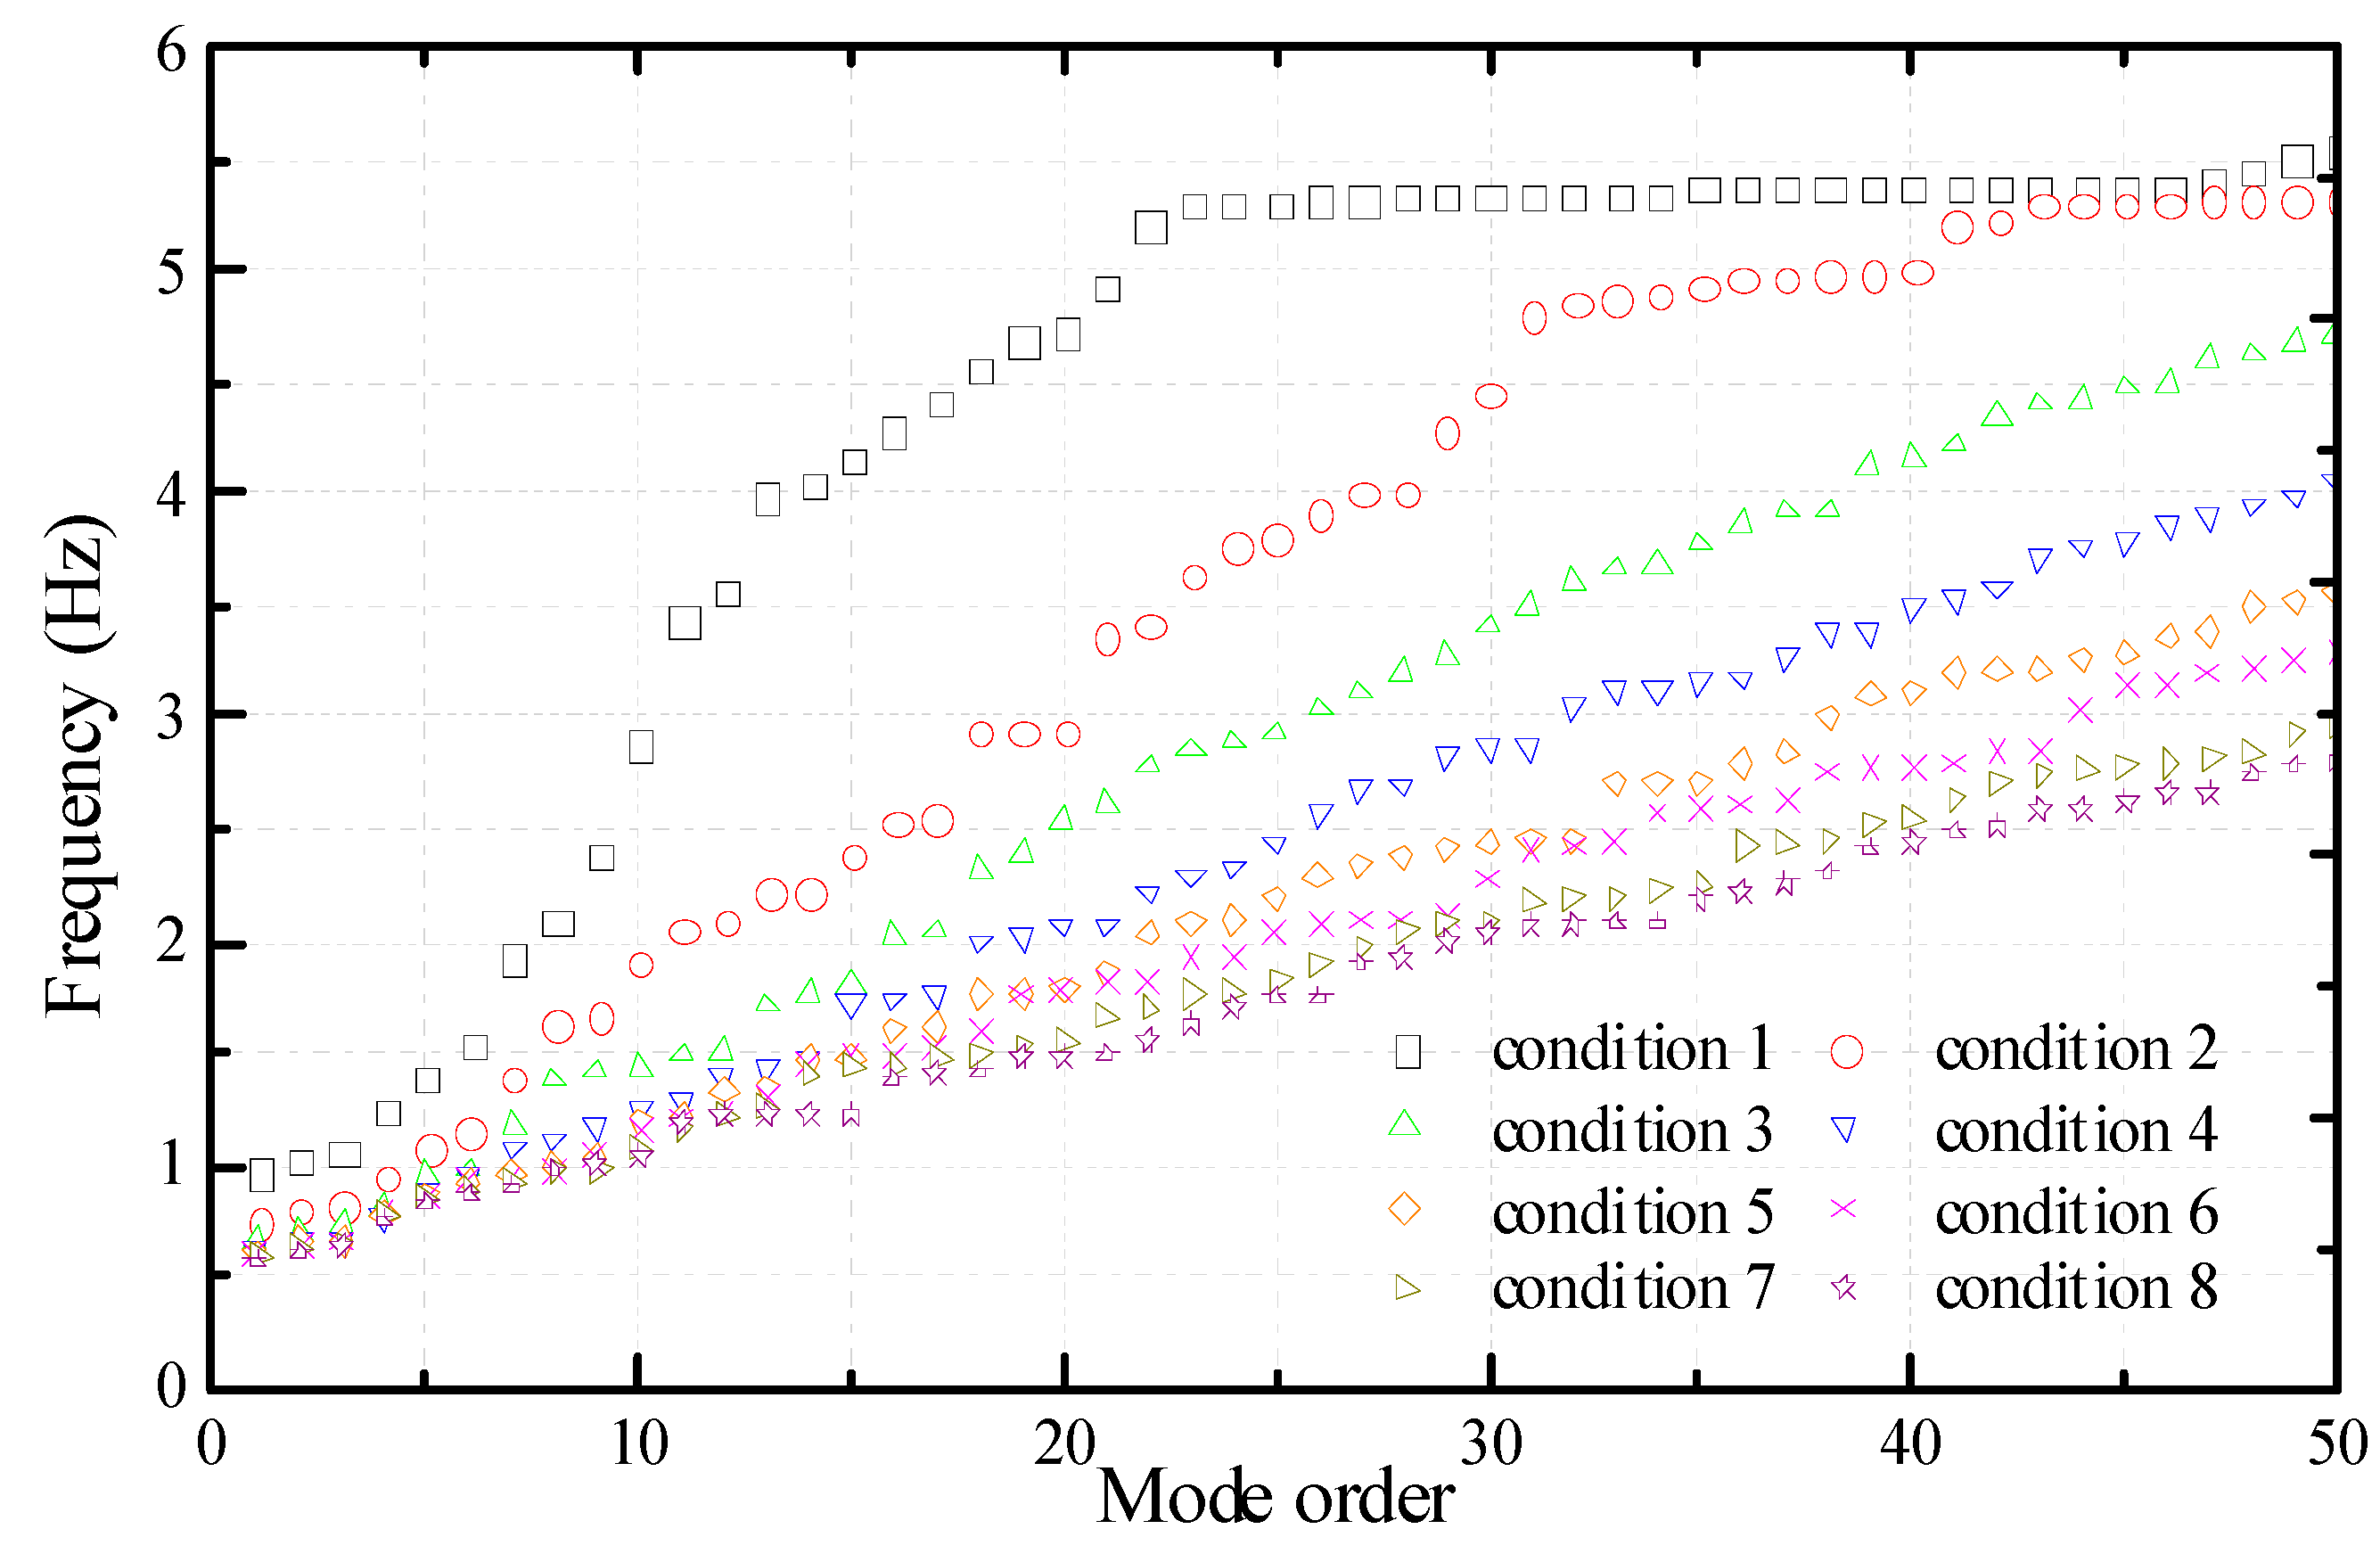
Figure 7 is the distribution curve of natural frequencies of the first fifty modes under different working conditions. It can be seen that construction height had a significant impact on lower-order frequencies, but a lesser impact on higher-order frequencies. As the construction height increased, the fundamental frequencies of the cooling tower decreased. The fundamental frequency was the largest under working condition 1, which was 0.963 Hz.
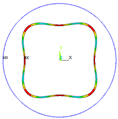
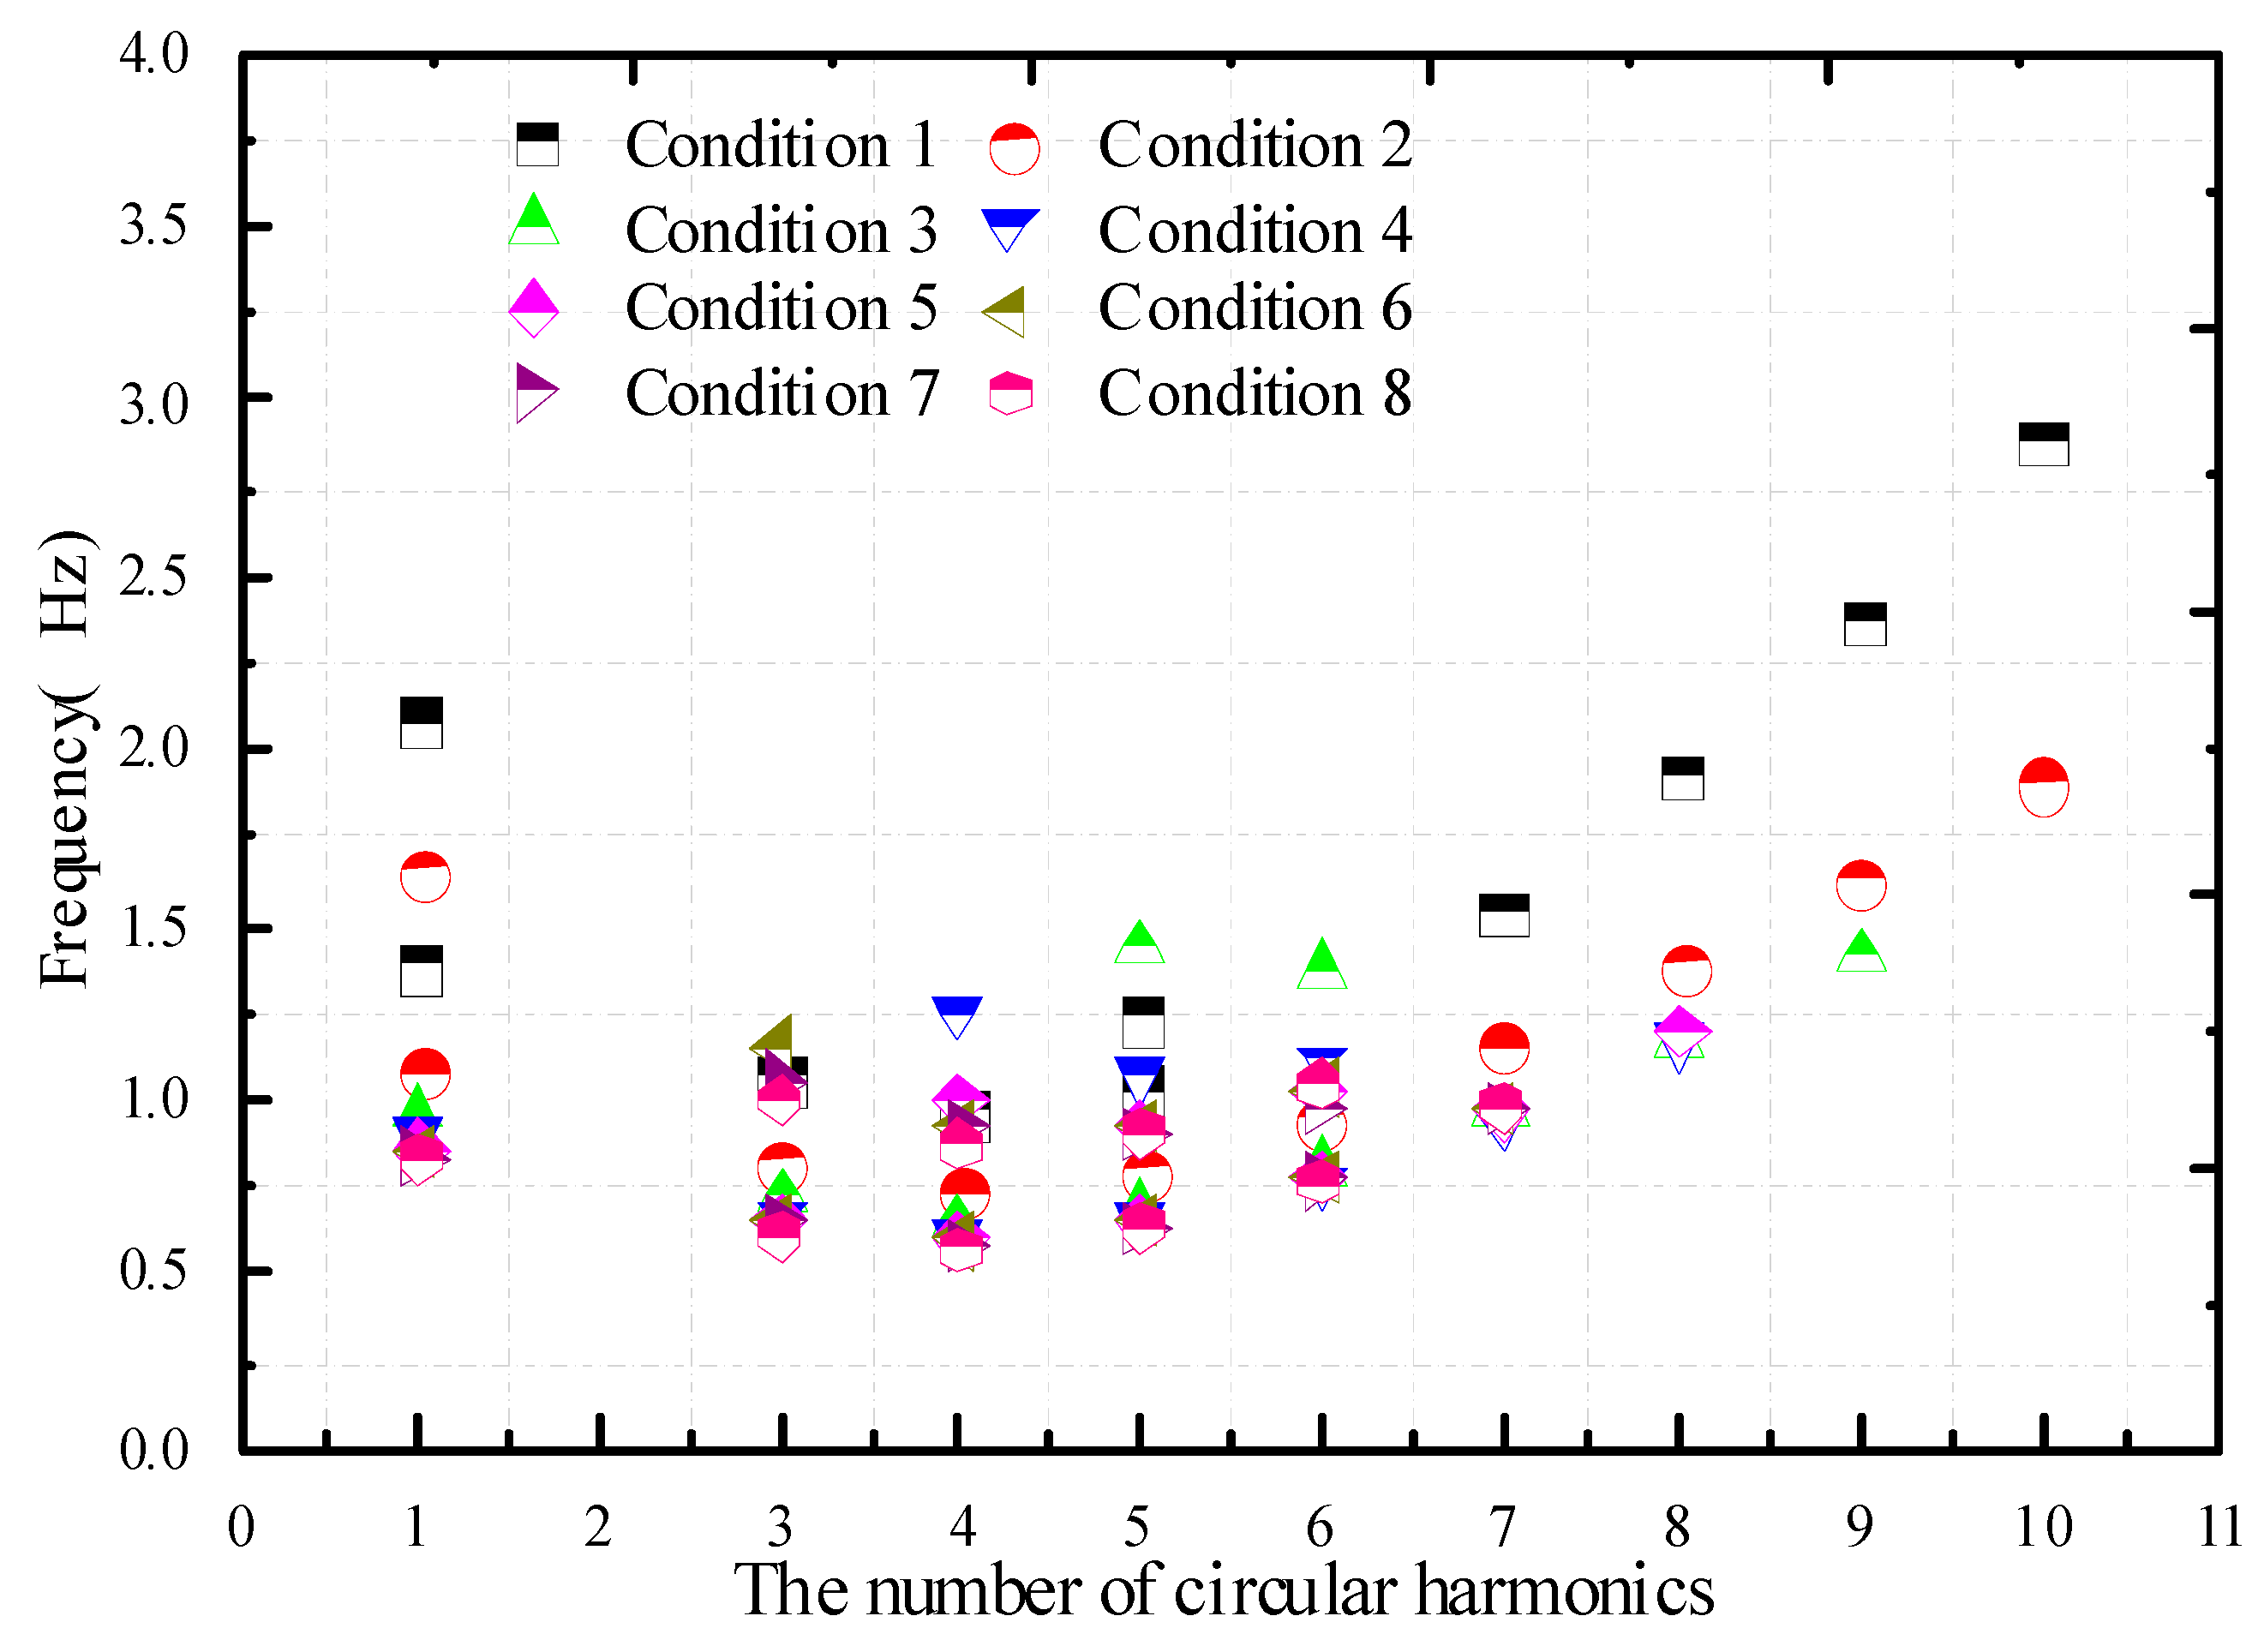
Figure 8 shows the changes of natural frequencies of the first ten modes with the number of circumferential harmonics under each working condition. Comparison shows that the minimum natural frequencies occurred when the number of circumferential harmonics was 4 under different working conditions. As the natural frequencies increased, the number of circumferential harmonics increased as well.
Table 4 shows the capsize modes of the cooling tower for the whole construction process. As the construction height increased, the order of capsize mode also increased, while the frequency corresponding to the excitation mode decreased.
5. Analysis of Differential Wind Vibration Coefficient for the Whole Construction Process
5.1. Methods and Parameter Explanations
Full transient dynamic analysis was performed to solve the dynamic equilibrium equations. The core principle was to use implicit methods, such as the Newmark method and HHT (Hilber–Hughes–Taylor) to directly solve the transient problems. The Newmark method uses the finite difference method, ad within one time interval, there are
where
α and
δ are integral parameters. However, the use of the Newmark method for the calculation of discrete spatial domain in FE model cannot satisfy the requirement (that is, numerical damping at high frequencies should not be introduced at the expense of precision, and not too many values of numerical damping should be generated at low frequencies). This defect can be compensated by combining with HHT method.
The basic HHT has the following expression:
where
;
;
;
.
In order to ensure unconditional stability of the second-order system without reducing the accuracy of time integral, four parameters
α,
δ,
αf, and
αm should satisfy the following relationships:
Combining Formulae (2), (4), and (6),
where
,
,
,
,
,
.
For terrain category B, the basic wind speed was 23.7 m/s and the damping ratio of the structure was 5%. Then the wind vibration coefficient was calculated as follows:
where
βRi is the wind vibration coefficient of node
i;
Ri,
, and
σt are the overall response, average response, and pulsating response of node
I, respectively;
g is peak factor of node
I, taken as 3.0 (Ke et al. 2012).
5.2. Distribution of Wind Vibration Coefficient
Based on the time history under eight working conditions, the wind vibration coefficient was calculated dynamically. The distributions of wind vibration coefficient for the whole construction process were discussed under five equivalent targets, as shown in
Table 5.
The equivalent target 3–1 is the wind vibration coefficient and its mean value of the meridional axial force, the equivalent target 3–2 is the wind vibration coefficient and its mean value of the toroidal bending moment, and the equivalent target 3–3 is the wind vibration coefficient and its mean value of the radial displacement.
Equivalent goals 4–1, 4–2, 4–3 and equivalent goals 5–1, 5–2, 5–3 have the same representative meaning as above, which is not repeated here.
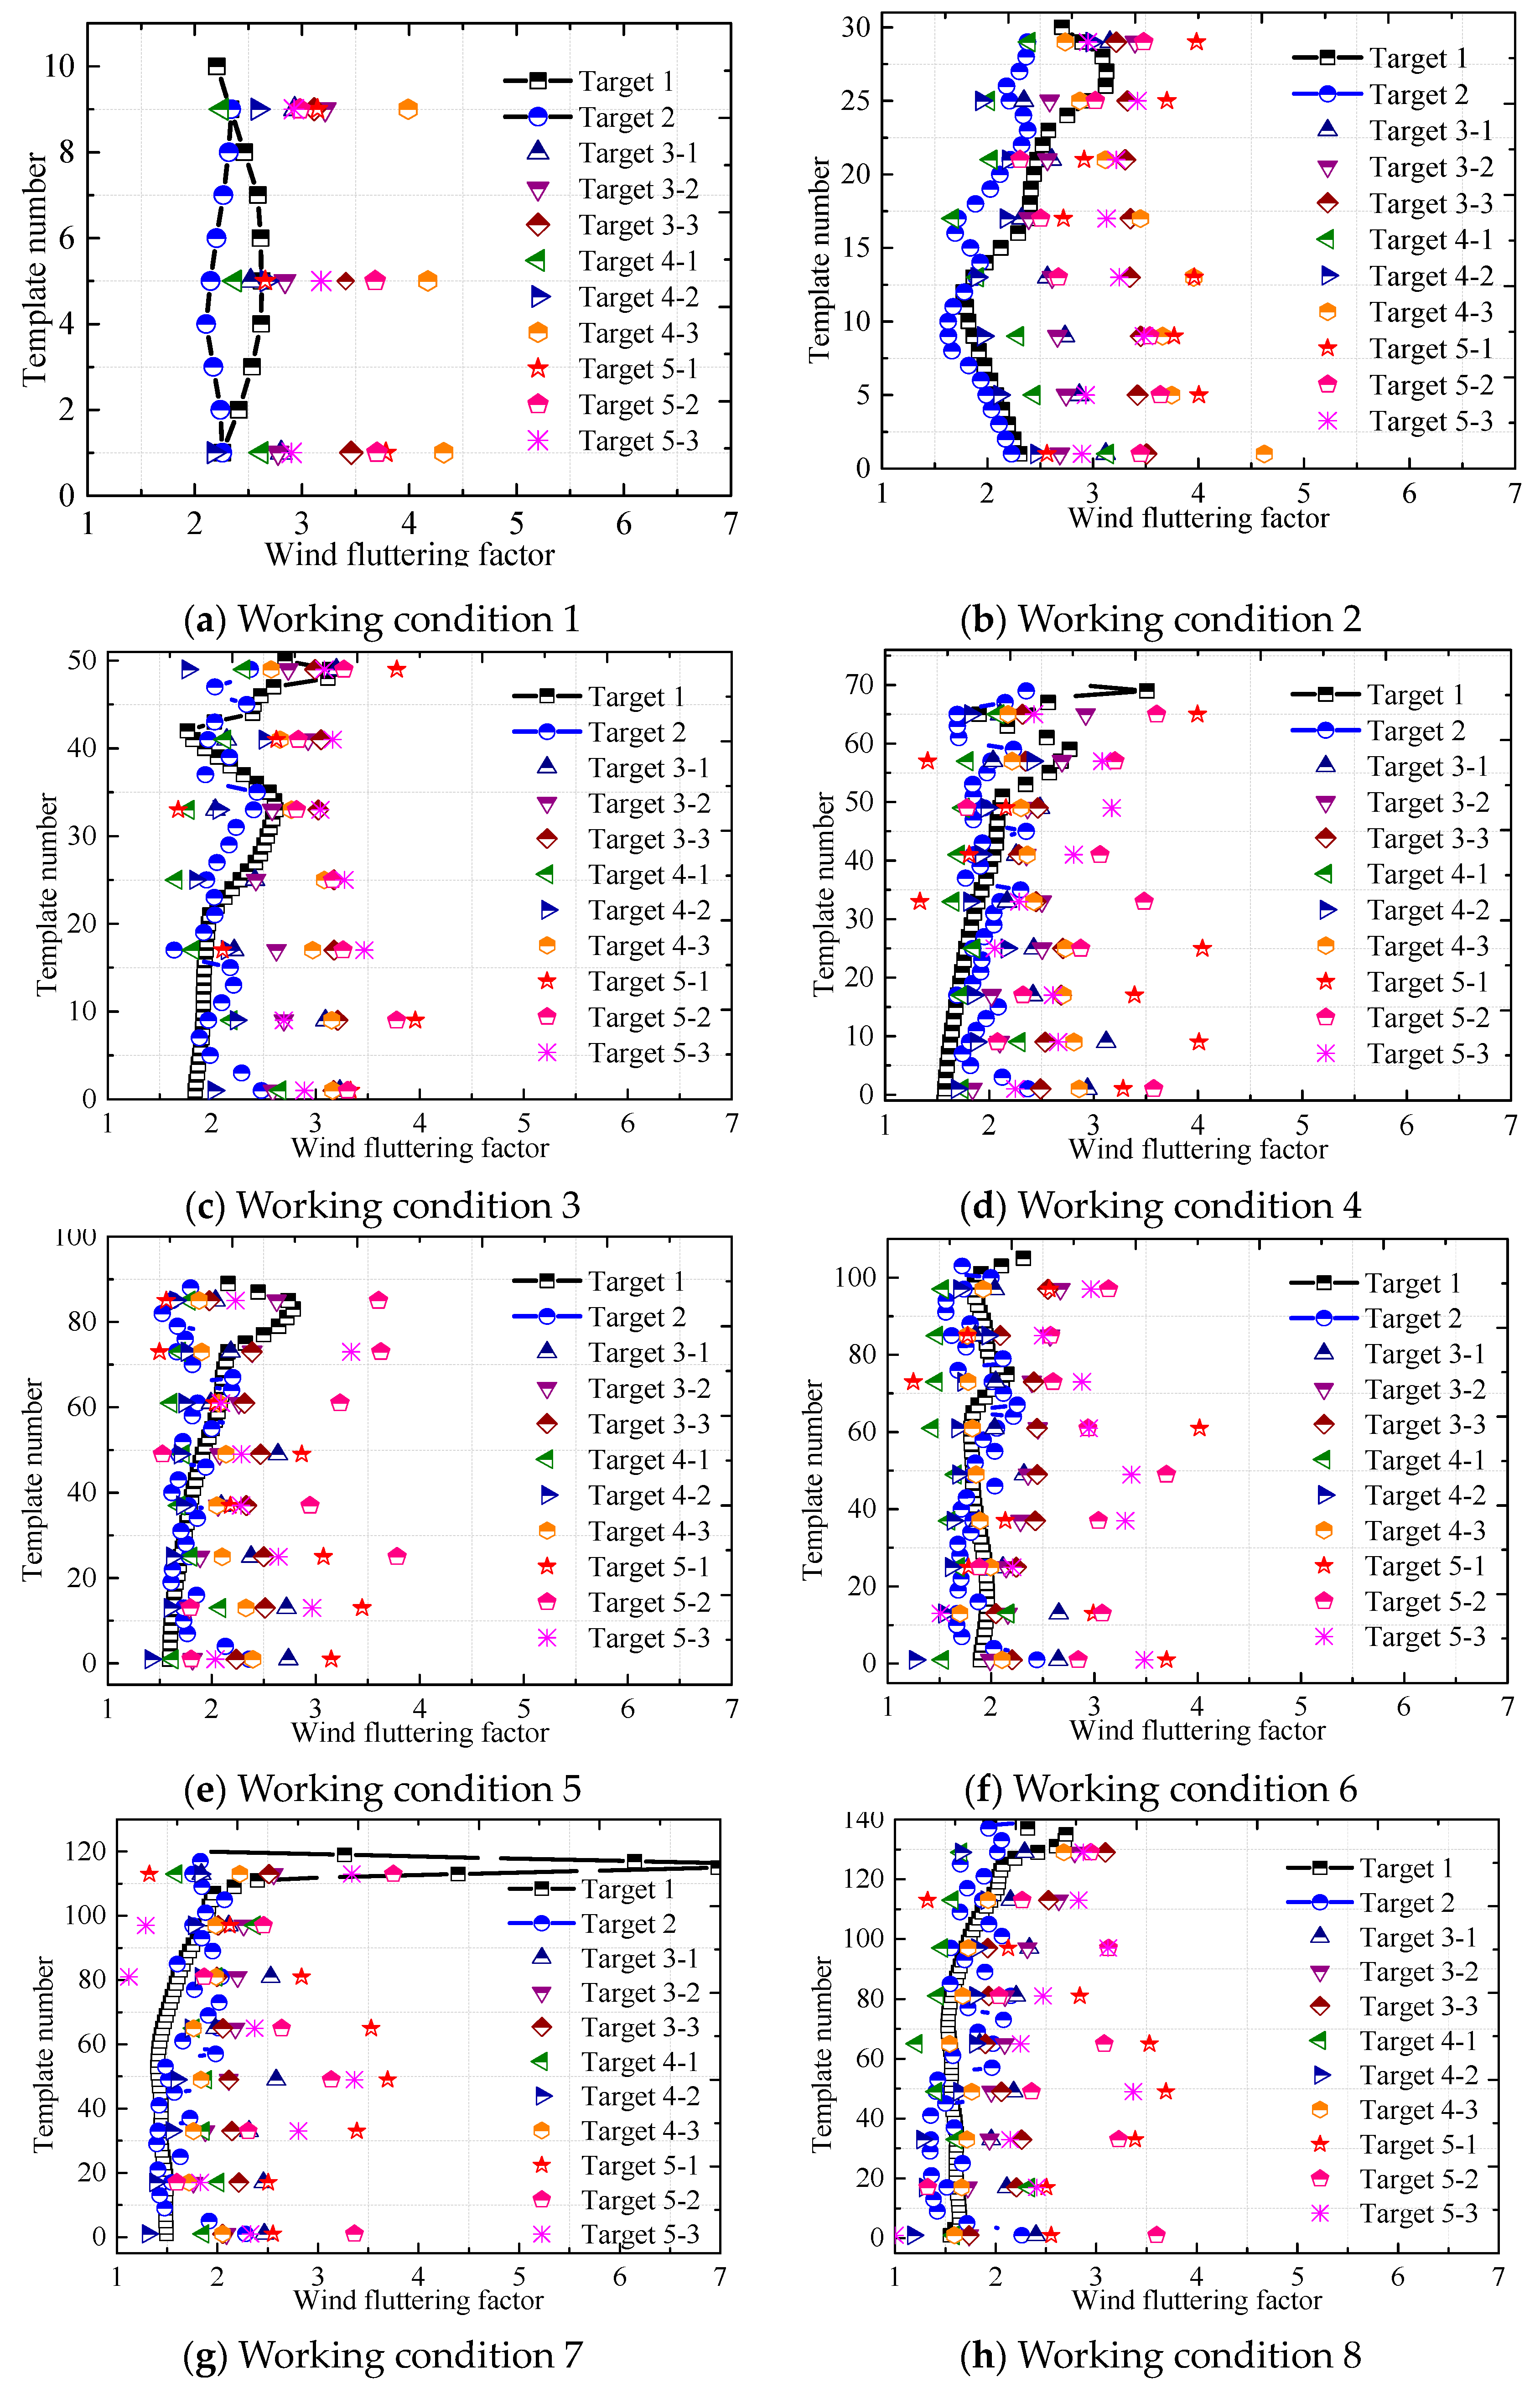
Figure 9 shows the distributions of wind vibration coefficient with construction height under five equivalent targets. It can be found that the wind vibration coefficient decreased with height under the eight working conditions. For the same construction model, the wind vibration coefficient was the largest under equivalent target 5, and that under equivalent target 1 was the smallest.
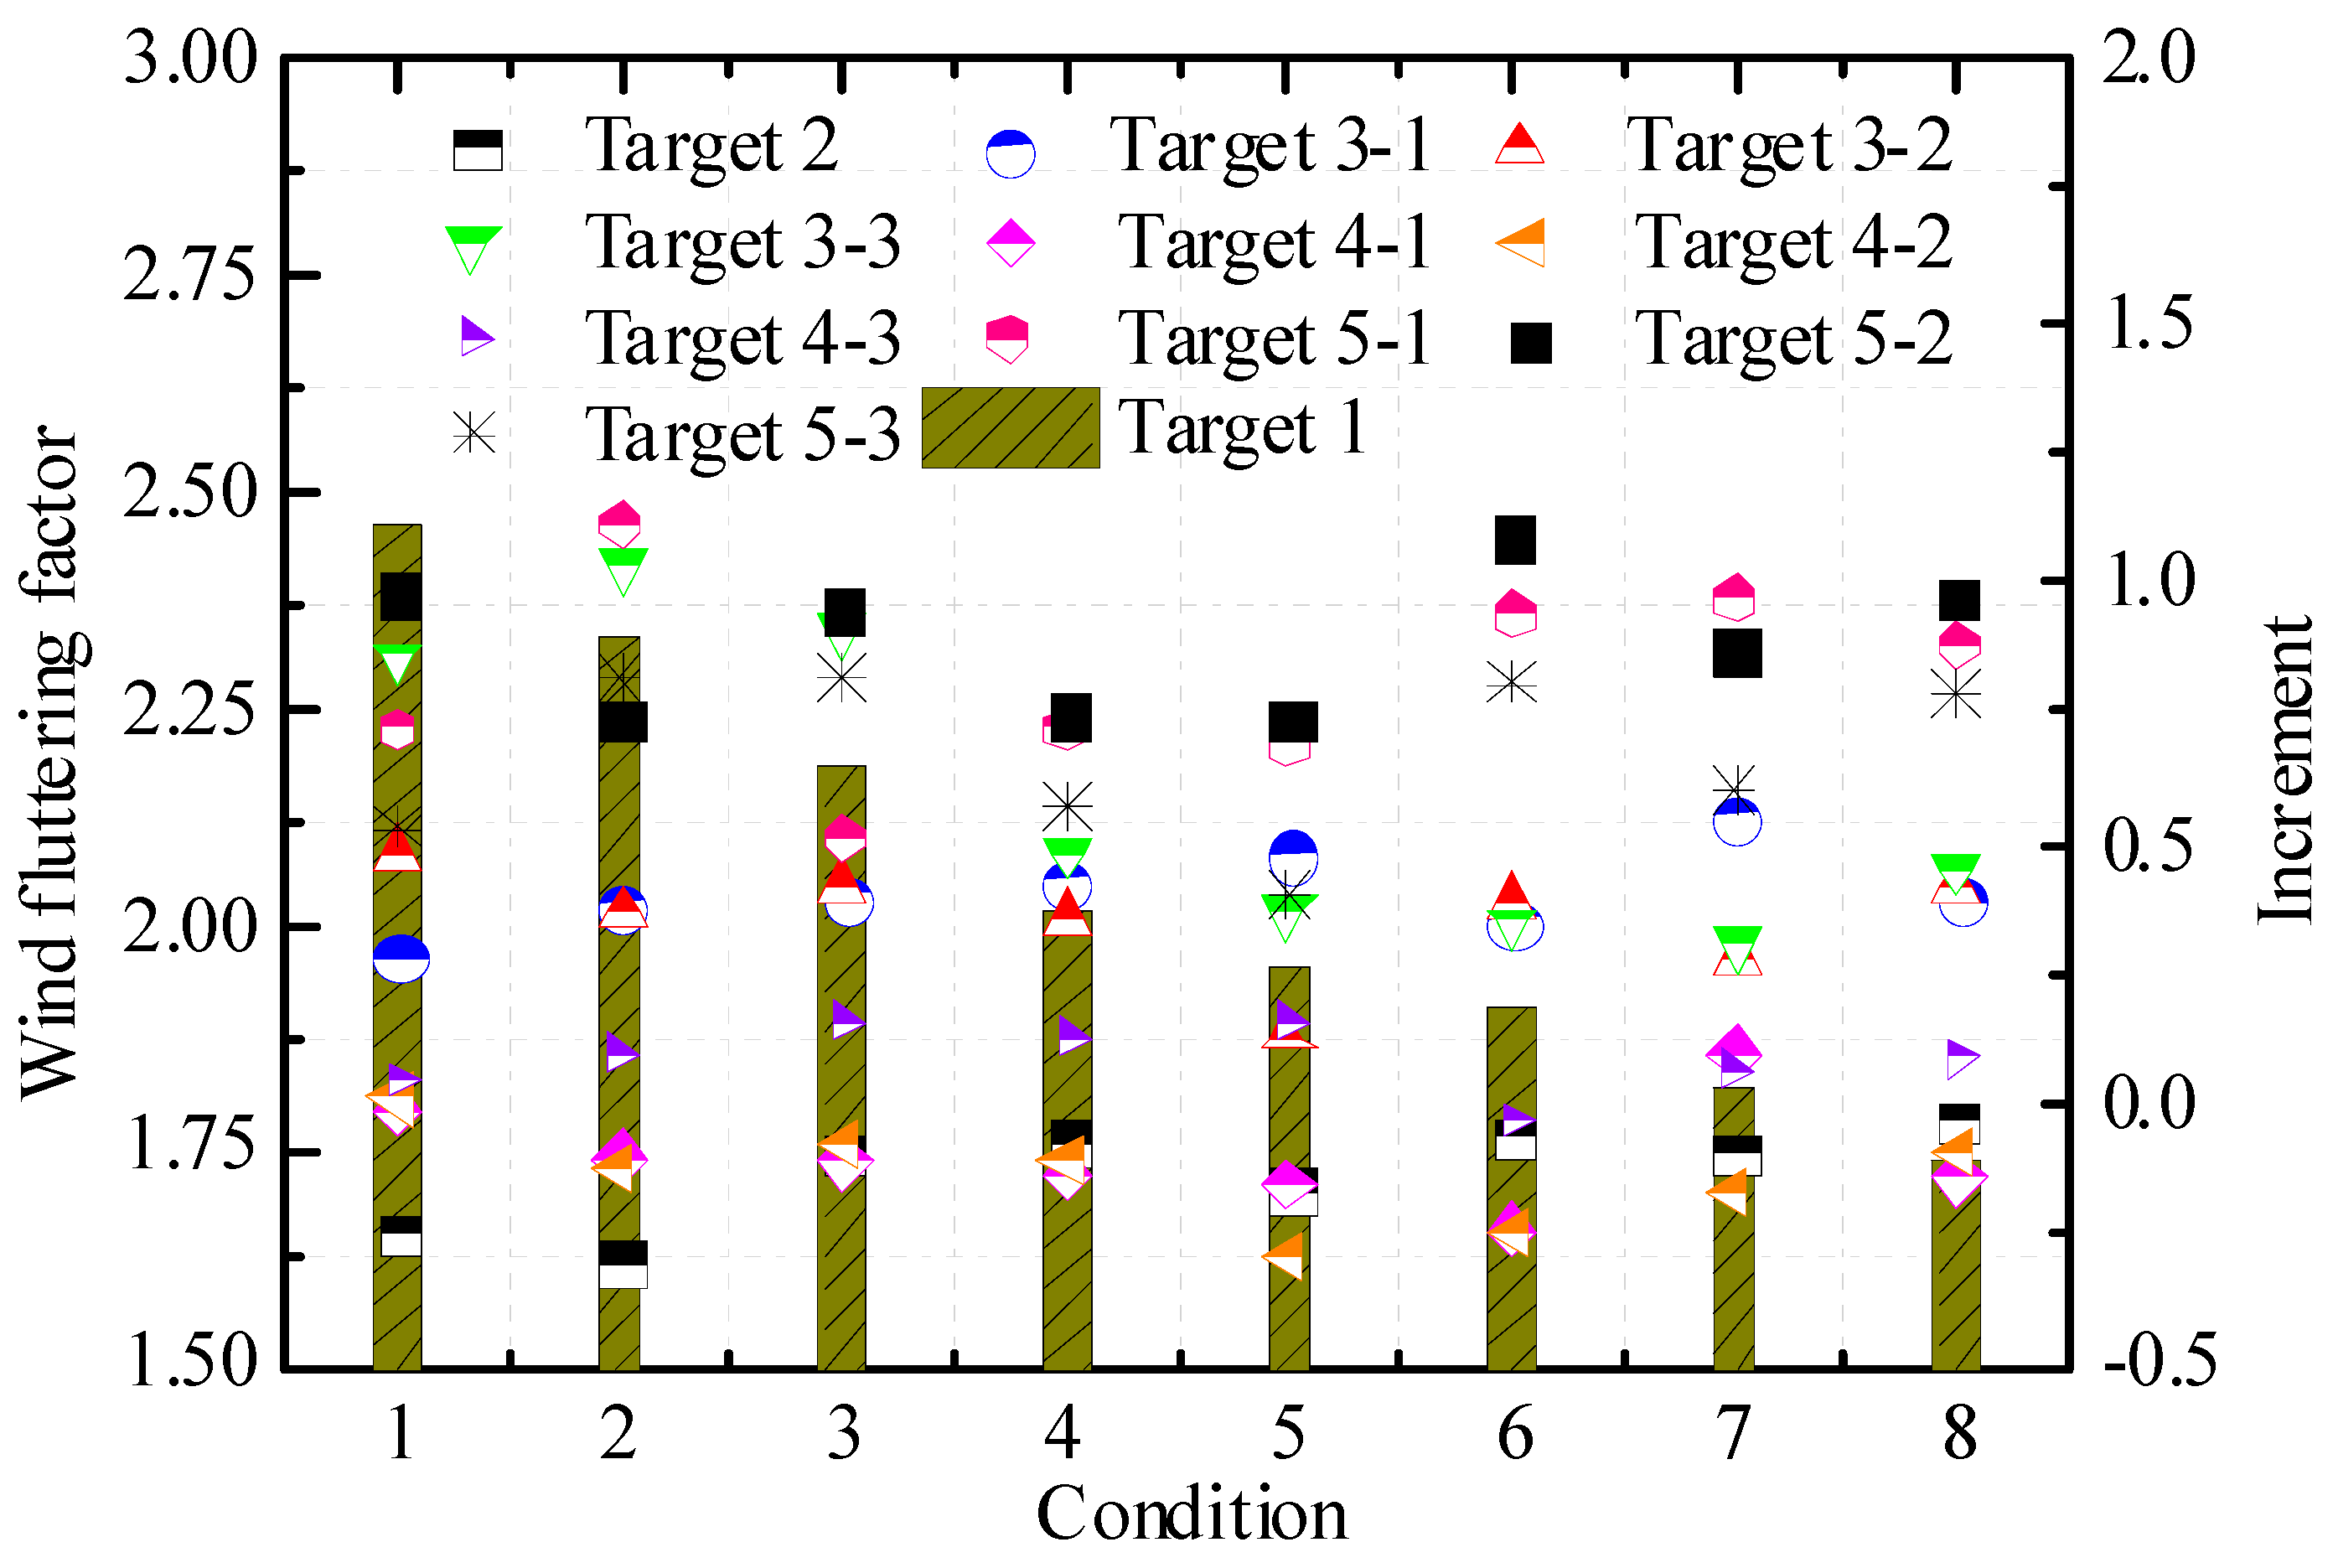
Figure 10 shows the recommended values of wind fluttering coefficient under the eight working conditions for the five equivalent targets. Equivalent target 1 was the value of wind vibration coefficient, while all other equivalent targets were increments relative to target 1.
5.3. Fitting Formula of Wind Vibration Coefficient
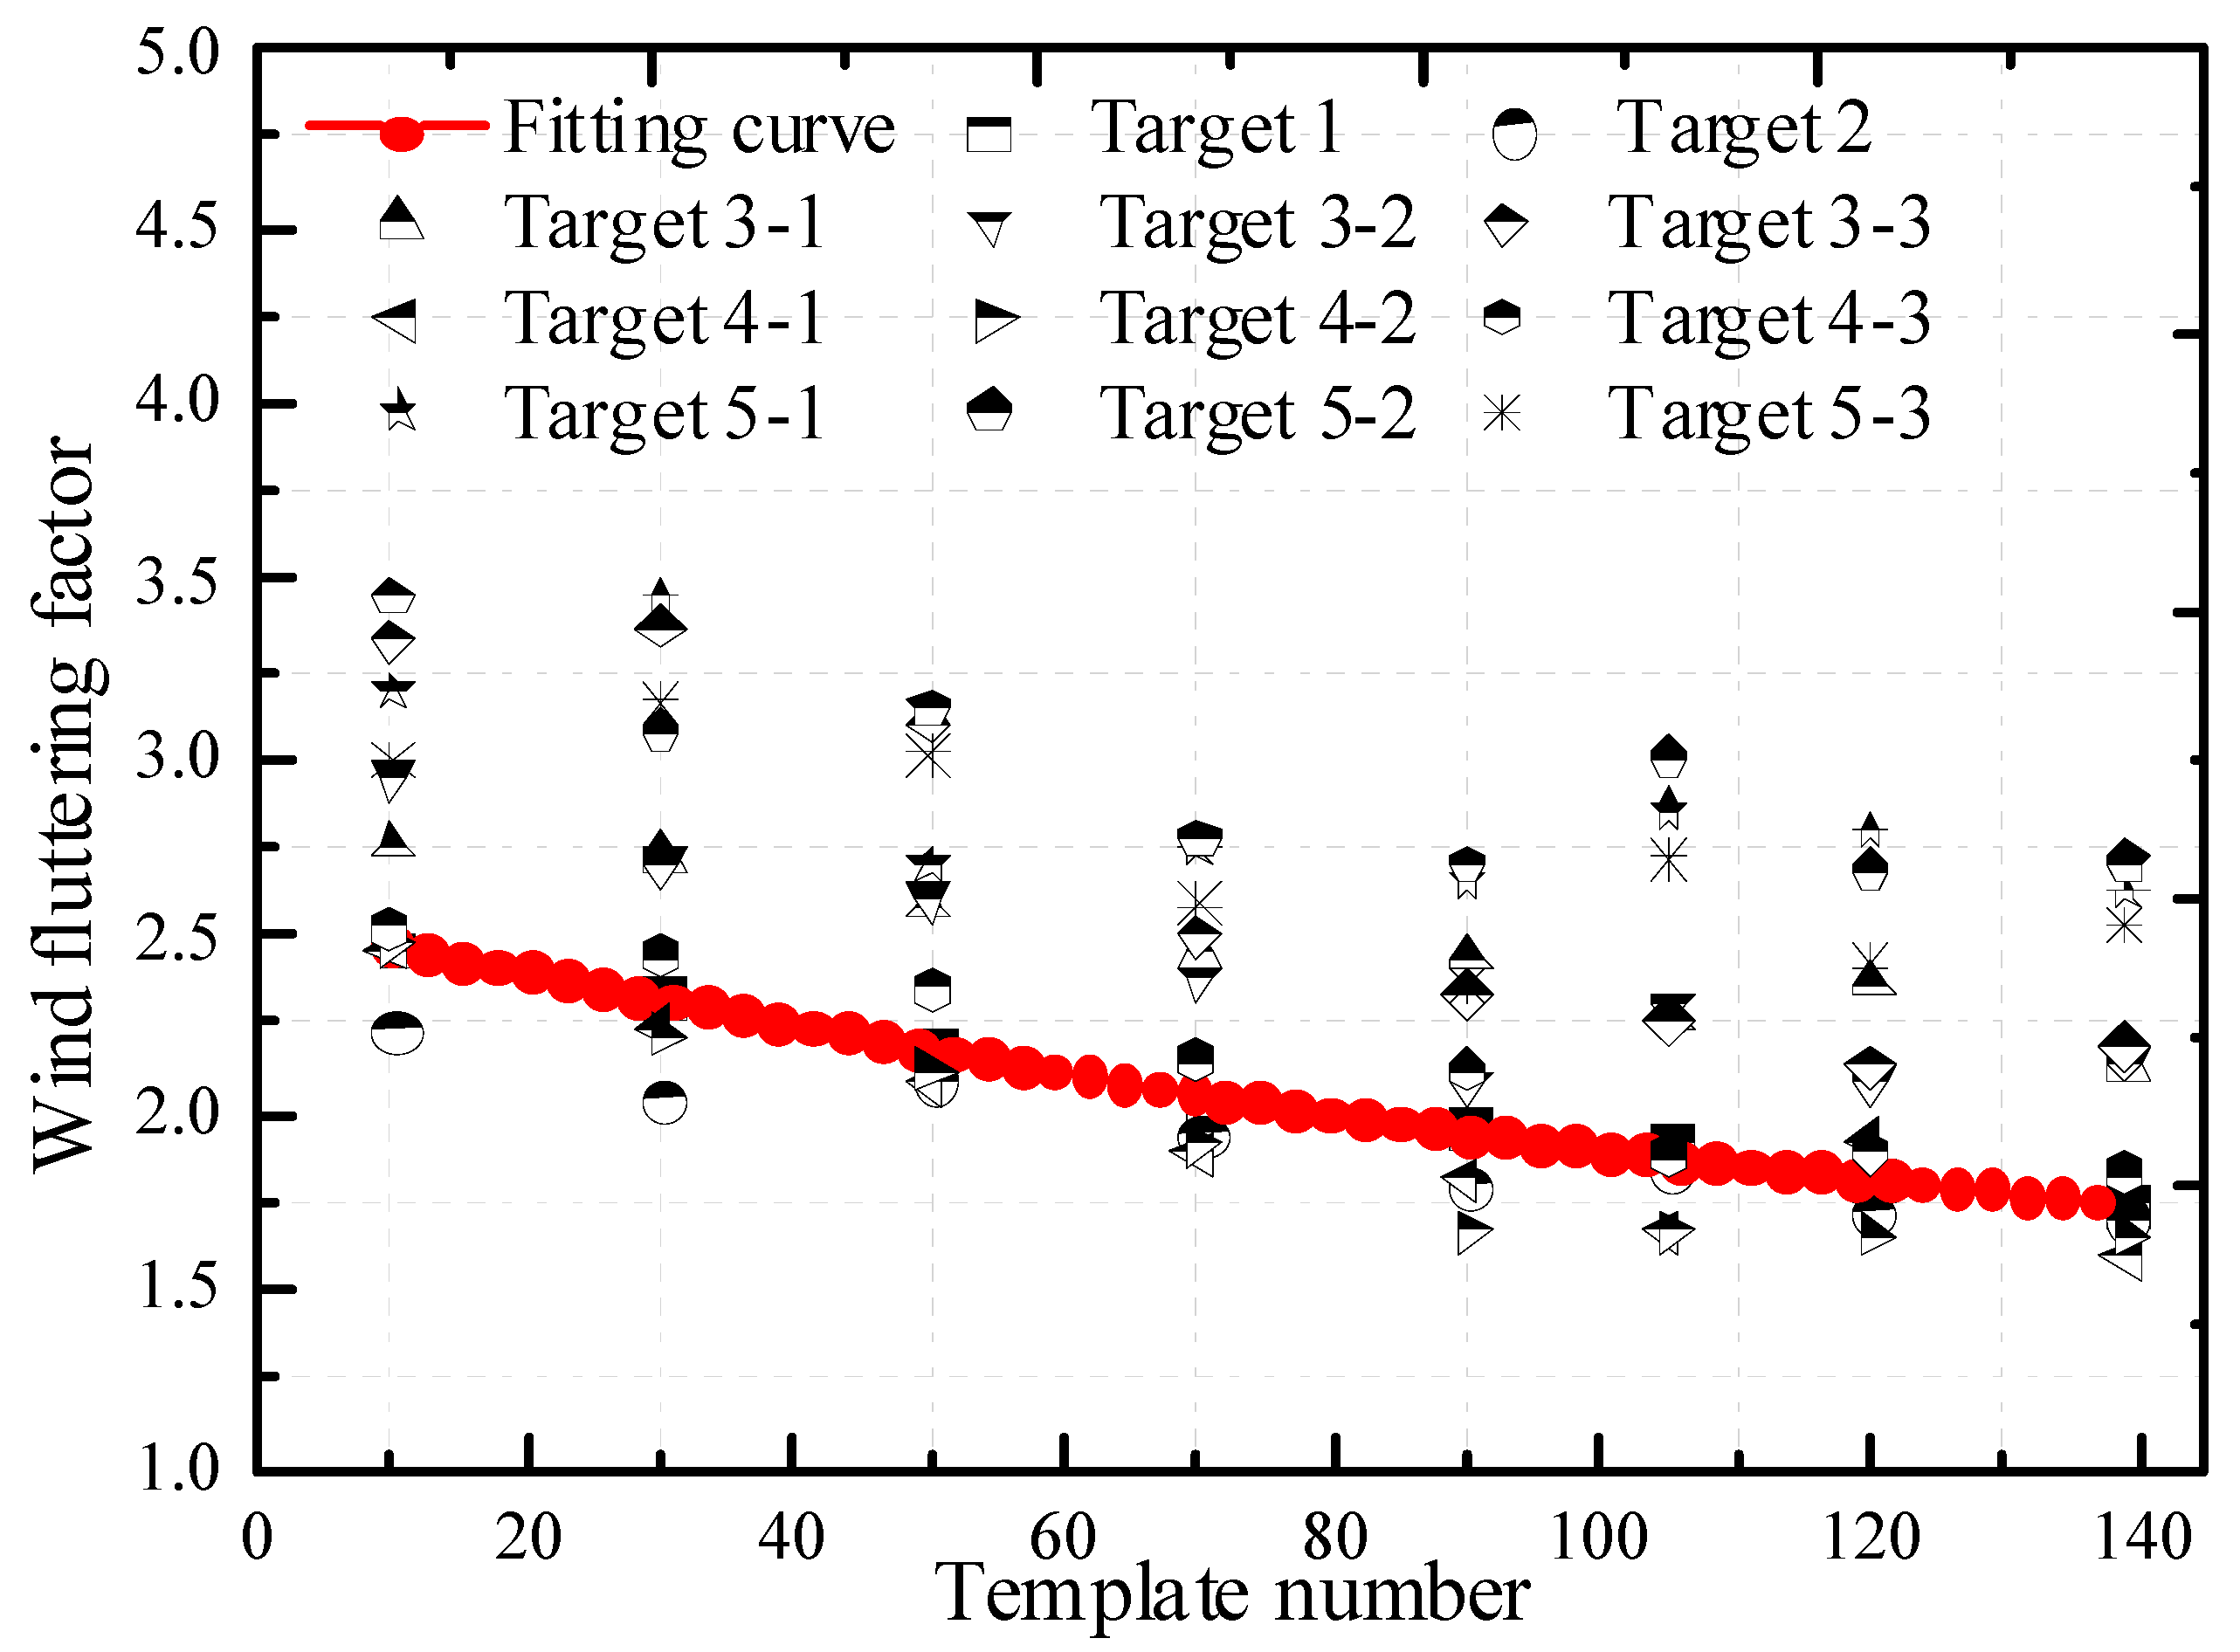
Wind vibration coefficient of super large cooling towers is greatly affected by structural performance and wind pressure distribution during the whole construction process. However, the wind vibration coefficient does not linearly increase with the height significantly, and there is considerable discreteness of wind vibration coefficient for different equivalent targets. Therefore, the control of internal force, safety, and economic performance of the cooling towers were the major considerations for the determination of wind vibration coefficient in this study. We proposed the following formula of wind vibration coefficient by taking the meridional axial force as the target (equivalent target 1, GB/T 50102–2014, 2014):
where
β0 is the wind vibration coefficient of the built-up tower,
β0 = 1.74,
m,
n, and
k are calculation parameters,
x is the template number, and
y is the wind vibration coefficient for the corresponding template number. After several iterations, the calculation parameters in the fitting formula were as follows:
m = 2.526,
n = 116.511,
k = 1.320.
Figure 11 shows the fitted curve and the comparison of wind vibration coefficients under the five equivalent targets. The fitted curve could well reflect the differential values of wind vibration coefficient during the whole construction process when the meridional axial force was taken as the target.
Table 6 shows the recommended values of wind vibration coefficient under each working condition.
6. Stability Performance of the Cooling Tower during the Whole Construction Process
We then analyzed the evolution of wind-induced stability performance during the whole construction process of the super large cooling tower. The effects of wind vibration coefficient, concrete age, construction load, geometric non-linearity, and internal suction force on the buckling stability and ultimate bearing capacity of the cooling tower were discussed.
6.1. Influence of Concrete Age and Construction Load
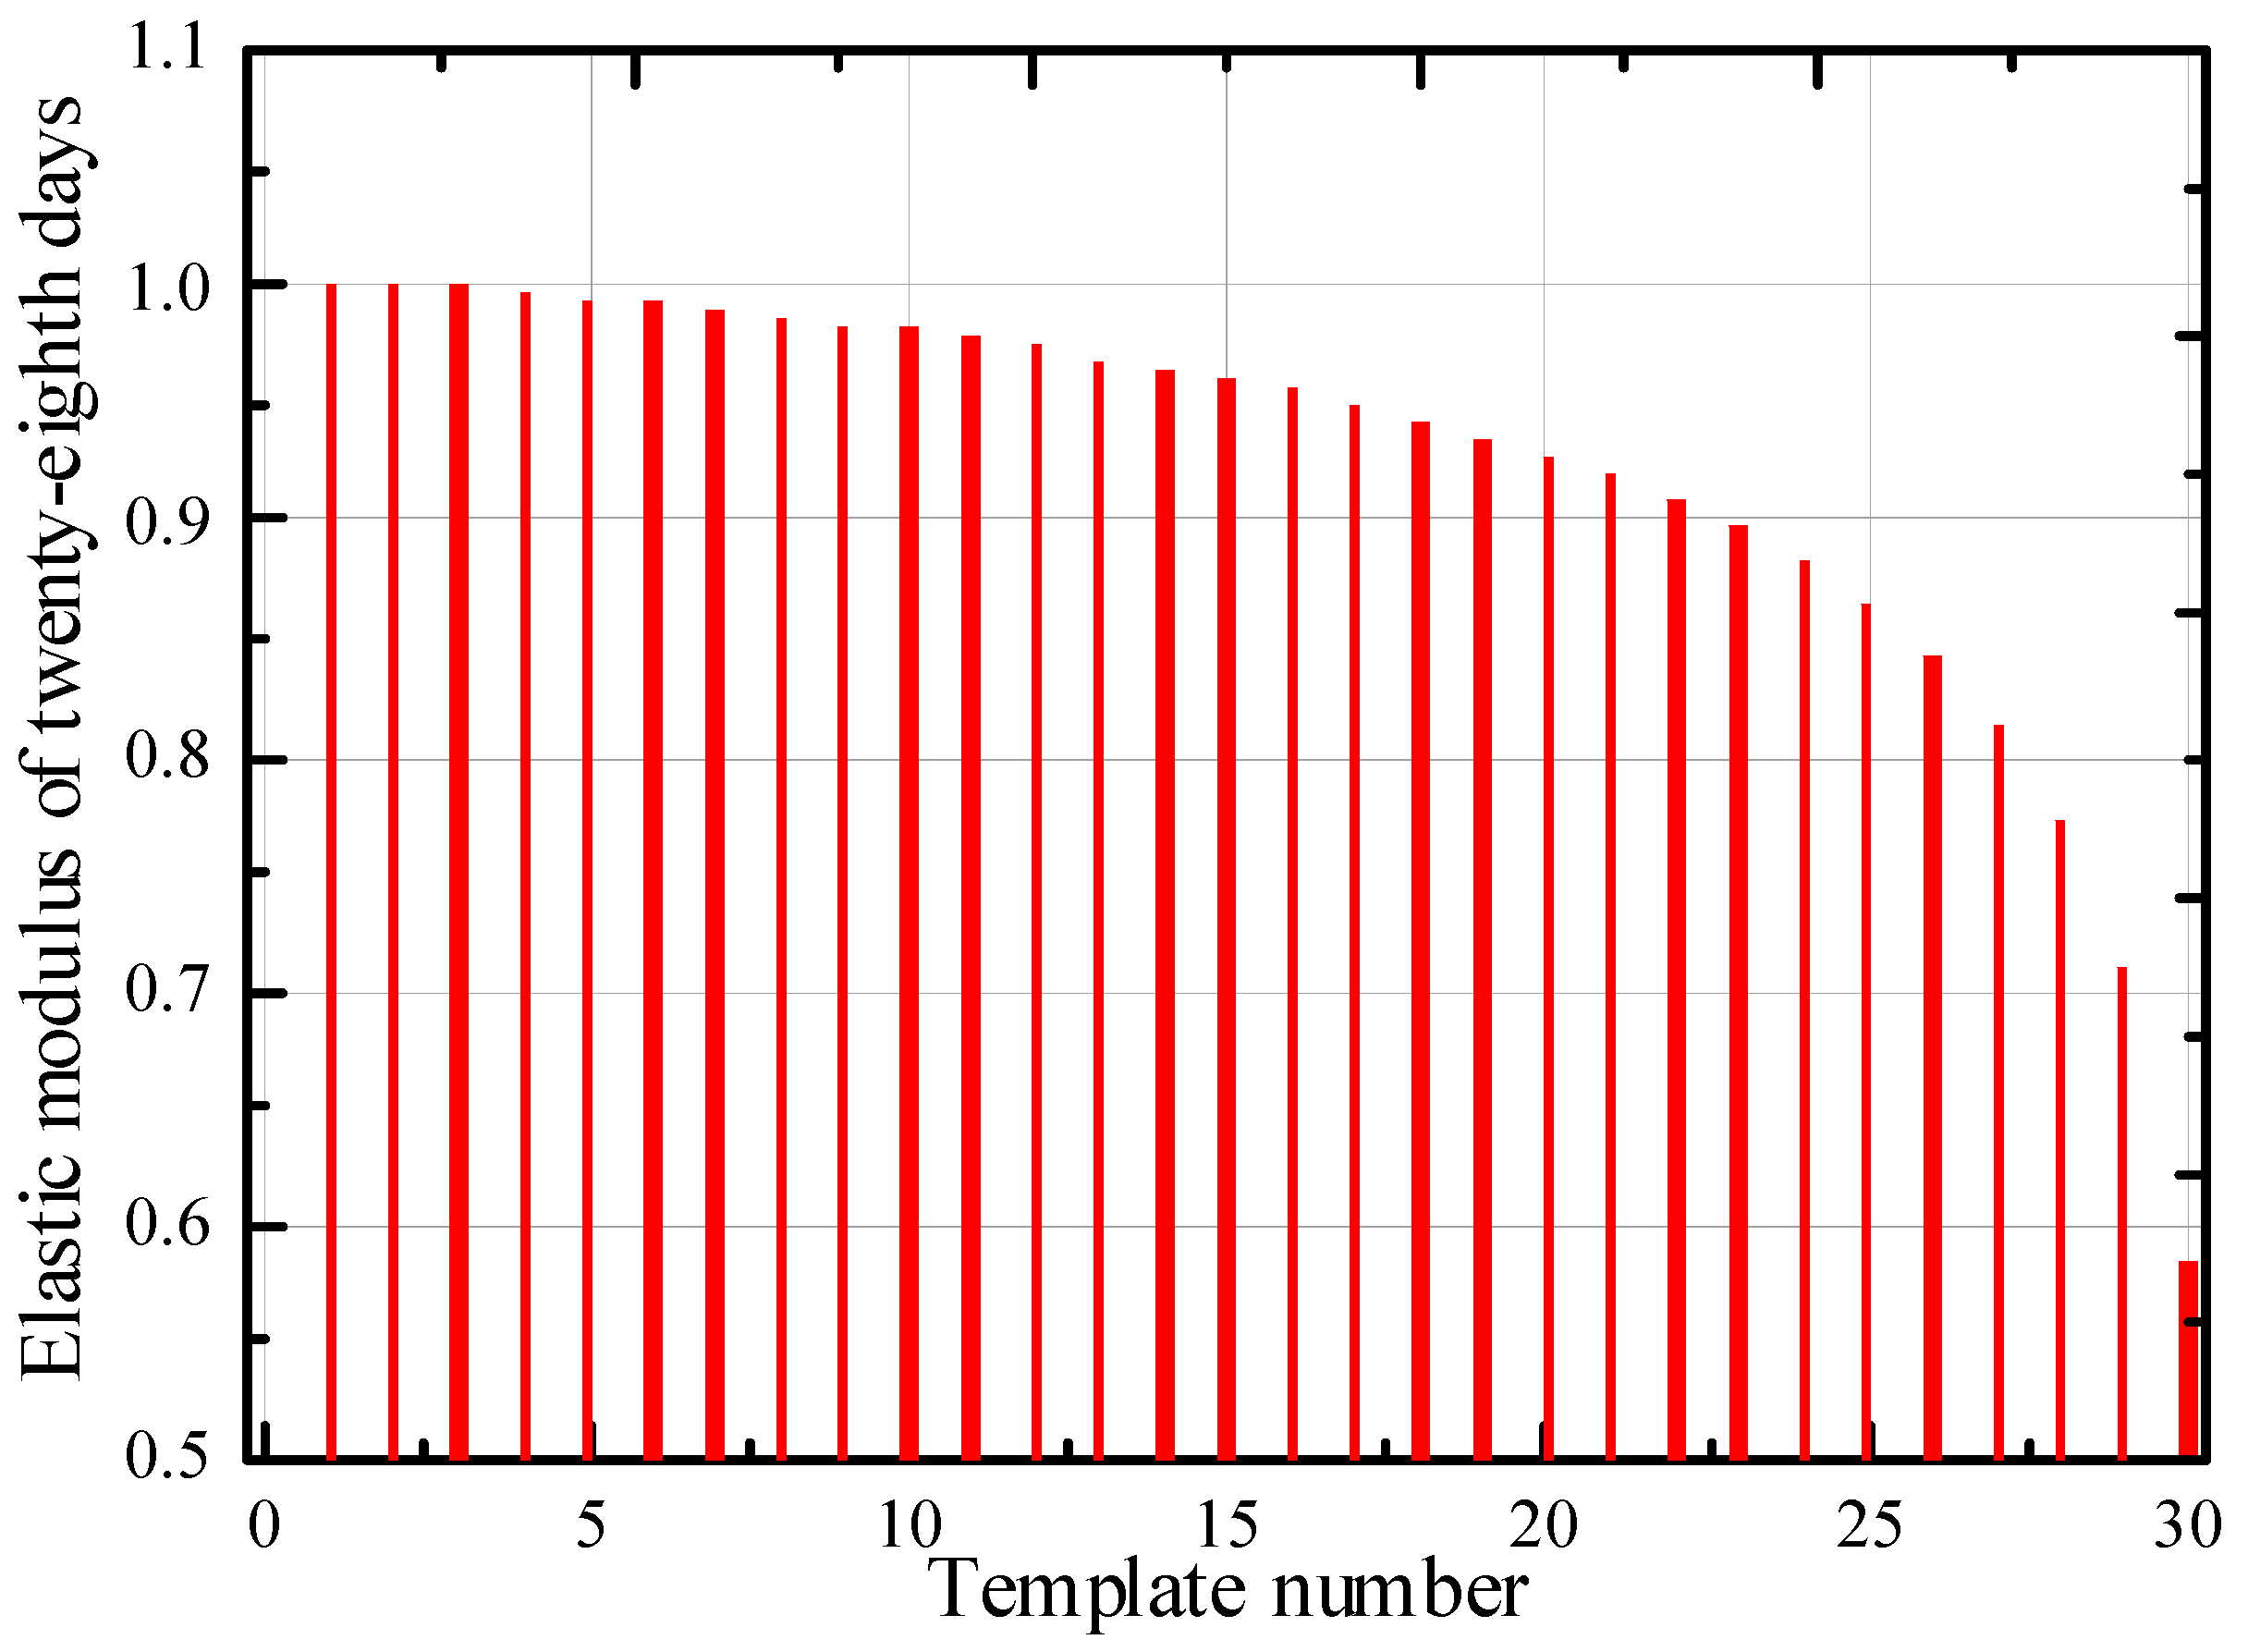
The elastic modulus of concrete with different age was calculated under each working condition:
where
Ec(
t) is the elastic modulus (kPa) of C40 concrete with an age of
t days,
Ec is the elastic modulus of concrete shell with an age of 28 days,
βt is a coefficient,
, S depends on the type of concrete, the value is 0.25 for ordinary cement and rapid-hardening cement, and
t is the age of concrete (day). The Poisson’s ratio and linear expansion coefficient of concrete with an age of
t days were the same as those of concrete with an age of 28 days. Shear modulus was 0.4 times that of the elastic modulus.
Figure 12 shows the distribution of elastic modulus of concrete for different template number under working condition 2 (30 templates).
The construction loads were determined based on the following criteria: (1) the uniformly distributed load imposed by templates, slidewalk, scaffold, hanging basket, railings, a-frame, and supporting system to the shell below along the circumferential direction was about 3.6 kN/m, (2) the newly cast concrete exerted a uniformly distributed load along the circumferential was calculated as 25 × template height (1.277 m) × average thickness of the plate (m) kN/m, (3) the uniformly distributed load exerted by the construction workers turning over the template to the shell below along the circumferential direction was about 0.75 kN/m, and (4) concentrated load would be generated by the reinforcing bars stacked on the slidewalk. The maximum concentrated load produced this way was 18 kN; (5) Concentrated load would be generated by the weight of electric welder and switchboard and acted on the slidewalk, reaching a level of about 3.6 kN.
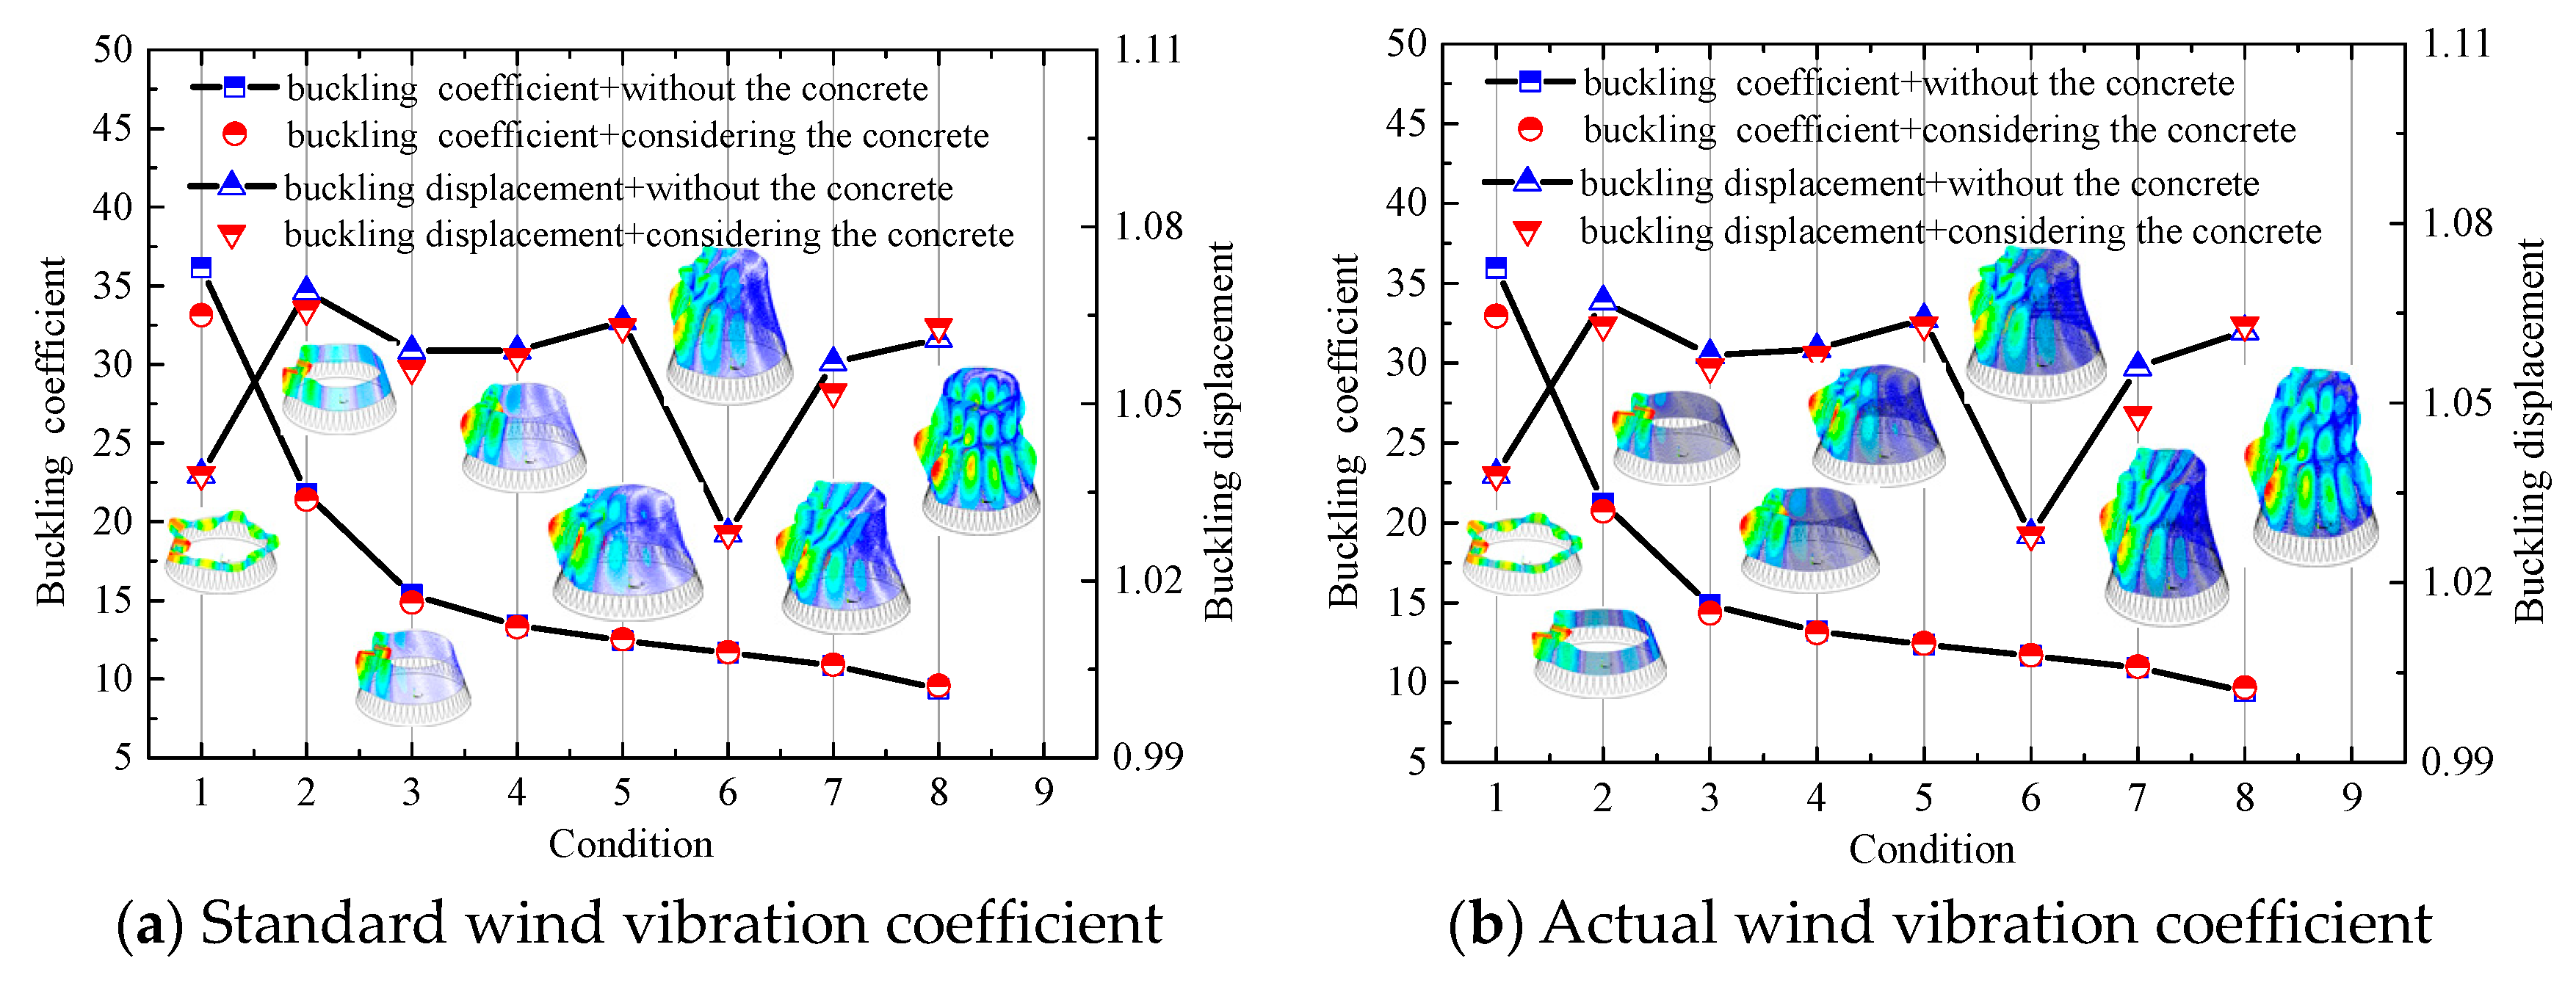
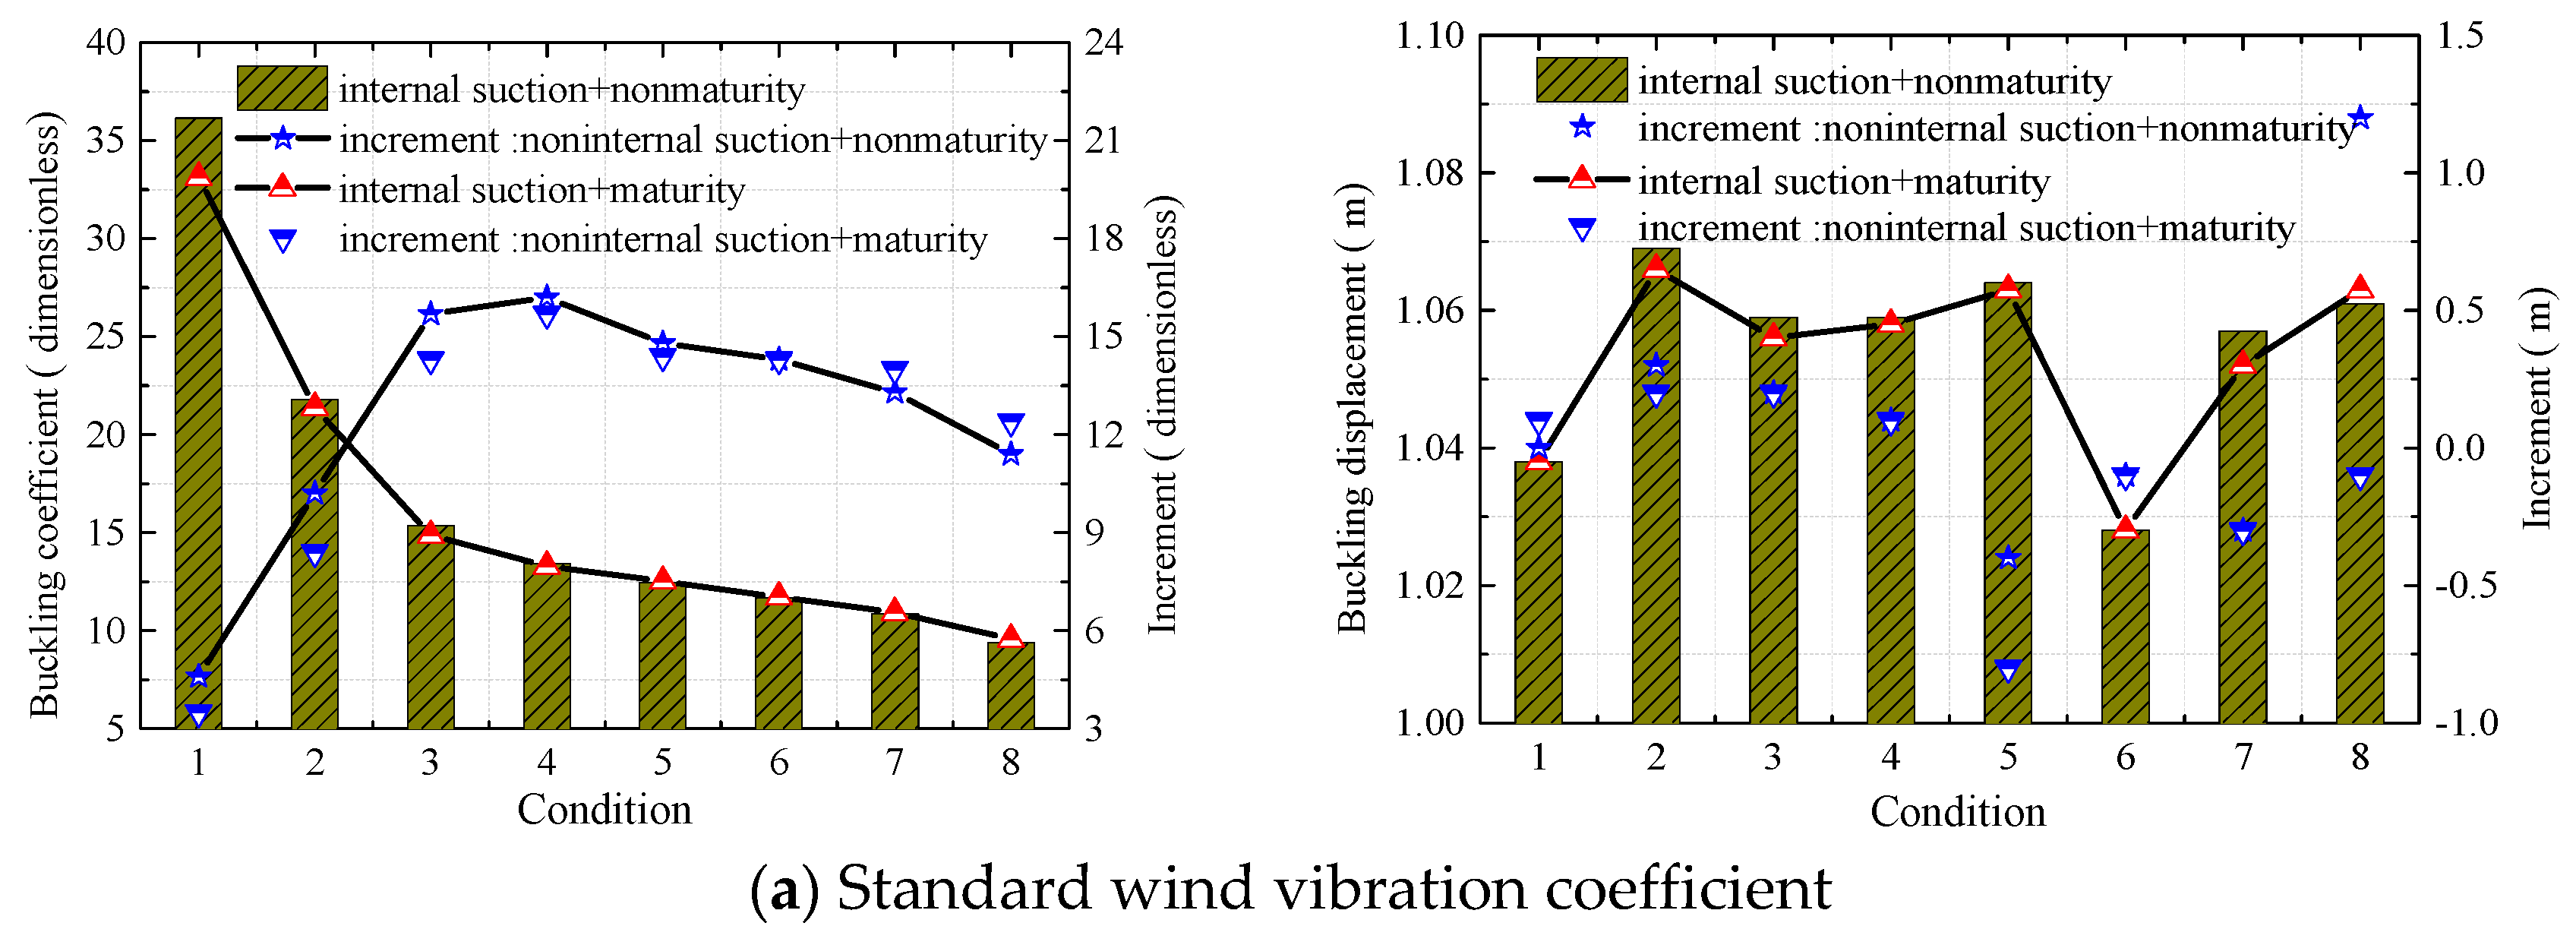
Figure 13 shows the typical construction conditions of cooling tower under two kinds of wind loads during the whole construction process (wind pressure of standard wind vibration coefficient and wind pressure of actual wind vibration coefficient).The buckling coefficients and displacements of cooling towers under typical construction conditions during the whole construction process are analyzed under the two conditions of concrete age change and concrete age change. Comparison reveals that:
(1) As the construction height increased, the buckling coefficient decreased, and the rate of decrease became smaller over time. Buckling displacement showed a discrete distribution, and no consistent variation trend was observed. Thus, wind vibration coefficient and whether the concrete age and construction load were considered had little impact on buckling mode and buckling displacement under the eight working conditions.
(2) Buckling coefficient decreased if the concrete age and construction load were considered. The influence of wind vibration coefficient referred from the specification and the actual wind vibration coefficient on the buckling stability was much smaller than the influence of whether the concrete age and construction load were considered or not.
6.2. Analysis of Geometric Non-Linearity
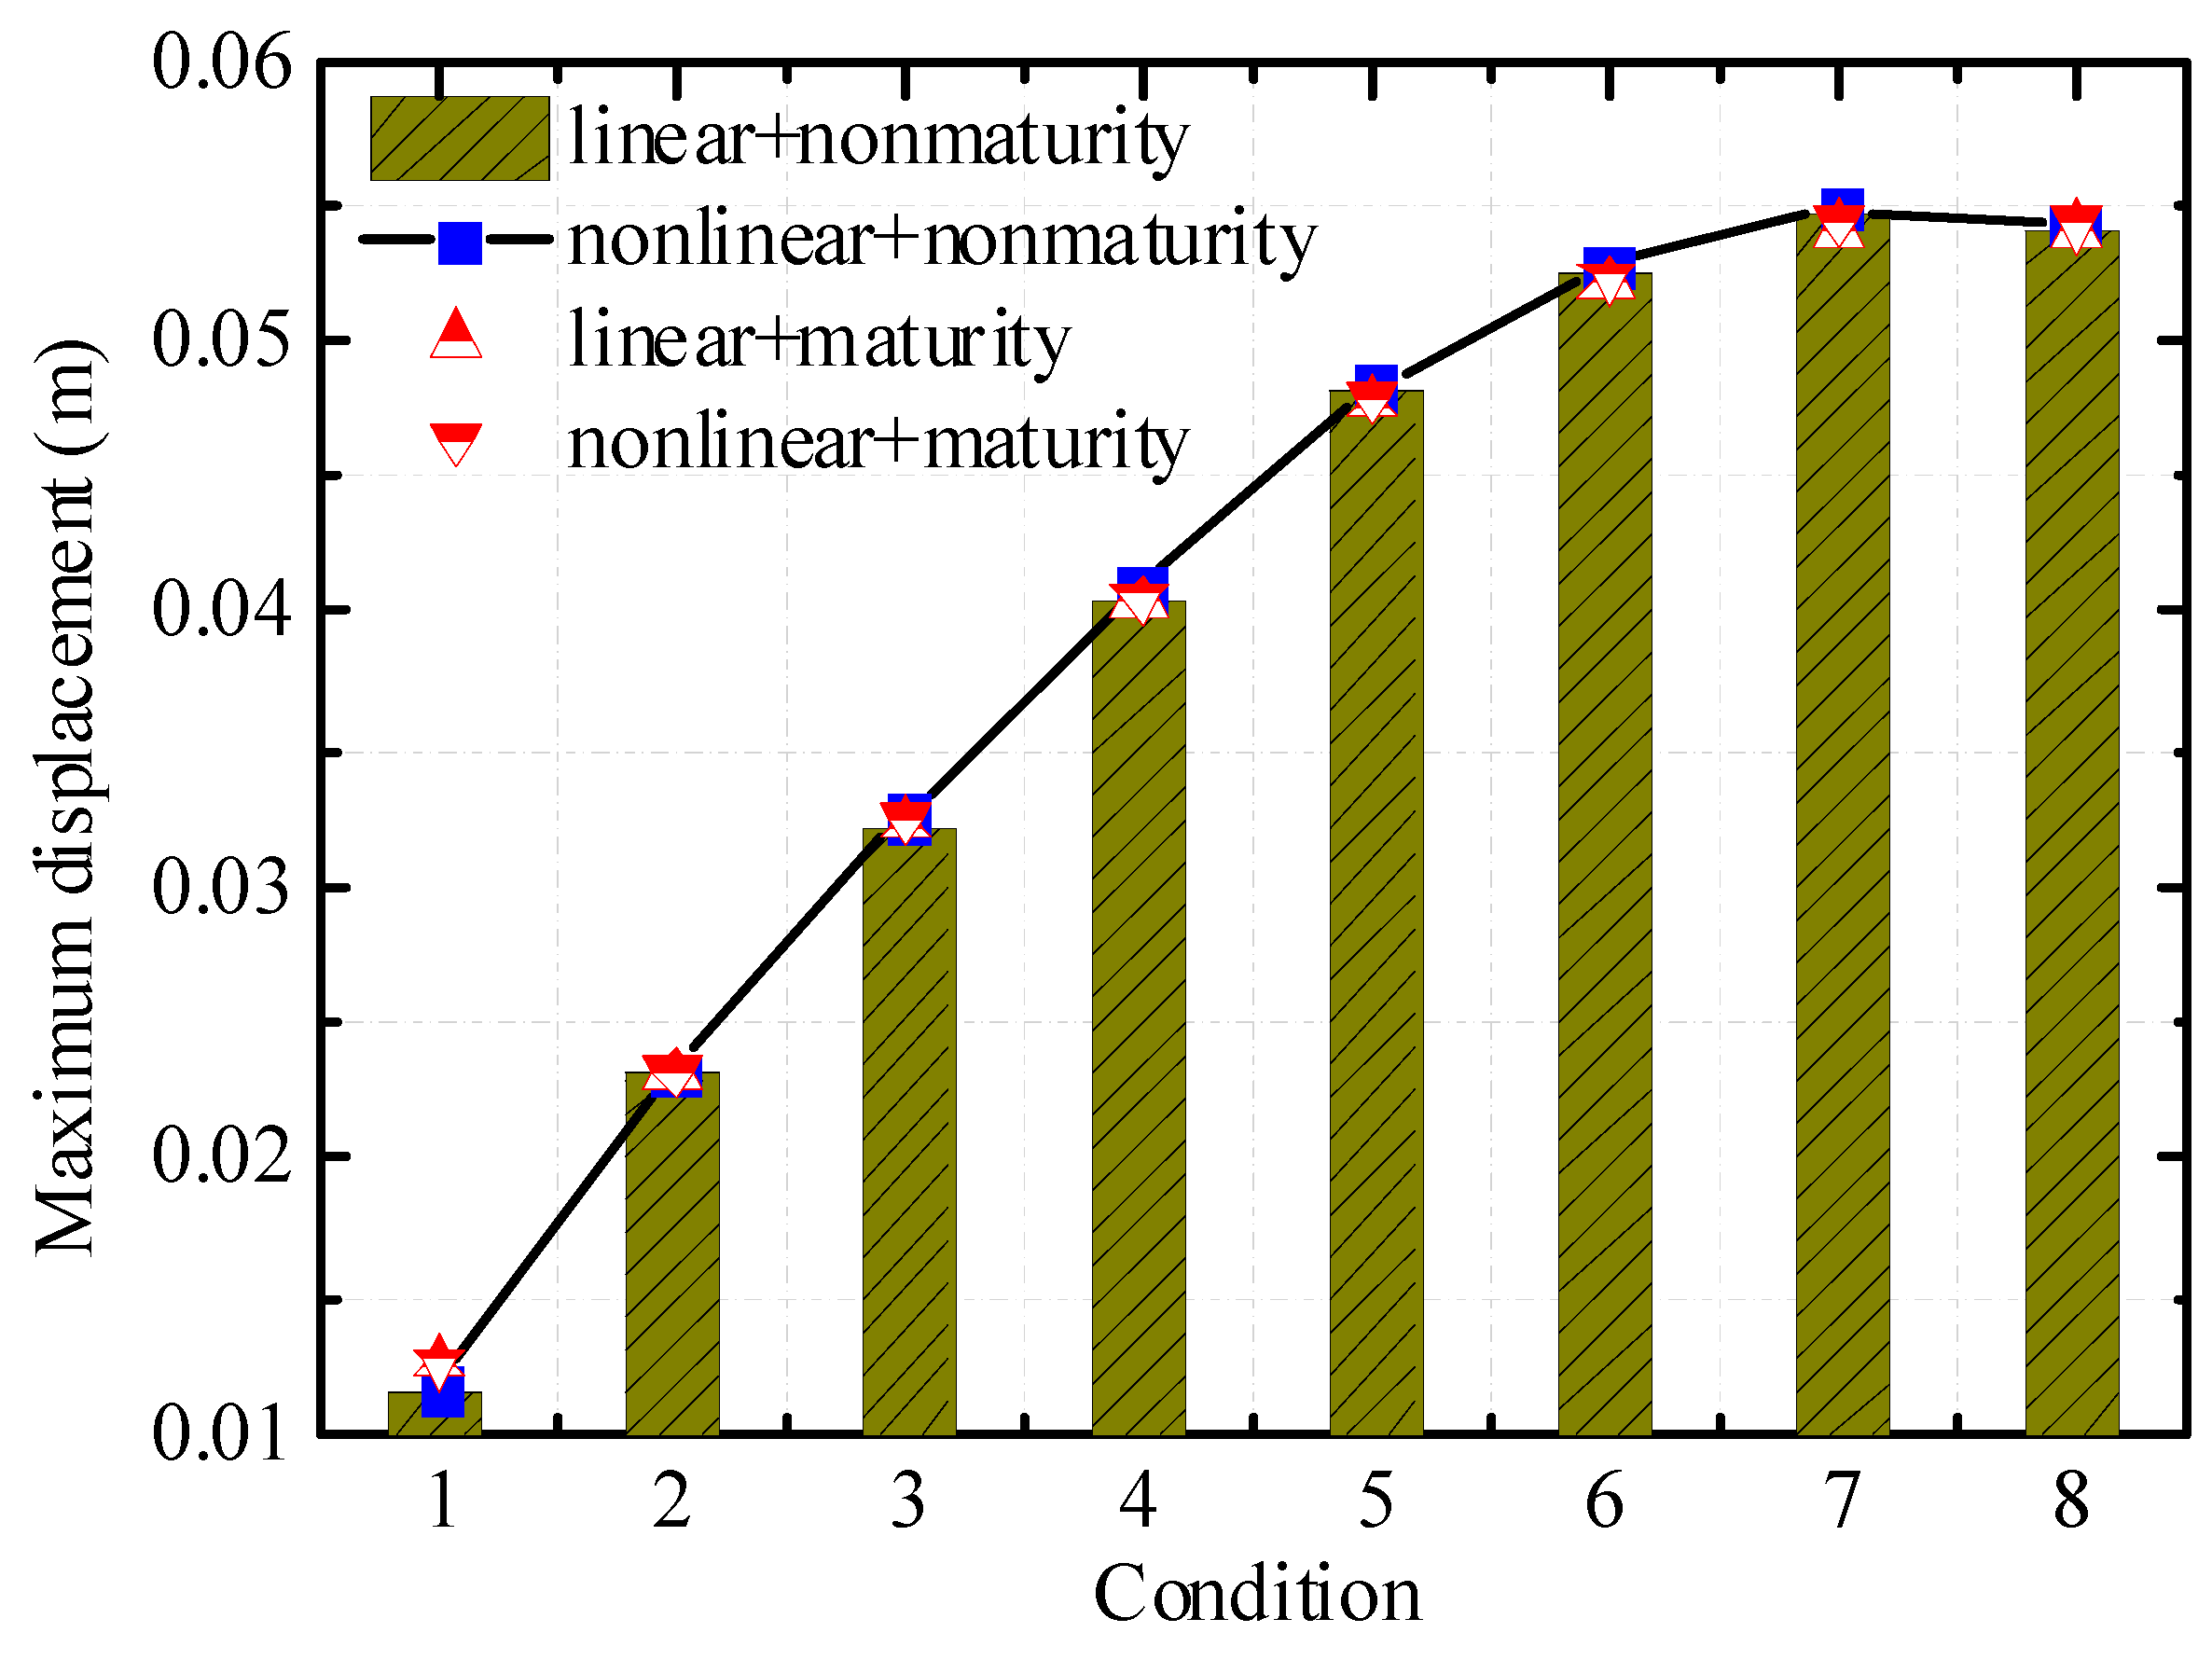
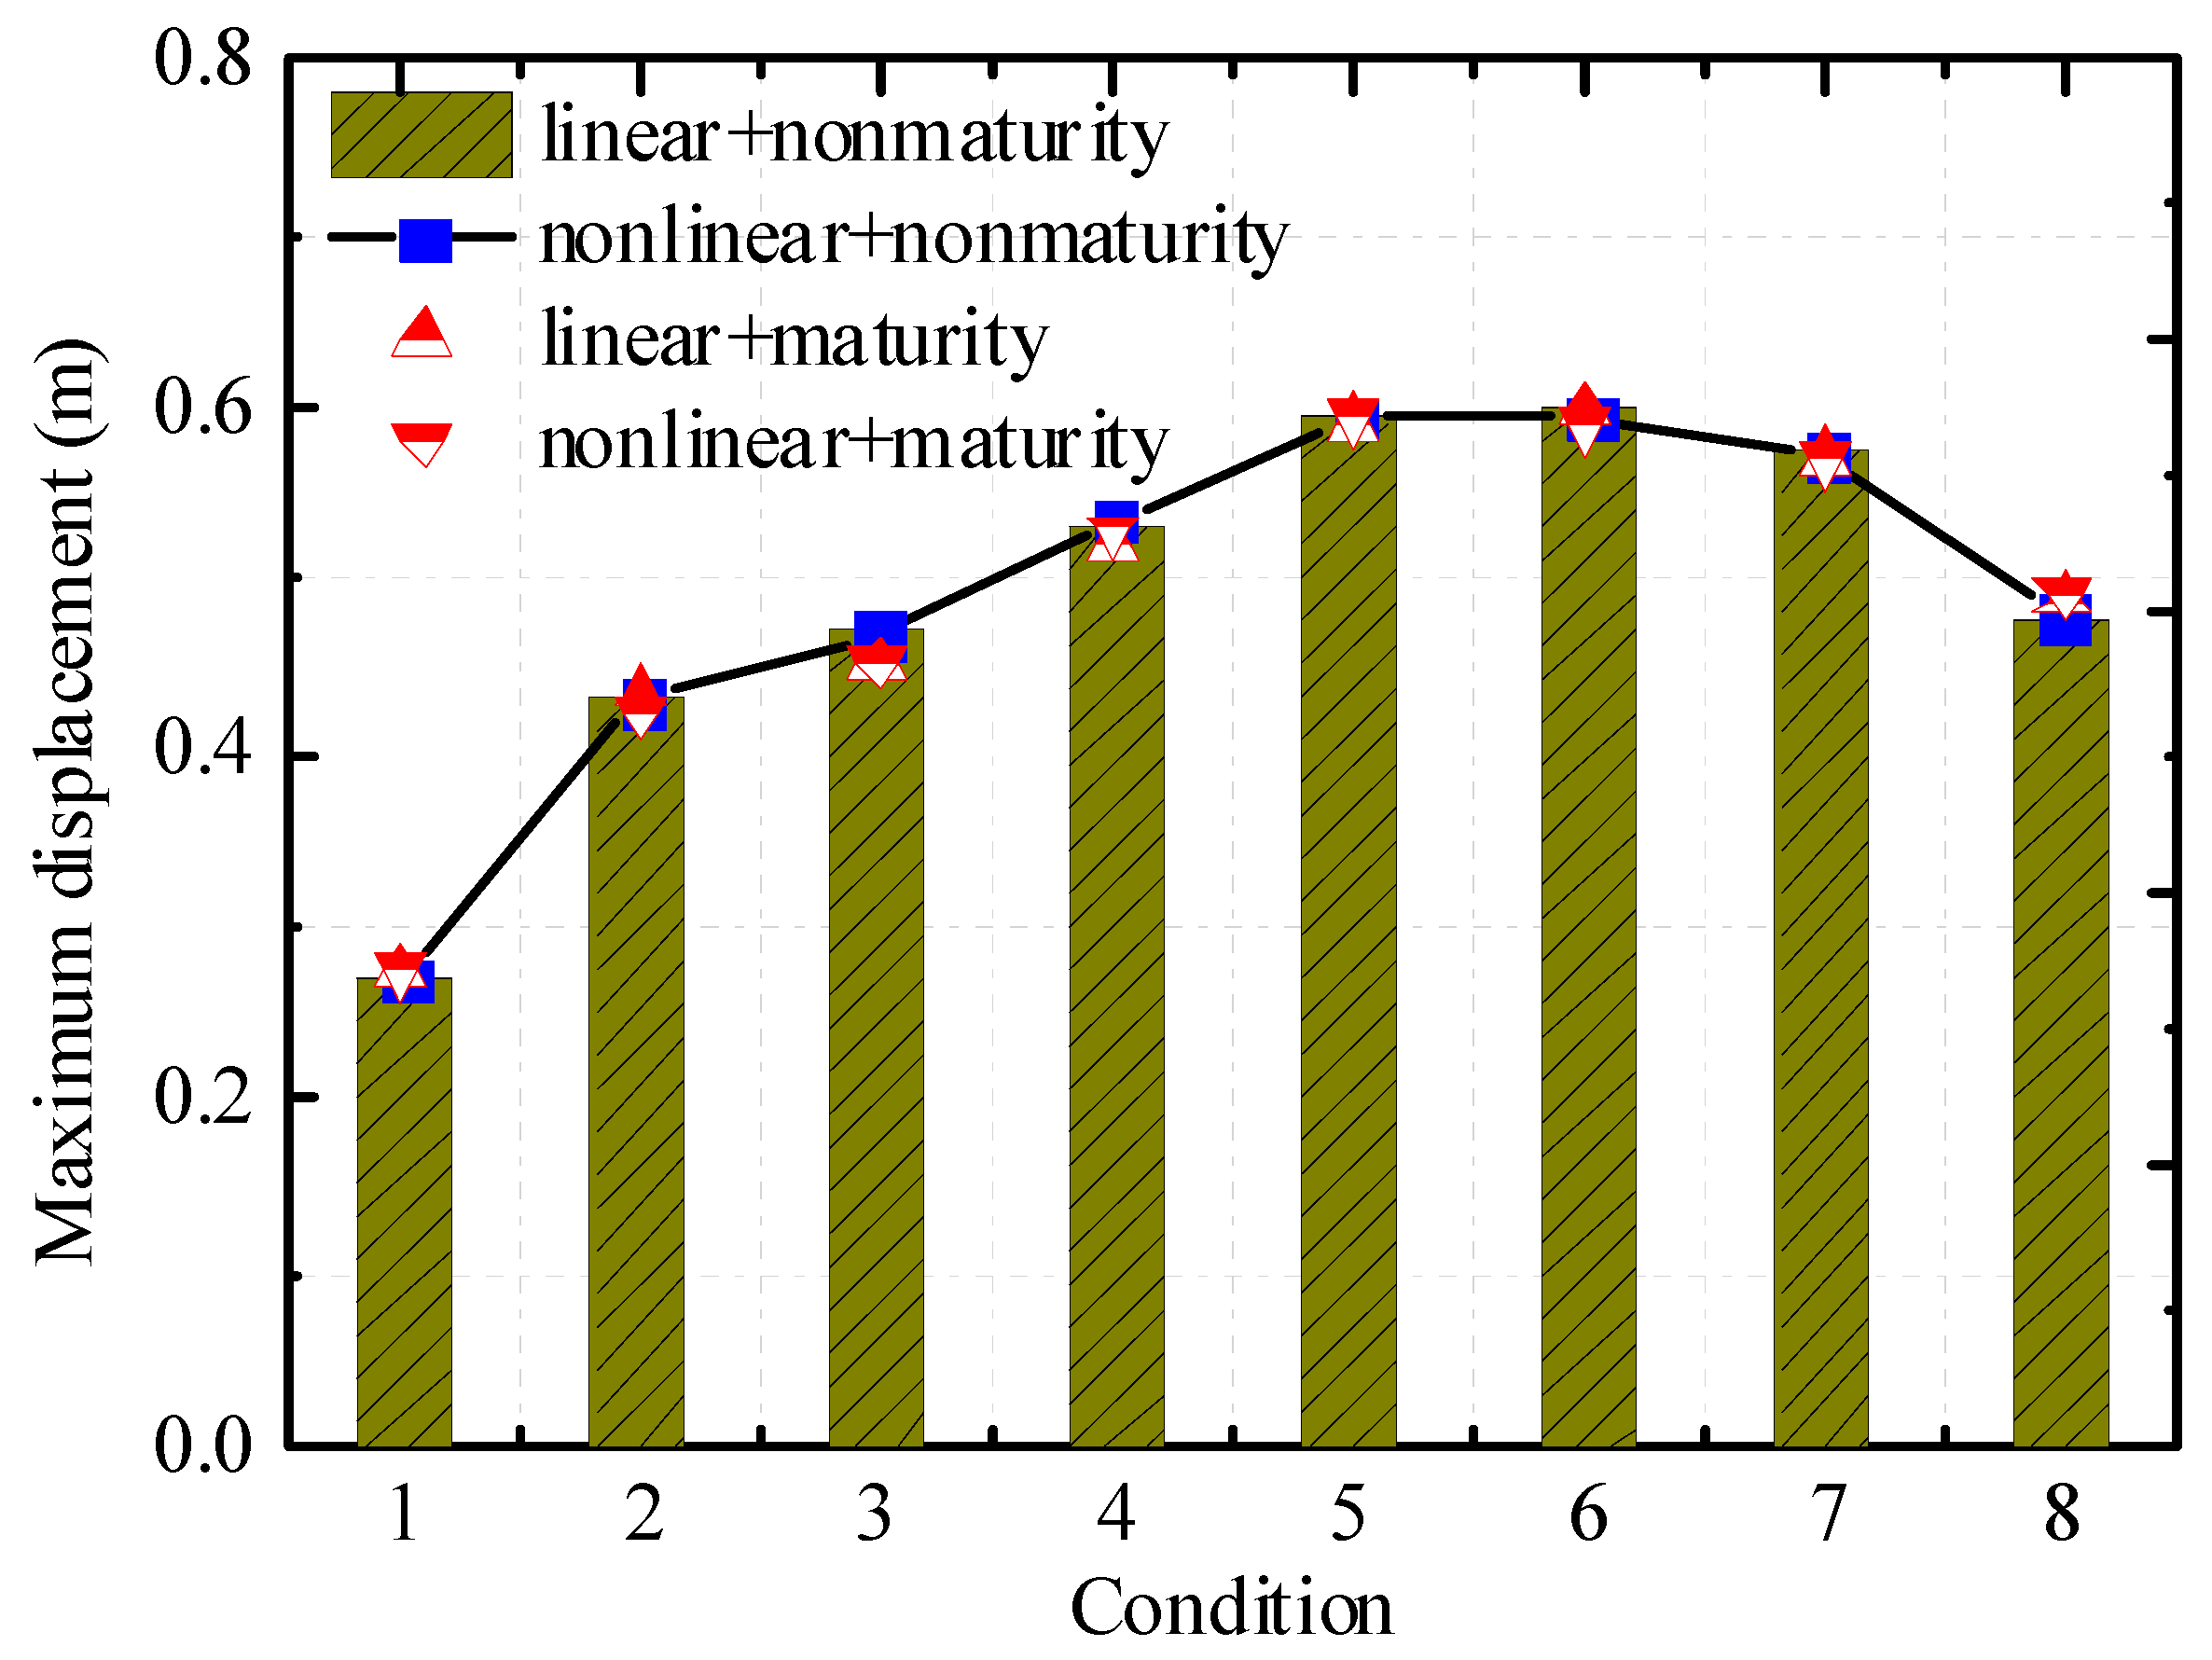
Figure 14 and
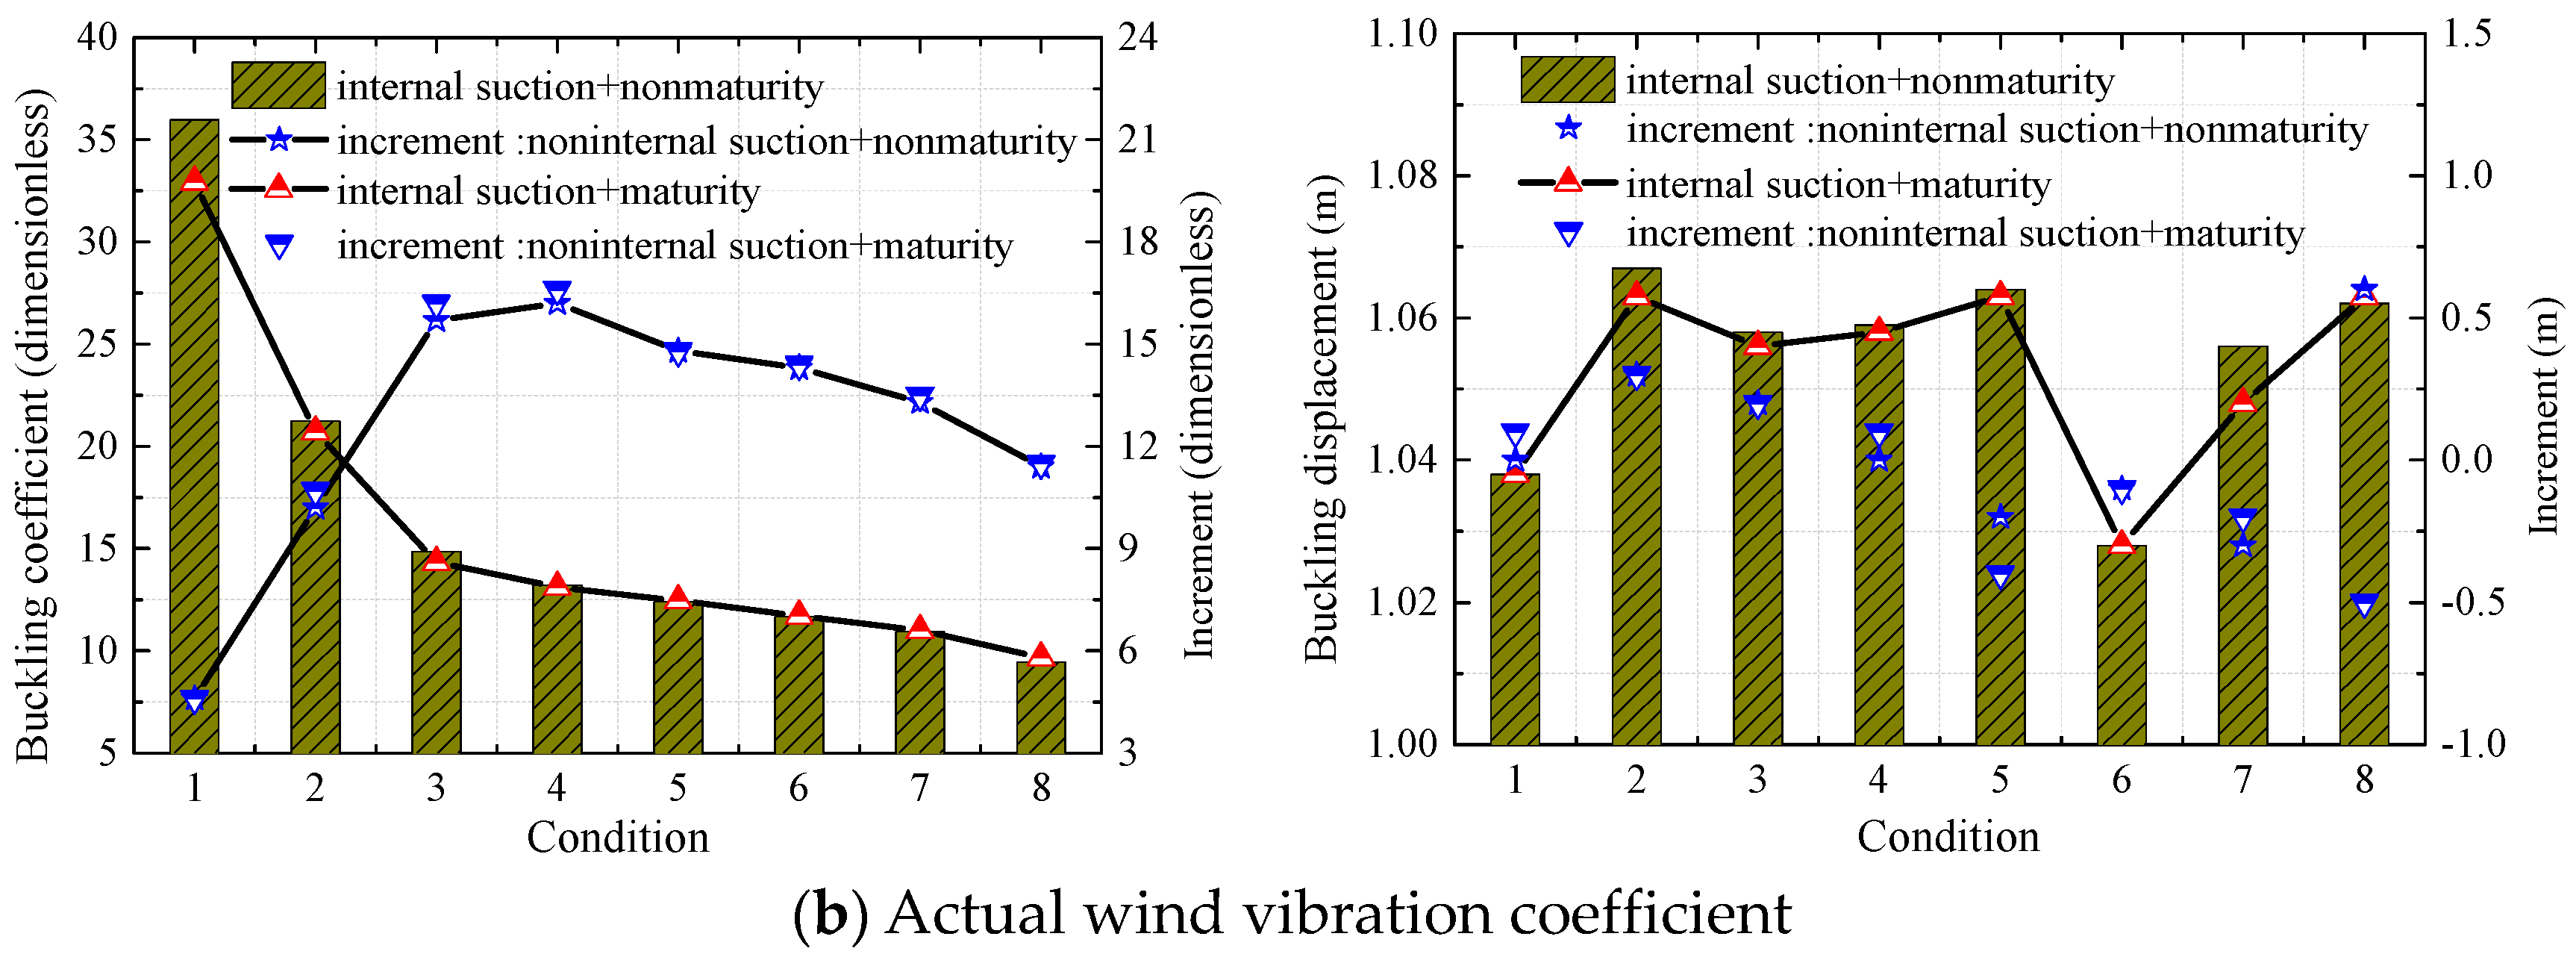
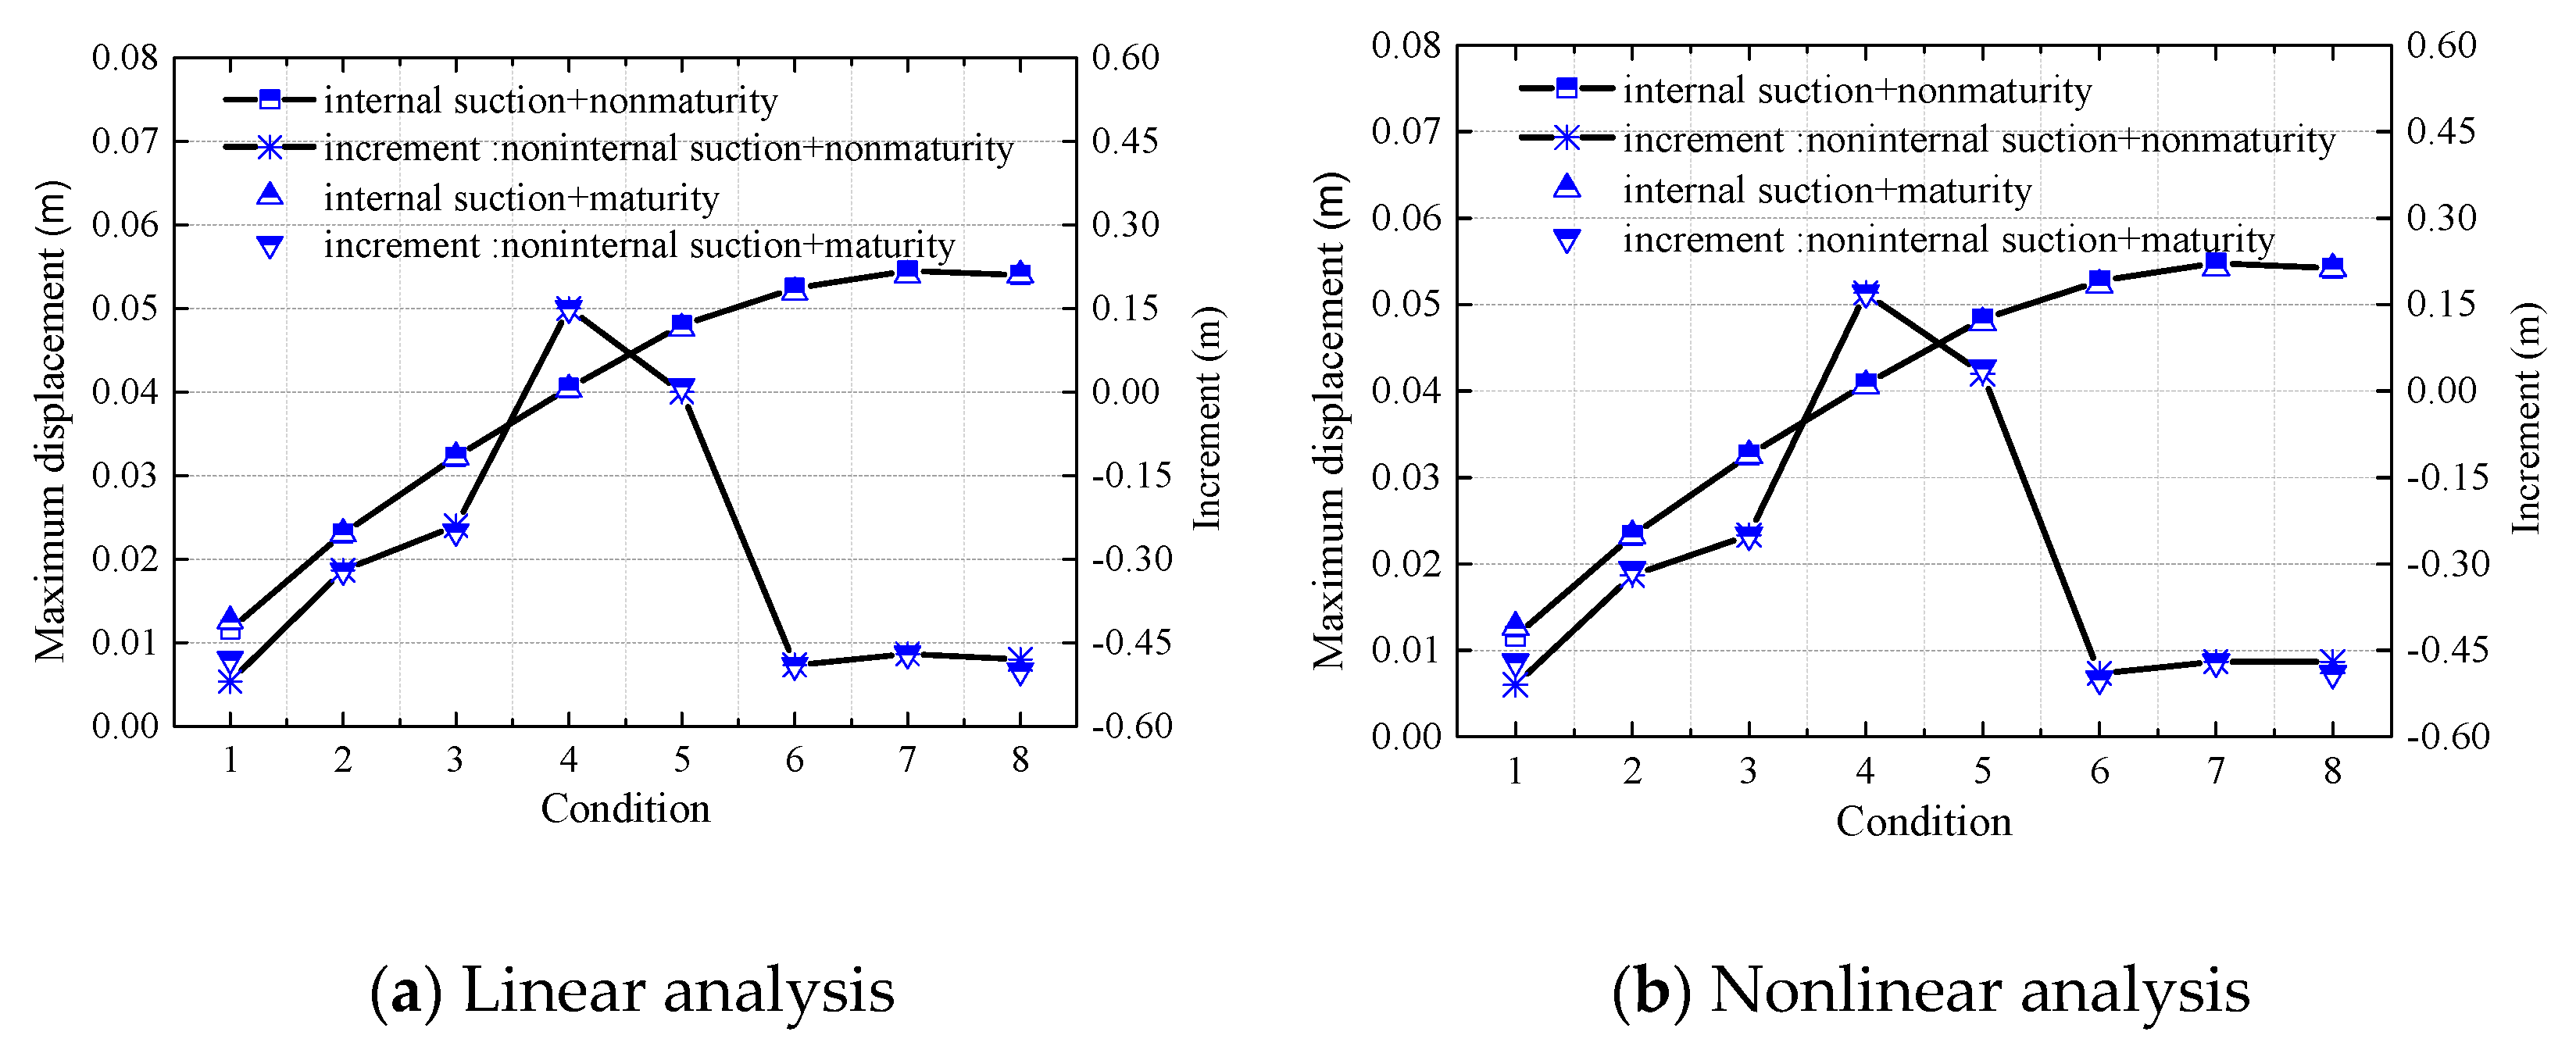
Figure 15 respectively show the typical construction conditions of cooling tower under two kinds of wind loads (actual wind-induced coefficient wind load, buckling wind speed wind load).Considering the concrete age change and not considering the concrete age change, the linear and non-linear calculation of the typical construction conditions during the whole construction process of the cooling tower is carried out, and the variation law of the maximum displacement of the structure is analyzed.
It can be seen from the
Figure 14, as the construction height increased, the maximum displacement of the tower increased constantly, but the amplitude decreased. The maximum displacement under working condition was smaller than that under working condition 7 due to the rigid ring constraint. The maximum displacement response was consistent under linearity and non-linearity of the cooling tower under different working conditions; the values differed very slightly.
It can be seen from the
Figure 15 that the distribution pattern of maximum displacement changed under the critical wind speed of buckling when considering geometric non-linearity. Below is the linear analysis of wind-induced maximum displacement under some working conditions.
6.3. Influence of Internal Suction Force
The influence of internal suction force on stability performance of the cooling tower during the whole construction process was further analyzed.
Figure 16 is the comparison of buckling coefficient and buckling displacement with or without internal suction force under different working conditions. There was an increment without internal suction force as compared with the condition with internal suction force. An absence of internal suction force caused a significant increment in the buckling coefficient during the whole construction process, but it had a lesser impact on buckling displacement. The maximum increment of buckling coefficient was 16.2%, and the maximum difference in buckling displacement was 1.2% in an absence of internal suction force without considering concrete age and construction load. The maximum increment of buckling coefficient was 16.6%, and the maximum difference in buckling displacement was −0.8% in an absence of internal suction force considering concrete age and construction load.
Figure 17 and
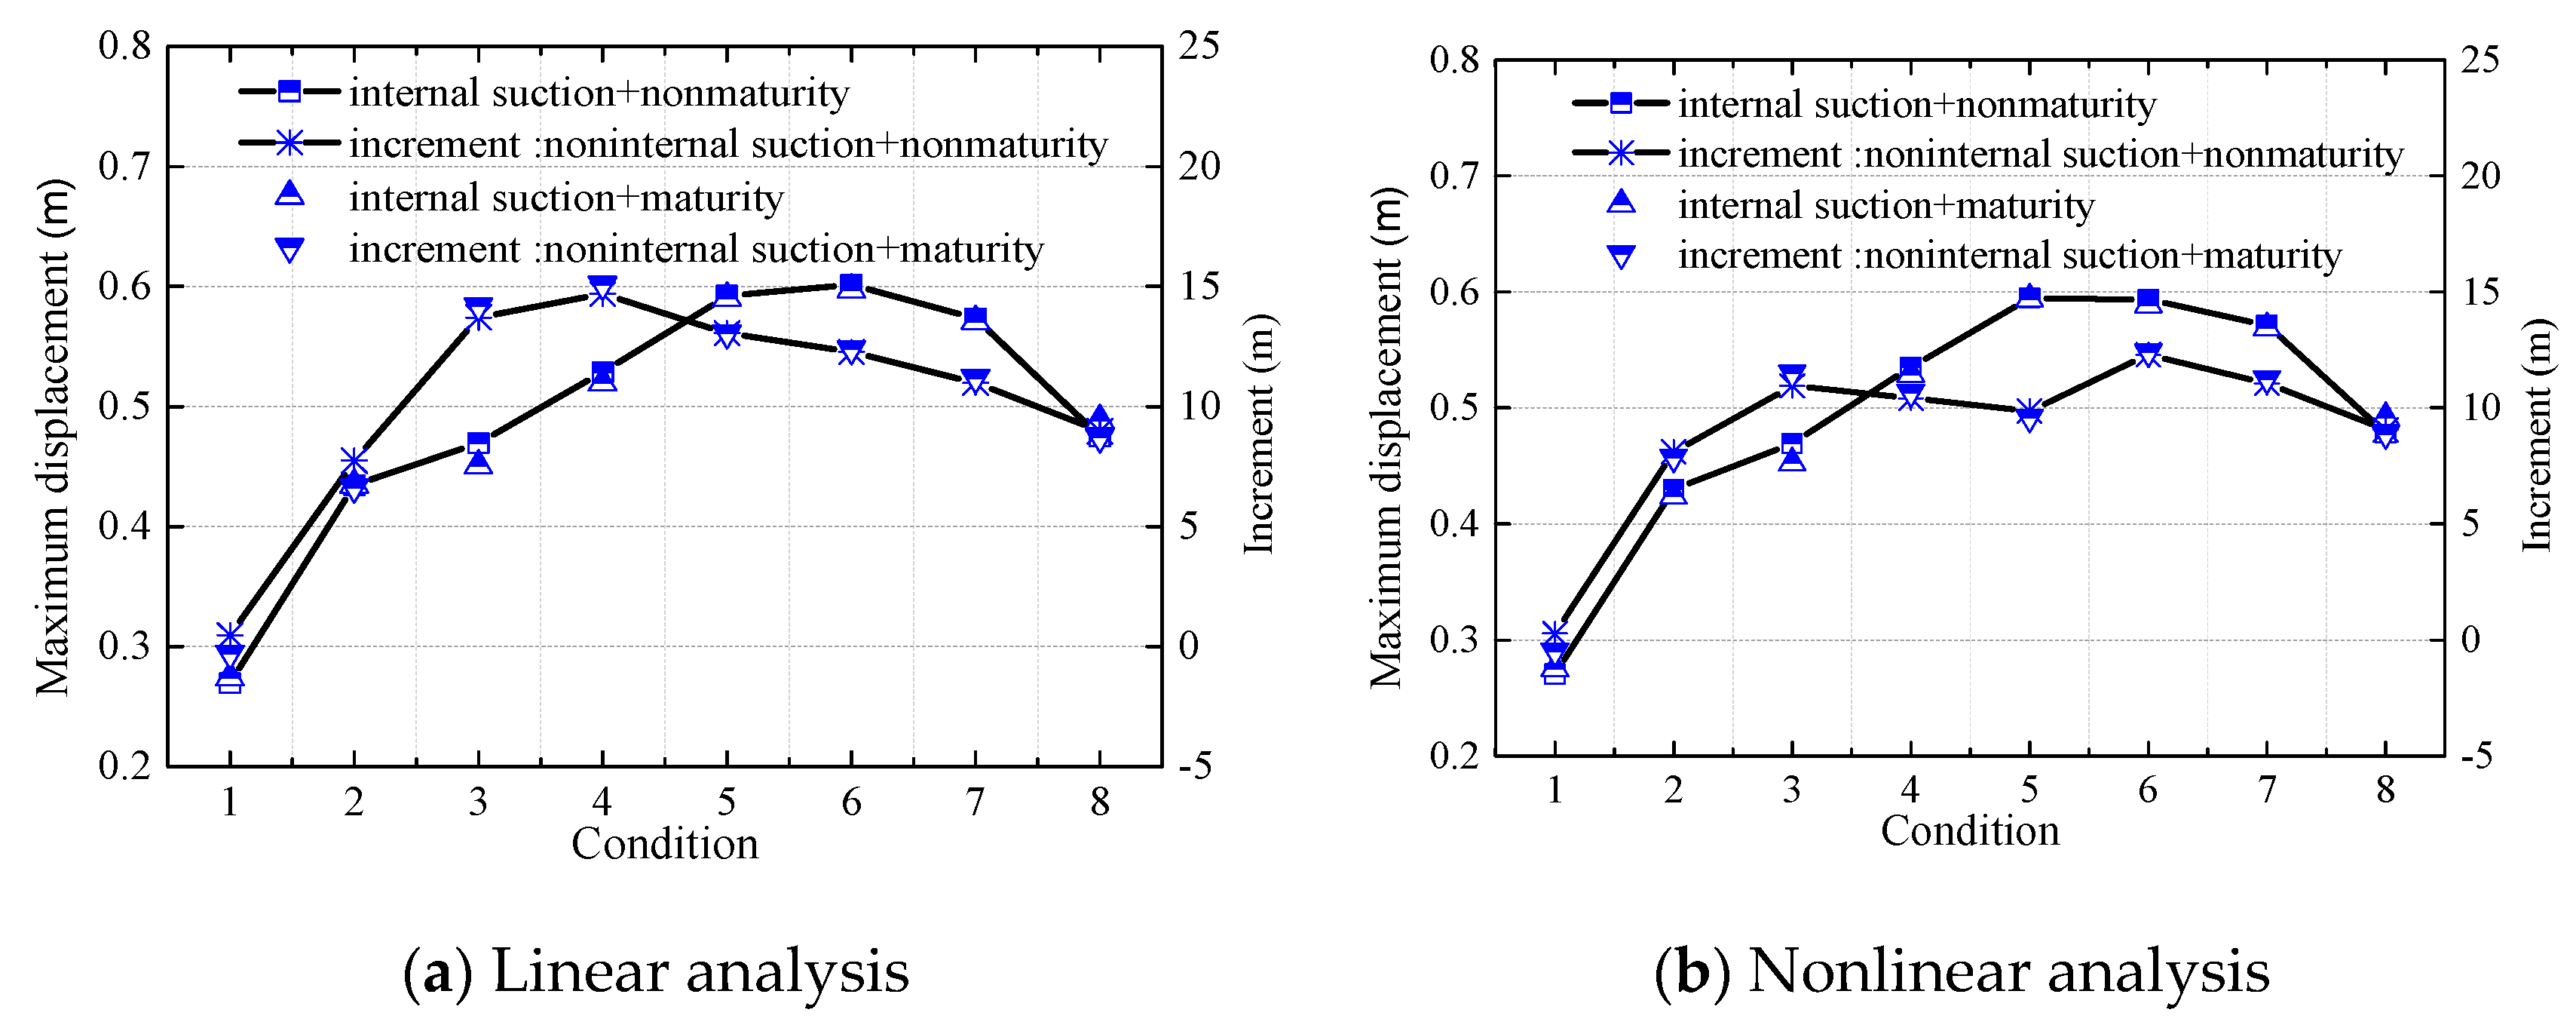
Figure 18 are the comparisons of maximum displacement in linear and non-linear analyses under basic wind speed and critical wind speed of buckling for each working condition. It is easy to see that the internal suction force under the basic wind speed had less impact on the maximum displacement increment in the presence of internal suction force. In contrast, under the critical wind speed of buckling, the internal suction force caused a significant increment in maximum displacement under each working condition.
The comparison shows that when the wind load is the basic design wind speed, considering the influence of internal suction, the maximum displacement increment caused by wind has little influence on each working condition, and the influence is positive or negative.
However, when the wind load is buckling wind speed, considering the influence of internal suction, the maximum displacement of wind-induced displacement increases significantly under different working conditions.
6.4. Ultimate Bearing Capacity
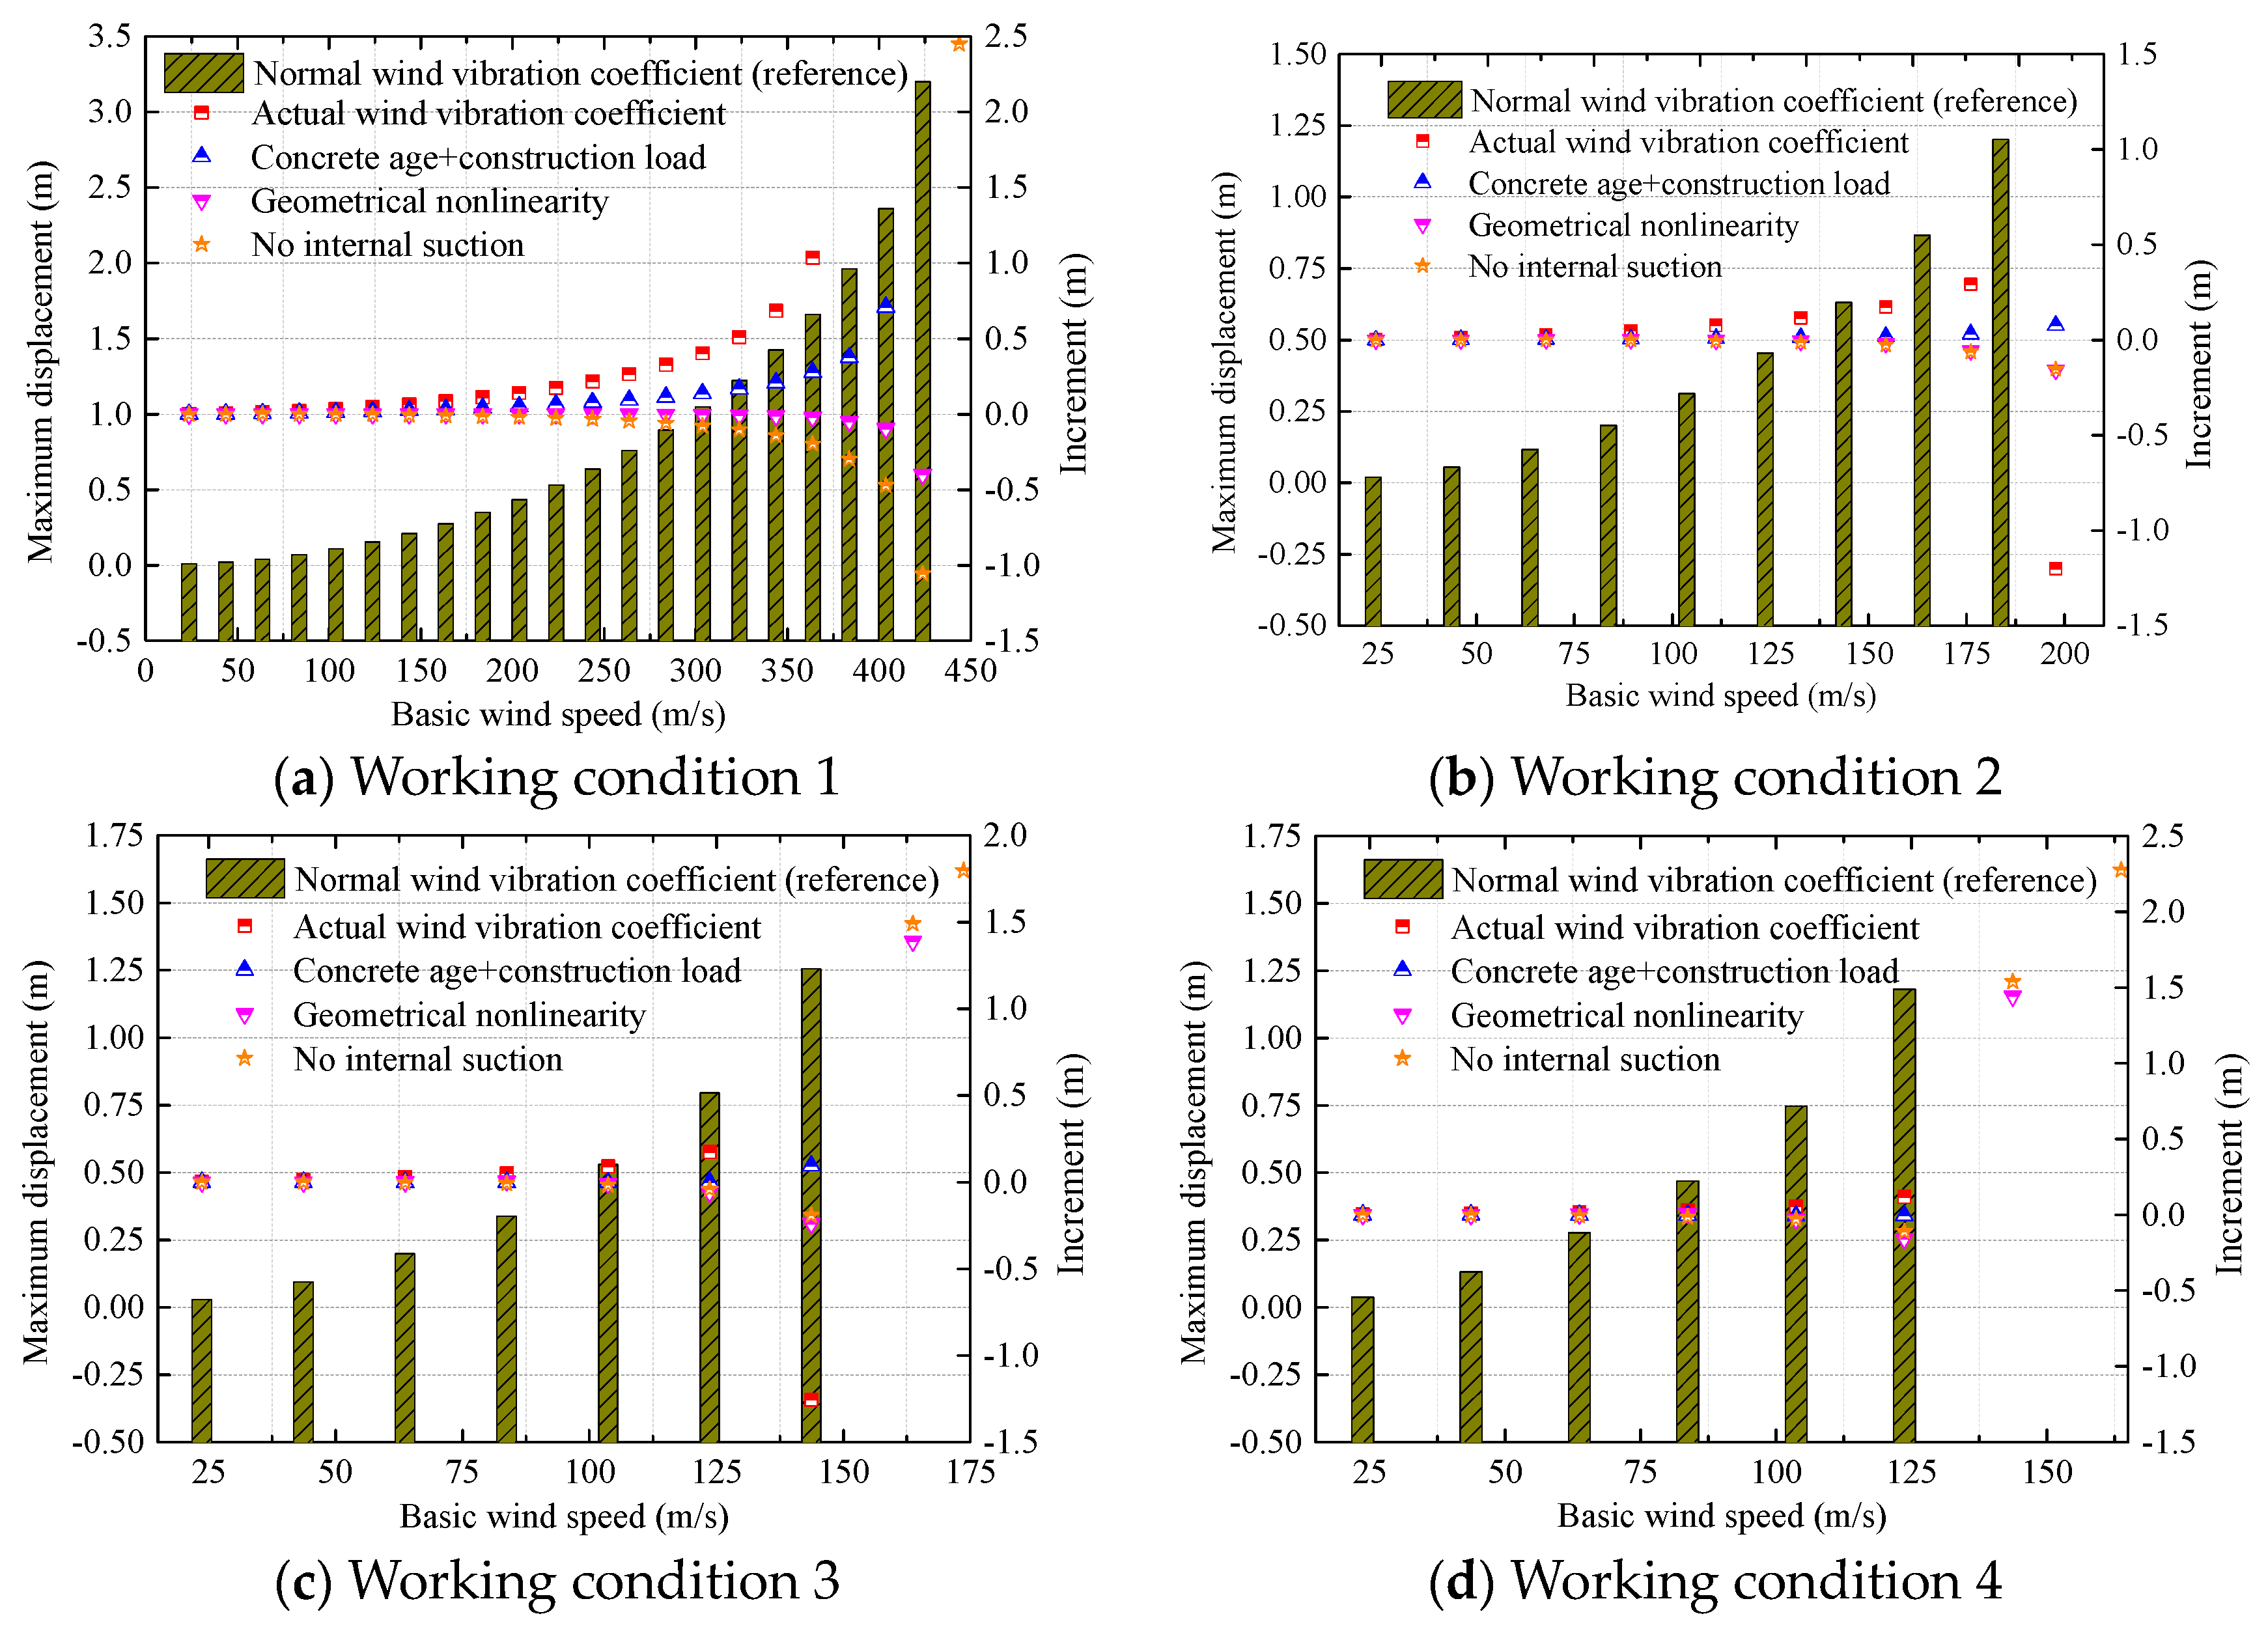
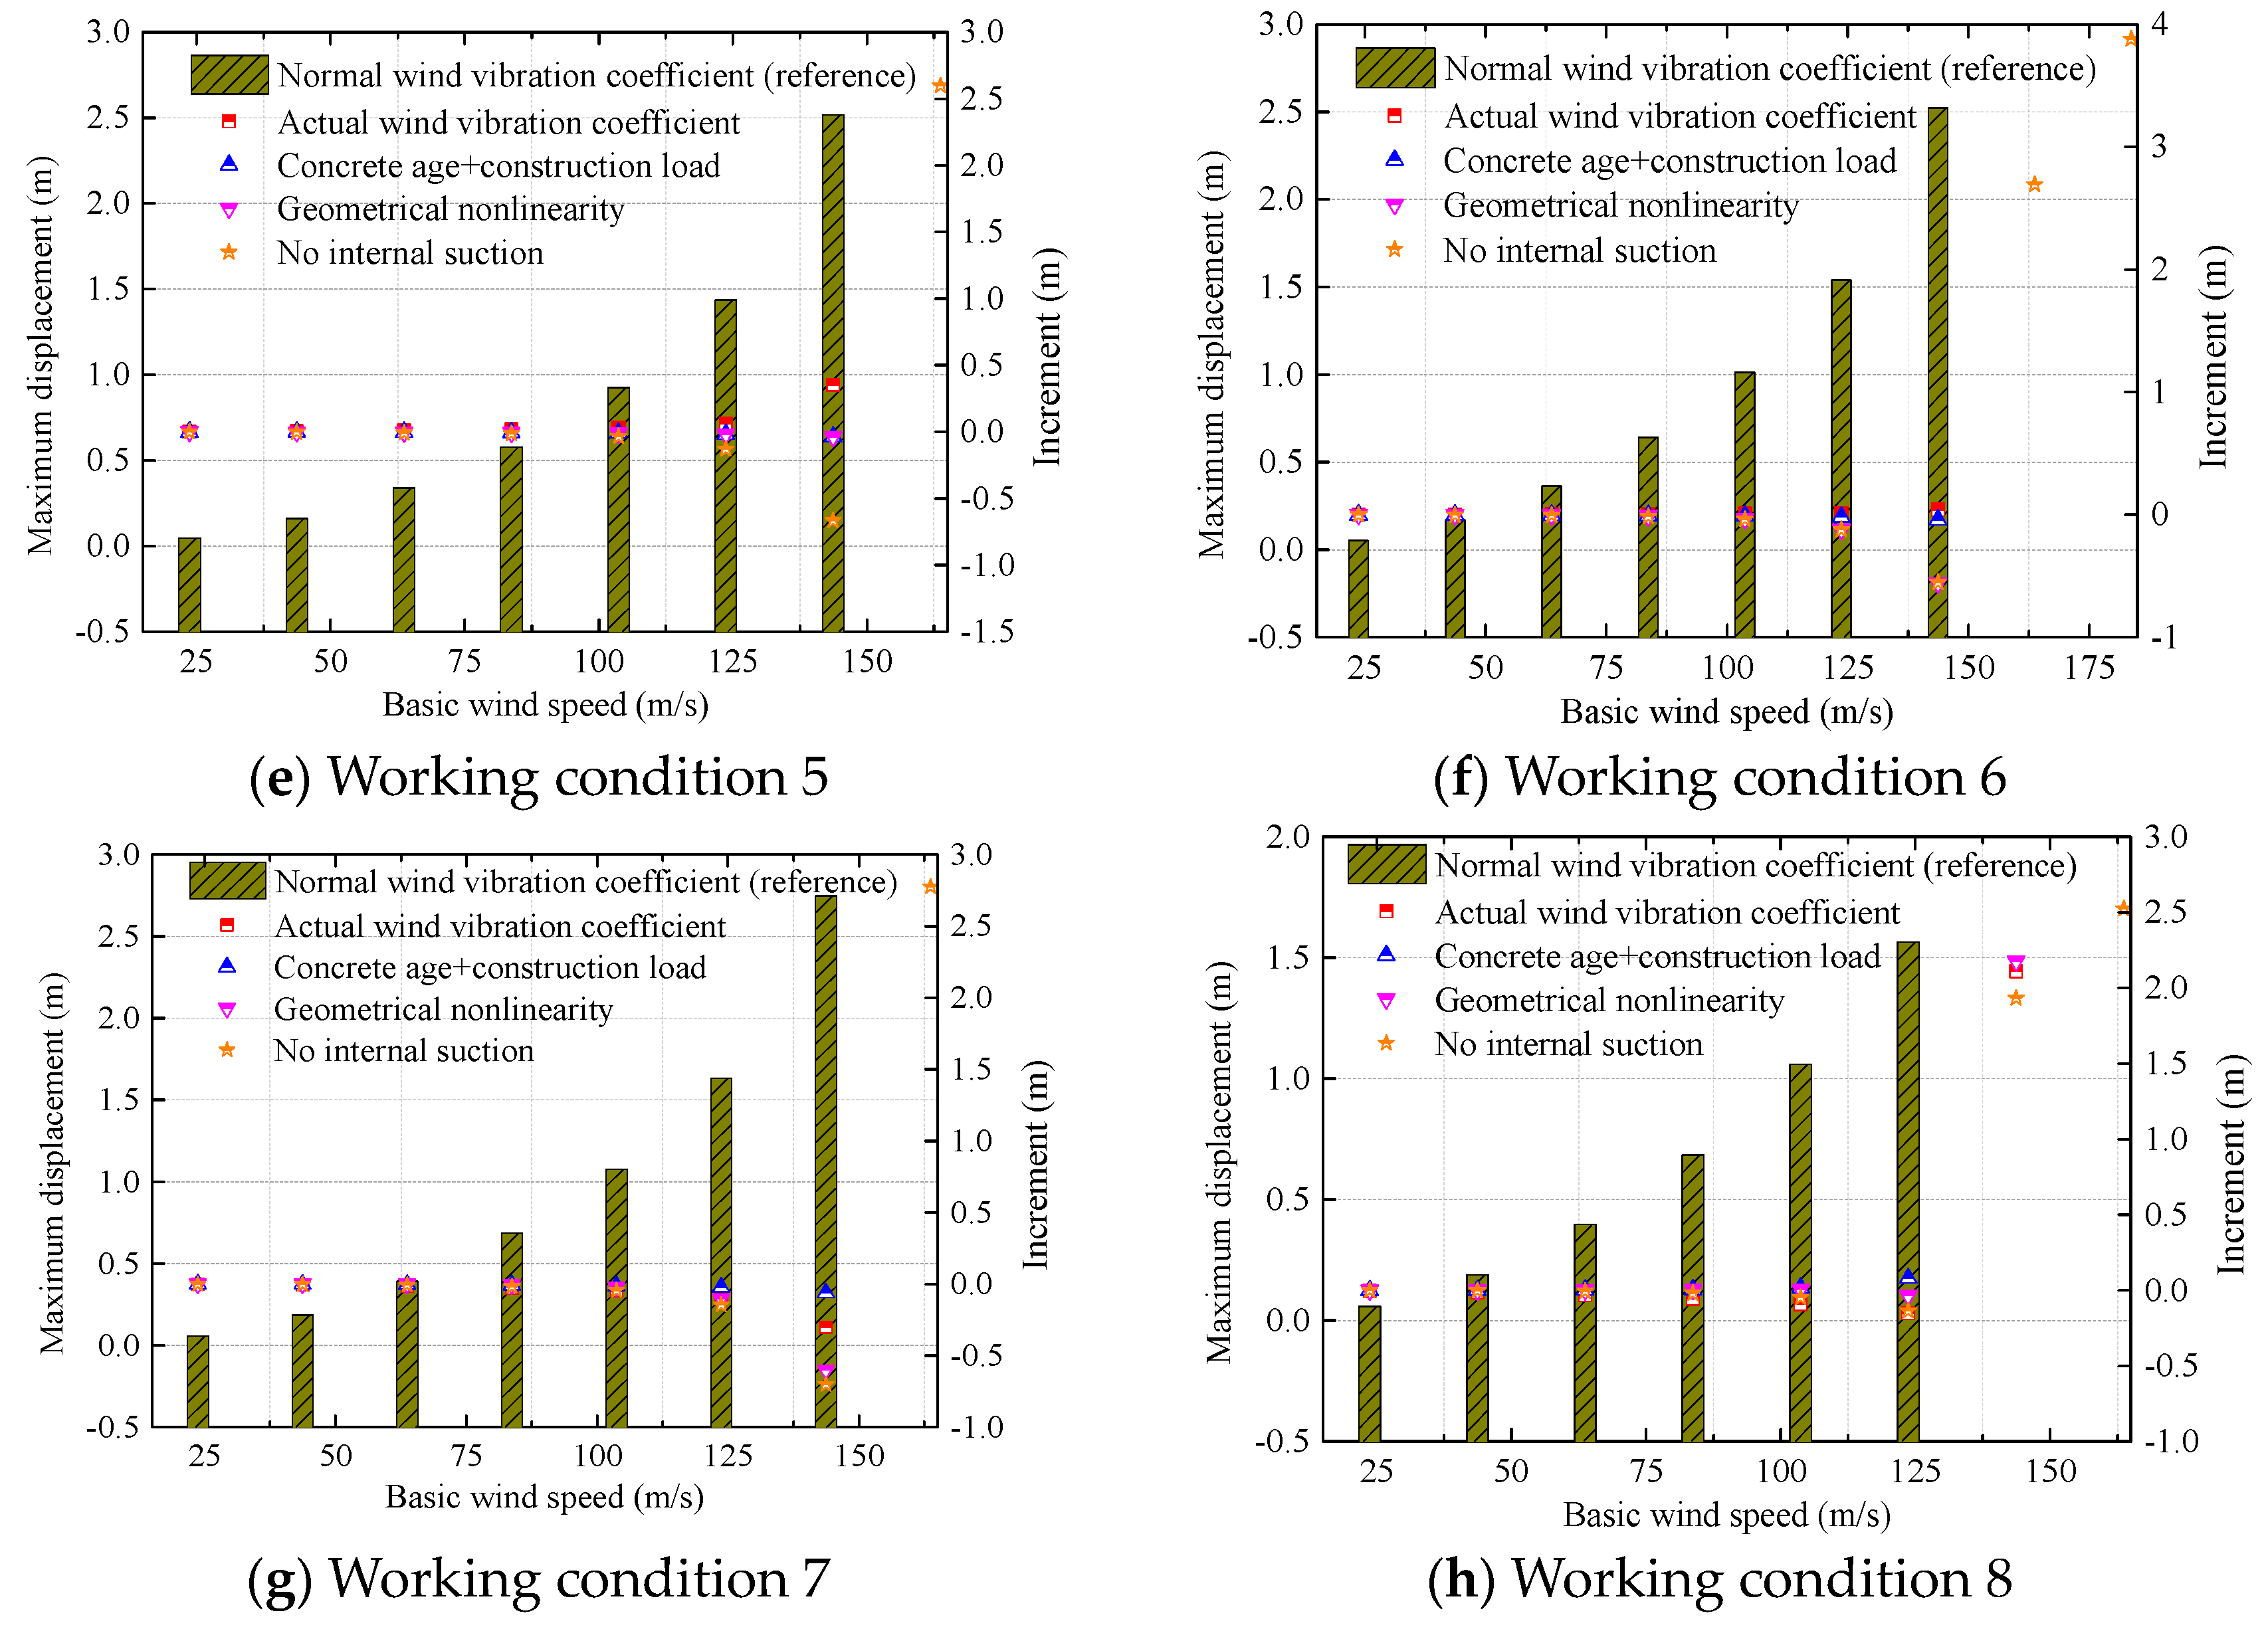
Figure 19 provides the curve of maximum displacement with wind speed during the whole construction period for each working condition. The histogram indicates the changes of maximum displacement with wind speed under the standard wind vibration coefficient. The displacement under actual wind vibration coefficient considering concrete age, construction load, geometric non-linearity, and internal suction force was the increment relative to the condition of standard wind vibration coefficient. Stepwise loading was performed using the initial wind speed of 23.7 m/s at the height of 10 m as the baseline. The step length was 1–20 m/s. Comparison indicated that the increase of construction height greatly reduced the ultimate bearing capacity of the cooling tower. The critical wind speed of buckling decreased from 350 (±20) m/s to 100 (±20) m/s, and the decrease rate became smaller over time. No consistent variation trend was observed for the maximum displacement upon buckling under each working condition.
Ultimate bearing capacity of the cooling tower increased when considering the geometric non-linearity, and decreased when considering the concrete age and construction load. The ultimate bearing capacity during the whole construction process was sensitive to wind vibration coefficient. The ultimate bearing capacity was much lower under actual wind vibration coefficient at a low construction height. As the construction height increased, the ultimate bearing capacity of the structure calculated with the actual wind vibration coefficient increased gradually.
7. Conclusions
We discussed the evolution of wind-induced stability performance and performed parameter analysis for the whole construction process of super large cooling towers. The contents of research included dynamic characteristics, wind vibration coefficient, wind-induced response, buckling instability, ultimate bearing capacity, and geometric non-linearity of the tower. The following conclusions were reached:
(1) The fundamental frequency of the built-up tower was 0.57 Hz. As the construction height increased, the fundamental frequency decreased. Construction height had a significant impact on the lower-order frequencies, but a lesser impact on the higher-order frequencies. The order of capsize mode increased with the increase of construction height, while the frequency of the excitation mode decreased gradually.
(2) The wind vibration coefficient decreased with construction height during the whole construction process. For the same construction model, the wind vibration coefficient was the maximum under equivalent target 5, and it was the smallest under equivalent target 1. Based on the calculation results, we proposed the formula of wind vibration coefficient by taking the meridional axial force as the target for the tower, as shown below. In the formula,
x is the template number, and
y is the wind vibration coefficient for the corresponding template number.
(3) The buckling coefficient of the cooling tower decreased, and the maximum displacement increased gradually as the construction height increased. Buckling displacement showed a discrete distribution, without a consistent variation trend. In addition, the ultimate bearing capacity of the tower decreased with the construction height. The critical wind speed of buckling decreased from 350 (±20) m/s to 100 (±20) m/s, and the decrease trend slowed down over time.
(4) The buckling coefficient of the tower during the whole construction period decreased when considering the concrete age and construction load. Geometric non-linearity had mild impact on the maximum displacement under the basic wind speed, but the impact was higher under the critical wind speed of buckling. The presence of internal suction force caused a reduction in the buckling coefficient of the cooling tower. The buckling coefficients calculated from standard or actual wind vibration coefficient differed little. The influence factors of bucking stability of the cooling tower can be ranked in a decreasing order as follows: internal suction force > geometric non-linearity > concrete age and construction load > wind vibration coefficient. The degree of influence of these factors did not show a consistent variation trend over the construction height.
(5) The ultimate bearing capacity of the cooling tower during the construction period increased when considering geometric non-linearity, and decreased when considering concrete age and construction load. The ultimate bearing capacity during the whole construction process was sensitive to the wind vibration coefficient. As the construction height increased, the ultimate bearing capacity calculated with the actual wind vibration coefficient increased gradually.
To conclude, the checking computation of stability performance of the super large cooling tower during the whole construction period should consider the effect of differential values of wind fluttering coefficient, as well as the influence of concrete age, construction load, and internal suction force. The effect of geometric non-linearity is negligible.
Author Contributions
Conceptualization, S.K.; Data curation, S.K.; Formal analysis, P.Z.; Funding acquisition, S.K.; Investigation, P.Z.; Methodology, Y.G.; Software, L.X.; Writing–original draft, S.K.; Writing-Review & Editing, S.K.
Funding
This project is jointly supported by National Natural Science Foundation (51878351; 51208254; U1733129, 51878351, 51761165022), Jiangsu Province Natural Science Foundation (BK2012390), and Postdoctoral Science Foundation (2013M530255; 1202006B), which are gratefully acknowledged.
Conflicts of Interest
The authors declare no conflict of interest.
References
- Niemann, H.J.; Kopper, H.D. Influence of adjacent buildings on wind effects on cooling towers. Eng. Struct. 1998, 20, 874–880. [Google Scholar]
- Orlando, M. Wind-induced interference effects on two adjacent cooling towers. Eng. Struct. 2001, 23, 979–992. [Google Scholar] [CrossRef]
- Ke, S.; Liang, J.; Zhao, L. Influence of ventilation rate on the aerodynamic interference for two IDCTs by CFD. Wind Struct. Int. J. 2015, 20, 449–468. [Google Scholar] [CrossRef]
- Radwańska, M.; Waszczyszyn, Z.; Radwańska, M. Buckling analysis of a cooling tower shell with measured and theoretically-modelled imperfections. Thin-Walled Struct. 1995, 23, 107–121. [Google Scholar] [CrossRef]
- Noh, H.C. Nonlinear behavior and ultimate load bearing capacity of reinforced concrete natural draught cooling tower shell. Eng. Struct. 2006, 28, 399–410. [Google Scholar] [CrossRef]
- Ke, S.; Ge, Y.; Zhao, L. Evaluation of Strength and Local Buckling for Cooling Tower with Gas Flue. Comput. Struct. Eng. 2009, 545–551. [Google Scholar] [CrossRef]
- Karisiddappa; Viladkar, M.N.; Godbole, P.N.; Krishna, P. Finite element analysis of column supported hyperbolic cooling towers using semi-loof shell and beam elements. Eng. Struct. 1998, 20, 75–85. [Google Scholar] [CrossRef]
- Waszczyszyn, Z.; Pabisek, E.; Pamin, J.; Radwańska, M. Nonlinear analysis of a RC cooling tower with geometrical imperfections and a technological cut-out. Eng. Struct. 2000, 22, 480–489. [Google Scholar] [CrossRef]
- Witasse, R.; Georgin, J.F.; Reynouard, J.M. Nuclear cooling tower submitted to shrinkage: behavior underweight and wind. Nucl. Eng. Des. 2002, 21, 247–257. [Google Scholar] [CrossRef]
- Ke, S.; Ge, Y. Extreme wind pressures and non-Gaussian characteristics for super-large hyperbolic cooling towers considering aero-elastic effect. J. Eng. Mech. ASCE 2015, 141, 04015010. [Google Scholar] [CrossRef]
- Ke, S.; Zhu, P. Impact study of the different air-deflectors on the wind pressure for super-large cooling towers. J. Vib. Shock 2016, 35, 136–141. (In Chinese) [Google Scholar]
- Zhang, M.; Wang, F.; Li, Q.; Tang, D. Design wind loads on hyperbolic cooling towers during construction. J. Tsinghua Univ. (Sci. Technol.) 2015, 12, 1281–1288. (In Chinese) [Google Scholar]
- Du, L.; Ke, S. Wind-induced Limit Bearing Capacity in Whole Construction Process for Cooling Tower based on ANSYS Secondary Development. J. Vib. Shaock 2016, 35, 170–175. (In Chinese) [Google Scholar]
- Ke, S.; Zhao, L.; Zhang, J. Wind tunnel test and stability performance analysis of super large cooling tower with gas flue in power plant. J. Harbin Inst. Technol. 2011, 43, 114–118. (In Chinese) [Google Scholar]
- Lu, C.; Li, Q.; Huang, S.; Chen, F.; Fu, X.; Guo, M. Simulation of large eddy of wind load on a long-span complex roof structure. China Civ. Eng. J. 2011, 44, 1–9. [Google Scholar]
- VGB-R610Ue. VGB-Guideline: Structural Design of Cooling Tower-Technical Guideline for the Structural Design, Computation and Execution of Cooling Tower; BTR Bautechnik Bei Kühltürmen: Essen, Germany, 2005. [Google Scholar]
- Blanchette, J.; Nelson, T.F.; Xuan, Z. The British Standard Institution. In Proceedings of the Apha Meeting and Exposition, New Orleans, LA, USA, 2013; pp. 633–634. [Google Scholar]
- DL/T 5339-2006. Code for Hydraulic Design of Fossil Fuel Power Plants; The Ministry of Construction of China: Beijing, China, 2006. (In Chinese) [Google Scholar]
- GB/T 50102-2014. Code for Design of Cooling for Industrial Recirculating Water; The Ministry of Construction of China: Beijing, China, 2014. (In Chinese) [Google Scholar]
Figure 1.
Computational domain and grid generation for the super large cooling tower.
Figure 1.
Computational domain and grid generation for the super large cooling tower.
Figure 2.
Comparison of numerical calculation, field measurement, and wind tunnel test.
Figure 2.
Comparison of numerical calculation, field measurement, and wind tunnel test.
Figure 3.
Time history of pressure coefficient at representative measuring points of the built-up tower.
Figure 3.
Time history of pressure coefficient at representative measuring points of the built-up tower.
Figure 4.
Power spectral density curves of pulsating wind pressure at the representative measuring points.
Figure 4.
Power spectral density curves of pulsating wind pressure at the representative measuring points.
Figure 5.
Nephograms of pressure coefficients on tower surface under eight typical working conditions.
Figure 5.
Nephograms of pressure coefficients on tower surface under eight typical working conditions.
Figure 6.
Schematic for turbulent kinetic energy distribution under working condition 8.
Figure 6.
Schematic for turbulent kinetic energy distribution under working condition 8.
Figure 7.
Frequency distribution of the first fifty modes under each working condition.
Figure 7.
Frequency distribution of the first fifty modes under each working condition.
Figure 8.
Changes of frequencies with the number of circumferential harmonics under each working condition.
Figure 8.
Changes of frequencies with the number of circumferential harmonics under each working condition.
Figure 9.
Wind vibration coefficient with meridional heights under five equivalent targets for each working condition.
Figure 9.
Wind vibration coefficient with meridional heights under five equivalent targets for each working condition.
Figure 10.
Comparison of wind vibration coefficient under the five equivalent targets between eight working conditions.
Figure 10.
Comparison of wind vibration coefficient under the five equivalent targets between eight working conditions.
Figure 11.
Fitted curve of wind vibration coefficients under the five equivalent targets for eight working conditions.
Figure 11.
Fitted curve of wind vibration coefficients under the five equivalent targets for eight working conditions.
Figure 12.
Distribution of elastic modulus of concrete under working condition 2.
Figure 12.
Distribution of elastic modulus of concrete under working condition 2.
Figure 13.
Changes of buckling coefficient and buckling displacement under eight working conditions.
Figure 13.
Changes of buckling coefficient and buckling displacement under eight working conditions.
Figure 14.
Comparison of maximum displacement under linearity and non-linearity of the structure for basic wind speed during the whole construction process.
Figure 14.
Comparison of maximum displacement under linearity and non-linearity of the structure for basic wind speed during the whole construction process.
Figure 15.
Comparison of maximum displacement under linearity and non-linearity of the structure for critical wind speed of buckling during the whole construction process.
Figure 15.
Comparison of maximum displacement under linearity and non-linearity of the structure for critical wind speed of buckling during the whole construction process.
Figure 16.
Comparison of buckling coefficient and displacement under standard and actual wind vibration coefficients.
Figure 16.
Comparison of buckling coefficient and displacement under standard and actual wind vibration coefficients.
Figure 17.
Comparison of maximum displacement in linear and non-linear analyses under basic wind speed.
Figure 17.
Comparison of maximum displacement in linear and non-linear analyses under basic wind speed.
Figure 18.
Comparison of maximum displacement in linear and non-linear analyses under critical buckling wind speed.
Figure 18.
Comparison of maximum displacement in linear and non-linear analyses under critical buckling wind speed.
Figure 19.
Changes of maximum displacement and increment with wind speed under eight working conditions.
Figure 19.
Changes of maximum displacement and increment with wind speed under eight working conditions.
Table 1.
Main structural parameters of super large cooling tower.
Table 1.
Main structural parameters of super large cooling tower.
| Component | Height/m | Wall Thickness/m | Radius/m | Concrete Grade | Structural Schematic |
|---|
| Tower body | 32.5 | 2.00 | 80.5 | C40 | ![Applsci 09 04202 i001]() |
| 44.7 | 0.58 | 76.8 |
| 69.8 | 0.46 | 69.8 |
| 82.3 | 0.43 | 66.5 |
| 107.7 | 0.39 | 60.7 |
| 120.4 | 0.39 | 58.4 |
| 133.3 | 0.38 | 56.7 |
| 159.2 | 0.37 | 55.2 |
| 172.2 | 0.37 | 55.6 |
| 185.2 | 0.37 | 56.4 |
| 210.0 | 0.50 | 58.5 |
| Pillar | 52 pairs of X-shaped pillars with a cross-sectional area of 1.8 m × 1.2 m | C45 |
| Foundation | Circular plate foundation with a cross-sectional area of 12 m × 2.5 m | C35 |
Table 2.
Parameters of super large cooling tower under typical working conditions.
Table 3.
Vibration modes at fundamental frequency under each working condition.
Table 4.
Capsize modes of the cooling tower for the whole construction process.
Table 5.
Five equivalent targets for value determination of wind vibration coefficient.
Table 5.
Five equivalent targets for value determination of wind vibration coefficient.
| Equivalent Target | No. |
|---|
| Meridional axial force on the upwind side | Equivalent target 1 |
| Von Mises stress on the upwind side | Equivalent target 2 |
| Average absolute value of the mean response | Equivalent target 3 |
| Maximum absolute value of the mean response | Equivalent target 4 |
| Maximum pressure coefficient * | Equivalent target 5 |
Table 6.
Recommended values of wind vibration coefficient under each working condition.
Table 6.
Recommended values of wind vibration coefficient under each working condition.
| Working Condition | Working Condition 1 | Working Condition 2 | Working Condition 3 | Working Condition 4 | Working Condition 5 | Working Condition 6 | Working Condition 7 | Working Condition 8 |
|---|
| Wind vibration coefficient | 2.47 | 2.34 | 2.19 | 2.02 | 1.96 | 1.91 | 1.82 | 1.74 |
© 2019 by the authors. Licensee MDPI, Basel, Switzerland. This article is an open access article distributed under the terms and conditions of the Creative Commons Attribution (CC BY) license (http://creativecommons.org/licenses/by/4.0/).


