Simulation of Turbulent Mixing Effects on Essential NOx–O3–Hydrocarbon Photochemistry in Convective Boundary Layer
Abstract
Featured Application
Abstract
1. Introduction
2. Model Description
2.1. Model Reactions
2.2. Model Equations
2.3. Model Approaches
3. Model Simulation
3.1. Simulation Description
3.2. Comparison Description
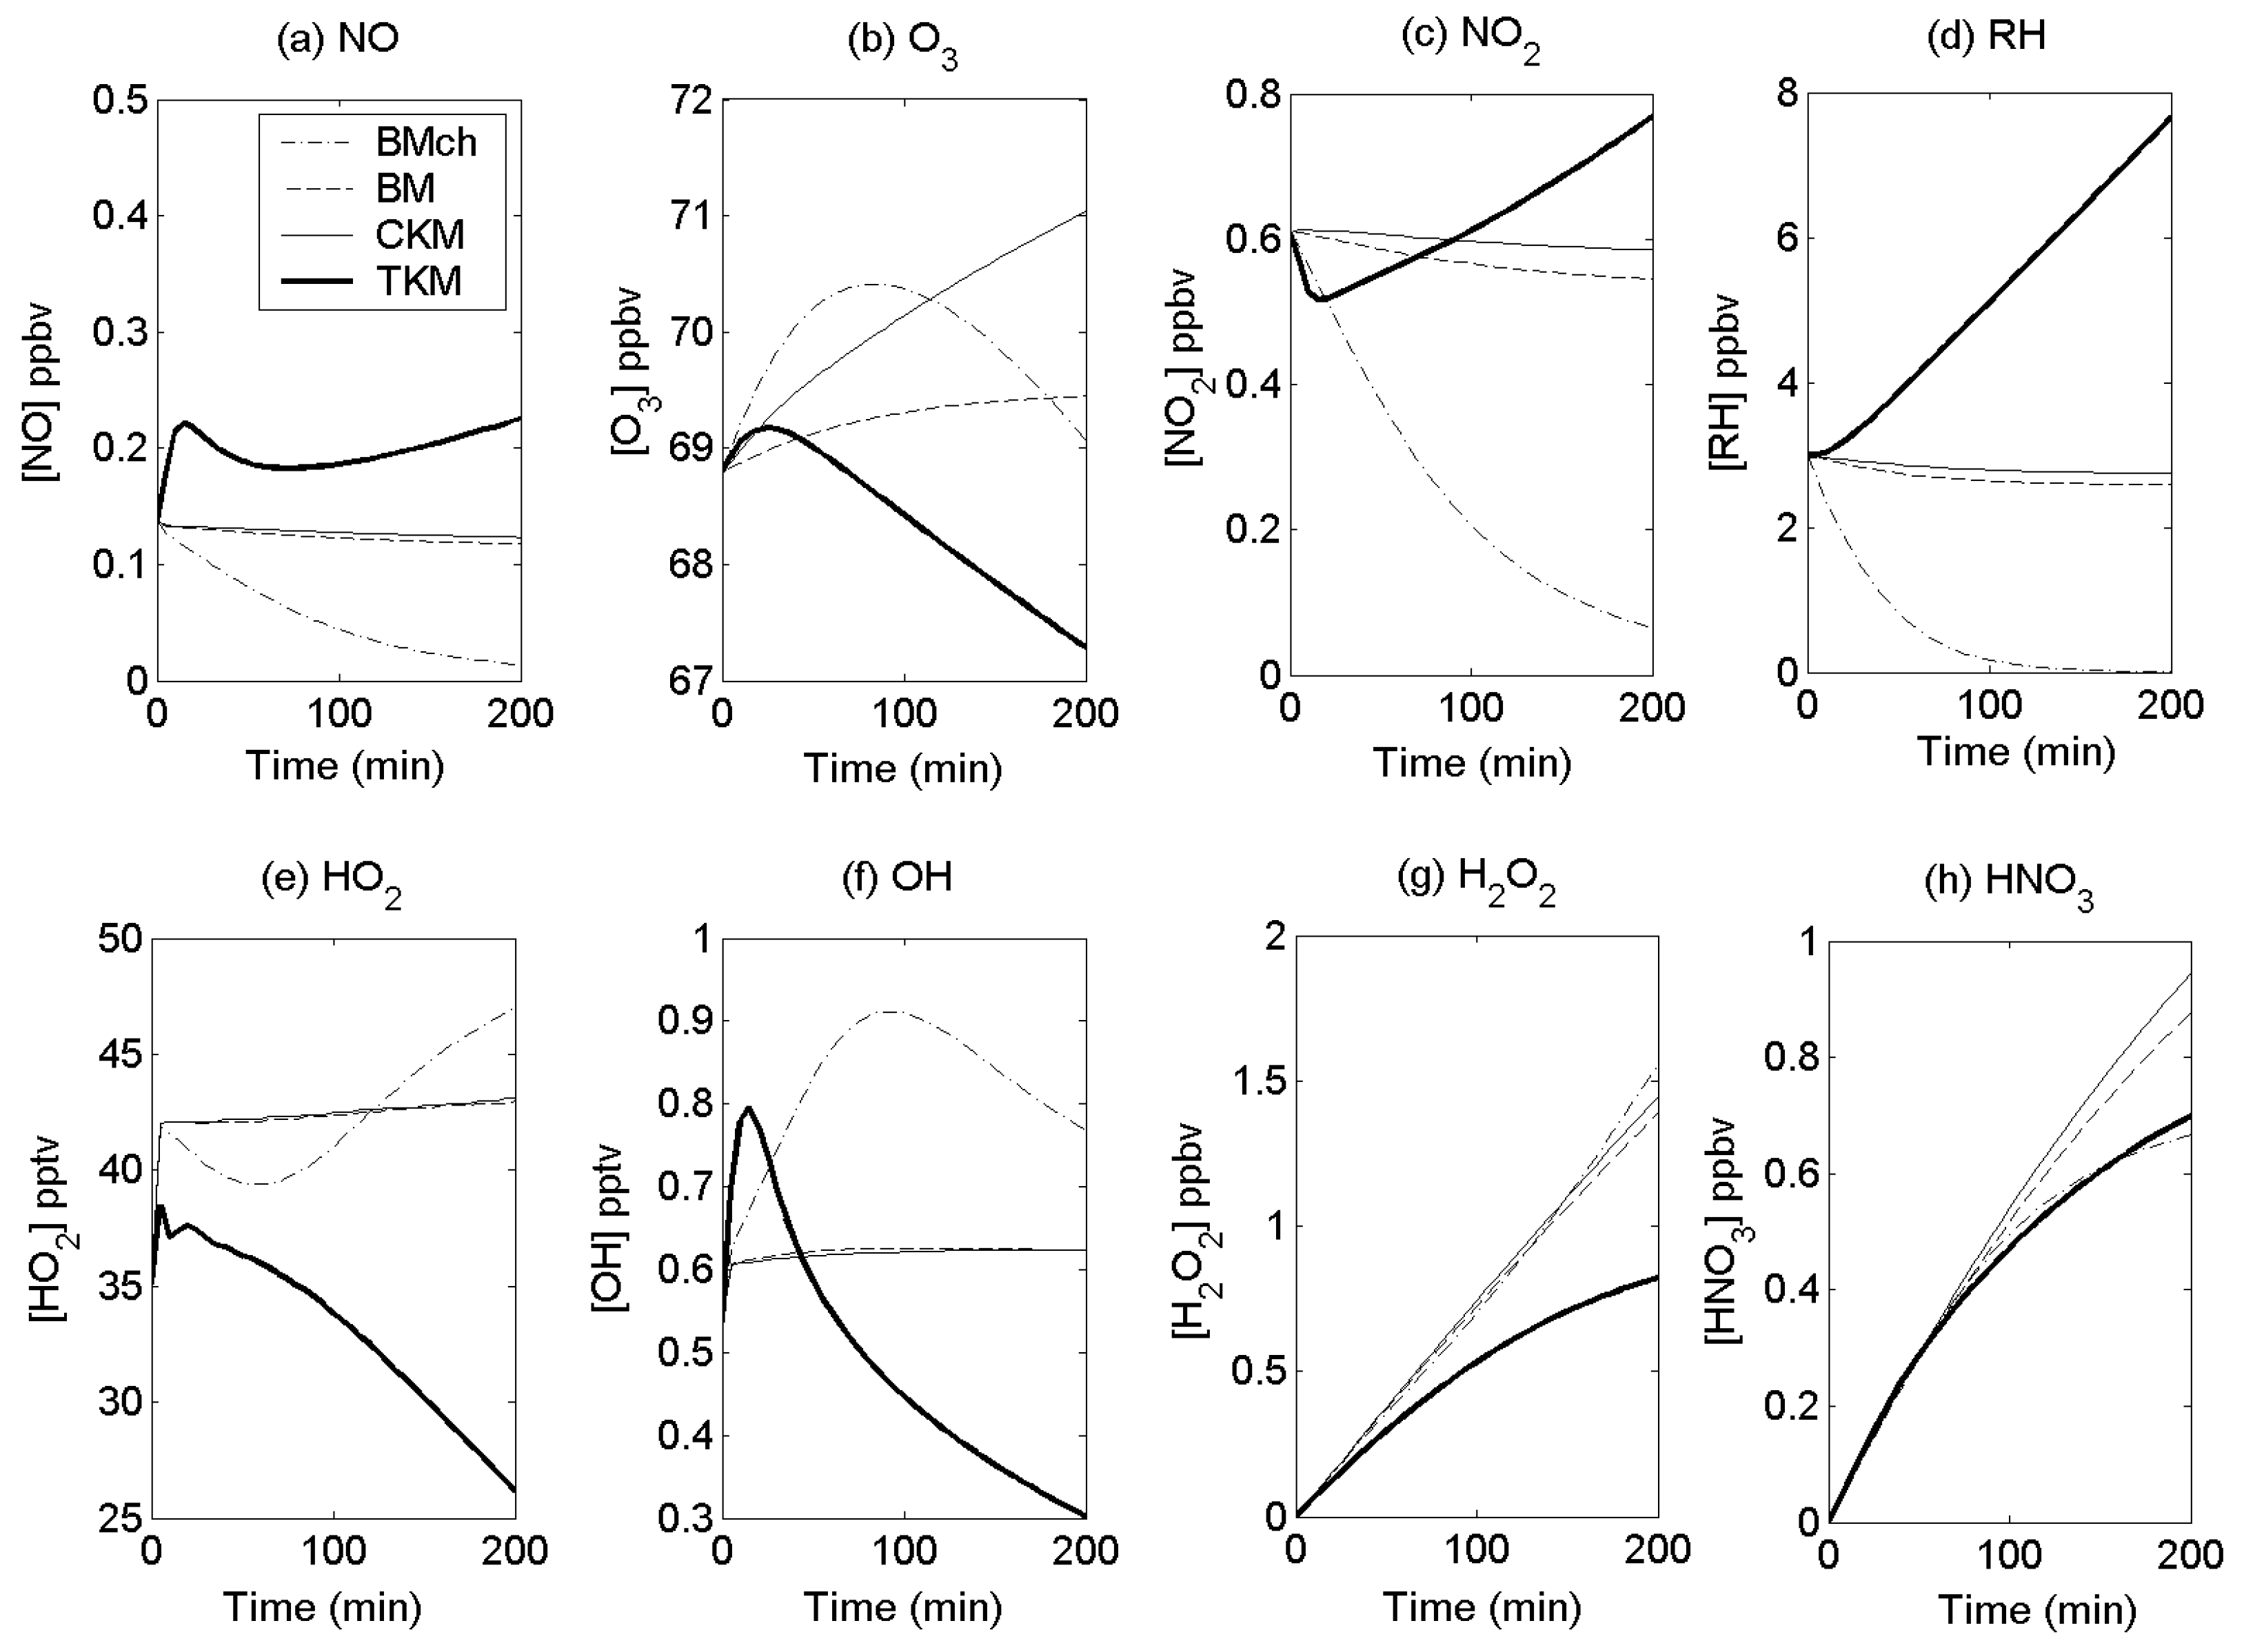
- 0-dimensional Box Model (BMch) simulating only chemical reactions with no emission or deposition fluxes.
- 0-D Box Model (BM) including chemical reactions and physical processes (emission, exchange of fluxes, and dry deposition process) but no convective transport and turbulence.
- 1-D Conventional Kinetics Model (CKM) using mean reaction rates and including transport and turbulence.
- 1-D Turbulent Kinetics Model (TKM) including transport and turbulence and using effective reaction rates.
4. Simulation Results and Discussion
4.1. Inerts
4.2. Reactive-Species Concentrations
4.3. Reactant Segregation
4.4. Comparisons with Other Models
4.5. Sensitivity analysis
- The concentrations of OH and HO2 varied the most (relative to the reference case concentrations) of any other species modeled in the TKM. This is because the mechanism for the oxidation of RH and cycling of NOx involves chain reactions with the HOx radicals as the principal intermediates at very low concentrations between the much more abundant emitted species and their end products.
- The concentrations of NOx, HOx and RH modeled in the TKM were most sensitive to changes in the emission rates of NO and RH.
- Because the initial concentrations of O3 are much larger than for the other species, they varied on an absolute basis more than any species except RH. However, because the reaction scheme is cyclical for O3, it varied little relative to the reference case.
- The segregation effects of turbulence on R5 and R6 were promoted by increased emission rates of RH and NO, respectively. Decreased emission rates of those species diminished the effects of turbulence.
- The concentrations of the major species and the segregations of the principal reactions produced by the TKM appear to be relatively insensitive to the specific hydrocarbon mechanism as judged by comparing the CB-4 to the reference case [36]. Significant differences appear in HOx species and could be expected in their end products, H2O2 and HNO3, especially at later times.
5. Conclusions
Funding
Acknowledgments
Conflicts of Interest
Appendix A. Vertical Turbulent Mixing Scheme, Asymmetric Convective Model (ACM)
References
- Weber, W.J.; DiGiano, F.A., Jr. Process Dynamics in Environmental Systems; Wiley: Hoboken, NJ, USA, 1996; Chapter 7–8; ISBN 978-0-471-01711-0. [Google Scholar]
- Vinuesa, J.-F.; Arellano, J.V.-G.D. Fluxes and (co-)variances of reacting scalars in the convective boundary layer. Tellus B Chem. Phys. Meteorol. 2011, 55, 935–949. [Google Scholar] [CrossRef]
- Vinuesa, J.-F.; Arellano, J.V.-G.D. Introducing effective reaction rates to account for the inefficient mixing of the convective boundary layer. Atmos. Environ. 2005, 39, 445–461. [Google Scholar] [CrossRef]
- Fraigneau, Y.; Gonzalez, M.; Coppalle, A. The influence of turbulence upon the chemical reaction of nitric oxide released from a ground source into ambient ozone. Atmos. Environ. 1996, 30, 1467–1480. [Google Scholar] [CrossRef]
- Sykes, R.I.; Parker, S.F.; Henn, D.S. Turbulent mixing with chemical reaction in the Planetary Boundary Layer. J. Appl. Meteorol. 1994, 33, 825–834. [Google Scholar] [CrossRef]
- Wolfe, G.M.; Hanisco, T.F.; Arkinson, H.L.; Bui, T.P.; Crounse, J.D.; Dean-Day, J.; Goldstein, A.; Guenther, A.; Hall, S.R.; Huey, G.; et al. Quantifying sources and sinks of reactive gases in the lower atmosphere using air borne flux observations. Geophys. Res. Lett. 2015, 42, 8231–8240. [Google Scholar] [CrossRef]
- Schumann, U. Large-eddy simulation of turbulent diffusion with chemical reactions in the convective boundary layer. Atmos. Environ. 1989, 23, 1713–1727. [Google Scholar] [CrossRef]
- Donaldson, G.P.; Hilst, G.R. Effect of inhomogeneous mixing on atmospheric photochemical reactions. Environ. Sci. Technol. 1972, 6, 812–816. [Google Scholar] [CrossRef]
- Bilger, R.W. Turbulent Flows with Nonpremixed Reactants, Turbulent Reacting Flows; Libby, P.A., Willimas, F.A., Eds.; Springer: Berlin/Heidelberg, Germany, 1980; pp. 65–113. [Google Scholar]
- Kim, M.-S. Turbulent chemical kinetics model (TKM): A study of turbulent mixing effects on simple NOx-O3 photochemistry in Convective Boundary Layer. J. Korean Soc. Environ. Technol. 2017, 18, 86–102. [Google Scholar]
- Seaman, N.L.; Stauffer, D.R.; Lario-Gibbs, A.M. A multiscale four-dimensional data assimilation system applied in the San Joaquin Valley during SARMAP. Part I: Modeling design and basic performance characteristics. J. Appl. Meteorol. 1995, 34, 1739–1761. [Google Scholar] [CrossRef]
- Karamchandani, P.; Santos, L.; Sykes, I.; Zhang, Y.; Tonne, C.; Seigneur, C. Development and Evaluation of a State-of-the-Science Reactive Plume Model. Environ. Sci. Technol. 2000, 34, 870–880. [Google Scholar] [CrossRef]
- Fu, T.-M.; Zheng, Y.; Paulot, F.; Mao, J.; Yantosca, R.M. Positive but variable sensitivity of August surface ozone to large-scale warming in the southeast United States. Nat. Clim. Chang. 2015, 5, 454–458. [Google Scholar] [CrossRef]
- Shen, L.; Mickley, L.J.; Tai, P.K. Influence of synoptic patterns on surface ozone variability over the eastern United States from 1980 to 2012. Atmos. Chem. Phys. 2015, 15, 10925–10938. [Google Scholar] [CrossRef]
- Zhang, Y.; Wang, Y. Climate-driven ground-level ozone extreme in the fall over th Southeast United States. Proc. Natl. Acad. Sci. USA 2016, 113, 10025–10030. [Google Scholar] [CrossRef] [PubMed]
- Cleary, P.A.; Fuhrman, N.; Schulz, L.; Schafer, J.; Fillingham, J.; Bootsma, H.; McQueen, J.; Tang, Y.; Langel, T.; McKeen, S.; et al. Ozone distributions over southern Lake Michigan: Comparisons between ferry-based observations, shoreline-based DOAS observations and model forecasts. Atmos. Chem. Phys. 2015, 15, 5109–5122. [Google Scholar] [CrossRef]
- Clifton, O.E.; Fiore, A.M.; Correa, G.; Horowitz, L.W.; Naik, V. Twenty-first century reversal of the surface ozone seasonal cycle over the northeastern United States. Geophys. Res. Lett. 2014, 41, 7343–7350. [Google Scholar] [CrossRef]
- Madrigano, J.; Jack, D.; Anderson, G.B.; Bell, M.L.; Kinney, P.L. Temperature, ozone, and mortality in urban and non-urban counties in the northeastern United States. Environ. Health 2015, 14, 1–11. [Google Scholar] [CrossRef]
- He, H.; Liang, X.-Z.; Lei, H.; Wuebbles, D.J. Future U.S. ozone projections dependence on regional emissions, climate change, long-range transport and differences in modeling design. Atmos. Environ. 2016, 128, 124–133. [Google Scholar] [CrossRef]
- Strode, S.A.; Rodriguez, J.M.; Logan, J.A.; Cooper, O.R.; Witte, J.C.; Lamsal, L.N.; Damon, M.; Aartsen, B.V.; Steenrod, S.D.; Strahan, S.E. Trends and variability in surface ozone over the United States. JGR Atmos. 2015, 120, 9020–9042. [Google Scholar] [CrossRef]
- Schnell, J.L.; Prather, M.J. Co-occurrence of extremes in surface ozone, particulate matter, and temperature over eastern North America. Proc. Natl. Acad. Sci. USA 2017, 114, 2854–2859. [Google Scholar] [CrossRef]
- Khuriganova, O.; Obolkin, V.; Akimoto, H.; Ohizumi, T.; Khodzher, T.; Potemkin, V.; Golobokova, L. Long-term dynamics of ozone in surface atmosphere at remote mountain, rural and urban sites of south-east Siberia, Russia. Open Access Libr. J. 2016, 3, 1–9. [Google Scholar] [CrossRef]
- Silva, G.D.; Graham, C.; Wang, Z.-F. Unimolecular-hydroxyperoxy radical decomposition with OH recycling in the photochemical oxidation of Isoprene. Environ. Sci. Technol. 2010, 44, 250–256. [Google Scholar] [CrossRef] [PubMed]
- Lenschow, D.H.; Gurarie, D.; Patton, E.G. Modeling the diurnal cycle of conserved and reactive species in the convective boundary layer using SOMCRUS. Geosci. Model Dev. 2016, 9, 979–996. [Google Scholar] [CrossRef]
- Krol, M.C.; Molemaker, M.J.; de Arellano, J.V.G. Effects of turbulence and heterogeneous emissions on photochemically active species in the convective boundary layer. J. Geophys. Res. 2000, 105, 6871–6884. [Google Scholar] [CrossRef]
- Gao, W.; Wesely, M.L. Numerical modeling of the turbulent fluxes of chemically reactive trace gases in the atmospheric boundary layer. J. Appl. Meteorol. 1994, 33, 835–847. [Google Scholar] [CrossRef]
- Verver, G.H.L.; van Dop, H.; Holtslag, A.A.M. Turbulent Mixing of Reactive Gases in the Convective Boundary Layer. Bound.-Layer Meteorol. 1997, 85, 197–222. [Google Scholar] [CrossRef]
- Verver, G.H.L.; van Dop, H.; Holtslag, A.A.M. Turbulent mixing and the chemical breakdown of isoprene in the atmospheric boundary layer. J. Geophys. Res. 2000, 105, 3983–4002. [Google Scholar] [CrossRef]
- Kristensen, L.; Lenschow, D.H.; Gurarie, D.; Jensen, N.O. A simple model for the vertical transport of reactive species in the convective atmospheric boundary layer. Bound.-Layer Meteorol. 2010, 134, 195–221. [Google Scholar] [CrossRef]
- Pleim, J.E.; Chang, J.S. A non-local closure model for vertical mixing in the convective boundary layer. Atmos. Environ. 1992, 26, 965–981. [Google Scholar] [CrossRef]
- Stockwell, R.W.; Middleton, P.; Chang, J.S.; Tang, X. The second generation regional acid deposition model chemical mechanism for regional sir quality modeling. J. Geophys. Res. 1990, 95, 16343–16367. [Google Scholar] [CrossRef]
- Yarwood, G.; Whitten, G.Z.; Rao, S. Final Report-Updates to the Carbon Bond 4 Photochemical Mechanism, ENVRON International Corporation. Available online: http://citeseerx.ist.psu.edu/viewdoc/download?doi=10.1.1.616.4133&rep=rep1&type=pdf (accessed on 16 January 2019).
- Lamb, R.G.; Shu, W.R. A model of second-order chemical reactions in turbulent fluid—Part I: Formulation and validation. Atmos. Environ. 1978, 2, 1685–1694. [Google Scholar] [CrossRef]
- Georgopoulos, P.G.; Seinfeld, J.H. Mathematical modeling of turbulent reacting plumes—I. General theory and model formulation. Atmos. Environ. 1986, 20, 1791–1808. [Google Scholar] [CrossRef]
- Ganzeveld, L.; Lelieveld, J. Dry deposition parameterization in a chemistry general circulation model and its influence on the distribution of reactive trace gases. J. Geophys. Res. 1995, 100, 20999–21012. [Google Scholar] [CrossRef]
- Hauglustaine, D.A.; Granier, C.; Brasseur, G.P.; Megie, G. The importance of atmospheric chemistry in the calculation of radiative forcing on the climate system. J. Geophys. Res. 1994, 99, 1173–1186. [Google Scholar] [CrossRef]
- Jacob, D.; Wofsy, S. Photochemistry of biogenic emissions over the Amazon forest. J. Geophys. Res. 1988, 93, 1477–1486. [Google Scholar] [CrossRef]
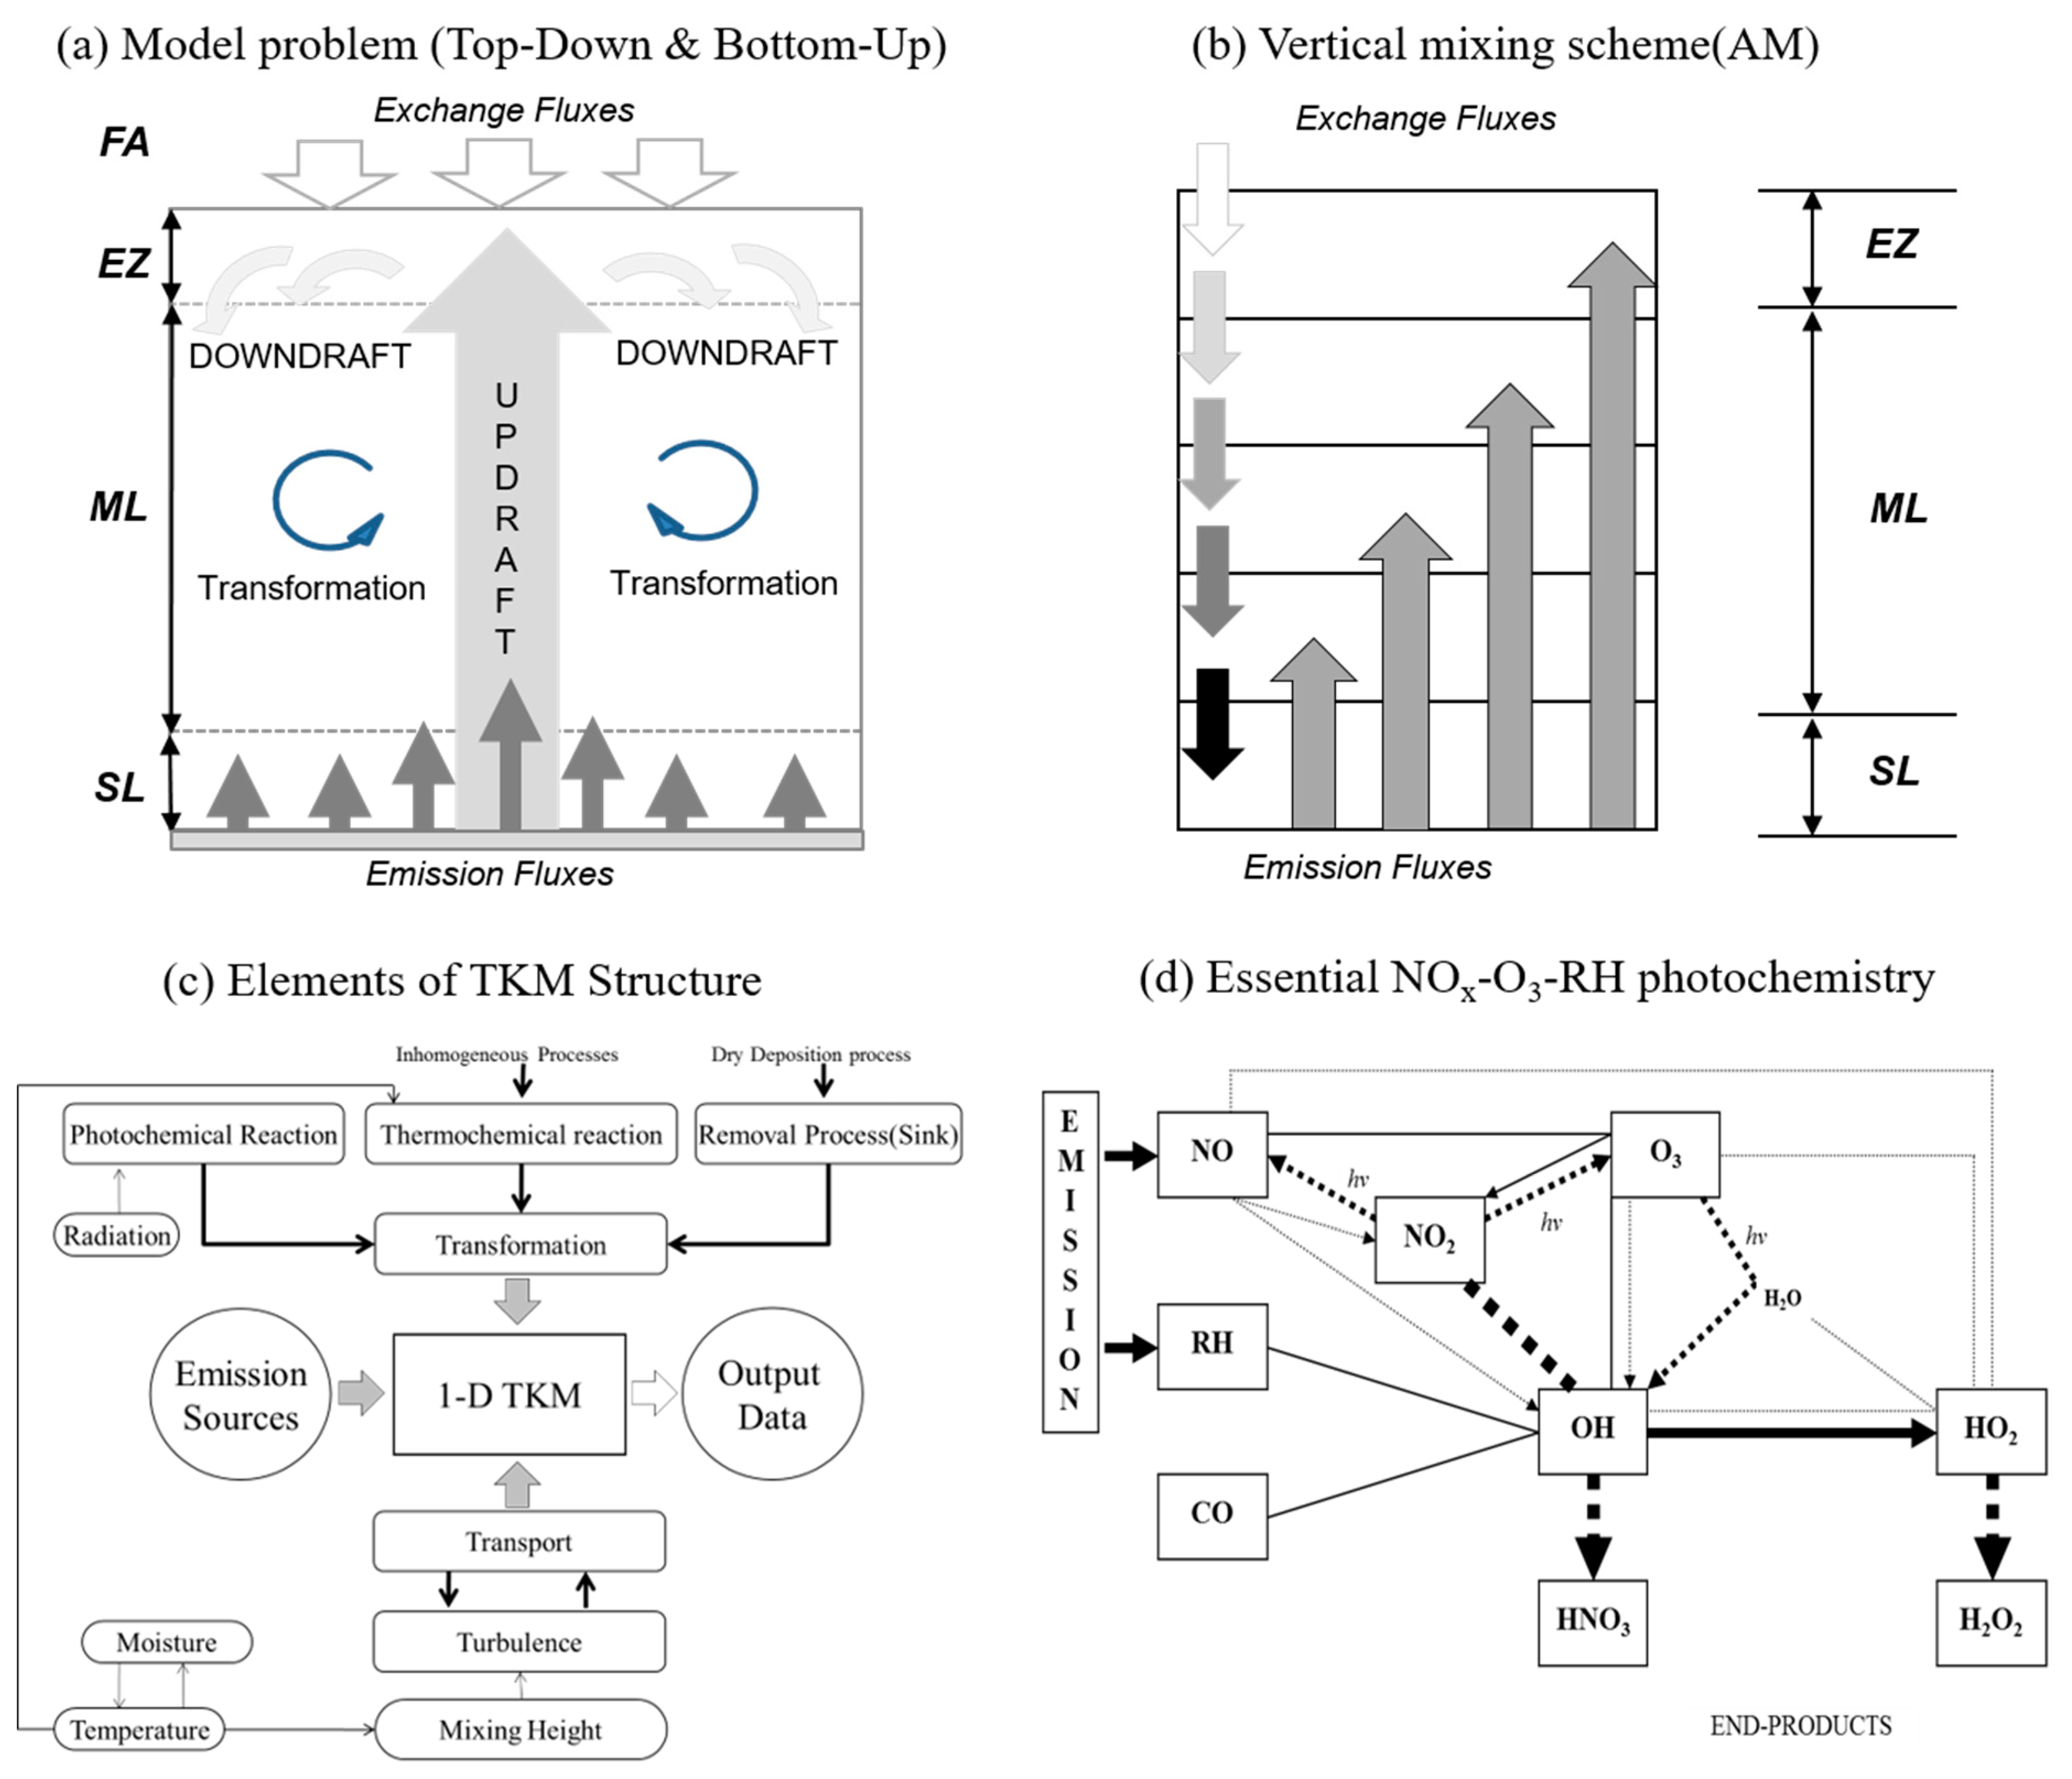

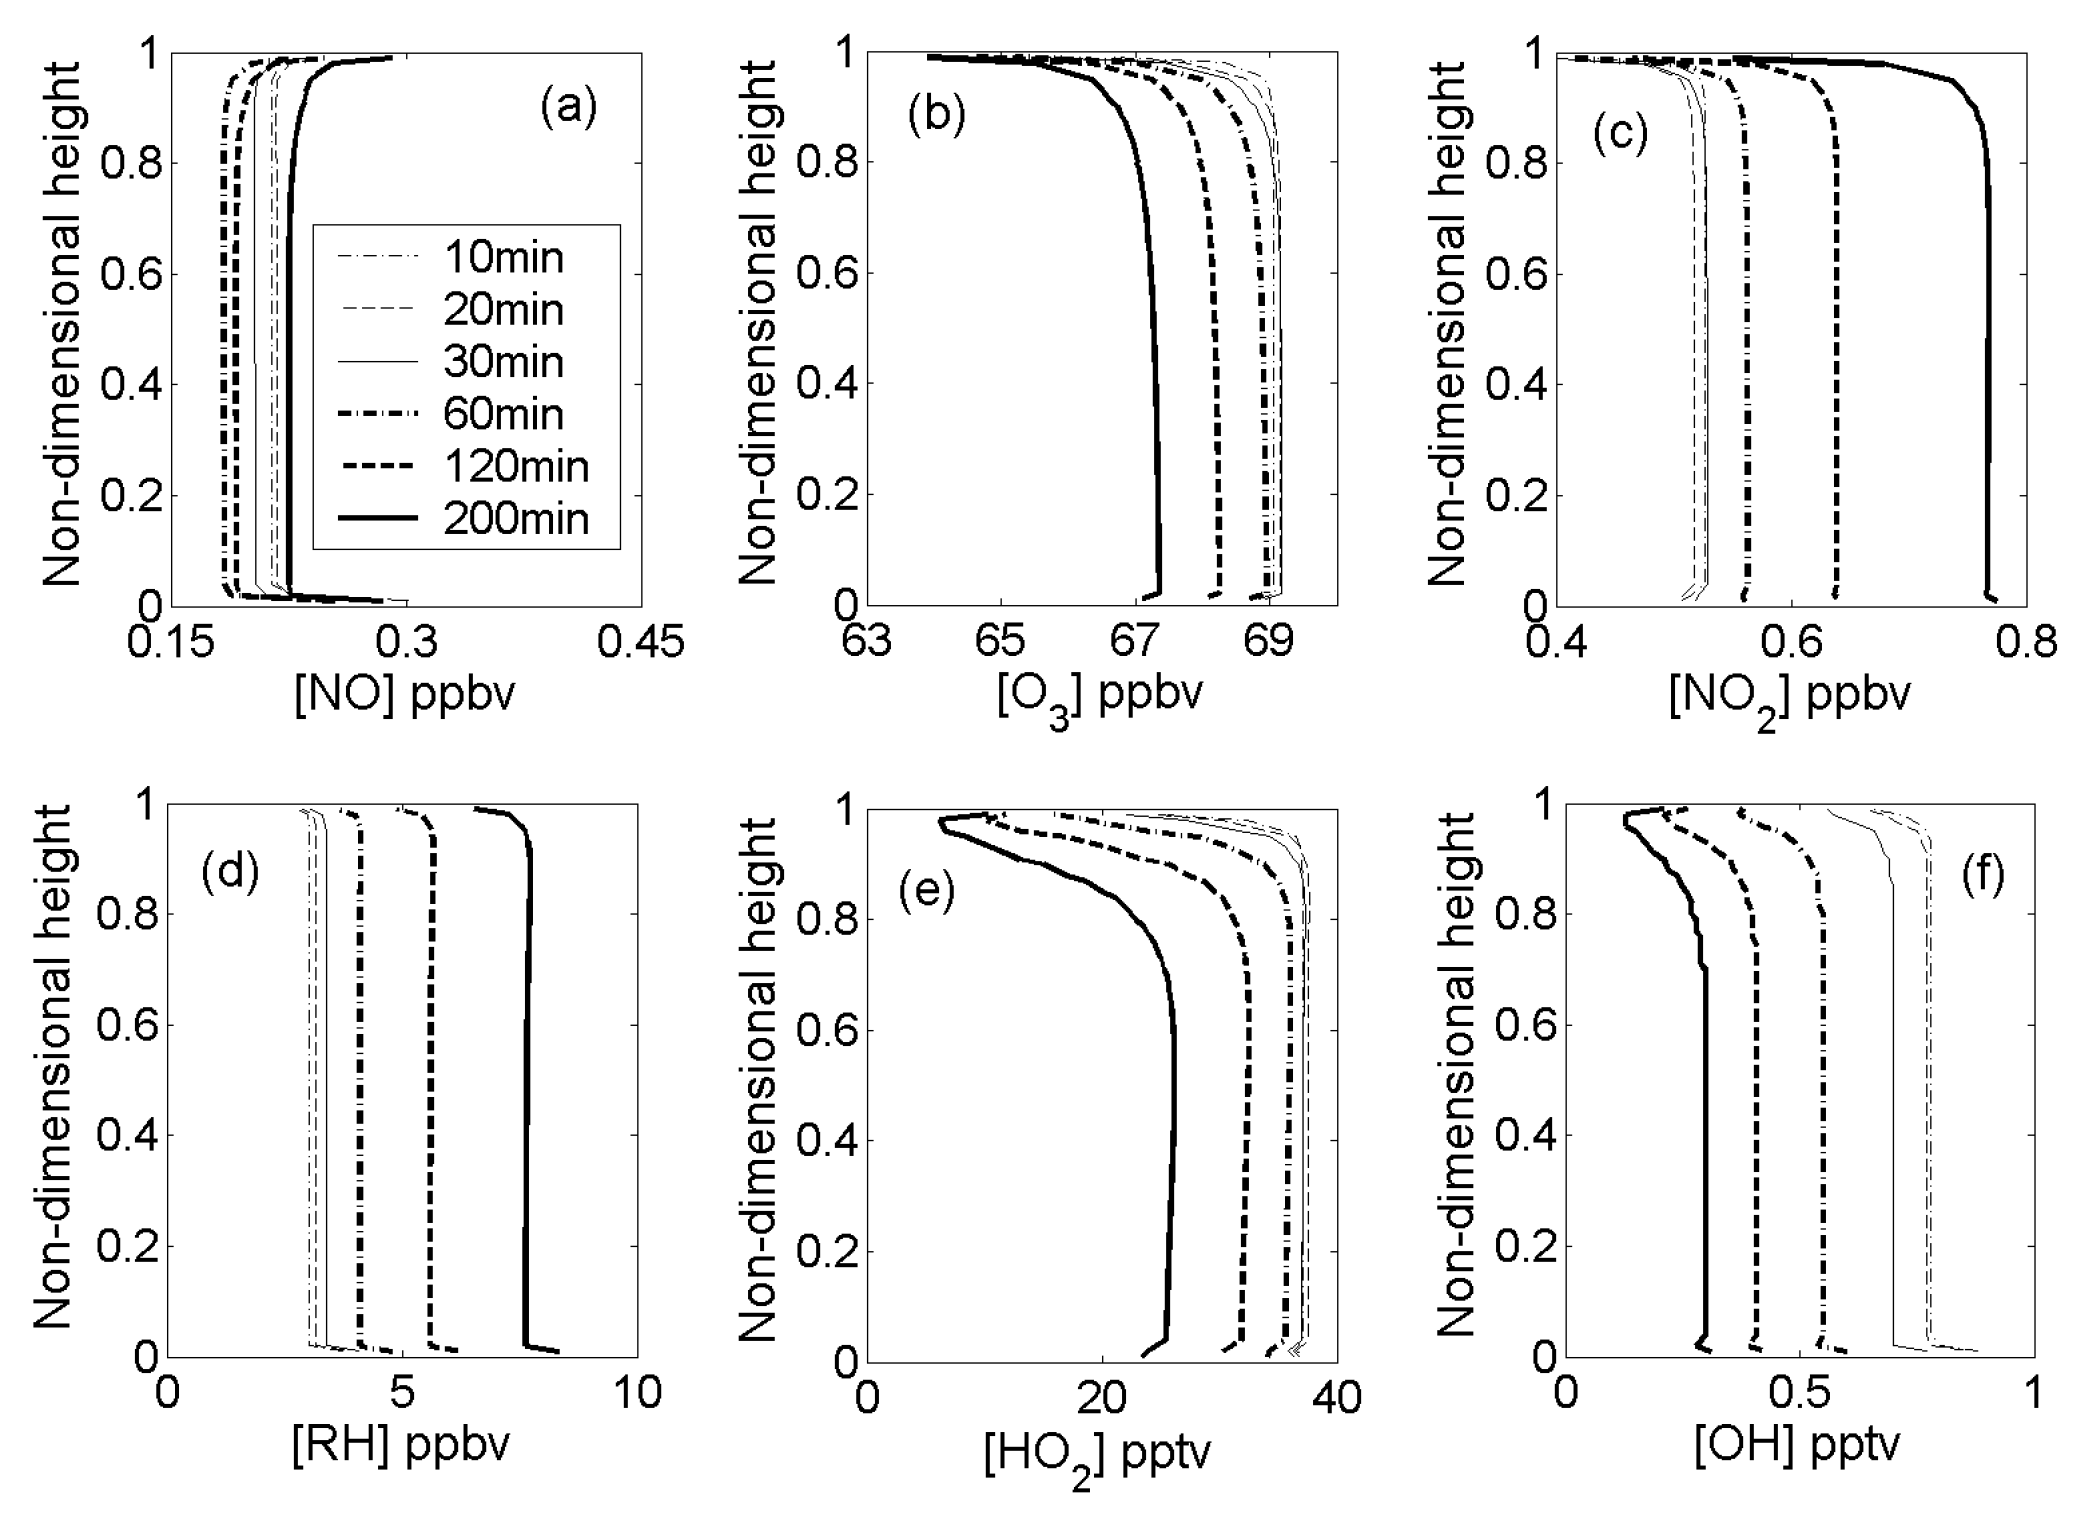
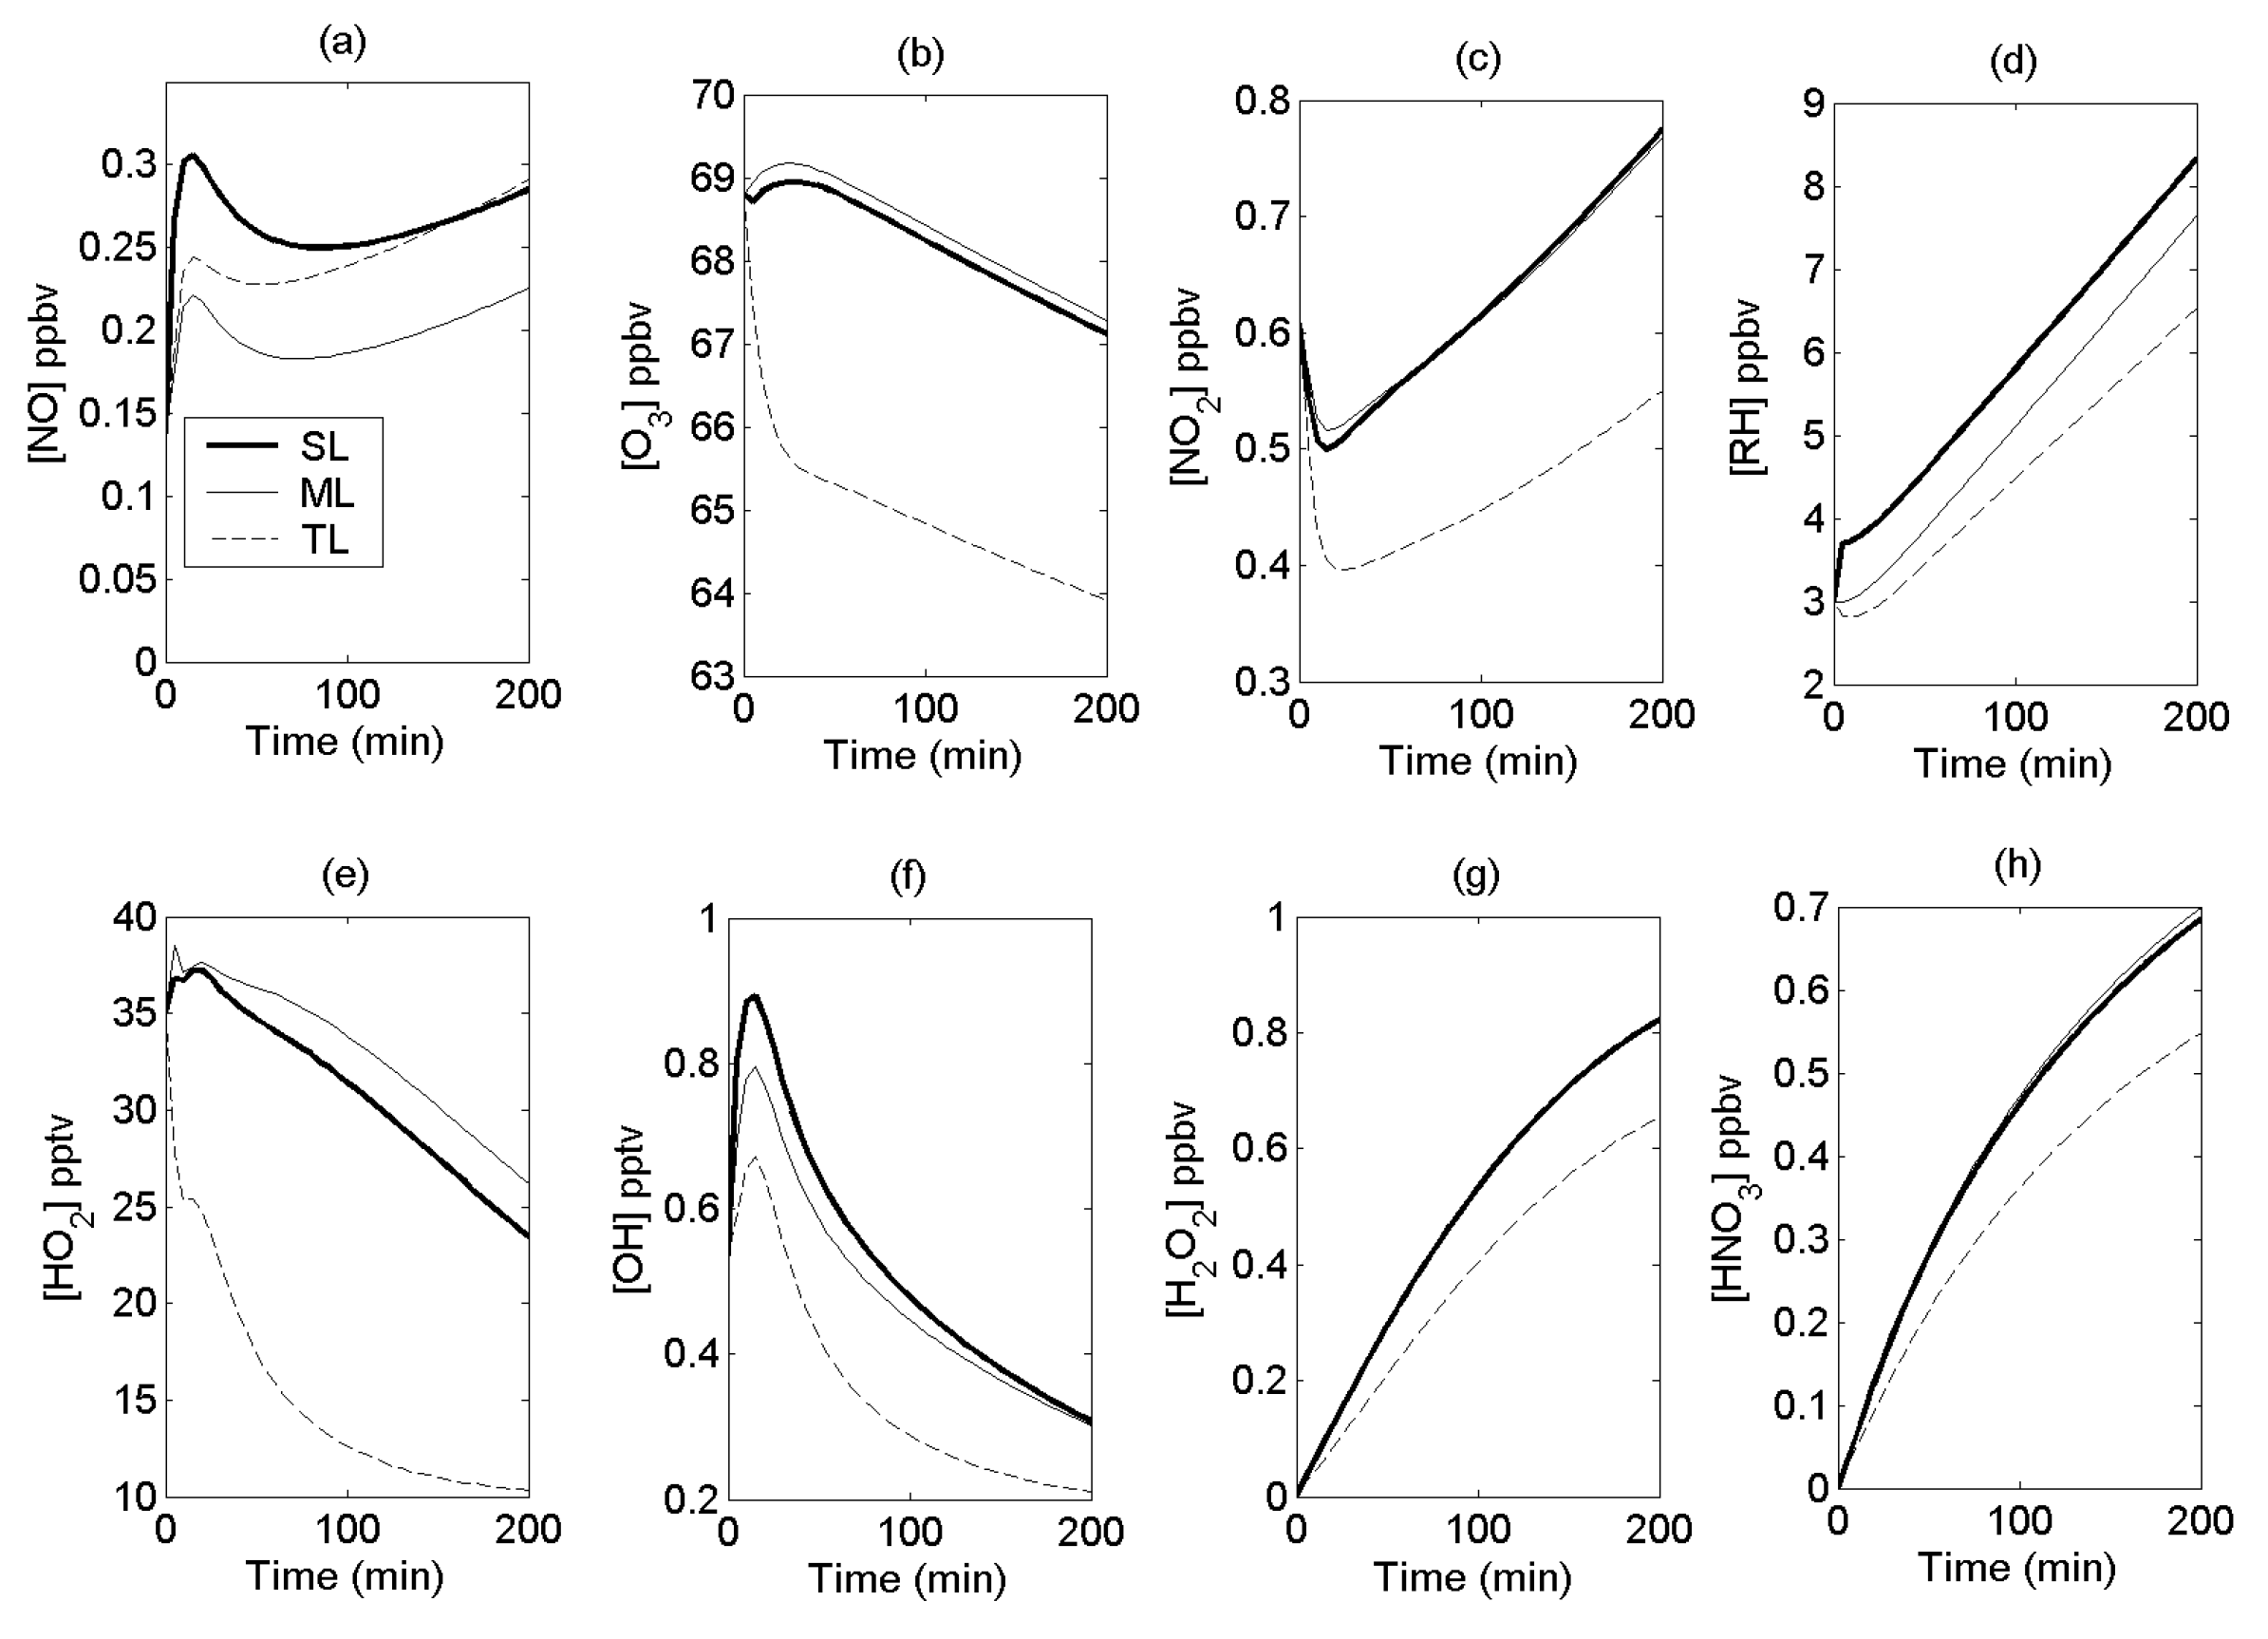
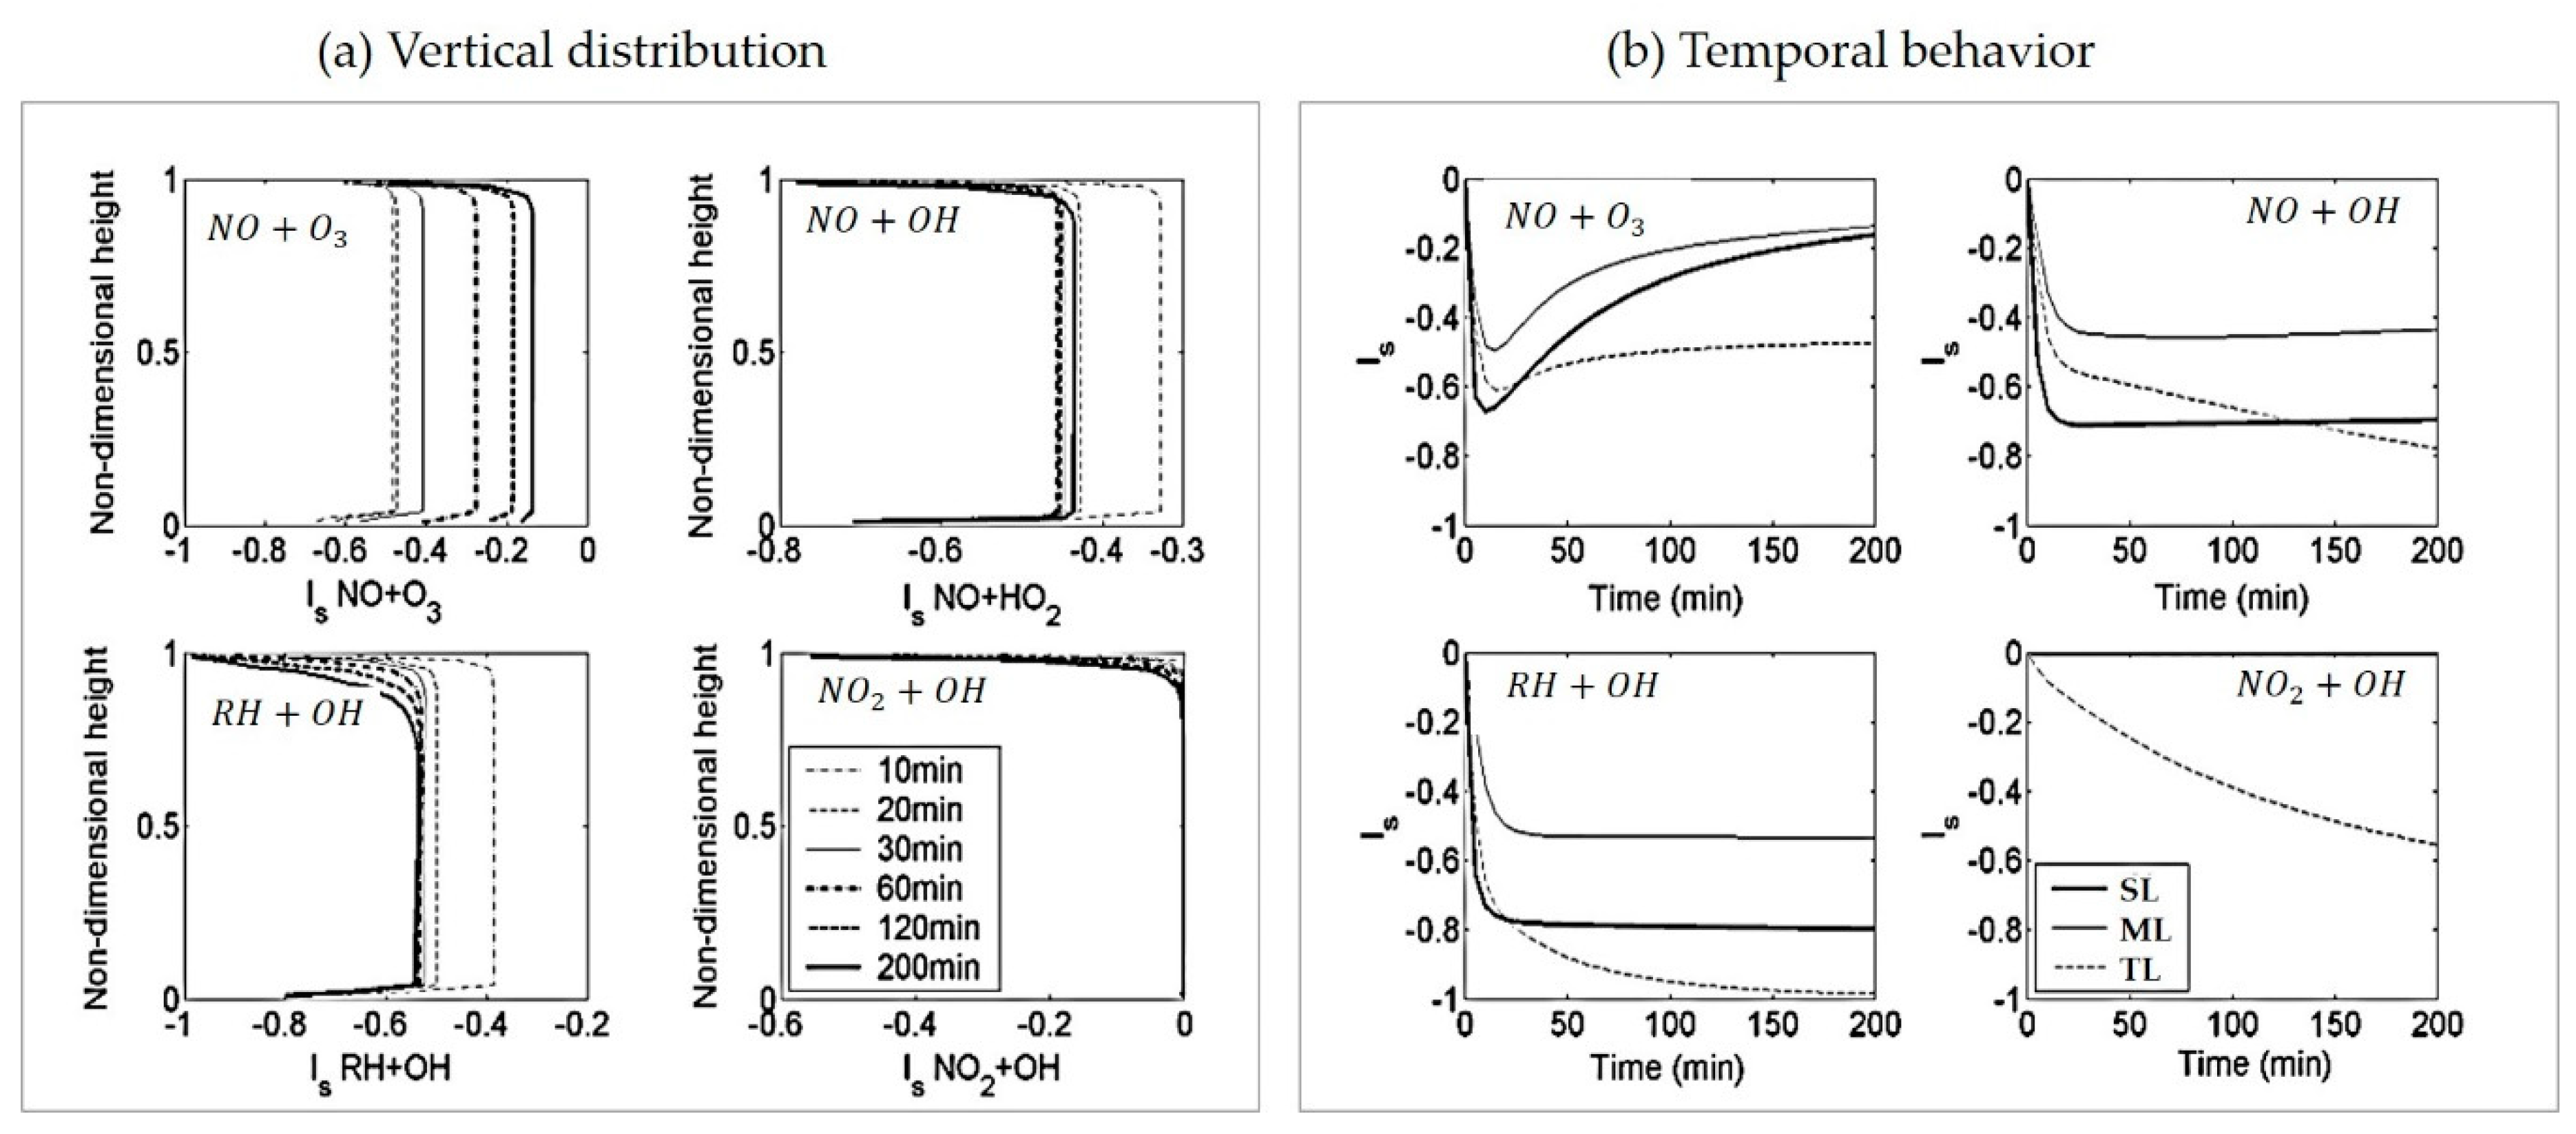

| Reactions | Reactants | Products | Parameter | Rate Constant at 298 °K | |
|---|---|---|---|---|---|
| S90 a | CB-IV c | ||||
| R1 | O3 | 2 OH + O2 | J1 b | 2.7 × 10⁻⁶ | 2.7 × 10⁻⁶ |
| R2 | NO2 | NO + O3 | J2 | 8.9 × 10⁻³ | 8.9 × 10⁻³ |
| R3 | O3 + NO → | NO2 + O2 | k1 | 4.75 × 10⁻⁴ | 4.49 × 10⁻⁴ |
| R4 | OH + CO | HO2 + CO2 | k2 | 6.0 × 10⁻³ | 3.18 × 10⁻³ |
| R5 | OH + RH → | HO2 + products | k2 × f | 6.0 × 10⁻³ × f | 3.18 × 10⁻³ × f |
| R6 | HO2 + NO → | OH + NO2 | k3 | 2.1 × 10⁻¹ | 2.04 × 10⁻¹ |
| R7 | HO2 + O3 → | OH + 2 O2 | k4 | 5.0 × 10⁻⁵ | 3.87 × 10⁻⁵ |
| R8 | 2 HO2 → | H2O2 + O2 | k5 | 7.25 × 10⁻² | 4.24 × 10⁻² |
| R9 | OH + NO2 → | HNO3 | k6 | 2.75 × 10⁻¹ | 3.59 × 10⁻¹ |
| R10 | OH + O3 → | HO2 + O2 | k7 | 1.75 × 10⁻³ | 1.68 × 10⁻³ |
| R11 | OH + HO2 → | H2O + O2 | k8 | 2.75 | 2.75 |
| Symbol | Value | Unit | Description |
|---|---|---|---|
| Zsfc | 0 | m | Surface height |
| Zi | 1000 | m | Boundary layer height |
| t* | 667 | s | Convective time scale |
| T0 | 298 | ºK | Surface temperature |
| 0 | 296.88 | ºK | Surface potential temperature |
| P | 101,325 | Pa | Surface pressure |
| d (=g/Cp) | 0.009764 | ºK m−1 | Environmental temperature lapse rate |
| kf | See Table 1 for reaction rate constants | ||
| j1 | See Table 1 for photolysis rate | ||
| w* | 1.5 | m∙s−1 | Convective velocity scale |
| we | 0.01 | m∙s−1 | Entrainment velocity |
| ENO | 0.1 | ppb∙m∙s−1 | Typical NO emission flux for an agricultural area at sfc |
| ERH | 1.0 | ppb∙m∙s−1 | A realistic RH emission flux at surface based on isoprene flux measurements [35] |
| Edi | we(CiCBL-CiFA) | ppb∙m∙s−1 | Downward entrance at entrainment for all species shown in Table 1 |
| kh | 64 | Non-d | Number of layers in model |
| t | 0.1 | s | Time step |
| tmax | 200 | min | Simulation run time |
| z | 15.63 | m | Non-uniform grid space of model layer |
| Mu | 0.0015 | s−1 | Upward mixing rate |
| CNOi(CNOf) | 0.138(0.0114) | ppb | Initial NO concentration in CBL (in free atmosphere(FA)) |
| CO3i(CO3f) | 68.8(50.0) | ppb | Initial O3 concentration in CBL (in FA) |
| CNO2i(CNO2f) | 0.608(0.0386) | ppb | Initial NO2 concentration in CBL (in FA) |
| CRHi(CRHf) | 3.0(0.0) | ppb | Initial RH concentration in CBL (in FA) |
| CHO2i(CHO2f) | 35.1(33.5) | ppt | Initial HO2 concentration in CBL (in FA) |
| COHi(COHf) | 0.537(0.548) | ppt | Initial OH concentration in CBL (in FA) |
| Vd_NO | 0.0002 | m∙s−1 | Dry deposition velocity of NO |
| Vd_O3 | 0.005 | m∙s−1 | Dry deposition velocity of O3 |
| Vd_NO2 | 0.005 | m∙s−1 | Dry deposition velocity of NO2 |
| Vd_RH | 0.001 | m∙s−1 | Dry deposition velocity of RH |
| Vd_HO2 | 0.01 | m∙s−1 | Dry deposition velocity of HO2 |
| Vd_OH | 0.01 | m∙s−1 | Dry deposition velocity of OH |
| Vd_HNO3 | 0.04 | m∙s−1 | Dry deposition velocity of HNO3 |
| Vd_H2O2 | 0.01 | m∙s−1 | Dry deposition velocity of H2O2 |
| Model | BMch | BM | CKM | TKM |
|---|---|---|---|---|
| Conditions | All the same conditions described in Table 2 (no emission source in BMch; only depending upon initial concentrations and photochemistry of species) | |||
| Deposition term | No | Concentration in BM | Concentration at lowest model layer (surface layer) | |
| Vertical Diffusion term | No | No | Asymmetric Convective Model (ACM): vertical mixing scheme | |
| Chemical Kinetics term: for Irreversible Reaction | Mean reaction rate | Effective reaction rate Using Concentration Splitting Method (CSM) with segregation coefficient Is,AB in Equation (4) | ||
| Molecular Timescale sec | Factor f | Reaction Rate Constants | NO Emission ppb∙m∙s−1 | RH Emission ppb∙m∙s−1 | Exchange Vel. at TL m∙s−1 | ||||||||||||
|---|---|---|---|---|---|---|---|---|---|---|---|---|---|---|---|---|---|
| 100 | 294 | 500 | 100 | 200 | 300 | S90 | CB-IV | 0.01 | 0.1 | 1.0 | 0.1 | 1.0 | 10. | 0.0 | 0.01 | 0.03 | |
| ref | × | × | × | × | × | × | |||||||||||
| s1 | × | × | × | × | × | × | |||||||||||
| s2 | × | × | × | × | × | × | |||||||||||
| s3 | × | × | × | × | × | × | |||||||||||
| s4 | × | × | × | × | × | × | |||||||||||
| s5 | × | × | × | × | × | × | |||||||||||
| s6 | × | × | × | × | × | × | |||||||||||
| s7 | × | × | × | × | × | × | |||||||||||
| s8 | × | × | × | × | × | × | |||||||||||
| s9 | × | × | × | × | × | × | |||||||||||
| s10 | × | × | × | × | × | × | |||||||||||
| s11 | × | × | × | × | × | × | |||||||||||
© 2019 by the author. Licensee MDPI, Basel, Switzerland. This article is an open access article distributed under the terms and conditions of the Creative Commons Attribution (CC BY) license (http://creativecommons.org/licenses/by/4.0/).
Share and Cite
Kim, M.-S. Simulation of Turbulent Mixing Effects on Essential NOx–O3–Hydrocarbon Photochemistry in Convective Boundary Layer. Appl. Sci. 2019, 9, 357. https://doi.org/10.3390/app9020357
Kim M-S. Simulation of Turbulent Mixing Effects on Essential NOx–O3–Hydrocarbon Photochemistry in Convective Boundary Layer. Applied Sciences. 2019; 9(2):357. https://doi.org/10.3390/app9020357
Chicago/Turabian StyleKim, Mi-Sug. 2019. "Simulation of Turbulent Mixing Effects on Essential NOx–O3–Hydrocarbon Photochemistry in Convective Boundary Layer" Applied Sciences 9, no. 2: 357. https://doi.org/10.3390/app9020357
APA StyleKim, M.-S. (2019). Simulation of Turbulent Mixing Effects on Essential NOx–O3–Hydrocarbon Photochemistry in Convective Boundary Layer. Applied Sciences, 9(2), 357. https://doi.org/10.3390/app9020357


