Clutter Elimination and Harmonic Suppression of Non-Stationary Life Signs for Long-Range and Through-Wall Human Subject Detection Using Spectral Kurtosis Analysis (SKA)-Based Windowed Fourier Transform (WFT) Method


Abstract
:1. Introduction
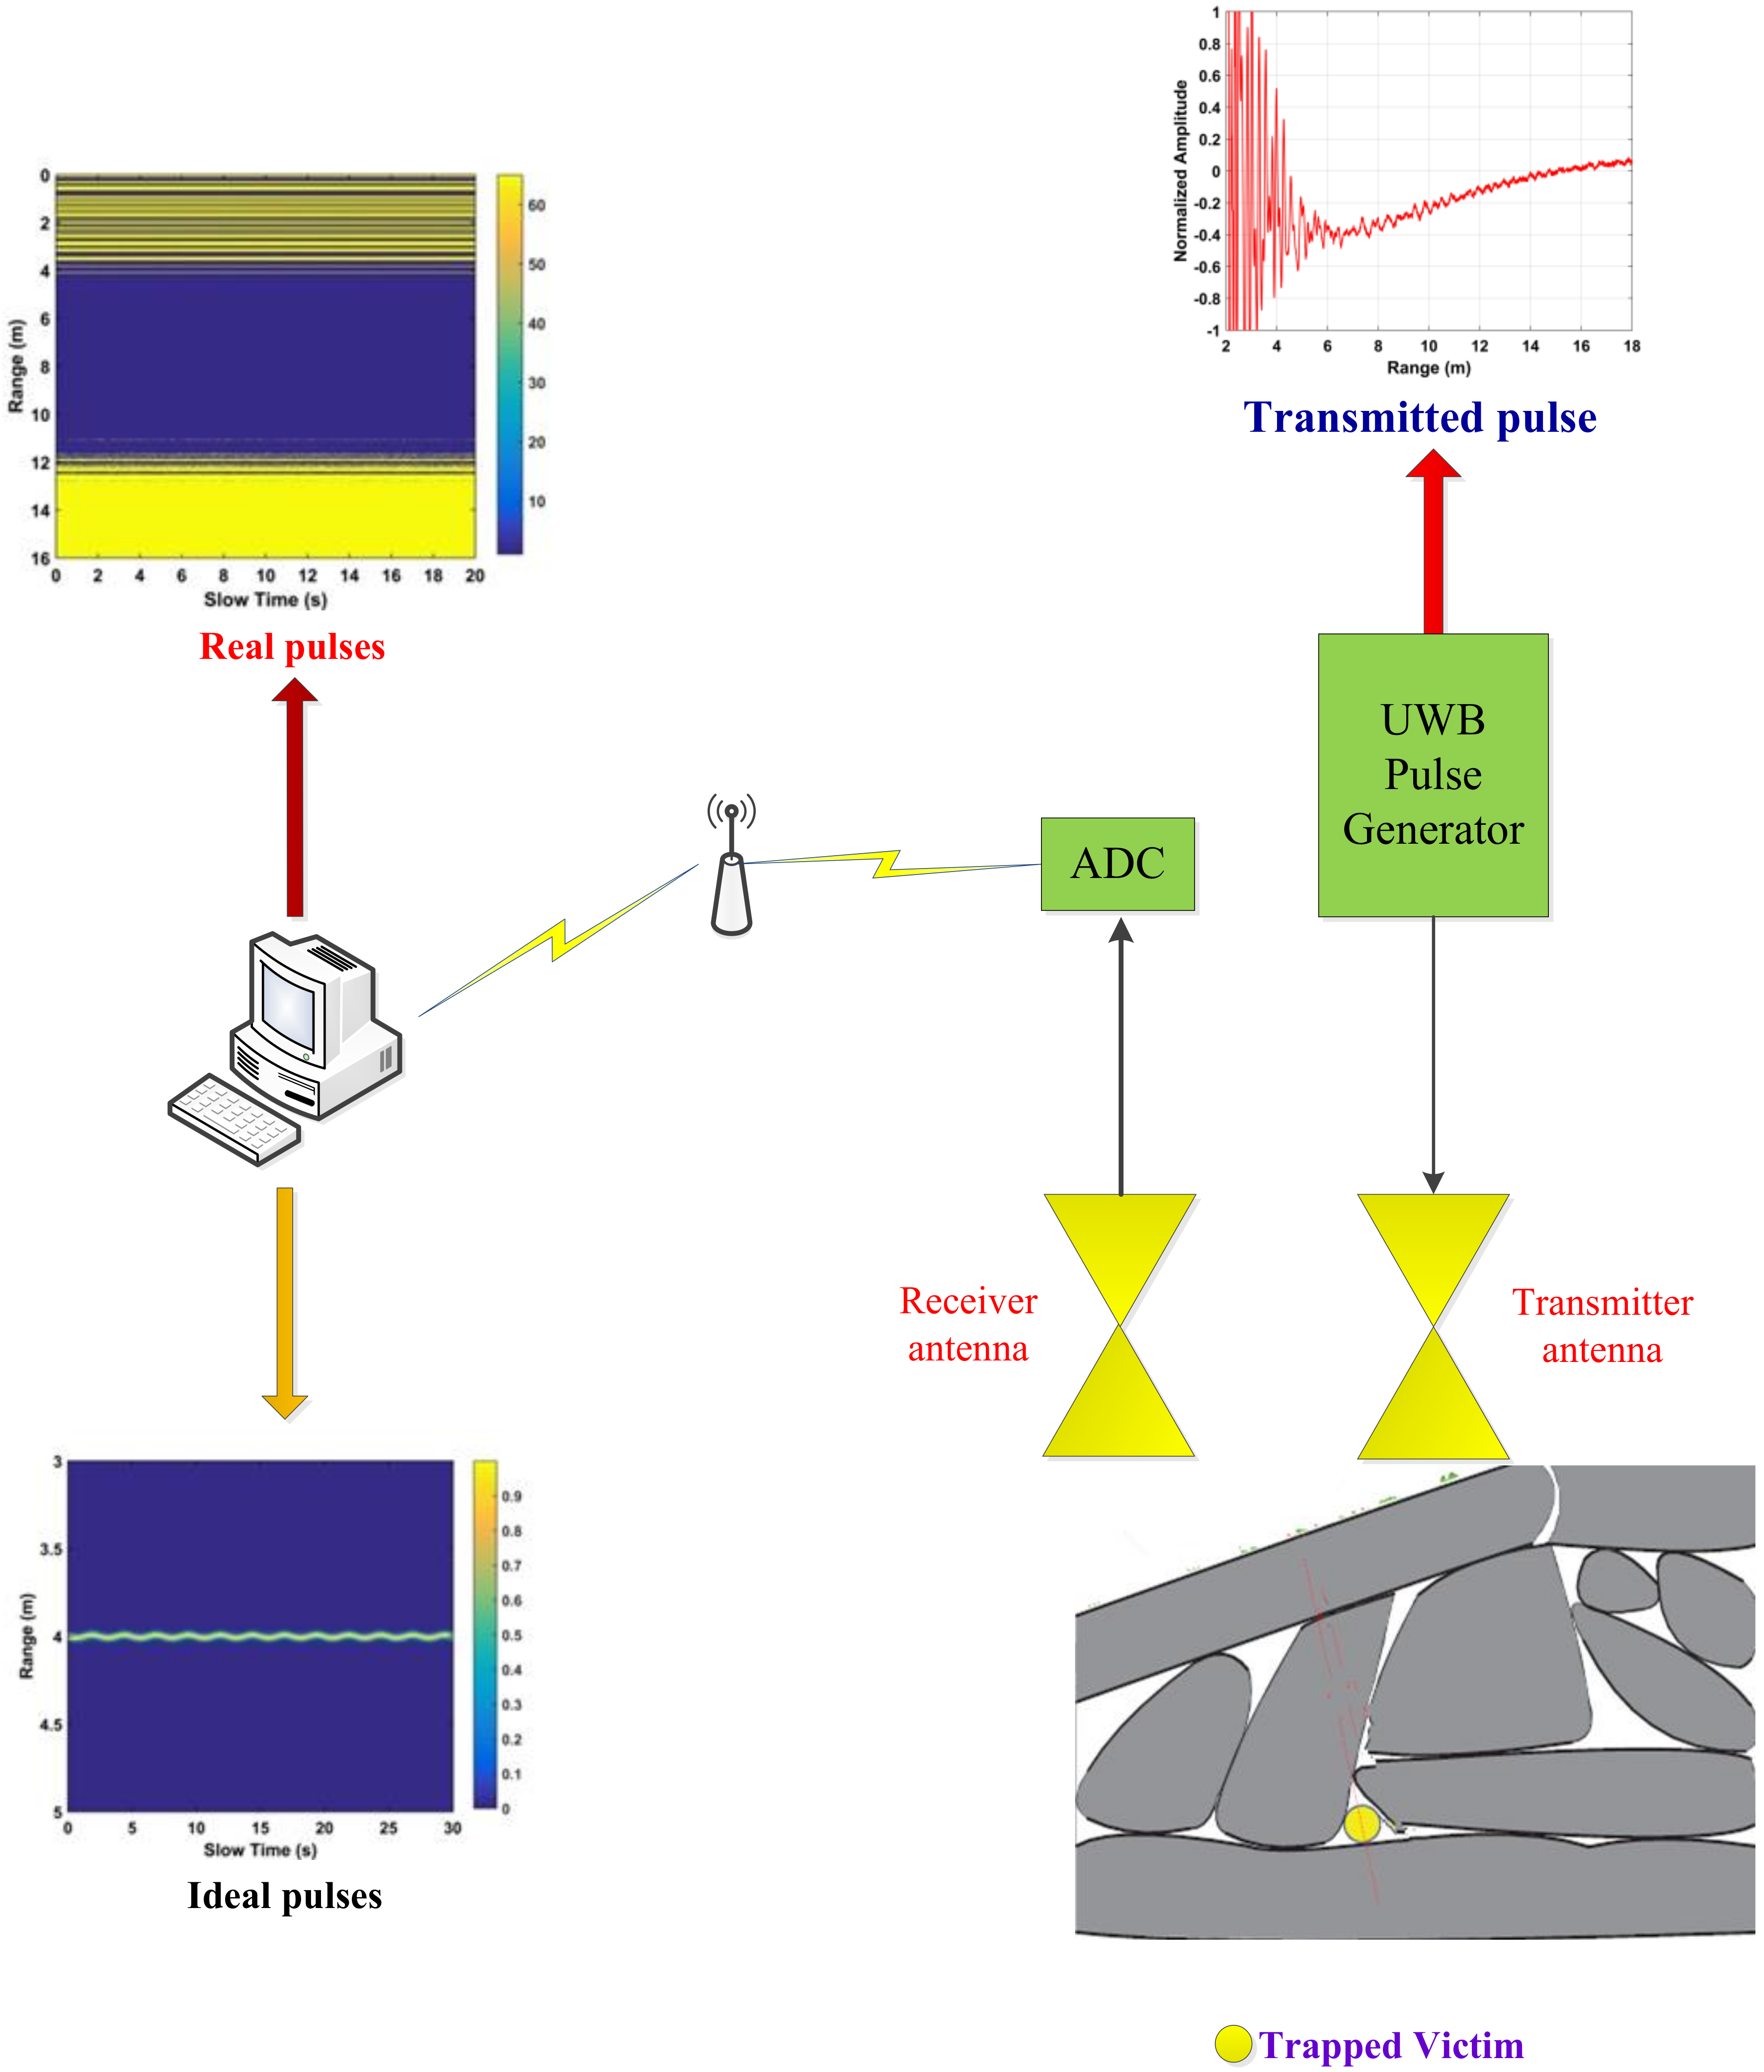
2. System Model
UWB Impulse Radar
3. Respiration Detection
3.1. Static Clutter and Linear Trend Suppression
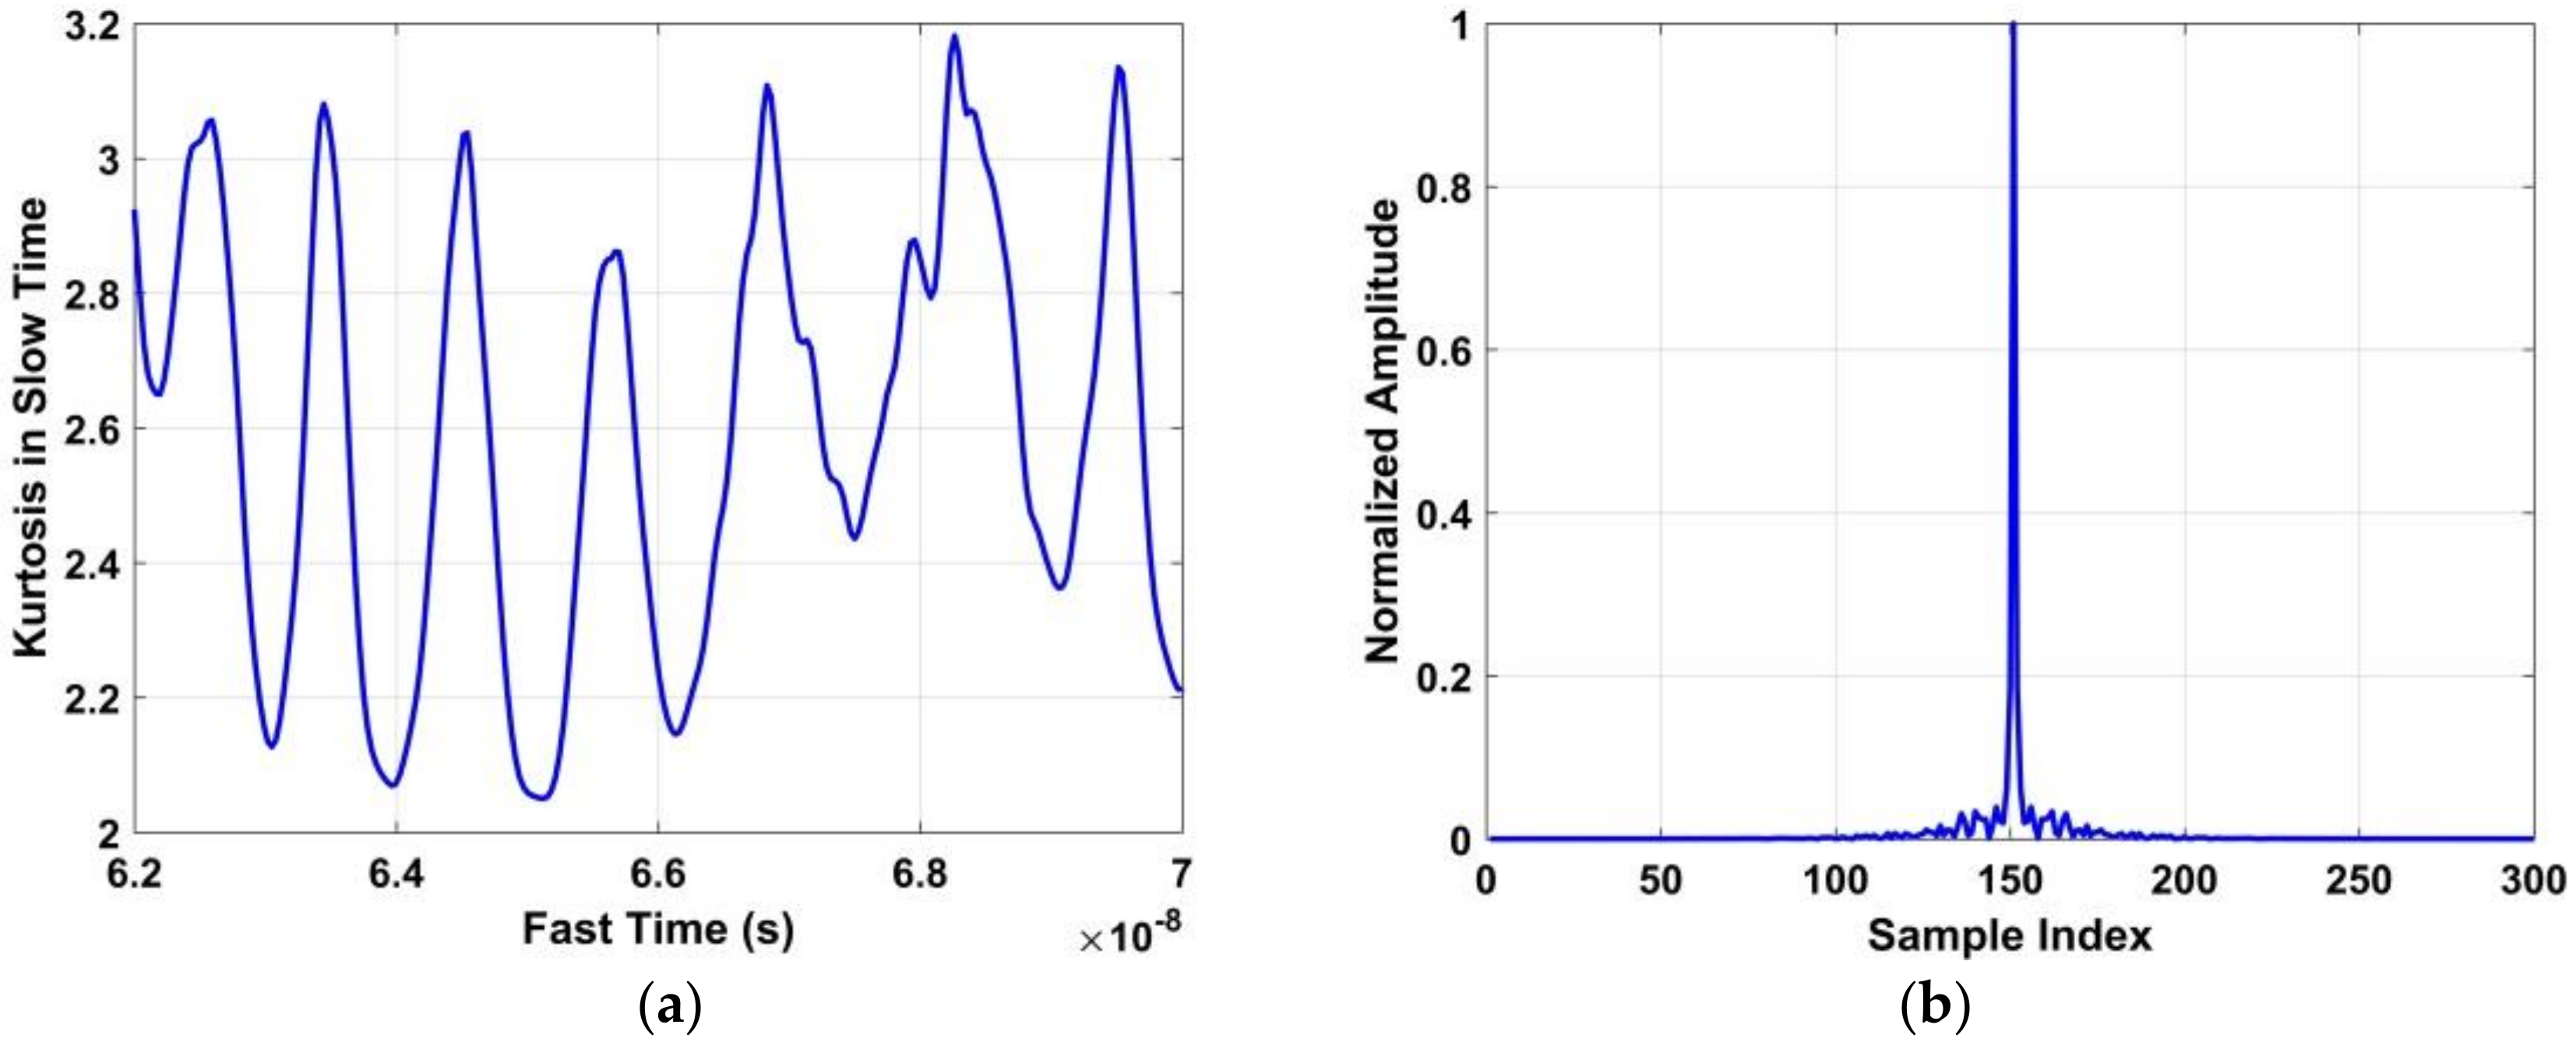
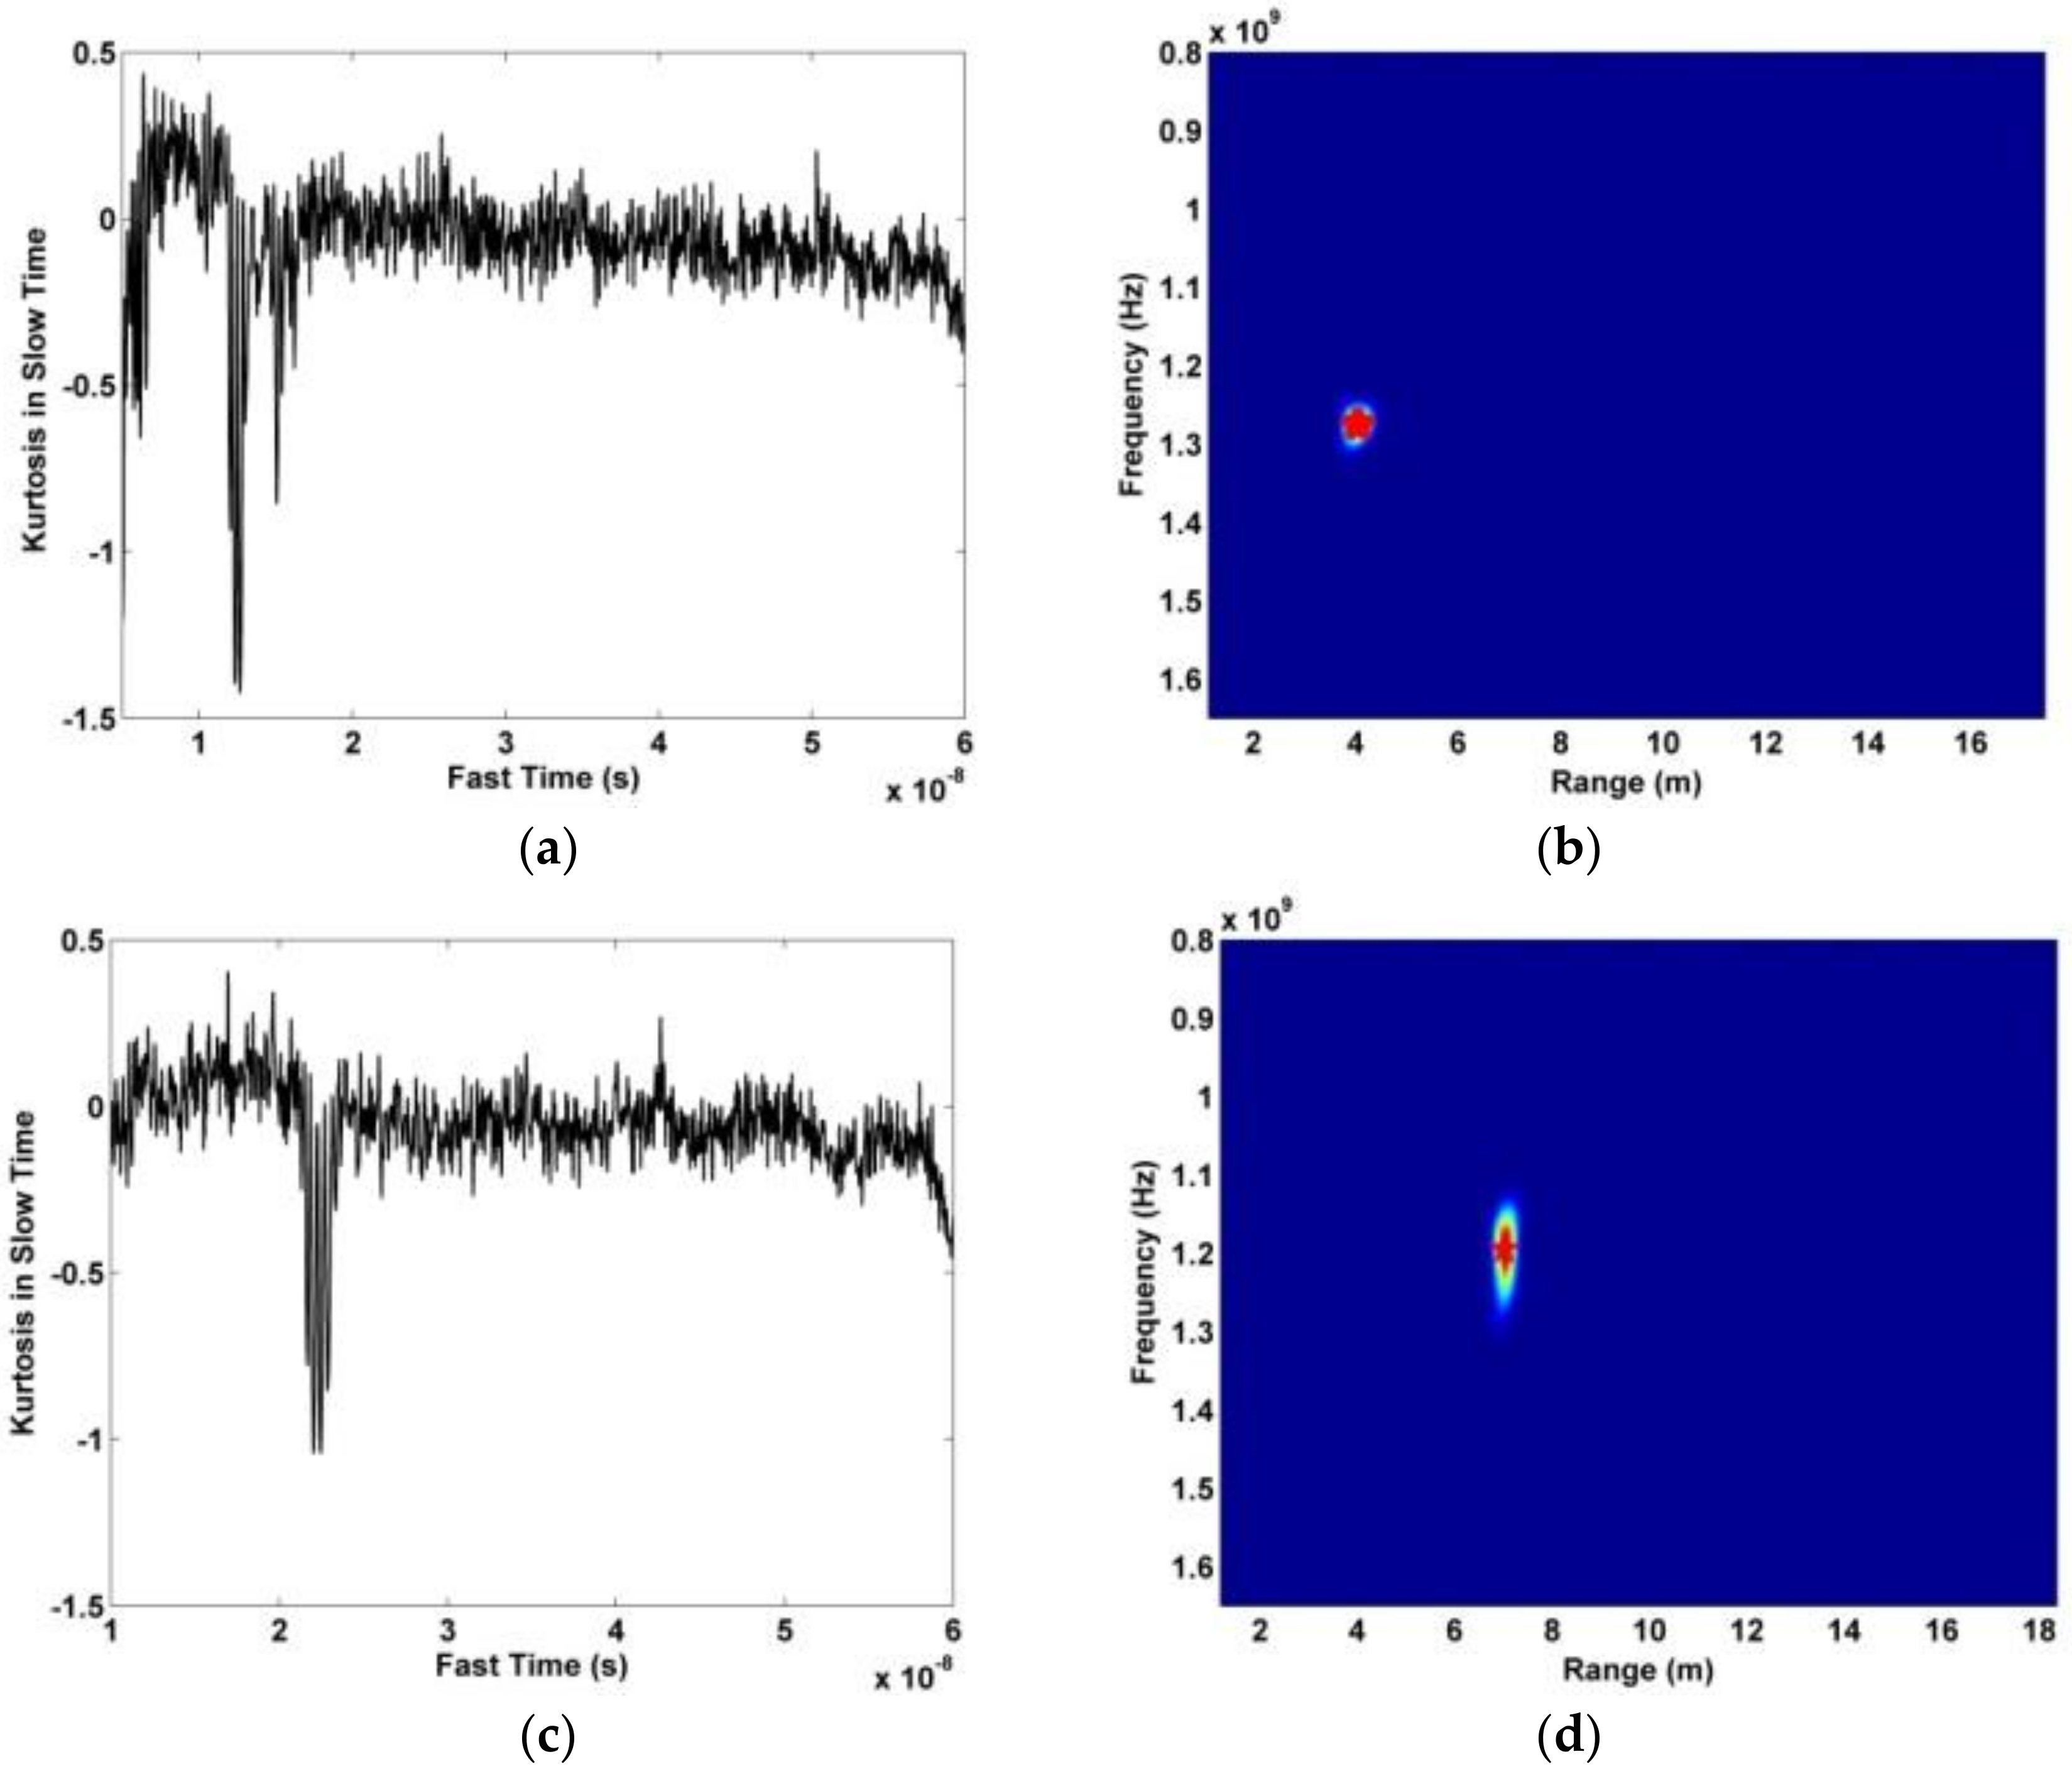
3.2. SNR Improvement
3.3. Respiration Signal Improvement
3.4. Windowed Fourier Transform
4. Detection Performance and Discussion
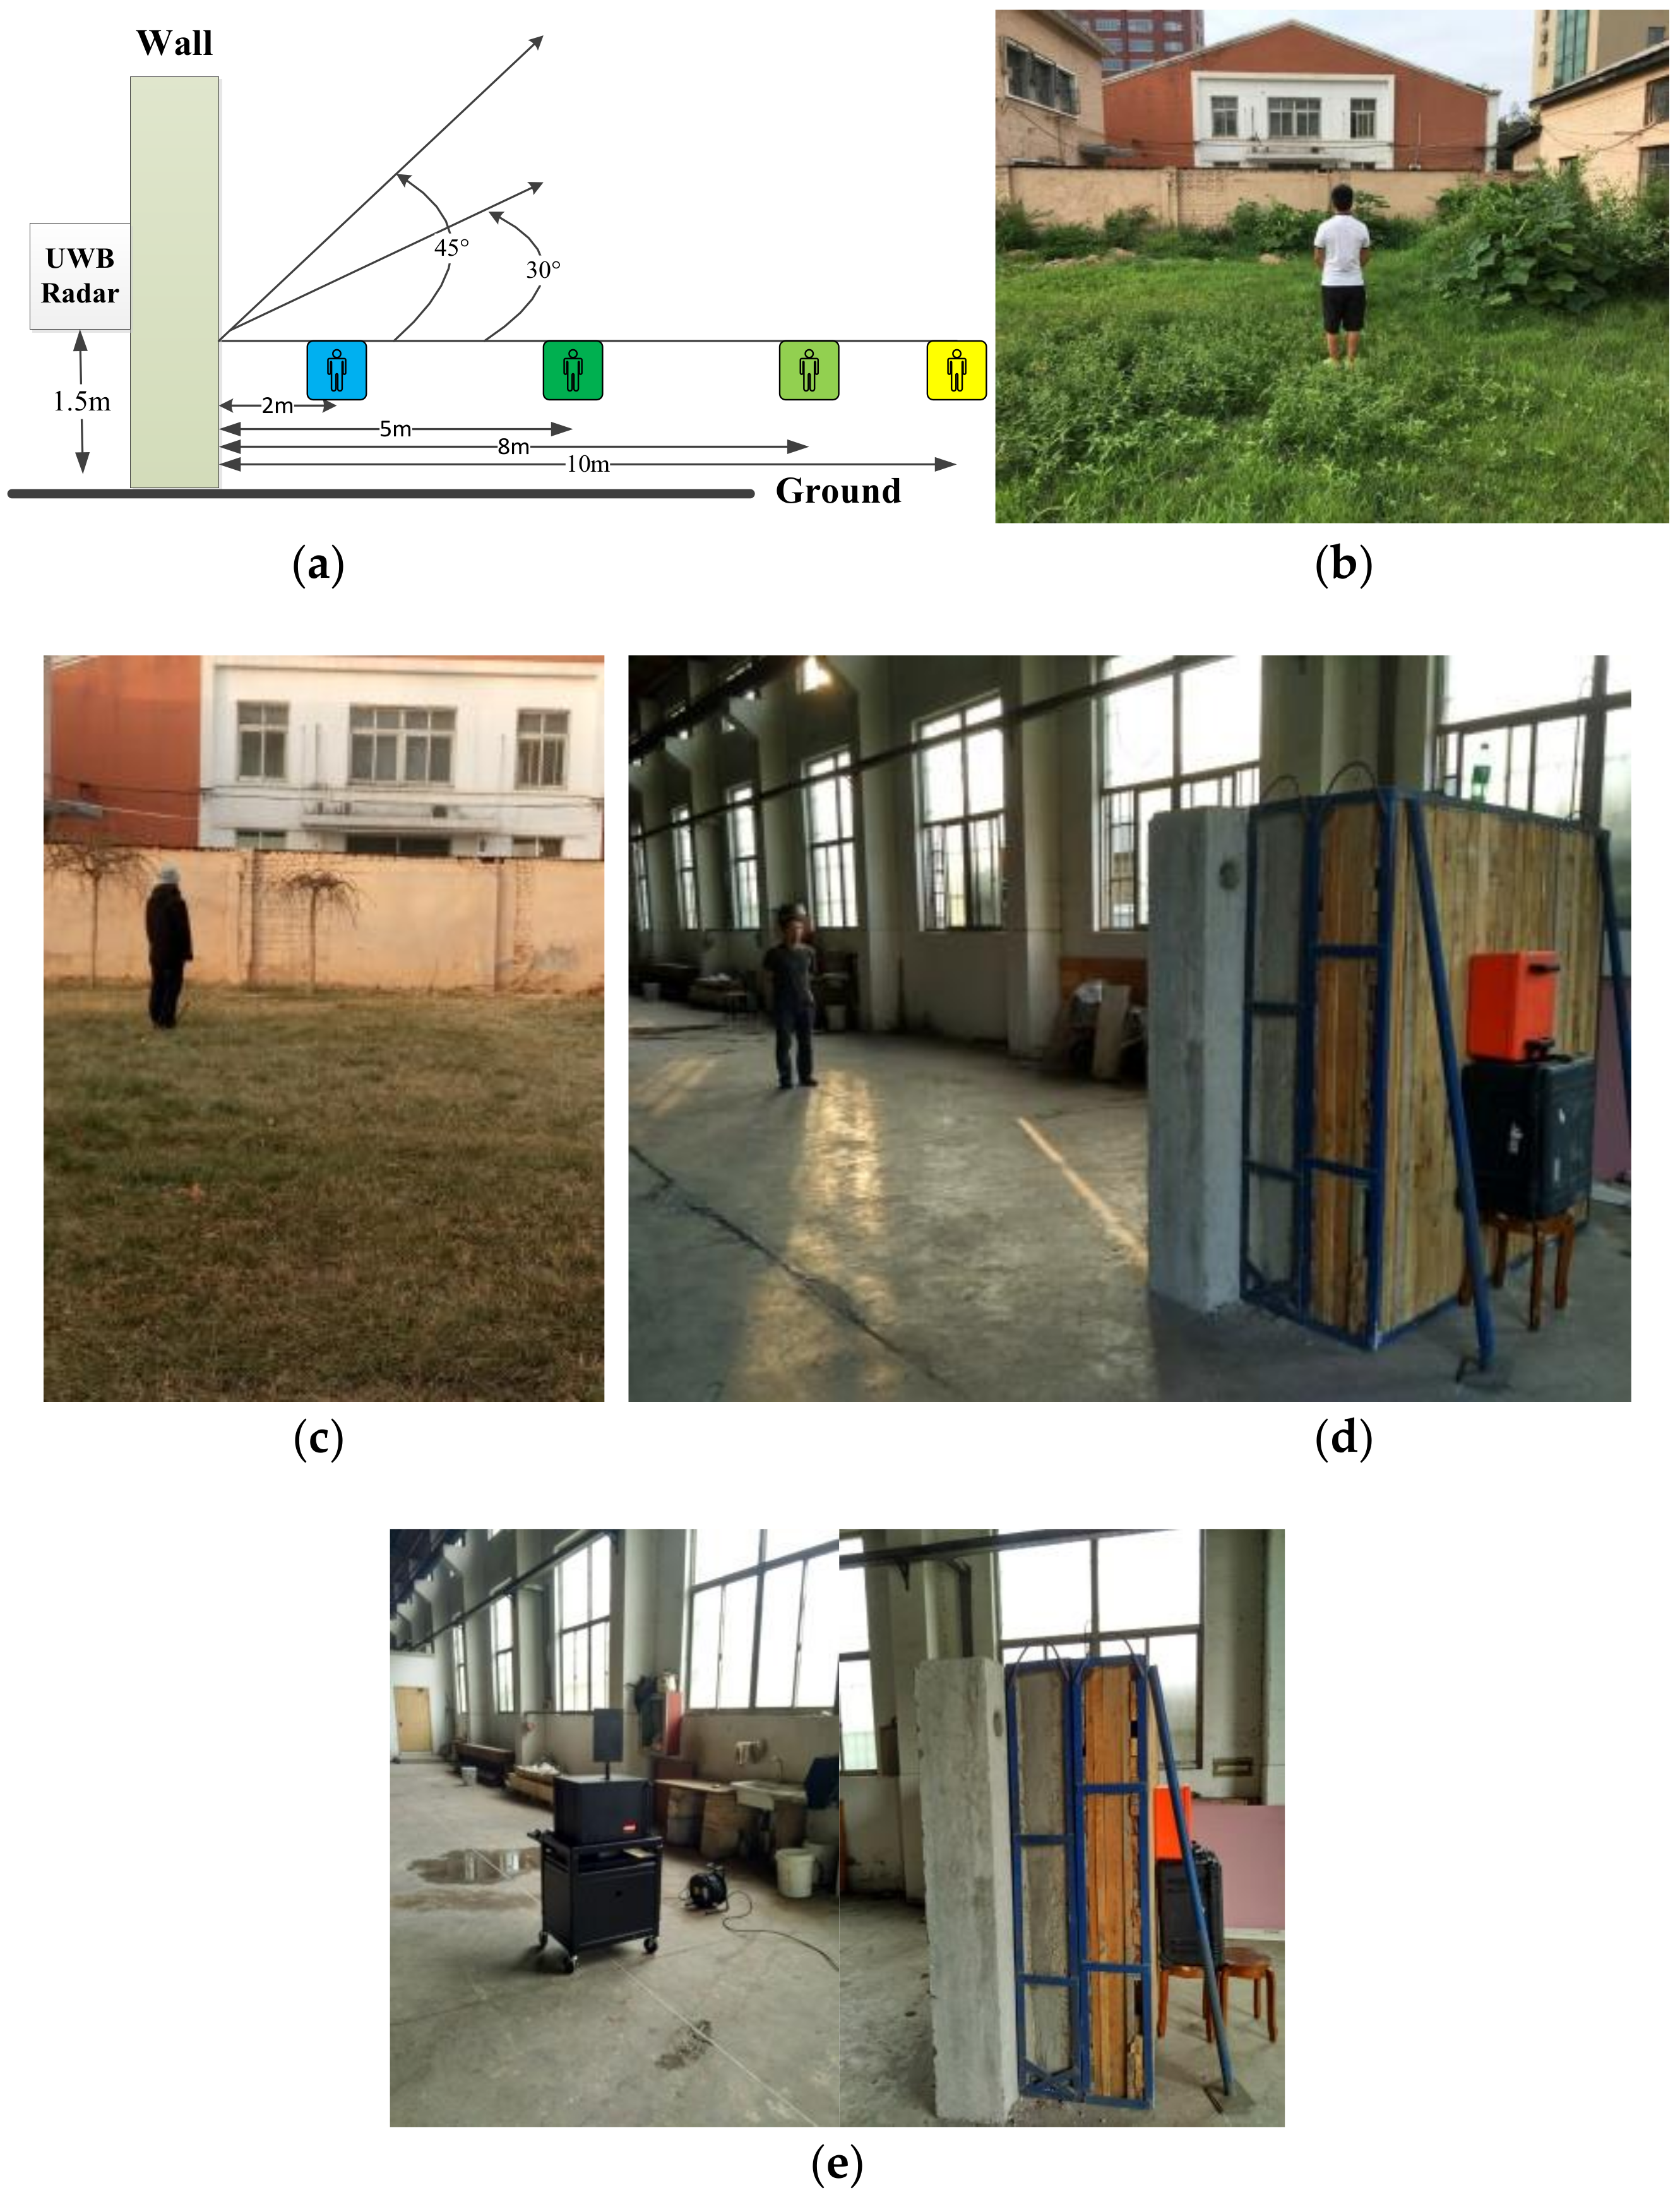
4.1. Experimental Setup
4.2. Initial Detection Performance
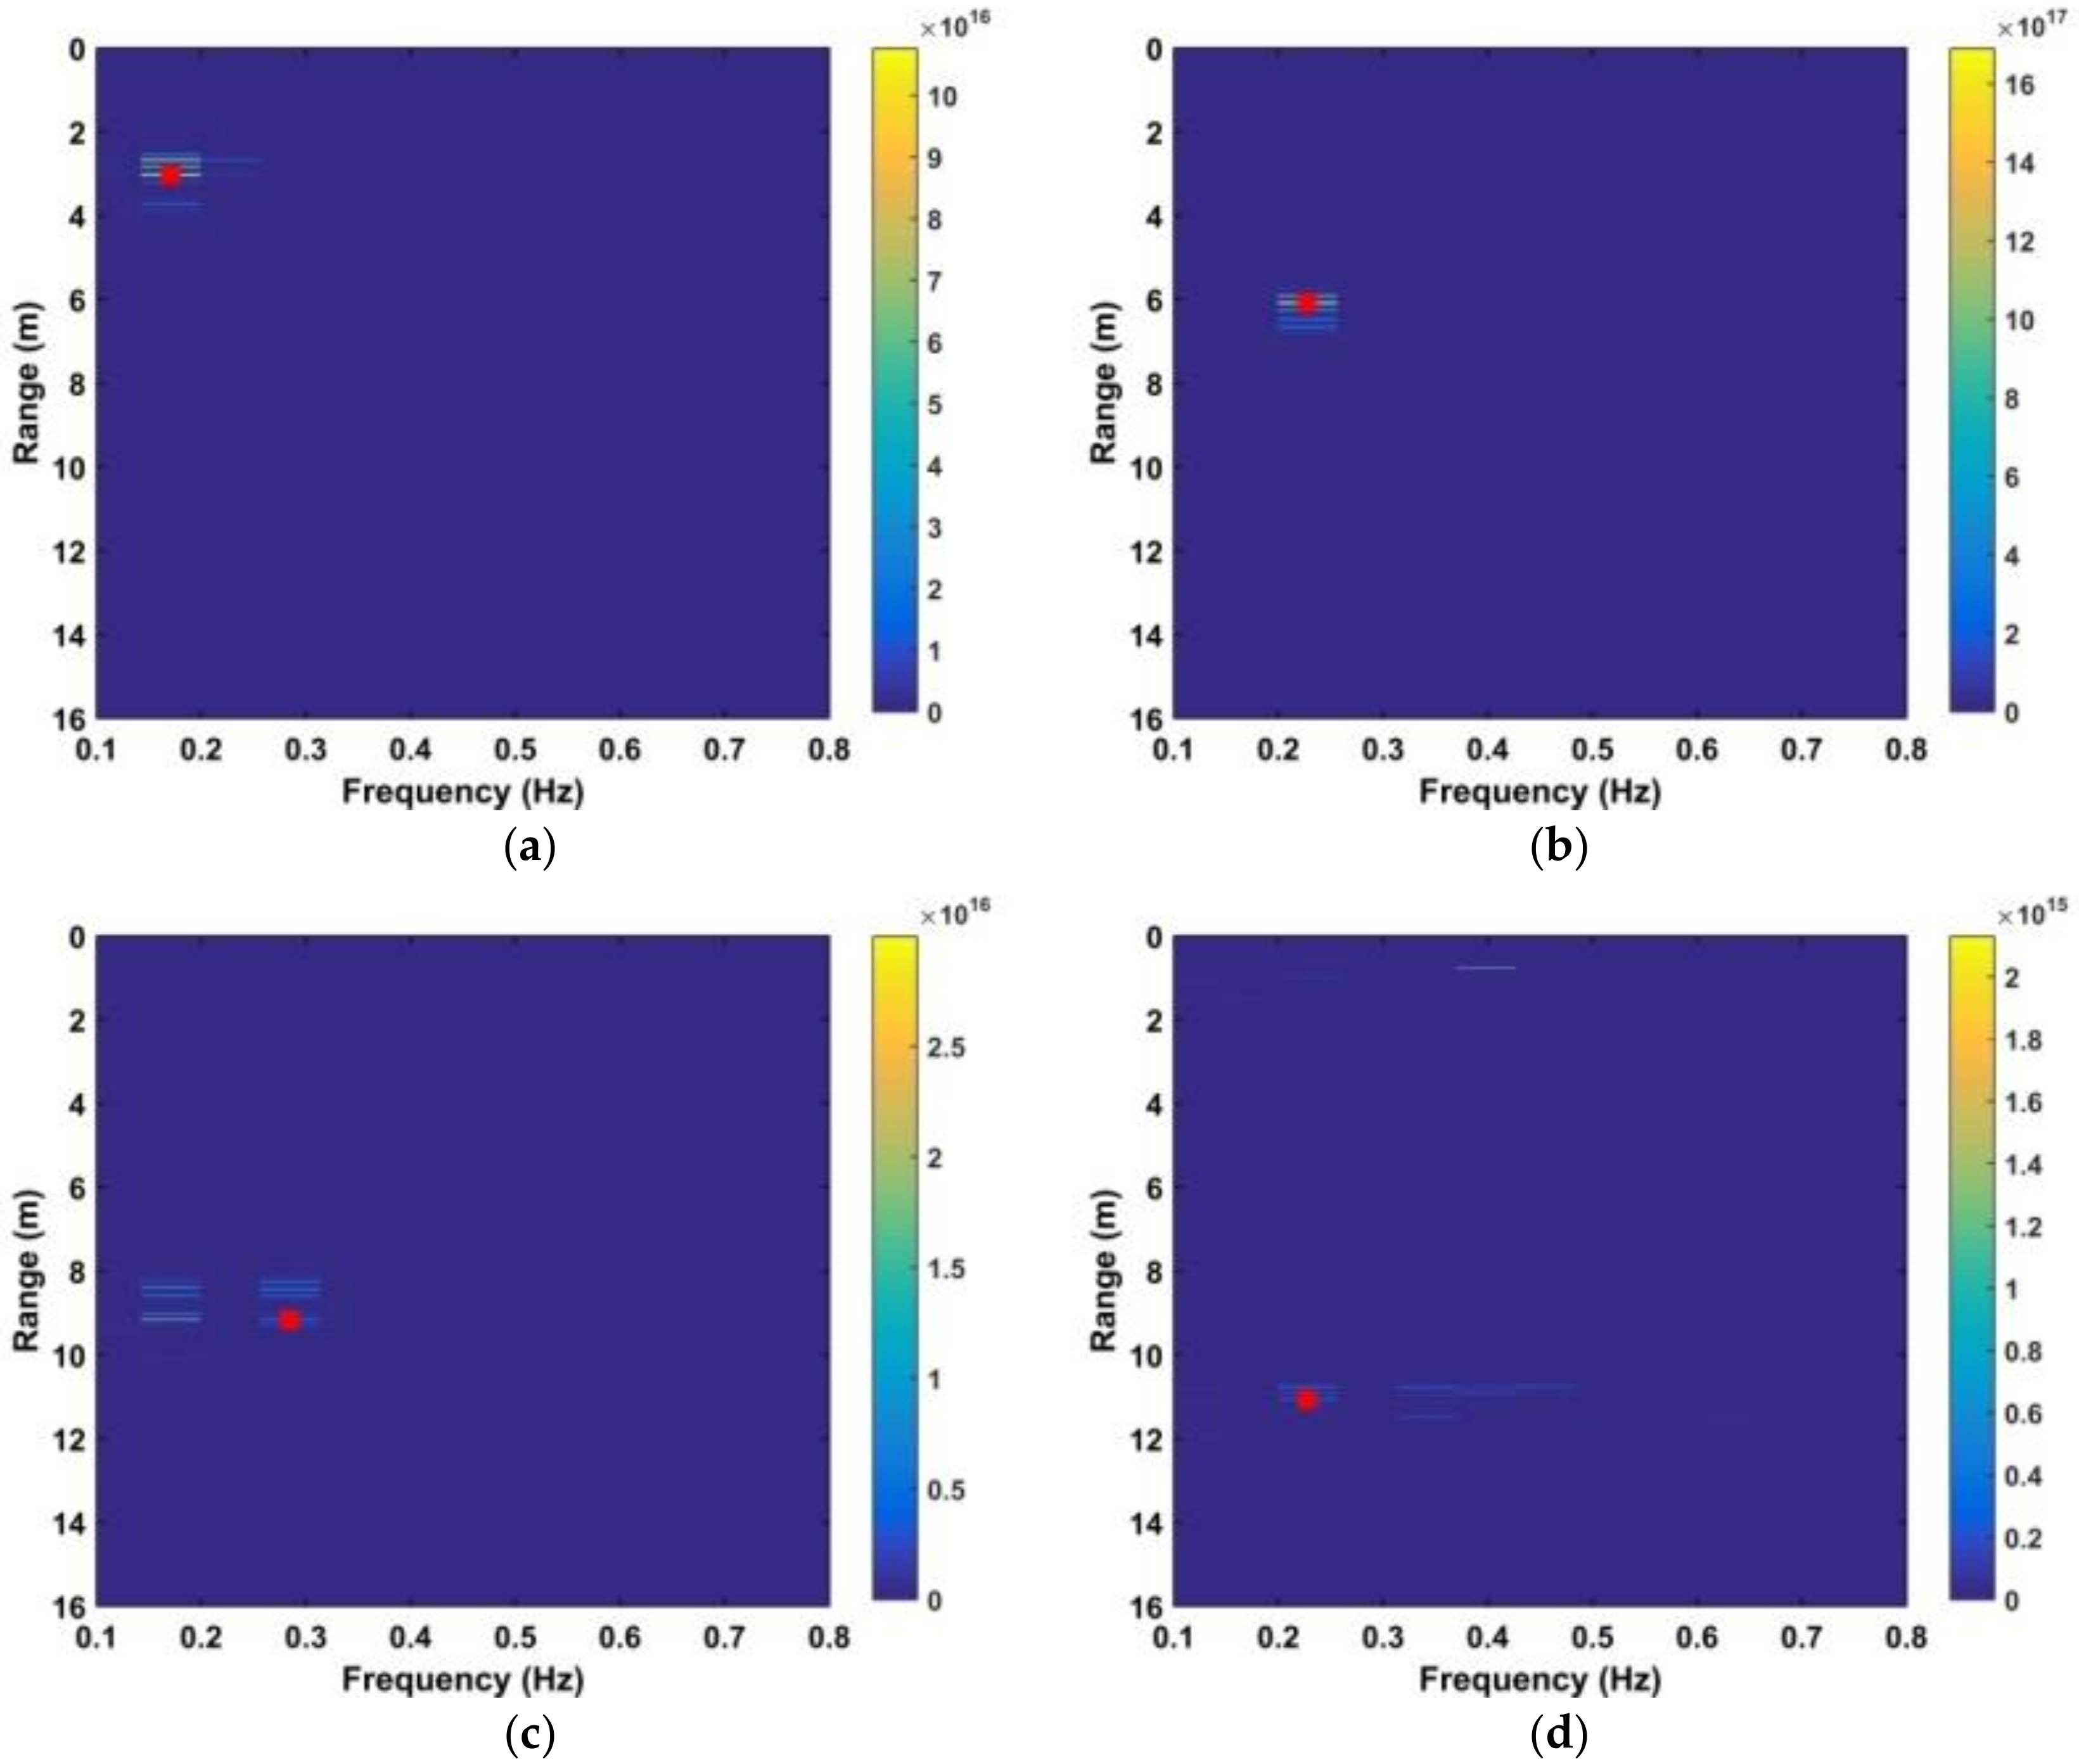
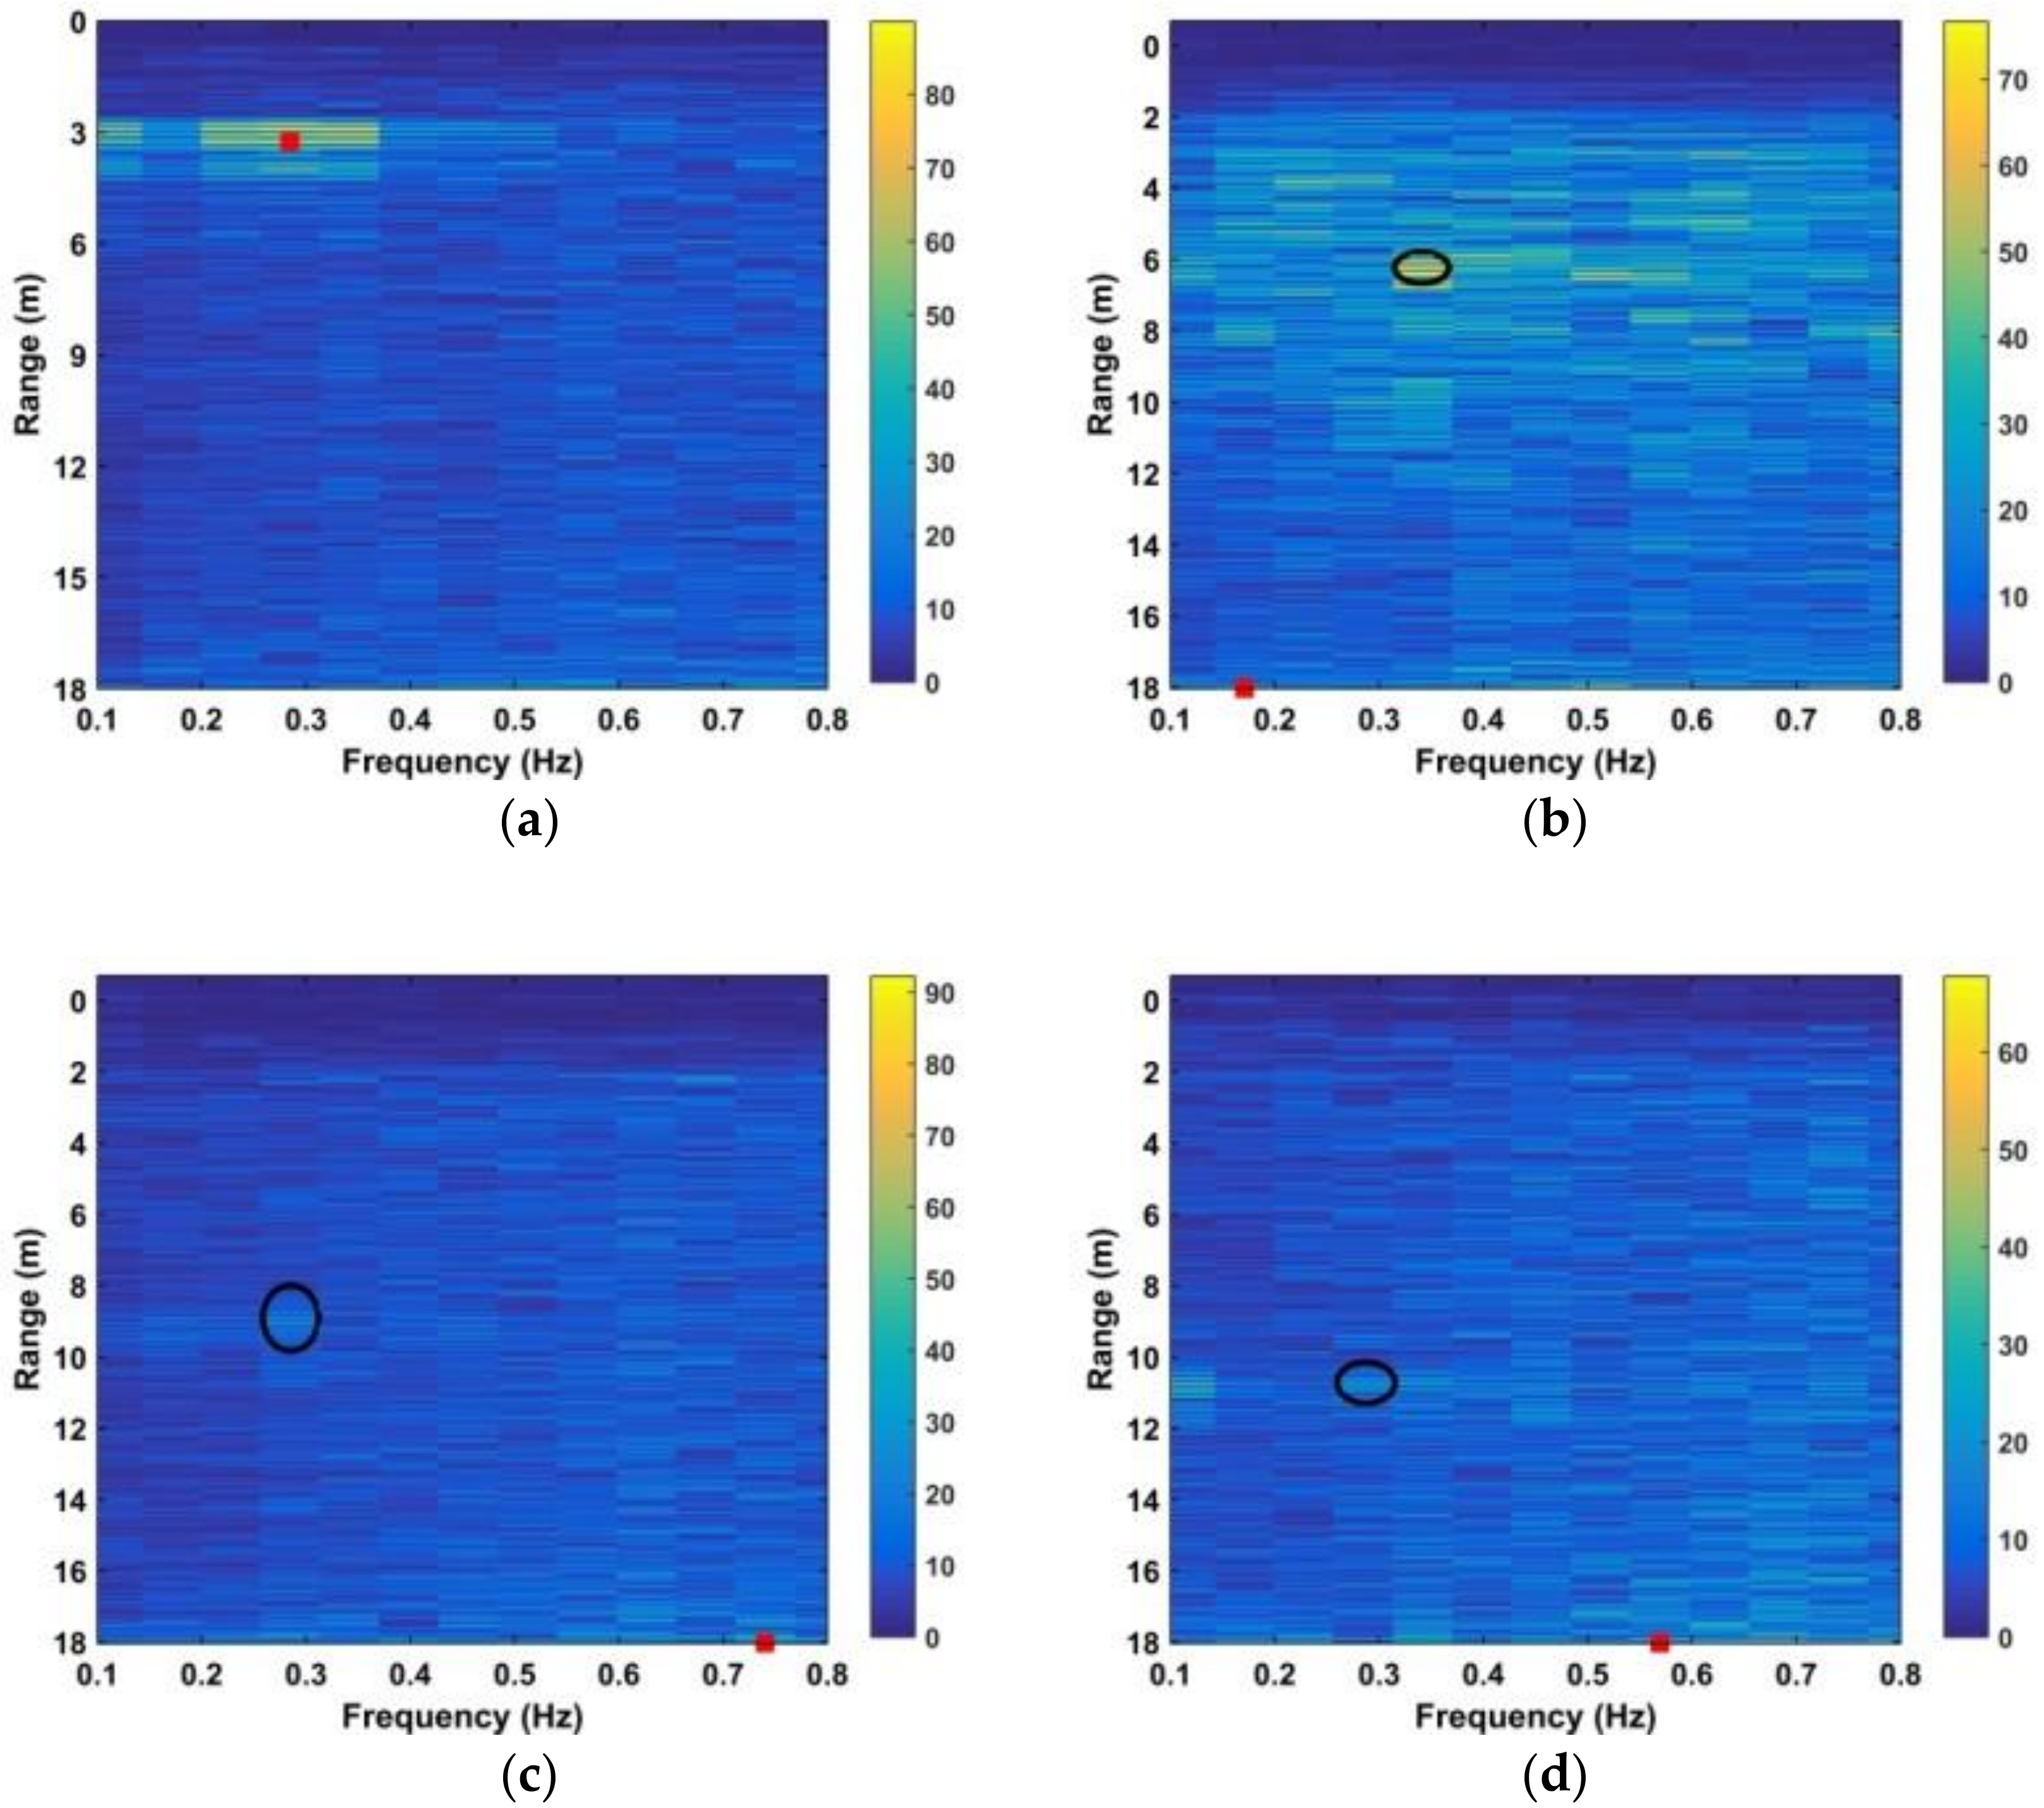
4.3. Detection Performance
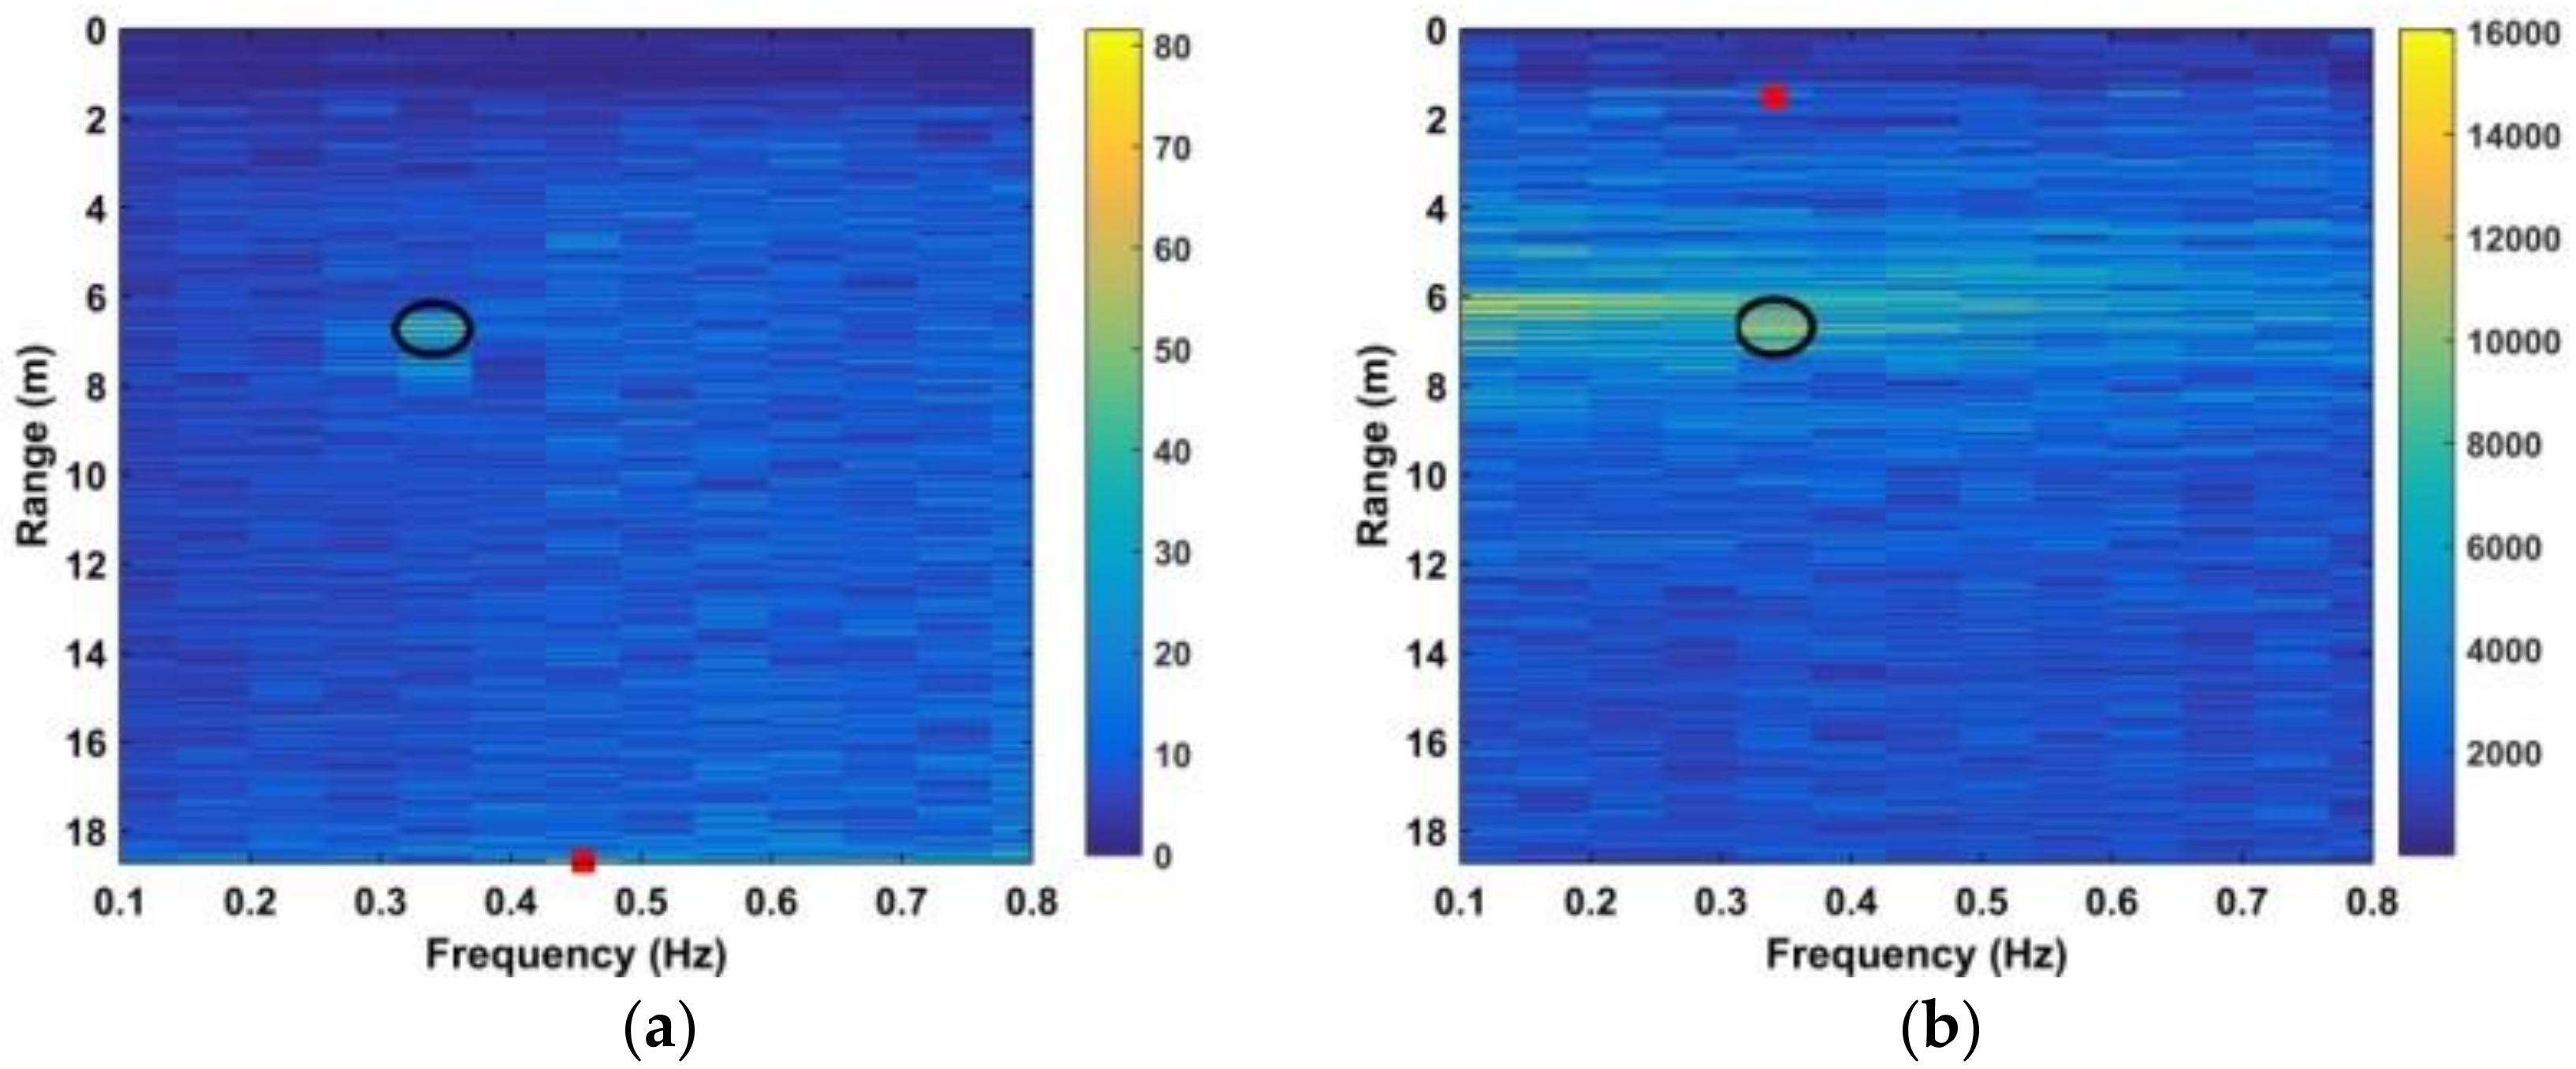
4.4. Interference Suppression
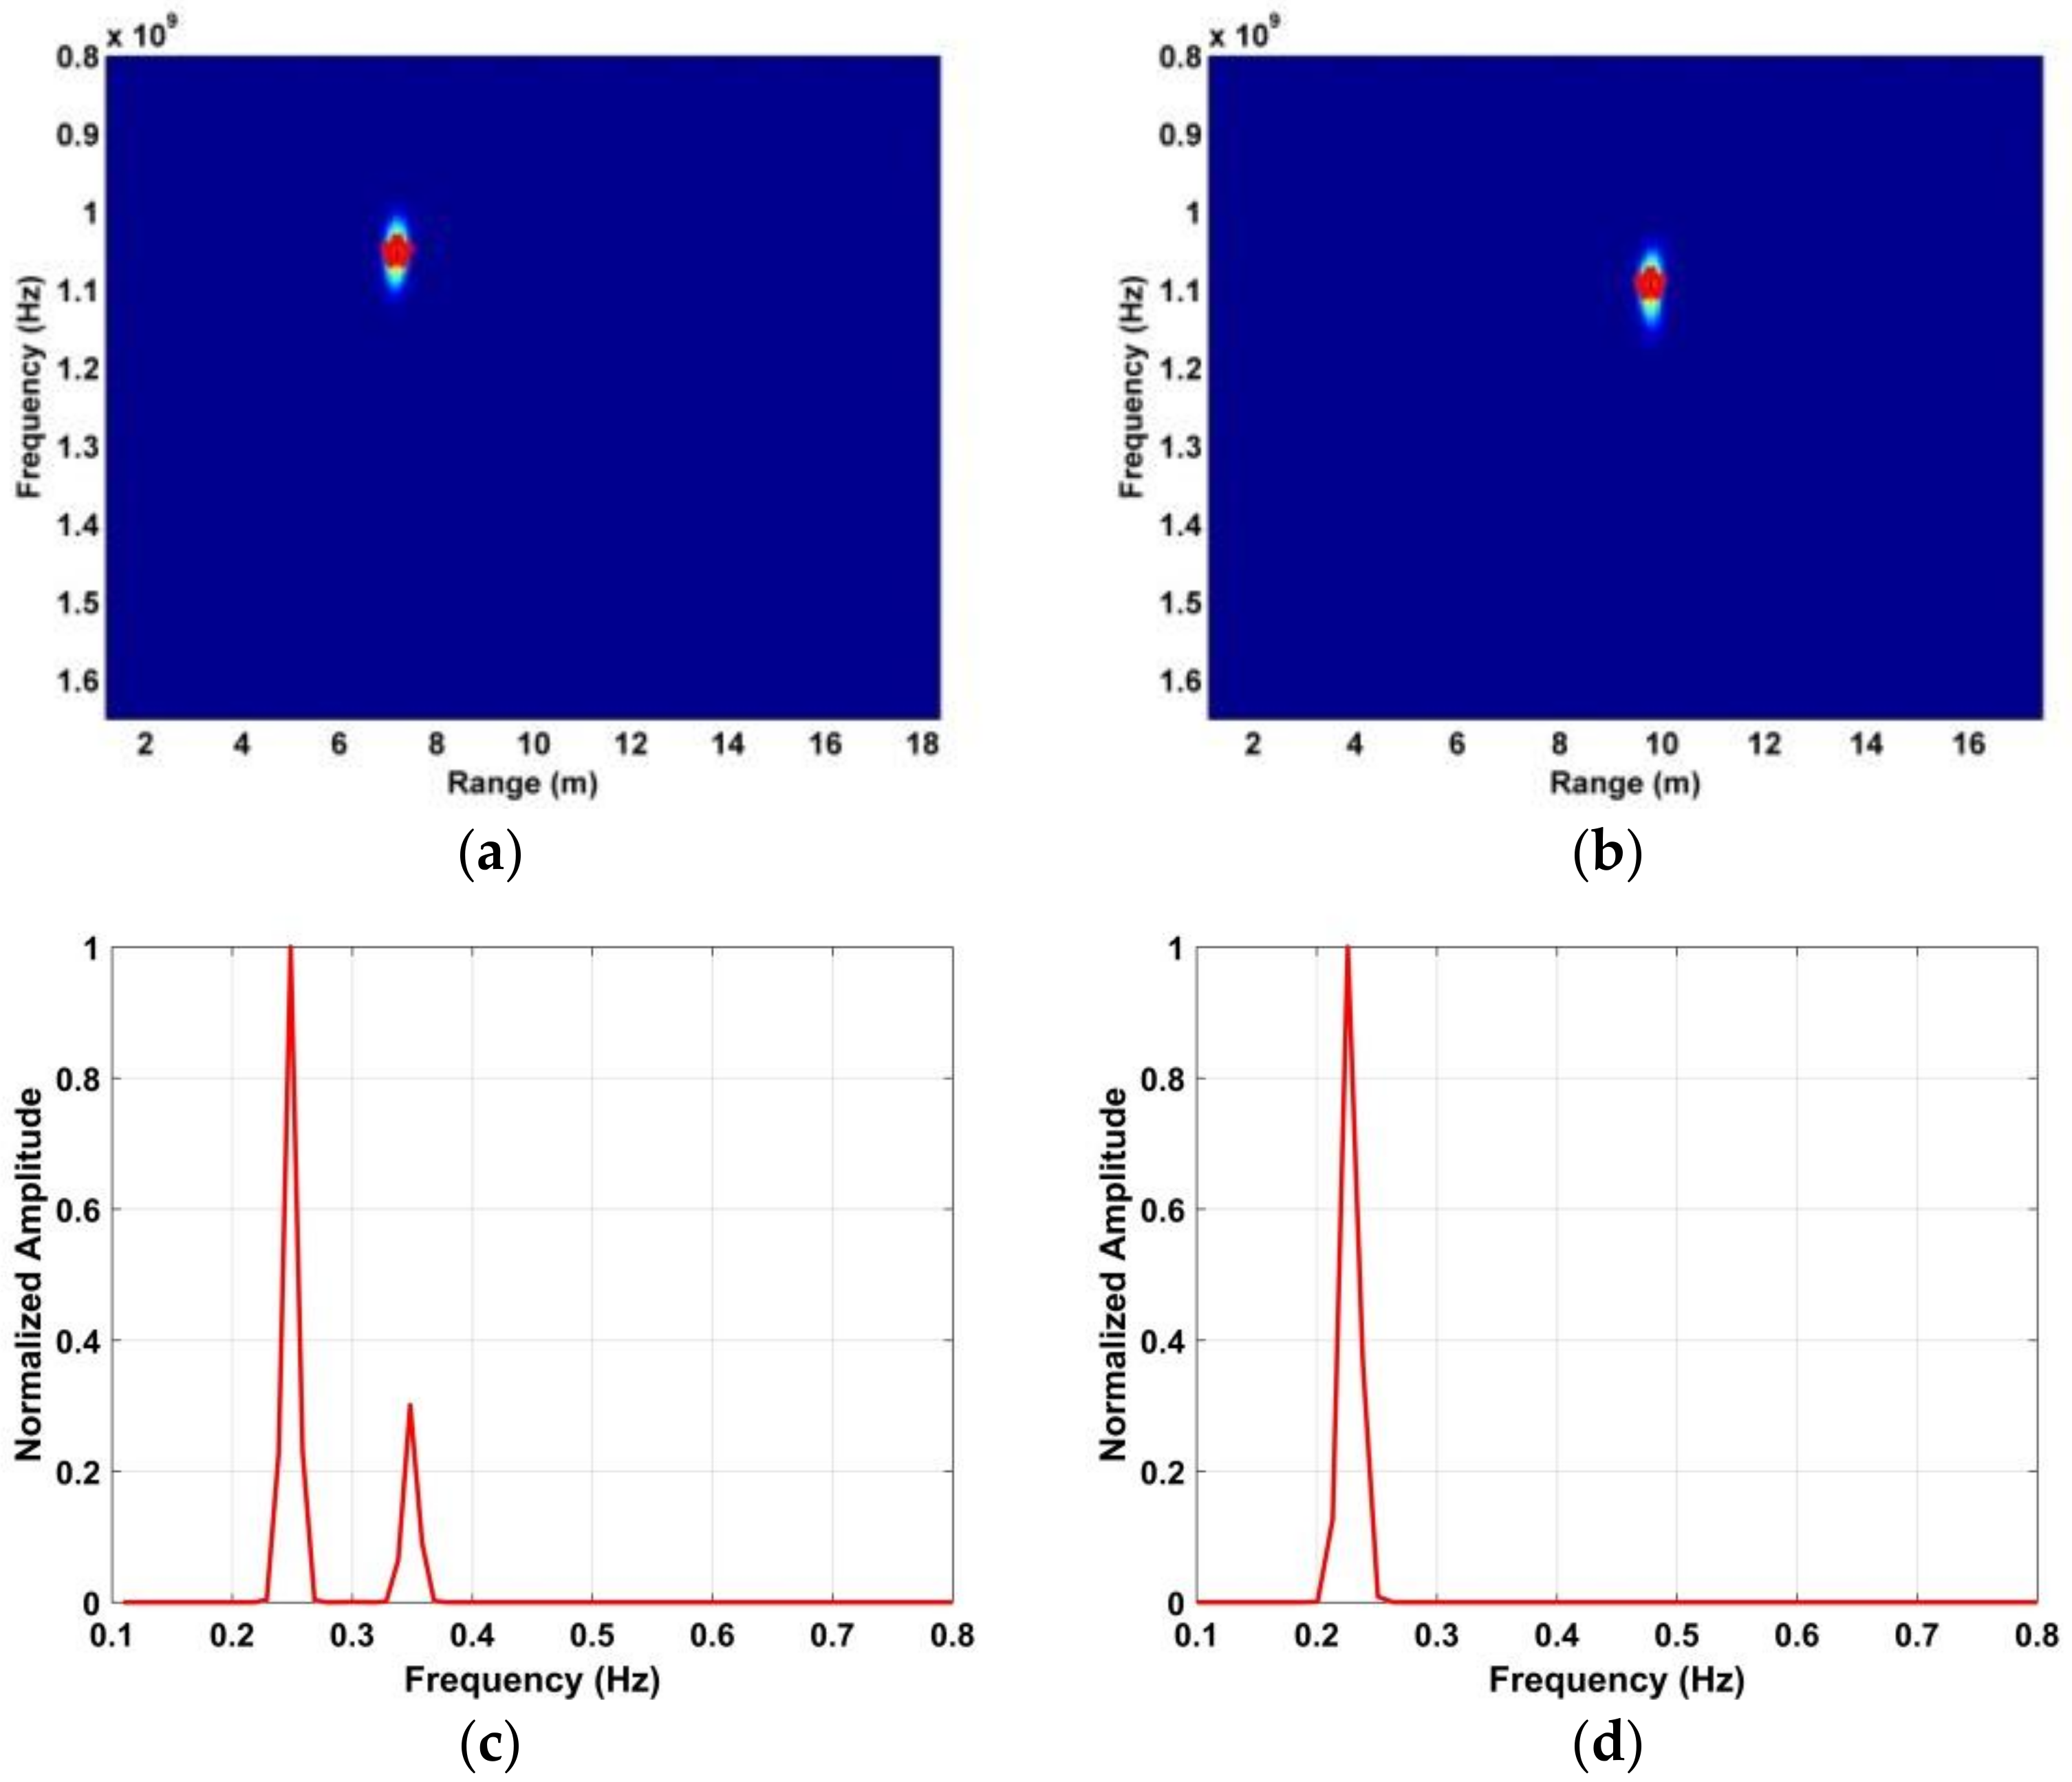
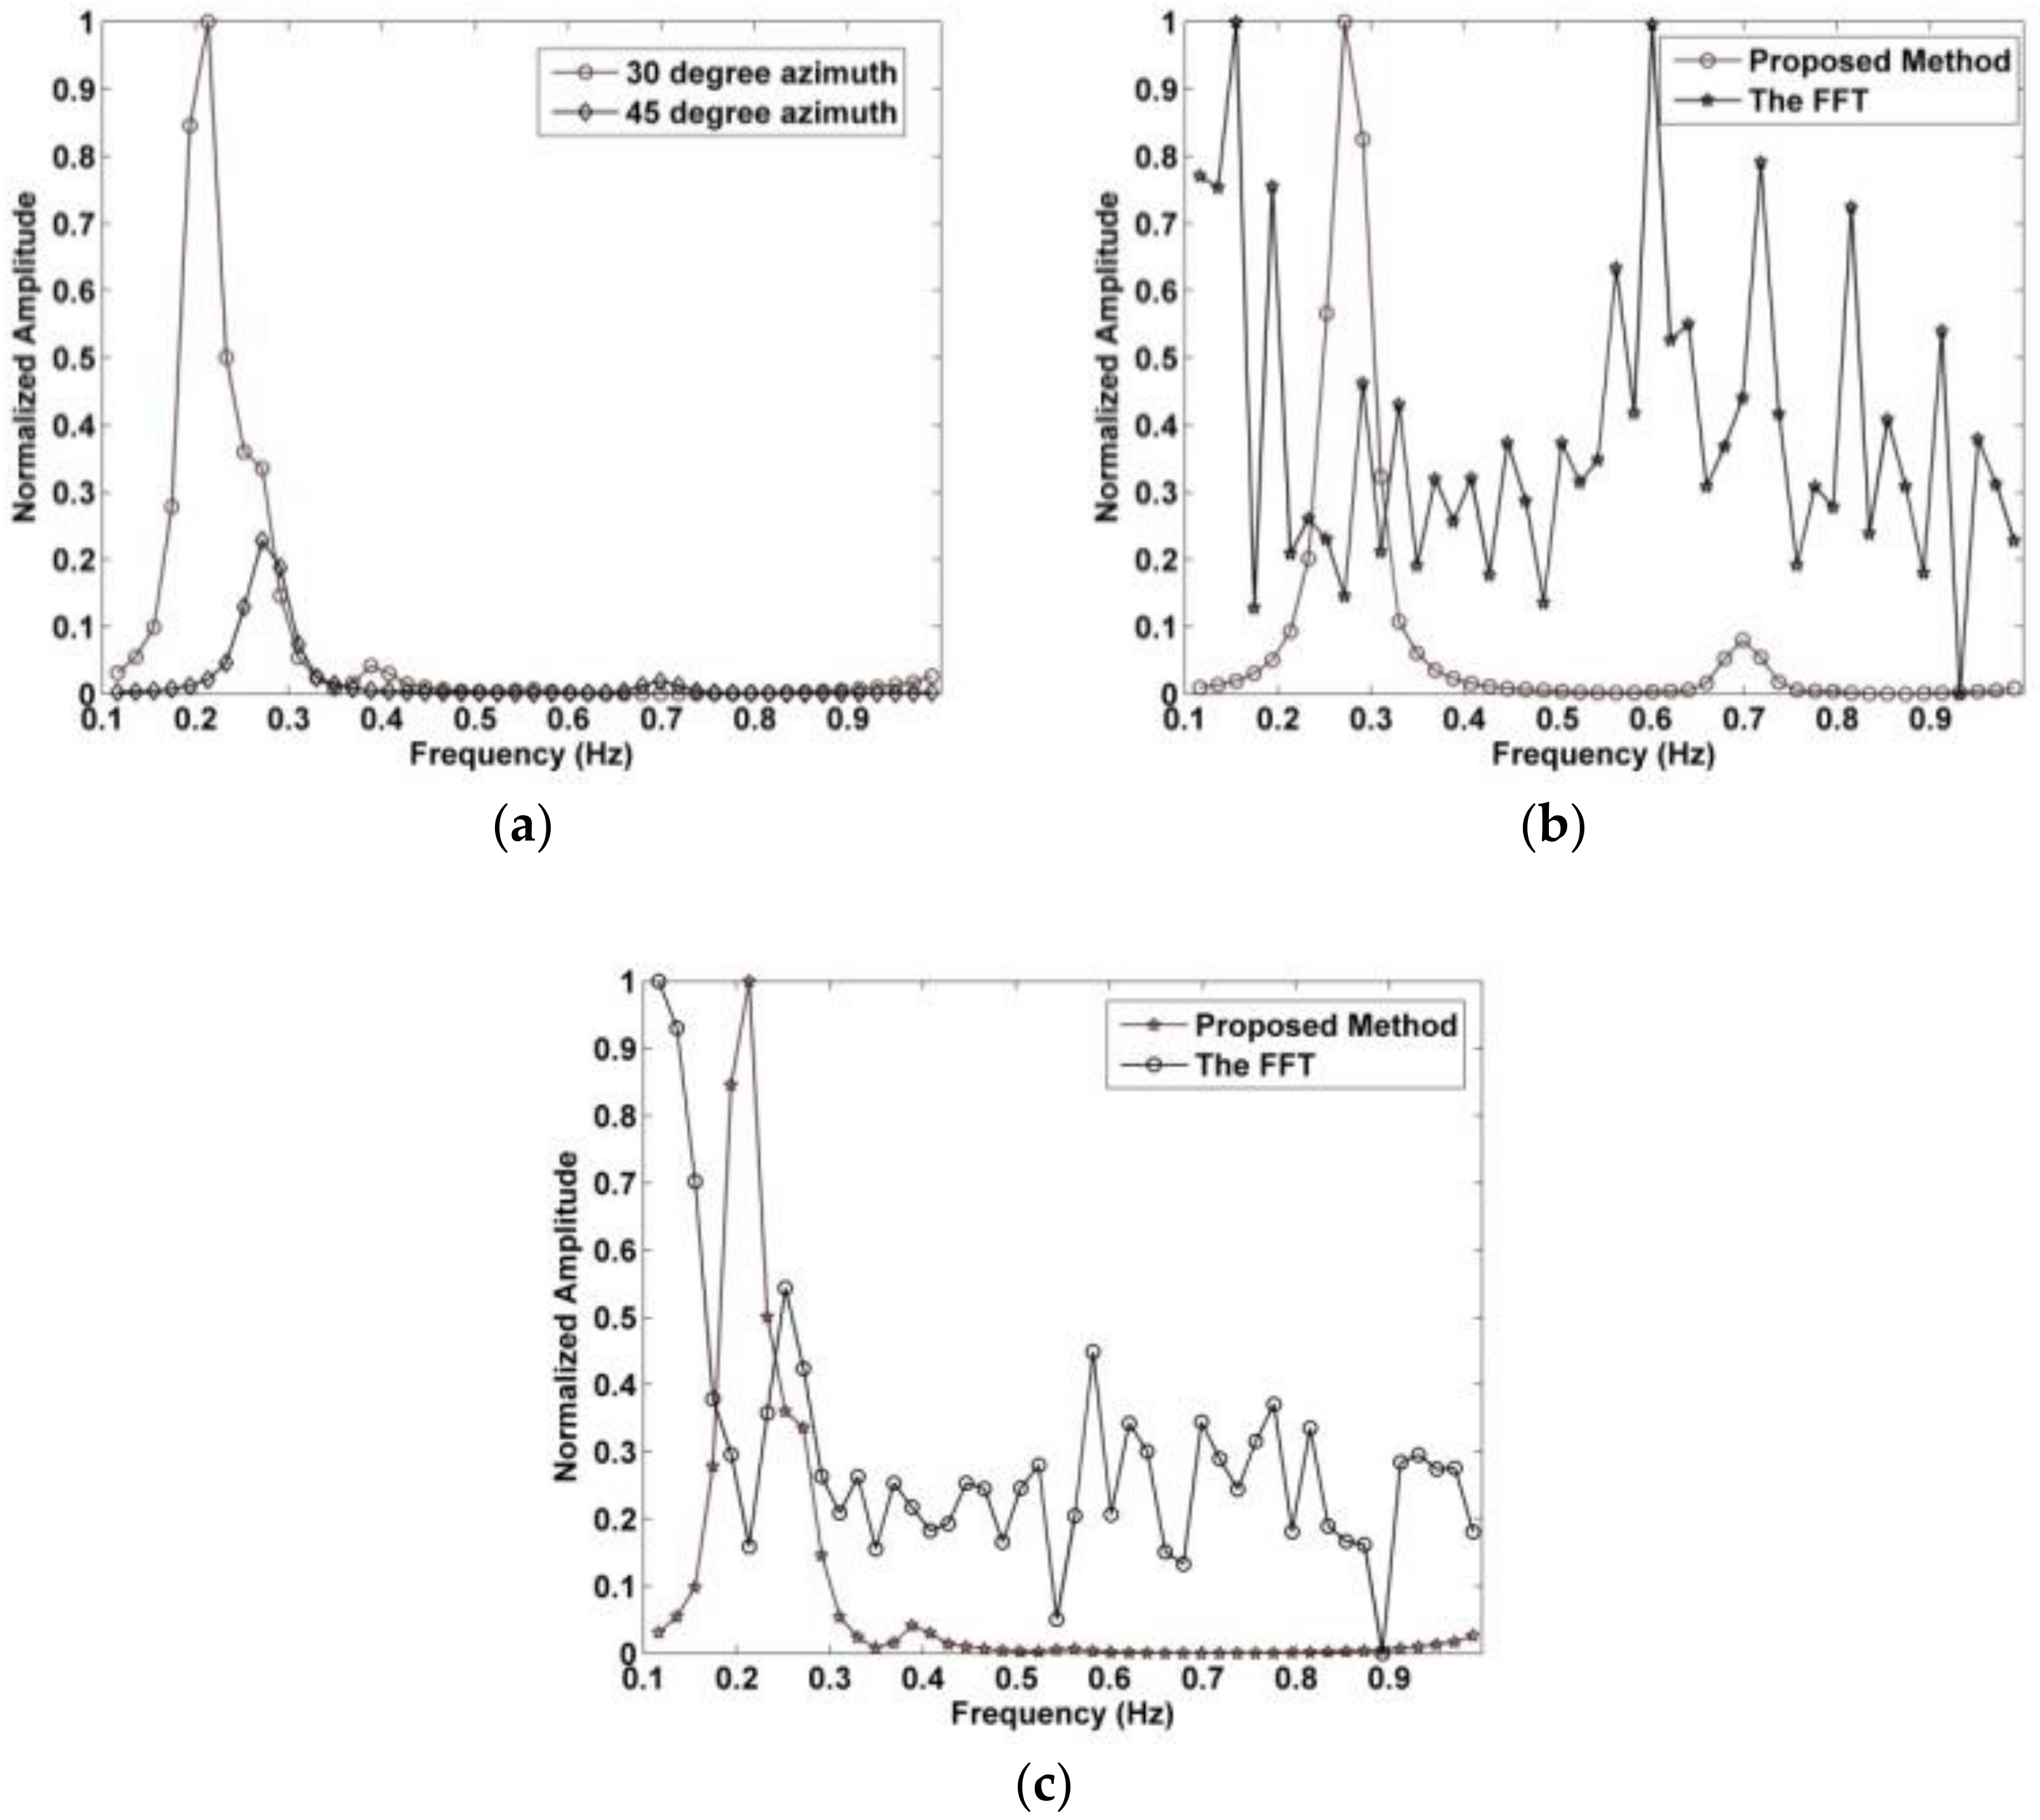
4.5. Detection Performance with Different Azimuth Angles
4.6. Actuator Experiment
4.7. Threshold Determination
5. Conclusions
Author Contributions
Funding
Conflicts of Interest
References
- Zhao, H.; Hong, H.; Li, S.; Li, Y. Noncontact physiological dynamics detection using low-power digital-IF doppler radar. IEEE Trans. Instrum. Meas. 2017, 66, 1780–1788. [Google Scholar] [CrossRef]
- Mercuri, M.; Soh, J.; Pandey, G.; Karsmakers, P. Analysis of an indoor biomedical radar-based system for health monitoring. IEEE Trans. Microw. Theory Tech. 2013, 61, 2061–2068. [Google Scholar] [CrossRef]
- Kazemi, S.; Ghorbani, A.; Amindavar, H. Vital-sign extraction using bootstrap-based generalized warblet transform in heart and respiration monitoring radar system. IEEE Trans. Instrum. Meas. 2016, 65, 255–263. [Google Scholar] [CrossRef]
- Wang, J.; Wang, X.; Chen, L.; Li, C.; Ran, L. Noncontact distance and amplitude-independent vibration measurement based on an extended DACM algorithm. IEEE Trans. Instrum. Meas. 2014, 63, 145–153. [Google Scholar] [CrossRef]
- Singh, A.; Gao, X.; Yavari, M.; Zakrzewski, E. Data-based quadrature imbalance compensation for a CW Doppler radar system. IEEE Trans. Microw. Theory Tech. 2013, 61, 1718–1724. [Google Scholar] [CrossRef]
- Nijsure, Y.; Tay, W.; Gunawan, E.; Wen, F. An impulse radio ultrawideband system for contactless noninvasive respiratory monitoring. IEEE Trans. Biomed. Eng. 2013, 60, 1509–1517. [Google Scholar] [CrossRef] [PubMed]
- Li, J. Advanced signal processing for vital sign extraction with applications in UWB radar detection of trapped victims in complex environments. IEEE J. Sel. Top. Appl. Earth Obs. Remote Sens. 2014, 7, 783–791. [Google Scholar]
- Li, Z.; Li, W.; Lv, H.; Zhang, Y. A novel method for respiration-like clutter cancellation in life detection by dual-frequency IR-UWB radar. IEEE Trans. Microw. Theory Tech. 2013, 61, 2086–2092. [Google Scholar] [CrossRef]
- Hu, W.; Zhao, Z.; Wang, Y.; Zhang, H. Noncontact accurate measurement of cardiopulmonary activity using a compact quadrature doppler radar sensor. IEEE Trans. Biomed. Eng. 2014, 61, 725–735. [Google Scholar] [CrossRef]
- Tu, J.; Lin, J. Fast acquisition of heart rate in noncontact vital sign radar measurement using time-window-variation technique. IEEE Trans. Instrum. Meas. 2016, 65, 112–122. [Google Scholar] [CrossRef]
- Piuzzi, F.; Atanasio, P.; Pisa, S.; Pittella, E. A complex radar cross section measurements of the human body for breath-activity monitoring applications. IEEE Trans. Instrum. Meas. 2015, 64, 2247–2258. [Google Scholar] [CrossRef]
- Liang, X.; Zhang, H.; Ye, S.; Fang, G.; Gulliver, T.A. Improved denoising method for through-wall vital sign detection using UWB impulse radar. Digit. Signal Process. 2017, 74, 72–93. [Google Scholar] [CrossRef]
- Ren, L. Noncontact multiple heartbeats detection and subject localization using UWB impulse doppler radar. IEEE Microw. Wirel. Compon. Lett. 2015, 25, 690–692. [Google Scholar] [CrossRef]
- Sakamoto, T.; Aubry, P.; Okumura, S.; Taki, H. Noncontact Measurement of the Instantaneous Heart Rate in a Multi-person Scenario Using X-band Array Radar and Adaptive Array Processing. IEEE J. Emerg. Sel. Top. Circuits Syst. 2018, 8, 280–293. [Google Scholar] [CrossRef]
- Sun, L. Noncontact Vital Sign Detection based on Stepwise Atomic Norm Minimization. IEEE Signal Process. Lett. 2015, 22, 2479–2483. [Google Scholar] [CrossRef]
- Liang, X.; Zhang, H.; Lyu, T.; Gulliver, T.A. An improved algorithm for through-wall target detection using ultra-wideband impulse radar. IEEE Access 2017, 5, 22101–22118. [Google Scholar] [CrossRef]
- Liang, X.; Lyu, T.; Zhang, H. Through-wall human being detection using UWB impulse radar. EURASIP J. Wirel. Commun. 2018, 46, 1–17. [Google Scholar] [CrossRef]
- Zhao, H.; Hong, H.; Miao, D.; Li, Y. A Noncontact Breathing Disorder Recognition System Using 2.4-GHz Digital-IF Doppler Radar. IEEE J. Biomed. Health Inform. 2019, 23, 208–217. [Google Scholar] [CrossRef]
- Lazaro, A. Analysis of vital signs monitoring using an IR-UWB radar. Prog. Electromagn. Res. 2010, 100, 265–284. [Google Scholar] [CrossRef]
- Ren, L.; Wang, H.; Naishadham, M.; Kilic, O. Phase-based methods for heart rate detection using UWB impulse Doppler radar. IEEE Trans. Microw. Theory Tech. 2016, 64, 3319–3331. [Google Scholar] [CrossRef]
- Venkatesh, S.; Anderson, C.; Rivera, N.V.; Buehrer, R.M. Implementation and analysis of respiration-rate estimation using impulse-based UWB. In Proceedings of the 2005 IEEE Military Communications Conference, Atlantic City, NJ, USA, 17–20 October 2005; Volume 5, pp. 3314–3320. [Google Scholar]
- Ascione, M.; Buonanno, A.; D’Urso, M.; Angrisani, L. A new measurement method based on music algorithm for through-the-wall detection of life signs. IEEE Trans. Instrum. Meas. 2013, 62, 13–26. [Google Scholar] [CrossRef]
- Liu, L.; Liu, Z.; Barrowes, B. Through-wall bio-radiolocation with UWB impulse radar-observation, simulation and signal extraction. IEEE J. Sel. Top. Appl. Earth Obs. Remote Sens. 2011, 4, 791–798. [Google Scholar] [CrossRef]
- Liu, L.; Liu, Z.; Xie, H.; Amvrossios, C.B. Numerical simulation of UWB impulse radar vital sign detection at an earthquake disaster site. Ad Hoc Netw. 2014, 13, 34–41. [Google Scholar] [CrossRef]
- Rahman, M.; Mahdi, N.; Seyed, S.; Abdel, M. Resonator Based Switching Technique between Ultra Wide Band (UWB) and Single/Dual Continuously Tunable-Notch Behaviors in UWB Radar for Wireless Vital Signs Monitoring. Sensors 2018, 18, 3330. [Google Scholar] [CrossRef] [PubMed]
- Liang, X.; Wang, Y.; Wu, S.; Gulliver, T.A. Experimental Study of Wireless Monitoring of Human Respiratory Movements Using UWB Impulse Radar Systems. Sensors 2018, 18, 3065. [Google Scholar] [CrossRef] [PubMed]
- Lee, J.S.; Nguyen, C.; Scullion, T. A novel, compact, low-cost, impulse ground-penetrating radar for nondestructive evaluation of pavements. IEEE Trans. Instrum. Meas. 2004, 53, 1502–1509. [Google Scholar] [CrossRef]
- Conte, E.; Filippi, A.; Tomasin, S. ML period estimation with application to vital sign monitoring. IEEE Signal Process. Lett. 2010, 17, 905–908. [Google Scholar] [CrossRef]
- Liang, X.; Zhang, H.; Lyu, T.; Xu, L.; Cao, C.; Gulliver, T.A. Ultra-wide band impulse radar for life detection using wavelet packet decomposition. Phys. Commun. 2018, 4, 1–20. [Google Scholar] [CrossRef]
- Liang, X.; Deng, J.; Zhang, H.; Gulliver, T.A. Ultra-Wideband Impulse Radar Through-Wall Detection of Vital Signs. Sci. Rep-UK 2018, 8, 13367. [Google Scholar] [CrossRef]
- Guan, S.; Rice, J.A.; Li, C. Automated DC offset calibration strategy for structural health monitoring based on portable CW radar sensor. IEEE Trans. Instrum. Meas. 2014, 63, 3111–3118. [Google Scholar] [CrossRef]
- Zhang, Z. Human-target detection and surrounding structure estimation under a simulated rubble via UWB radar. IEEE Trans. Geosci. Remote Sens. 2013, 10, 328–331. [Google Scholar] [CrossRef]
- Xu, Y.; Wu, S.; Chen, C.; Chen, J.; Fang, G. A novel method for automatic detection of trapped victims by ultrawideband radar. IEEE Trans. Geosci. Remote Sens. 2012, 50, 3132–3142. [Google Scholar] [CrossRef]
- Xie, Y.; Fang, G. Equi-amplitude tracing algorithm based on base-band pulse signal in vital sign detecting. Electron. Inf. Technol. 2009, 31, 1132–1135. [Google Scholar]
- Nezirovic, A.; Yarovoy, A.G.; Ligthart, L.P. Signal processing for improved detection of trapped victims using UWB radar. IEEE Trans. Geosci. Remote Sens. 2010, 48, 2005–2014. [Google Scholar] [CrossRef]
- Tan, K.; Wu, S.; Chen, J.; Xia, Z.; Fang, G.; Meng, S. Improved human respiration detection method via ultra-wideband radar in through-wall or other similar conditions. IET Radar Sonar Navig. 2016, 10, 468–476. [Google Scholar]
- Xu, Y.; Dai, S.; Wu, S.; Chen, J.; Fang, G. Vital sign detection method based on multiple higher order cumulant for ultra-wideband radar. IEEE Trans. Geosci. Remote Sens. 2012, 50, 1254–1265. [Google Scholar] [CrossRef]
- Hu, X.; Jin, T. Short-range vital signs sensing based on EEMD and CWT using IR-UWB radar. Sensors 2016, 16, 2025. [Google Scholar] [CrossRef]
- Khan, F.; Cho, S.H. A Detailed Algorithm for Vital Sign Monitoring of a Stationary/Non-Stationary Human through IR-UWB Radar. Sensors 2017, 17, 290. [Google Scholar] [CrossRef]
- Rahman, M.; Ko, D.; Park, J. A Compact Multiple Notched Ultra-Wide Band Antenna with an Analysis of the CSRR-TO-CSRR Coupling for Portable UWB Applications. Sensors 2017, 17, 2174. [Google Scholar] [CrossRef]
- Lv, H.; Qi, F.; Zhang, Y.; Jiao, T. Improved Detection of Human Respiration Using Data Fusion Basedon a Multistatic UWB Radar. Remote Sens. 2016, 8, 773. [Google Scholar] [CrossRef]
- Liang, X.; Zhang, H.; Lv, T.; Gulliver, T.A. Extreme learning machine for 60 GHz millimetre wave positioning. IET Commun. 2017, 11, 483–489. [Google Scholar] [CrossRef]
- Liang, X.; Zhang, H.; Lv, T.; Gulliver, T.A. Energy detector based TOA estimation for MMW systems using machine learning. Telecommun. Syst. 2017, 64, 417–427. [Google Scholar] [CrossRef]
- Wu, S.; Yao, S.; Tan, K.; Xia, Z.; Meng, S.; Chen, J.; Fang, G. Study on a Novel UWB Linear Array Human Respiration Model and Detection Method. IEEE J. Sel. Top. Appl. Earth Obs. Remote Sens. 2016, 9, 125–140. [Google Scholar] [CrossRef]
- Jurjevcic, B.; Senegačnik, A.; Drobnič, A.; Kustrin, I. The characterization of pulverized-coal pneumatic transport using an array of intrusive electrostatic sensors. IEEE Trans. Instrum. Meas. 2016, 64, 3434–3443. [Google Scholar] [CrossRef]
- Antoni, J. The spectral kurtosis: A useful tool for characterising non-stationary signals. Mech. Syst. Signal Process. 2006, 20, 282–307. [Google Scholar] [CrossRef]
- Zhang, Y. 2-D entropy and short-time Fourier transform to leverage GPR data analysis efficiency. IEEE Trans. Instrum. Meas. 2015, 64, 103–111. [Google Scholar] [CrossRef]
- Allen, B. Short term spectral analysis, synthesis, and modification by discrete Fourier transform. IEEE Trans. Acoust. Speech Signal Process. 1977, 25, 235–238. [Google Scholar] [CrossRef]
- Wójcicki, K.; Milacic, M.; Stark, A.; Lyons, J. Exploiting conjugate symmetry of the short-time Fourier spectrum for speech enhancement. IEEE Signal Process. Lett. 2008, 15, 461–464. [Google Scholar] [CrossRef]
- Mak, J.C.C.; Bois, A.; Poon, J.K.S. Programmable multiring Butterworth filters with automated resonance and coupling tuning. IEEE J. Sel. Top. Quantum Electron. 2016, 22, 232–240. [Google Scholar] [CrossRef]
- Marple, L. Computing the discrete-time “analytic” signal via FFT. IEEE Trans. Signal Process. 1999, 47, 2600–2603. [Google Scholar] [CrossRef]


| Parameter | Value |
|---|---|
| center frequency | 400 MHz |
| transmitted signal amplitude | 50 V |
| pulse repetition frequency (PRF) | 600 KHz |
| number of averaged values (NA) | 30 |
| time window | 124 ns |
| number of samples (M) | 4092 |
| analog to digital converter (ADC) bandwidth | 2.3 GHz |
| ADC sampling rate | 500 MHz |
| ADC sample size | 12 bits |
| receiver dynamic range | 72 dB |
| Method | 300 cm | 600 cm | 900 cm | 1100 cm | Comparison |
|---|---|---|---|---|---|
| Proposed | 7.58 | 4.62 | 1.27 | −2.75 | Higher |
| CFAR | −4.54 | −6.22 | −17.86 | −20.64 | Very lower |
| MHOC | −3.67 | −4.85 | −12.88 | −16.29 | Very lower |
| AM | 2.35 | −1.84 | −8.69 | −11.71 | Lower |
| Method | 1 FA | 2 FA | 4 FA | 6 FA |
|---|---|---|---|---|
| SNR (dB) | 0.51 | 1.27 | 6.14 | 6.75 |
| Method | FFT | MHOC | CFAR | AM | Proposed |
|---|---|---|---|---|---|
| Rate (Hz) | 0.116 | 0.177 | 0.0823 | 0.147 | 0.334 |
| SNR (dB) | −15.09 | −7.58 | −10.83 | −6.72 | 4.06 |
| Deviation (%) | 65 | 47 | 75 | 56 | 0.12 |
| Frequency Accumulation Method (m) | WFT Method (m) | Error (m) |
|---|---|---|
| 13.70 | 7.82 | 5.88 |
| 10.24 | 6.89 | 3.35 |
| 9.45 | 6.74 | 2.71 |
| 10.54 | 14.36 | 3.82 |
| 12.95 | 3.66 | 9.29 |
| 13.43 | 5.36 | 8.07 |
| 12.12 | 9.39 | 2.73 |
| 11.42 | 15.29 | 3.87 |
| 13.11 | 9.34 | 3.78 |
| 14.56 | 6.89 | 7.67 |
© 2019 by the authors. Licensee MDPI, Basel, Switzerland. This article is an open access article distributed under the terms and conditions of the Creative Commons Attribution (CC BY) license (http://creativecommons.org/licenses/by/4.0/).
Share and Cite
Yang, S.; Qin, H.; Liang, X.; Gulliver, T.A. Clutter Elimination and Harmonic Suppression of Non-Stationary Life Signs for Long-Range and Through-Wall Human Subject Detection Using Spectral Kurtosis Analysis (SKA)-Based Windowed Fourier Transform (WFT) Method. Appl. Sci. 2019, 9, 355. https://doi.org/10.3390/app9020355
Yang S, Qin H, Liang X, Gulliver TA. Clutter Elimination and Harmonic Suppression of Non-Stationary Life Signs for Long-Range and Through-Wall Human Subject Detection Using Spectral Kurtosis Analysis (SKA)-Based Windowed Fourier Transform (WFT) Method. Applied Sciences. 2019; 9(2):355. https://doi.org/10.3390/app9020355
Chicago/Turabian StyleYang, Shengying, Huibin Qin, Xiaolin Liang, and Thomas Aaron Gulliver. 2019. "Clutter Elimination and Harmonic Suppression of Non-Stationary Life Signs for Long-Range and Through-Wall Human Subject Detection Using Spectral Kurtosis Analysis (SKA)-Based Windowed Fourier Transform (WFT) Method" Applied Sciences 9, no. 2: 355. https://doi.org/10.3390/app9020355
APA StyleYang, S., Qin, H., Liang, X., & Gulliver, T. A. (2019). Clutter Elimination and Harmonic Suppression of Non-Stationary Life Signs for Long-Range and Through-Wall Human Subject Detection Using Spectral Kurtosis Analysis (SKA)-Based Windowed Fourier Transform (WFT) Method. Applied Sciences, 9(2), 355. https://doi.org/10.3390/app9020355