Article

Study on Lightweight and Strengthening Effect of Carbon Nanotube in Highly Ordered Nanoporous Nickel: A Molecular Dynamics Study

1
School of Aeronautical Manufacturing Engineering, Nanchang Hangkong University, Nanchang 330063, China
2
Research School of Engineering, the Australian National University, Acton, ACT 2601, Australia
*
Author to whom correspondence should be addressed.
Appl. Sci. 2019, 9(2), 352; https://doi.org/10.3390/app9020352
Submission received: 8 December 2018 / Revised: 10 January 2019 / Accepted: 14 January 2019 / Published: 21 January 2019
(This article belongs to the Special Issue Fabrication, Characterization and Application of Carbon Nanotubes)

Abstract

:
The mechanical behavior of nanocomposites consisting of highly ordered nanoporous nickel (HONN) and its carbon nanotube (CNT)-reinforced composites (CNHONNs) subjected to a high temperature of 900 K is investigated via molecular dynamics (MD) simulations. The study indicates that, out-of-plane mechanical properties of the HONNs are generally superior to its in-plane mechanical properties. Whereas the CNT shows a significant strengthening effect on the out-of-plane mechanical properties of the CNHONN composites. Compared to pure HONNs, through the addition of CNTs from 1.28 wt‰ to 5.22 wt‰, the weight of the composite can be reduced by 5.83‰ to 2.33% while the tensile modulus, tensile strength, compressive modulus and compressive strength can be increased by 2.2% to 8.8%, 1% to 5.1%, 3.6% to 10.2% and 4.9% to 10.7%, respectively. The energy absorption capacity can also be improved due to the existence of CNTs. Furthermore, the MD simulations provide further insights into the deformation mechanism at the atomic scale, including fracture in tension, pore collapse in compression and local changes in lattice structures due to stacking faults.

1. Introduction

Being a type of electrochemical devices, solid oxide fuel cells (SOFCs) have been receiving attentions as one of the most promising power generation systems [1]. While Nickel (Ni), as an important material in electrochemical technology, is used widely as anode material in SOFCs [2,3,4,5]. Typical SOFC anodes contain 40–60 wt% nickel, which imparts favorable microstructure, electrical conductivity, thermal robustness and catalytic activity to the anode [4]. In contrast to disordered porous structures, materials with high surface area and highly ordered pore network would be expected to exhibit superior performance in electrochemical systems which rely on gas or liquid diffusion within the electrode material [6]. Nelson et al. [6] have successfully produced highly ordered nanoporous nickel (HONN) via the liquid crystal templated electrodeposition route. Moreover, the monolithic HONNs make electron transport within the material not to encounter grain boundary resistances, offering the material superior electronic conductivity and removing power losses [7].
Since SOFCs usually operate at a range of temperature from 600 to 1000 °C, thermal stresses in various components of SOFCs strongly impact the cell lifetime by inducing cracks, contact loss and structural instability [8]. It is desired that the HONNs have not only enough chemical and electrochemical stability but also excellent mechanical properties to withstand stresses that arise during processing and service.
On the other hand, the discovery of carbon nanotubes (CNTs) [9] stimulated enormous studies on carbon nanomechanics because of their extraordinary strength [10], high electrical properties [11] and high thermal conductivity [12]. CNTs have been used in electrode materials of various cells [13,14,15] and reinforcement fillers of different structural materials [16,17,18]. Porosity have been assumed to be an important factor that affects the mechanical properties of anode materials of SOFCs [3,19,20] and therefore, mechanical properties of HONNs with different porosity and their CNT reinforced composites (CNHONNs) are of interest.
Most experimental studies on CNT-Ni composites were dedicated to the development and improvement of fabrication process for improving the mechanical properties [21,22,23,24,25] or to use it as functional materials [14,26,27,28,29]. Sun et al. [21] fabricated CNT-reinforced nickel nanocomposites by using an innovative electrochemical co-deposition process and found that the tensile strength of CNT/Ni composite is as high as 2 GPa, which is three times that of pure nickel. Hwang et al. [24] processed CNT/Ni composite by a molecular-level mixing (MLM) process followed by spark plasma sintering (SPS) and the result showed that the composite exhibits a yield strength of 710 MPa, about 3.7 times that of monolithic nickel. Borkar et al. [25] constructed two types of CNT/Ni nanocomposites by using simple mechanical dry milling of nickel and CNT powders or MLM process as precursors followed by SPS and found that both types of nanocomposites exhibits a substantial enhancement in microhardness and tensile yield strength as compared to SPS processed pure Ni. Song et al. [26] used CNTs as a functional additive to improve the electrochemical performance of pasted nickel-foam electrodes for rechargeable alkaline nickel batteries and found that as compared with the electrode without CNTs, the electrode with 3 wt% CNT addition exhibits a higher charging efficiency, greater specific discharge capacity, higher discharge voltage, better high-rate capability and superior cycling stability. Jiang et al. [14] synthesized CNT/Ni hybrid nanostructured arrays (NSAs) on a stainless steel substrate through a one-step chemical-vapor-deposition (CVD) method using nullaginite NSAs as starting materials and found that the composite can be used as high-performance electrode materials for electrochemical capacitors (ECs). And the composites displayed well-defined pseudo capacitive capabilities with a high areal capacitance and good rate capability owing to the unique interconnected hybrid structure inherited from the conductive CNT network and porous NSAs. What’s more, the addition of CNTs can also improve the properties of ethanol biosensor [28], glucose biosensor [29].
With the advent of supercomputers and high performance numerical tools, molecular dynamics (MD) simulations have become effective means to predict the properties of nanocomposites. Particularly for the study of failure mechanisms, MD simulations have significant advantages due to the capability of capturing dynamic atomic behaviors [30,31]. As for CNT/Ni nanocomposites, a series of MD simulation or ab initio MD simulation works have concentrated on the growth mechanism of CNT on the surface of Ni nanoparticles [32,33,34,35] or using Ni as a coating on CNT surface to provide an effective channel for load transfer between the CNT and metals (Al [36], Au [37], Mg [38], Cu [39]). Investigations and analyses, however, of using CNT as a reinforced material in Ni matrix, especially HONNs, are still rare.
In this work, the in-plane and out-of-plane Young’s modulus E and ultimate strength σu of HONNs with different porosity are studied by using MD simulations at a temperature of 900 K. The effect of different mass fractions of CNTs on mechanical properties is also investigated.

2. Methodology

Representative volume elements (RVEs) of HONNs (see Figure 1a,b) and CNHONNs (see Figure 1c–f) are chosen for MD simulations to investigate the mechanical behavior of the RVE in the in-plane (y axis) and out-of-plane (z axis) direction. The x, y and z axes correspond to [010], [100], [001] directions, respectively. The lattice constant of Ni is 3.52 Å and the size of RVE is 140.8 Å × 140.8 Å × 140.8 Å (as shown in Figure 1a), with a through cylindrical pore in the center and a quarter cylindrical pore in each corner which have identical radius with central pore (as shown in Figure 1b). In order to investigate the influence of relative density, 7 classes of samples with a center cylindrical pore of different radii are built and the simulated system contains 112,720~175,440 atoms, as listed in Table 1. The relative density ρr of the samples is calculated by ρr = MH/MB, where MB is the sum of atomic mass of the bulk Ni and MH is the sum of atomic mass of HONNs. And its porosity can be calculated simply by (1-ρr). In order to investigate the influence of CNTs, we take the 4th group of samples as the example by adding different mass fractions of CNTs (as shown in Figure 1c–f). In previous published studies, both zigzag [40] and armchair [36,37,38,39,41,42,43] CNTs were used to strengthen different types of material. And the (4, 4) CNT [36,37,42,43] was often used to simulate the mechanical properties of CNT/metal composites. When investigating the strengthening effect, the present work is limited to a smaller diameter of CNT, that is, (4, 4) CNT. The effect of the diameter and chirality of the CNTs will be the topic of further study. The locations of CNTs are in the center of ligament throughout z axis and distribute symmetrically around the central pore (as shown in Figure 1f). The mass fractions of CNTs ωCNT is calculated by ωCNT = MC/(MC+MH), where MC is the sum of atomic mass of the CNT. The ωCNT in our simulations are 1.28‰ (Figure 1c), 2.58‰ (Figure 1d), 3.89‰ (Figure 1e) and 5.22‰ (Figure 1f) respectively. The rate of weight reduction due to the addition of CNT can be calculated by (MH-MCNH)/MH and they are 5.82‰ (Figure 1c), 1.16% (Figure 1d), 1.75% (Figure 1e) and 2.33% (Figure 1f) respectively in our simulations, where MCNH is the sum of atomic mass of CNHONNs. Atomic images are visualized via Ovito [44].
MD simulations are performed by means of the Large-scale Atomic/Molecular Massively Parallel Simulator (LAMMPS) [45]. The Ni-Ni interaction is commonly described by an embedded atom method (EAM) potential [46] and the binding interaction of C-C is described by the widely used adaptive intermolecular reactive empirical bond order (AIREBO) potential [47]. The Lennard-Jones (LJ) 12-6 potential is adopted to simulate interatomic forces between C and Ni atoms and long rang van der Waals (vdW) interaction between C atoms. The LJ parameters εNi-C and σNi-C are determined by Lorentz-Berthelot (LB) mixing rule [48]. The value of εNi-C is estimated from geometric average (εNi-C = ε Ni ε C ) between ε Ni and ε C and the value of σNi-C is estimated from the arithmetic average ((σNiC)/2) between σNi and σC. For non-bonded C atoms Kutana and Giapis [49] recommended the LJ parameters εC = 0.00296 ev and σC = 3.407 Å and Foiles et al. [46] suggested the LJ parameters εNi = 0.219877 ev and σNi = 2.30 Å. Hence, according to the LB rule, the LJ parameters for the C-Ni interface are εNi-C = 0.02551ev and σNi-C = 2.8535 Å. The equilibrium distance is 0.858σNi-C [50], So the distance between the CNTs and Ni matrix is taken as 2.45 Å (Figure 1c). The cutoff radius is chosen as 10.2 Å which is larger than 3σNi-C (8.56 Å), in order to avoid truncation errors and fit to the cutoff distance of the AIREBO potential [42].
The periodic boundary conditions are applied in all three directions. Prior to loading, all models are relaxed using NPT ensemble (the total number of particles, the system’s volume and the system’s pressure are constant) for 100 ps to minimize the total free energy. In previous MD studies [30,42,51], the Young’s modulus was obtained from the stress-strain curves with the NVT ensemble (the total number of particles, the system’s volume and the absolute temperature are constant). Our simulations find that for nanoporous nickel, deformation under the NVT ensemble rather than NPT ensemble is more reasonable especially in compression because no densification stage will be found under the NPT ensemble. So the NVT ensemble is adopted to simulate the compressive or tensile behavior by applying a constant strain rate of 0.005 ps−1. Young’s moduli E are calculated by fitting the data of stress-strain curves before a strain of 2% because no dislocations are generated before this strain. All simulations are carried out at the temperature of 900 K. The time step is reduced to 0.5 fs to prevent a blowout of the CNT atoms during fracture [42].

3. Results and Discussion

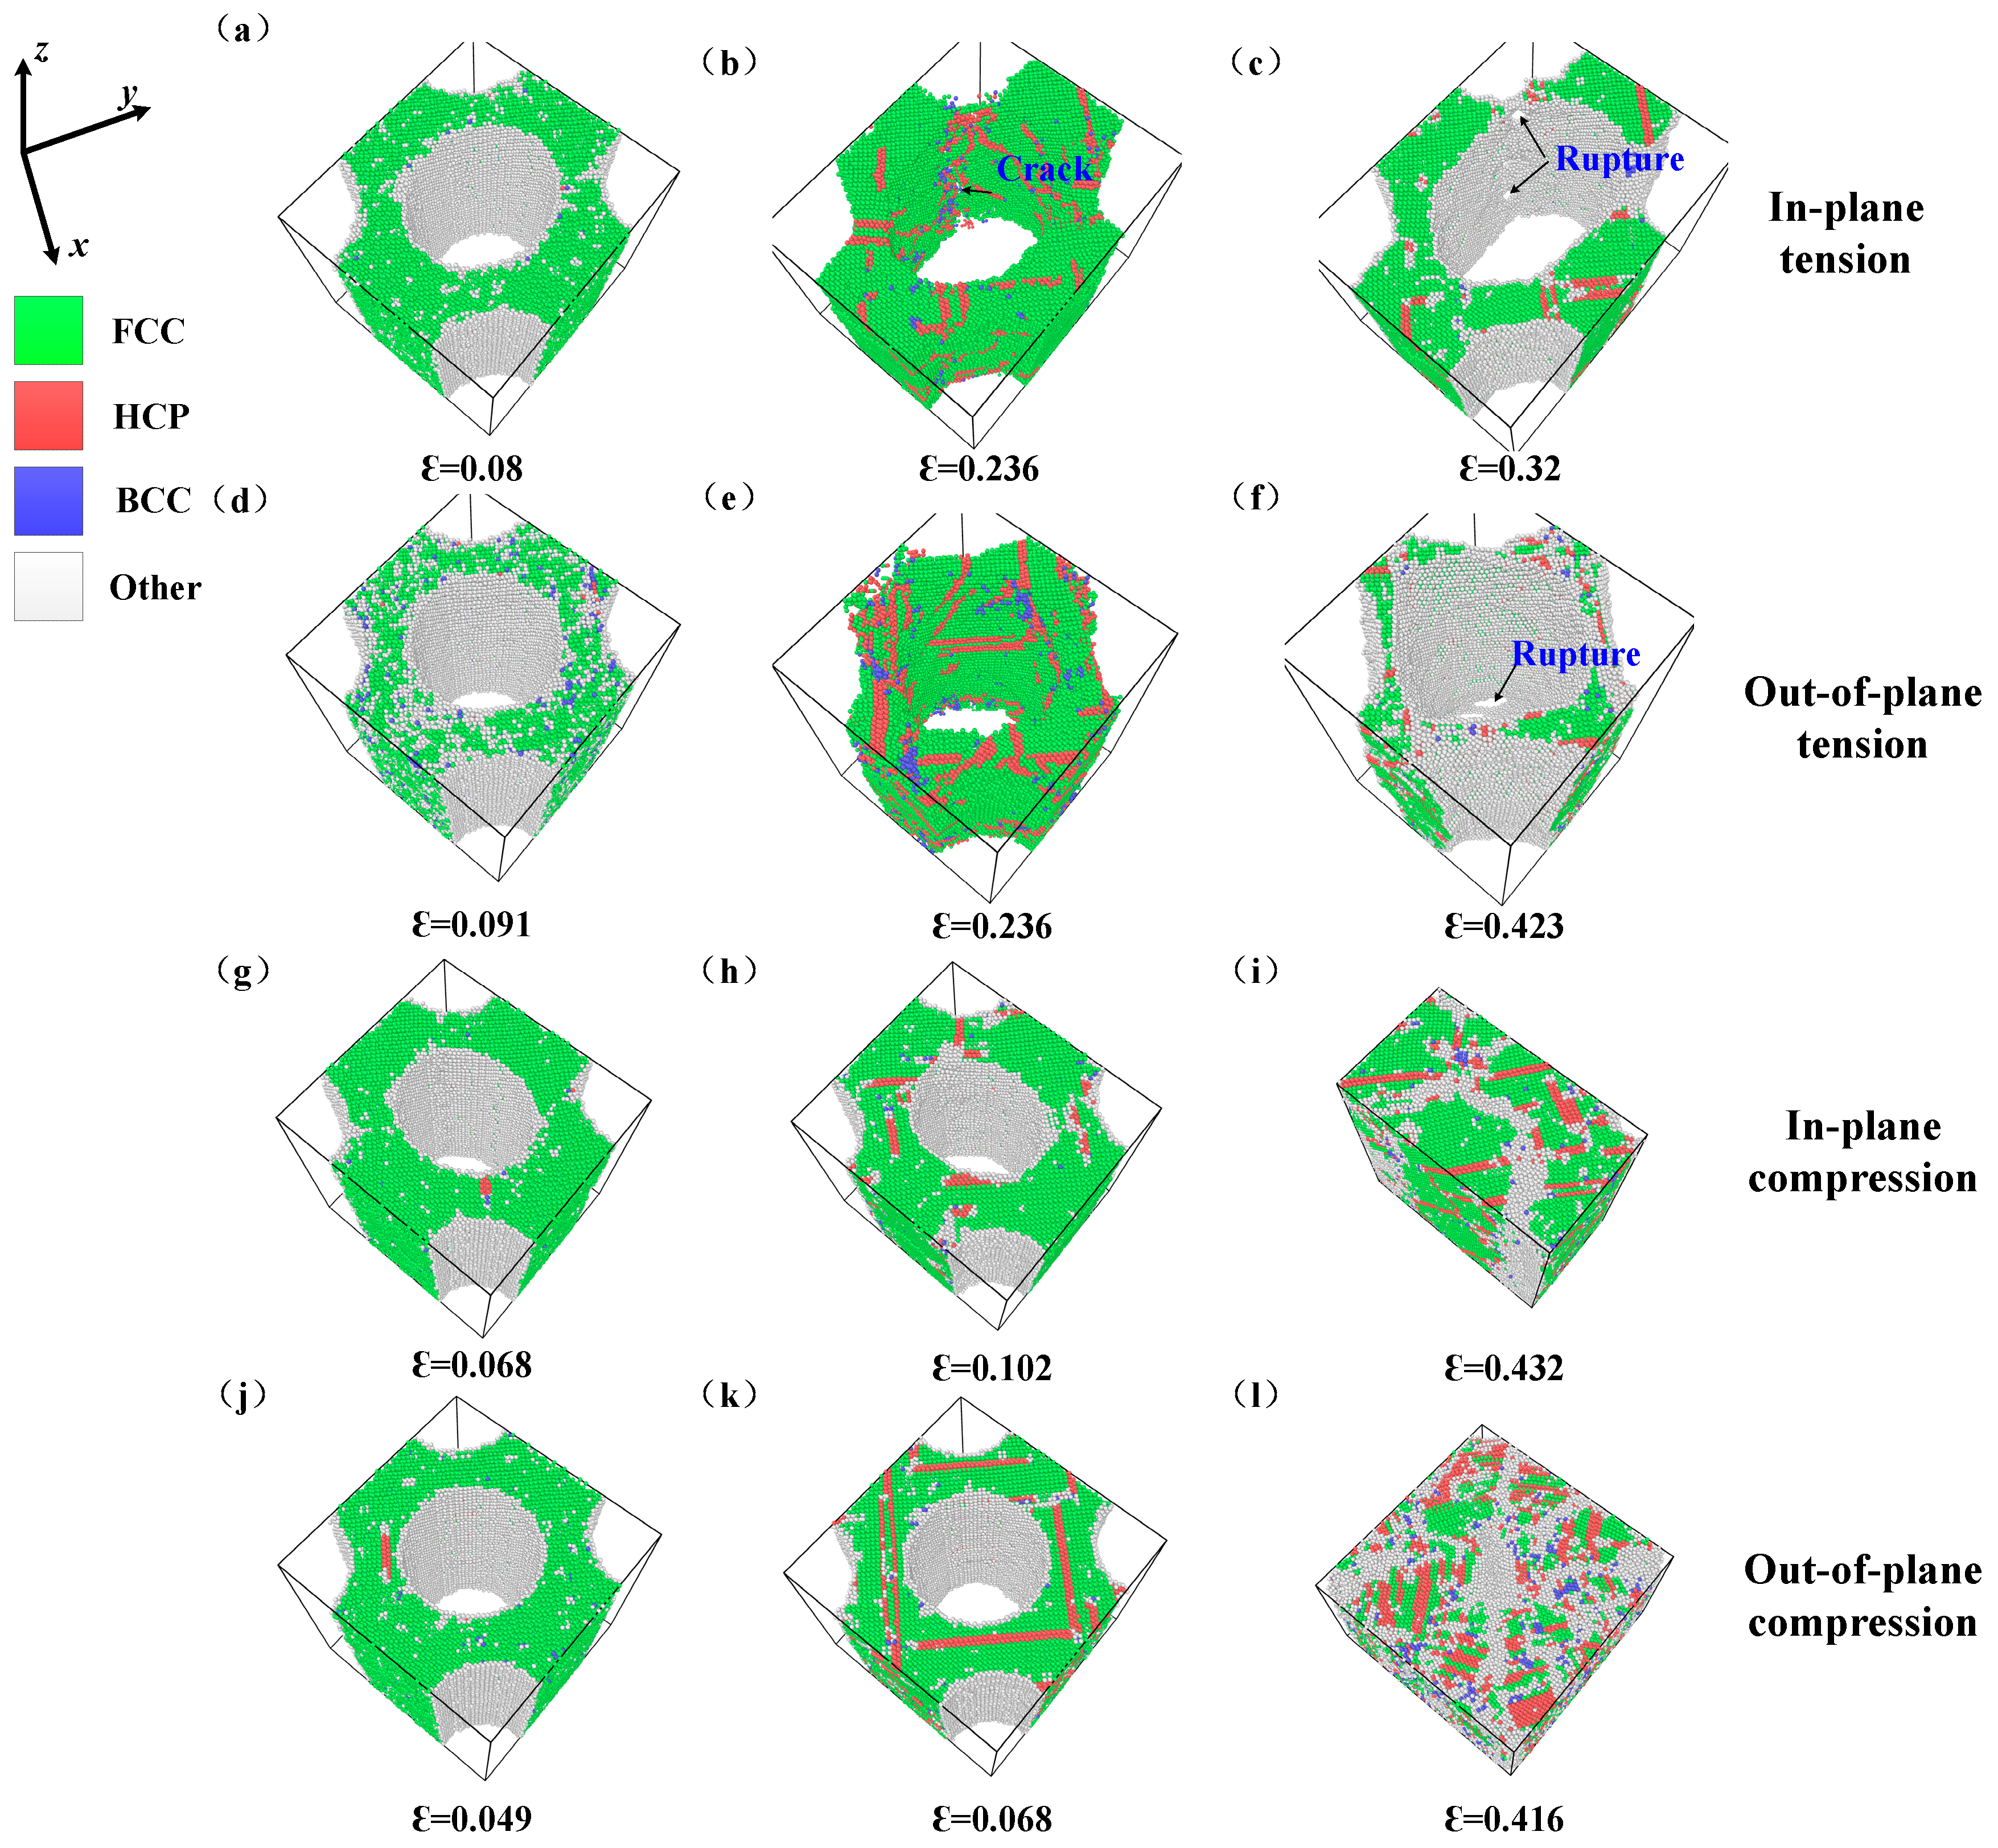
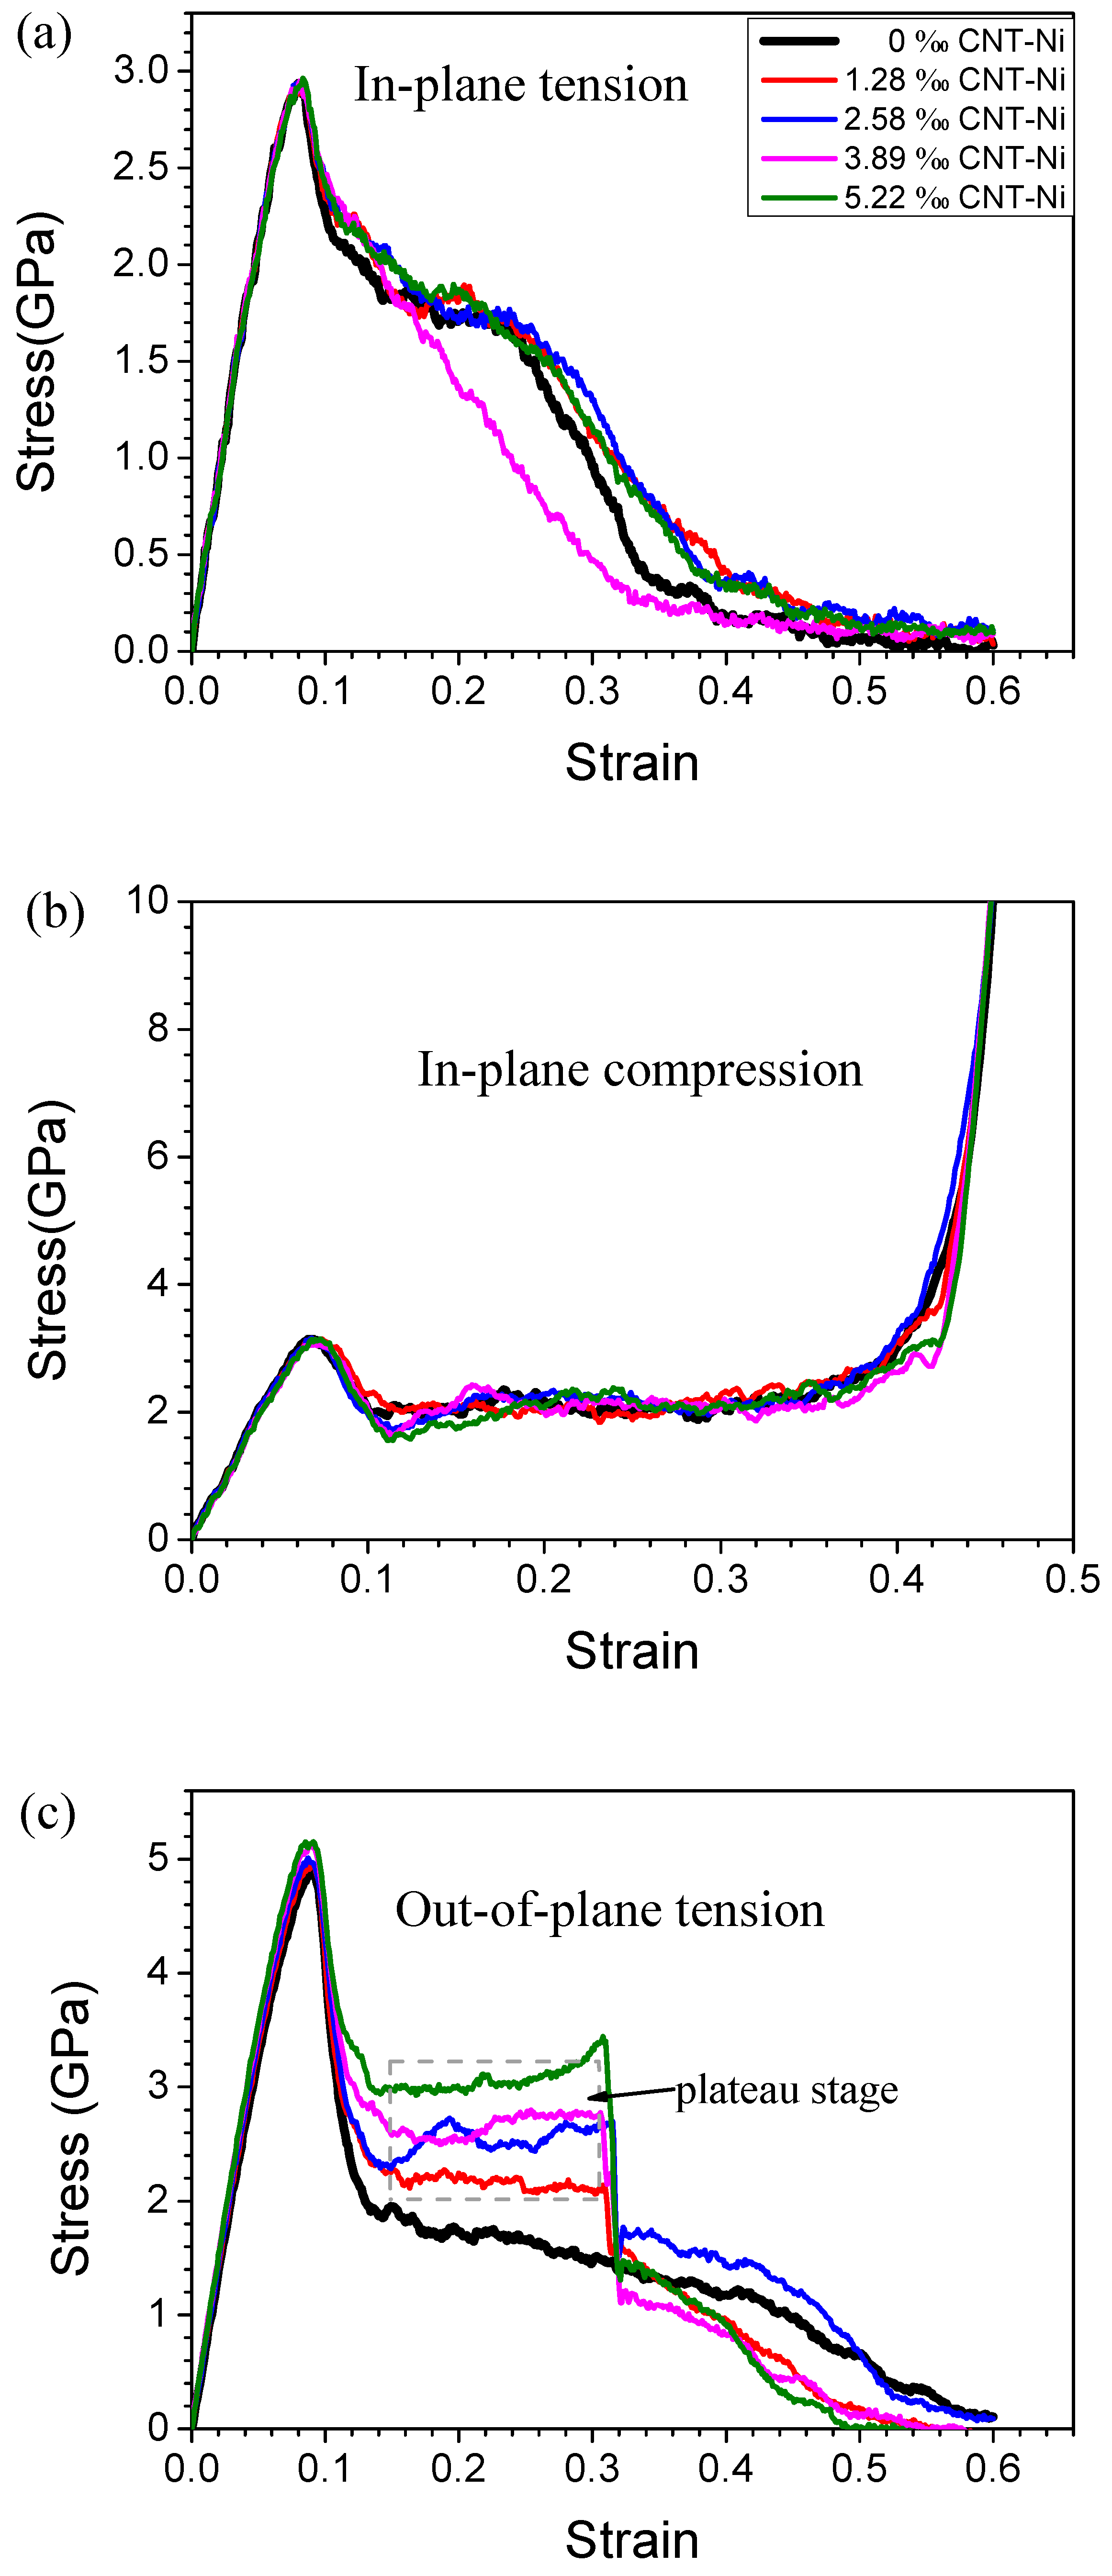
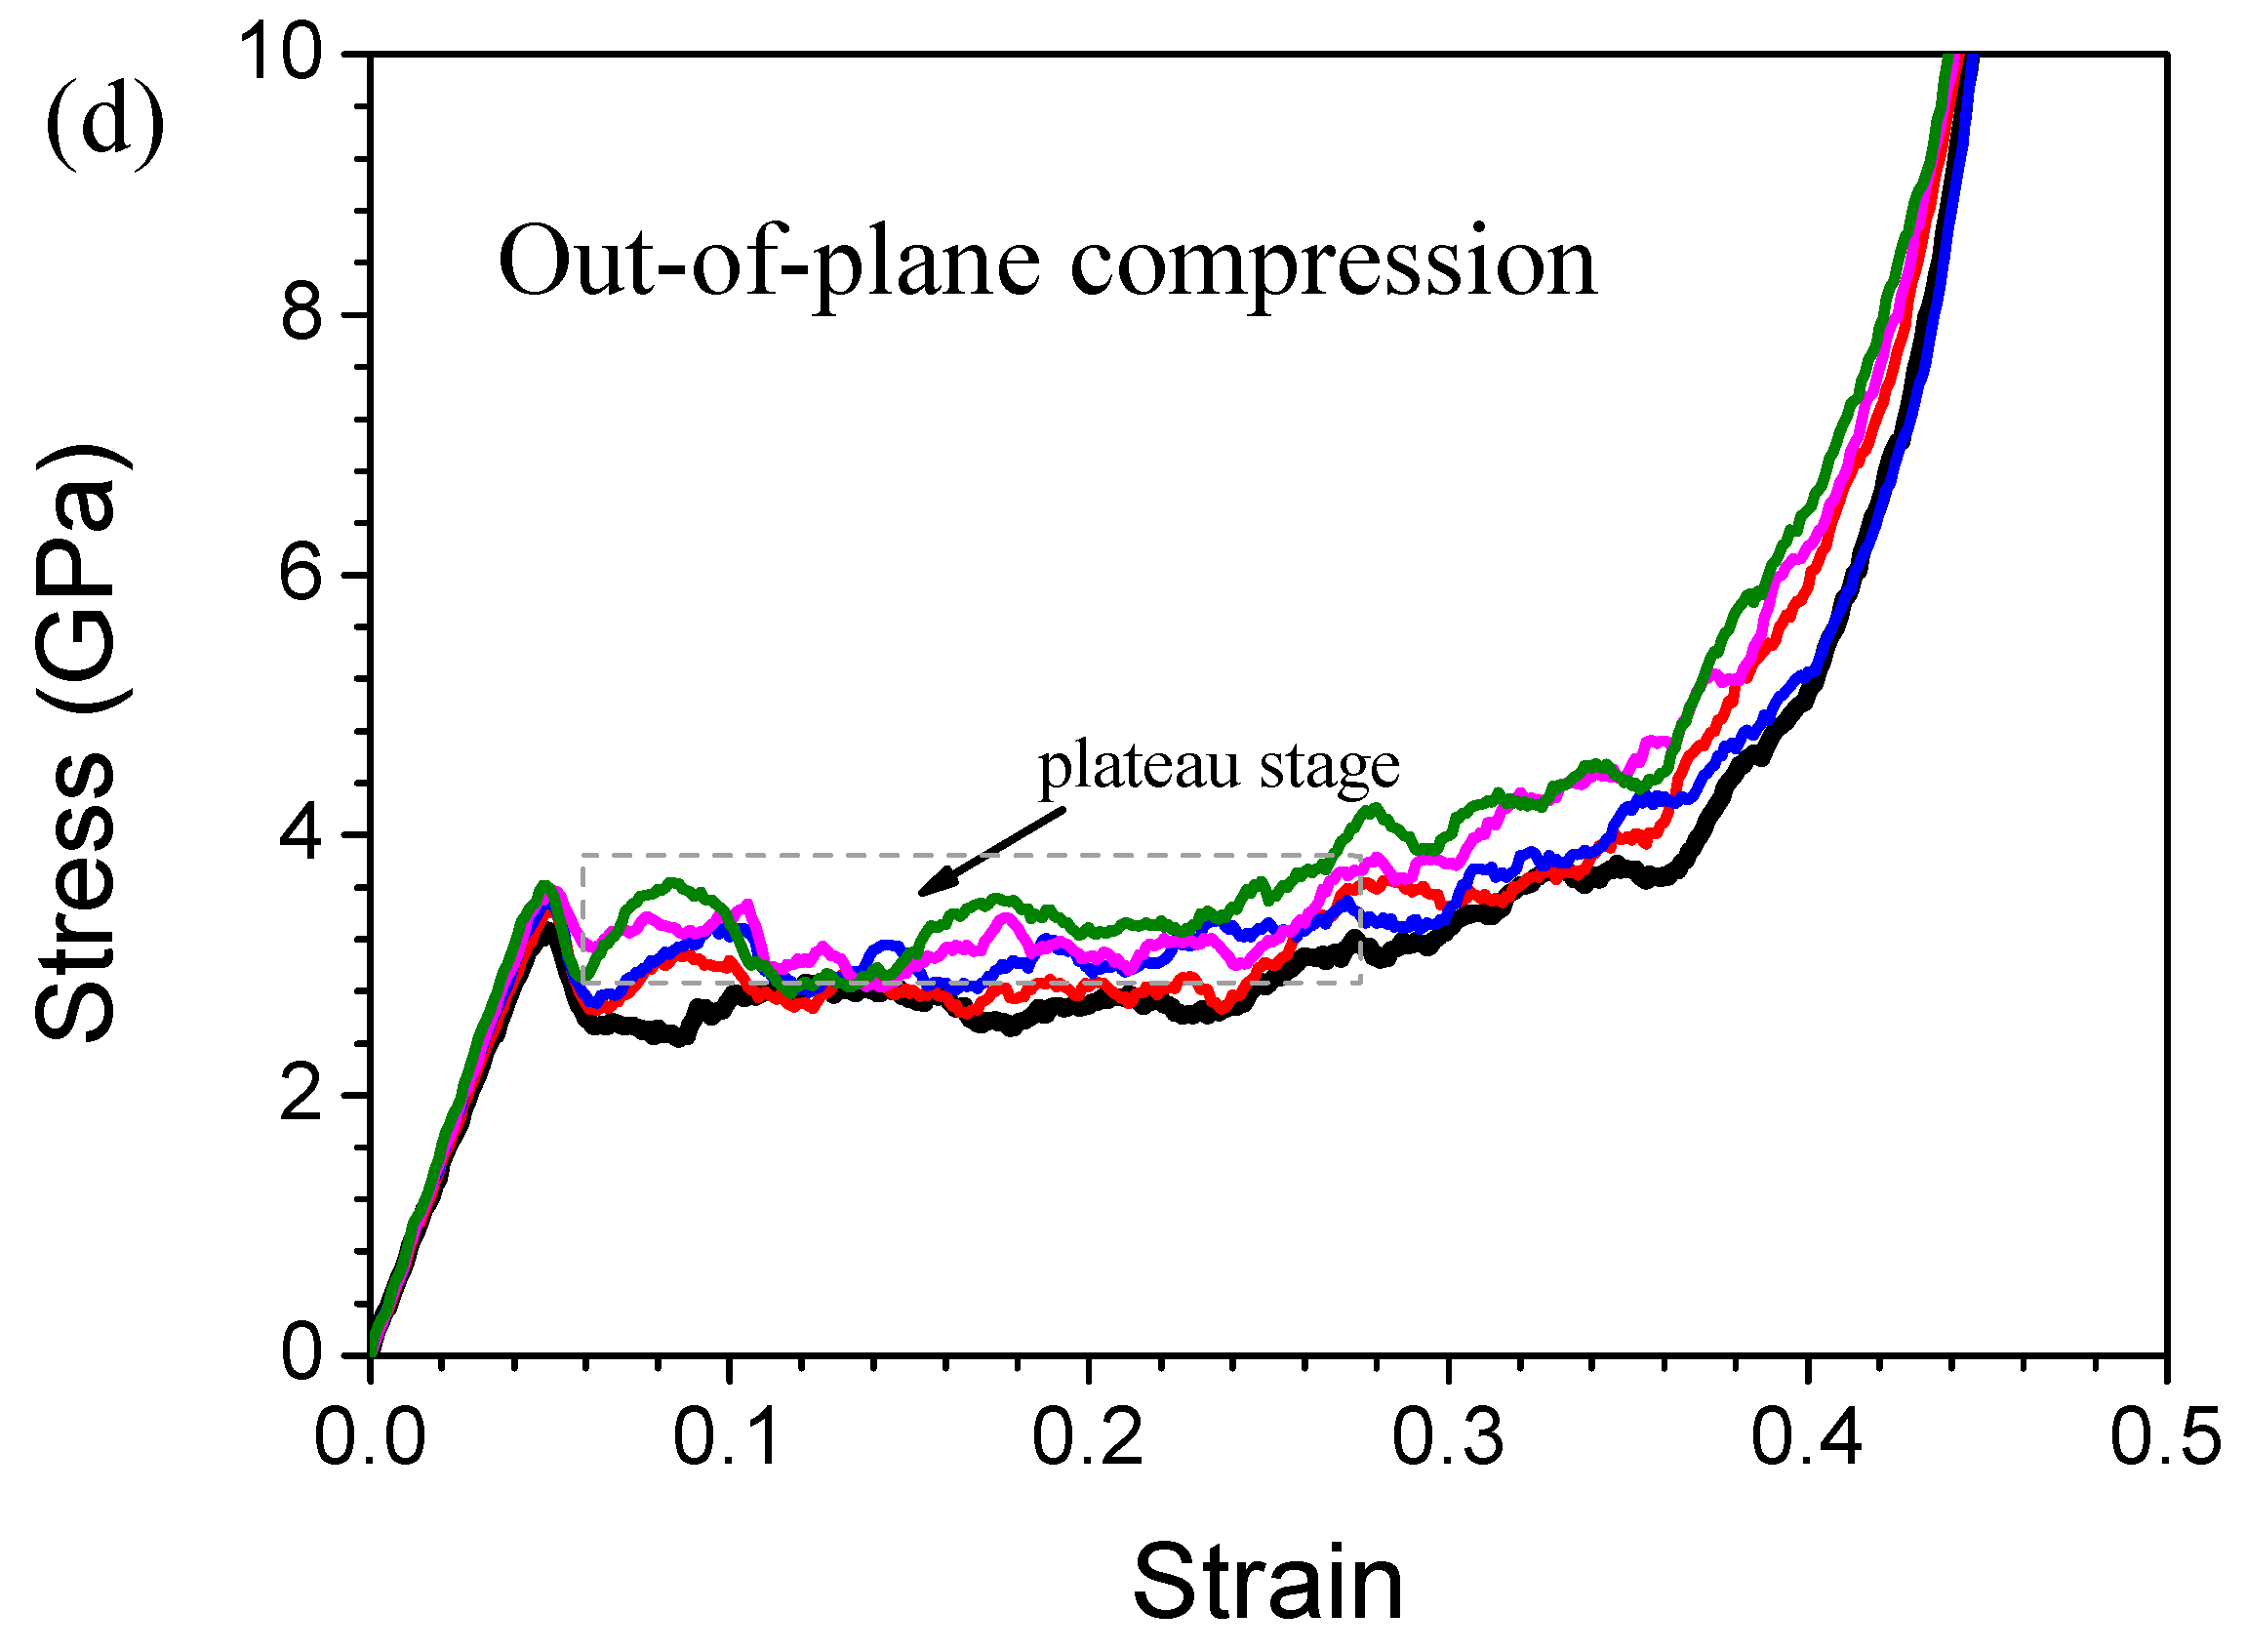
3.1. Stress-Strain Curves and Lattice Structure Evolution of HONNs

It is noted that the stress-strain curves for the groups 1 to 7 HONNs have the same trend and they just differ in the magnitude of the values. Without loss of generality, here we choose the 4th group of HONNs as examples to investigate the mechanical behavior and lattice structure evolution of the HONNs during the in-plane and out-of-plane tension and compression. Figure 2a,c show the stress-strain curves of the HONNs and Figure 2b,d show the corresponding variation of the fraction η of hexagonal close-packed (HCP) atoms with strain. The fraction η of HCP atoms is calculated by η = NHCP/Nall, where NHCP is the total number of HCP atoms and Nall is the total number of atoms in the sample. In order to study the relationship between stress-strain curves and the fraction η of HCP atoms, Figure 2a,b are divided by dash lines A, B, C and D (with the black dash lines A and C corresponding to the in-plane direction and the red dash lines B and D corresponding to the out-of-plane direction), respectively, while Figure 2c,d are divided by dash lines E to J, noticing that lines F and G are overlapped and indicated by blue line specially.
It can be seen from Figure 2a that the in-plane and out-of-plane tensile curves have the same trend. Taking the in-plane tensile curve as example, the stress-strain curve of tension can be divided into two stages (as shown in Figure 2a): (It) initial linear elastic stage and (IIt) the strain-softening and rupture. At the beginning of tension, sample enters into the linear elastic stage and reaches the peak stress (defined as the ultimate tensile strength σut) (Stage It). After that the stress decreases as the strain is further increased and finally begins to rupture (Stage IIt). Dash lines A and B correspond to the peak stresses for the in-plane and out-of-plane tension at strain of 0.08 and 0.091, respectively. Figure 2b shows that the fraction η of HCP atoms is at a lower level when the stress reaches ultimate tensile strength σut. After which η sharply rises and reaches the peak value quickly, leading to a dramatic strain-softening (see Figure 2a) because of the accumulation of stacking faults. Figure 3 gives the atomic configurations at different stages based on the common neighbor analysis (CNA) [52]. Figure 3a,d show the atomic snapshots with the strain corresponding to the σut and it can be found that few regions of the samples have transformed into plastic deformation from elastic deformation because a small amount of dislocations and stacking faults are generated. As the applied strain increases to a critical value of 0.236 (dash line C), the fraction η of HCP atoms of the in-plane tension reaches a peak value and the corresponding stress-strain curve exhibits a faster softening rate when the applied strain exceeds the critical value of 0.236. Figure 3b shows the atomic snapshot with strain of 0.236 for the in-plane tension, which is the result excluding the surface atoms. Cracks can be observed inside the ligament (marked in Figure 3b) and lots of stacking faults are formed around the cracks. As the applied strain further increases, rupture of the sample (marked in Figure 3c) occurs around the strain of 0.32. As for the out-of-plane tension in Figure 3e, a more homogeneous necking is observed compared to the in-plane tension in Figure 3b, so its stress-strain curve shows a more steadily softening rate. When the applied strain increases to the value of 0.423 (dash line D), the fraction η of HCP atoms changes into a nearly steady value from a negative slope and then the corresponding stress-strain curve exhibits a slightly faster softening rate due to the rupture of the samples (marked in Figure 3f).
As for compression, it can be seen from Figure 2c that the stress-strain curves of the in-plane and out-of-plane compressions also have the same trend. Taking the in-plane compression as example, the stress-strain curves of compression can be divided into four stages (as shown in Figure 2c): (Ic) initial linear elastic stage, (IIc) instability of pore, (IIIc) collapse propagation and (IVc) densification stage. At the beginning of compression, sample enters into the linear elastic stage and reaches the peak stress (defined as the ultimate compressive strength σuc) (Stage Ic). After reaching the peak stress, the pores become unstable and begin to collapse, which shows a dramatic strain-softening in stress-strain curve (Stage IIc) and then the collapse begins to propagate, which causes a plateau stage in stress-strain curve (Stage IIIc). Finally, the strain-hardening effect becomes noticeable in the stress-strain curves which means the sample enters into densification stage (Stage IVc). The densification strain εd can be determined roughly by the intersection of tangents to the stress–strain curve for the cell wall collapse regime and densification regime [53]. Dash lines E and F correspond to the peak stresses for the out-of-plane and in-plane compressions at a strain of 0.049 and 0.068, respectively. Similar to the tension η-strain curves, the fraction η of HCP atoms has a very small value when the stress reaches the ultimate compressive strength σuc. From the atomic snapshots corresponding to σuc as shown in Figure 3g,j, it can be seen that, a few regions of the sample have entered into plastic deformation from elastic deformation. And then the sample enters into Stage IIc (see Figure 2c). The end of Stage IIc for the out-of-plane and in-plane compressions is divided by dash lines G and H at strain of 0.068 and 0.102, respectively. Figure 3d shows that the fractions η of HCP atoms rise sharply during Stage IIc. The atomic snapshots at the strain of 0.068 and 0.102 shown in Figure 3h,k hints that more and more dislocations and stacking faults are generated during Stage IIc. After that the fractions η of HCP atoms slowly increase through the Stage IIIc and enter into Stage IVc eventually. The atomic snapshots at the densification strain determined by tangent corresponding to dash lines I and J are shown in Figure 3i,l, in which the void is completely filled with the atoms and the RVE is nearly densified accompanied with lots of dislocations and stacking faults.

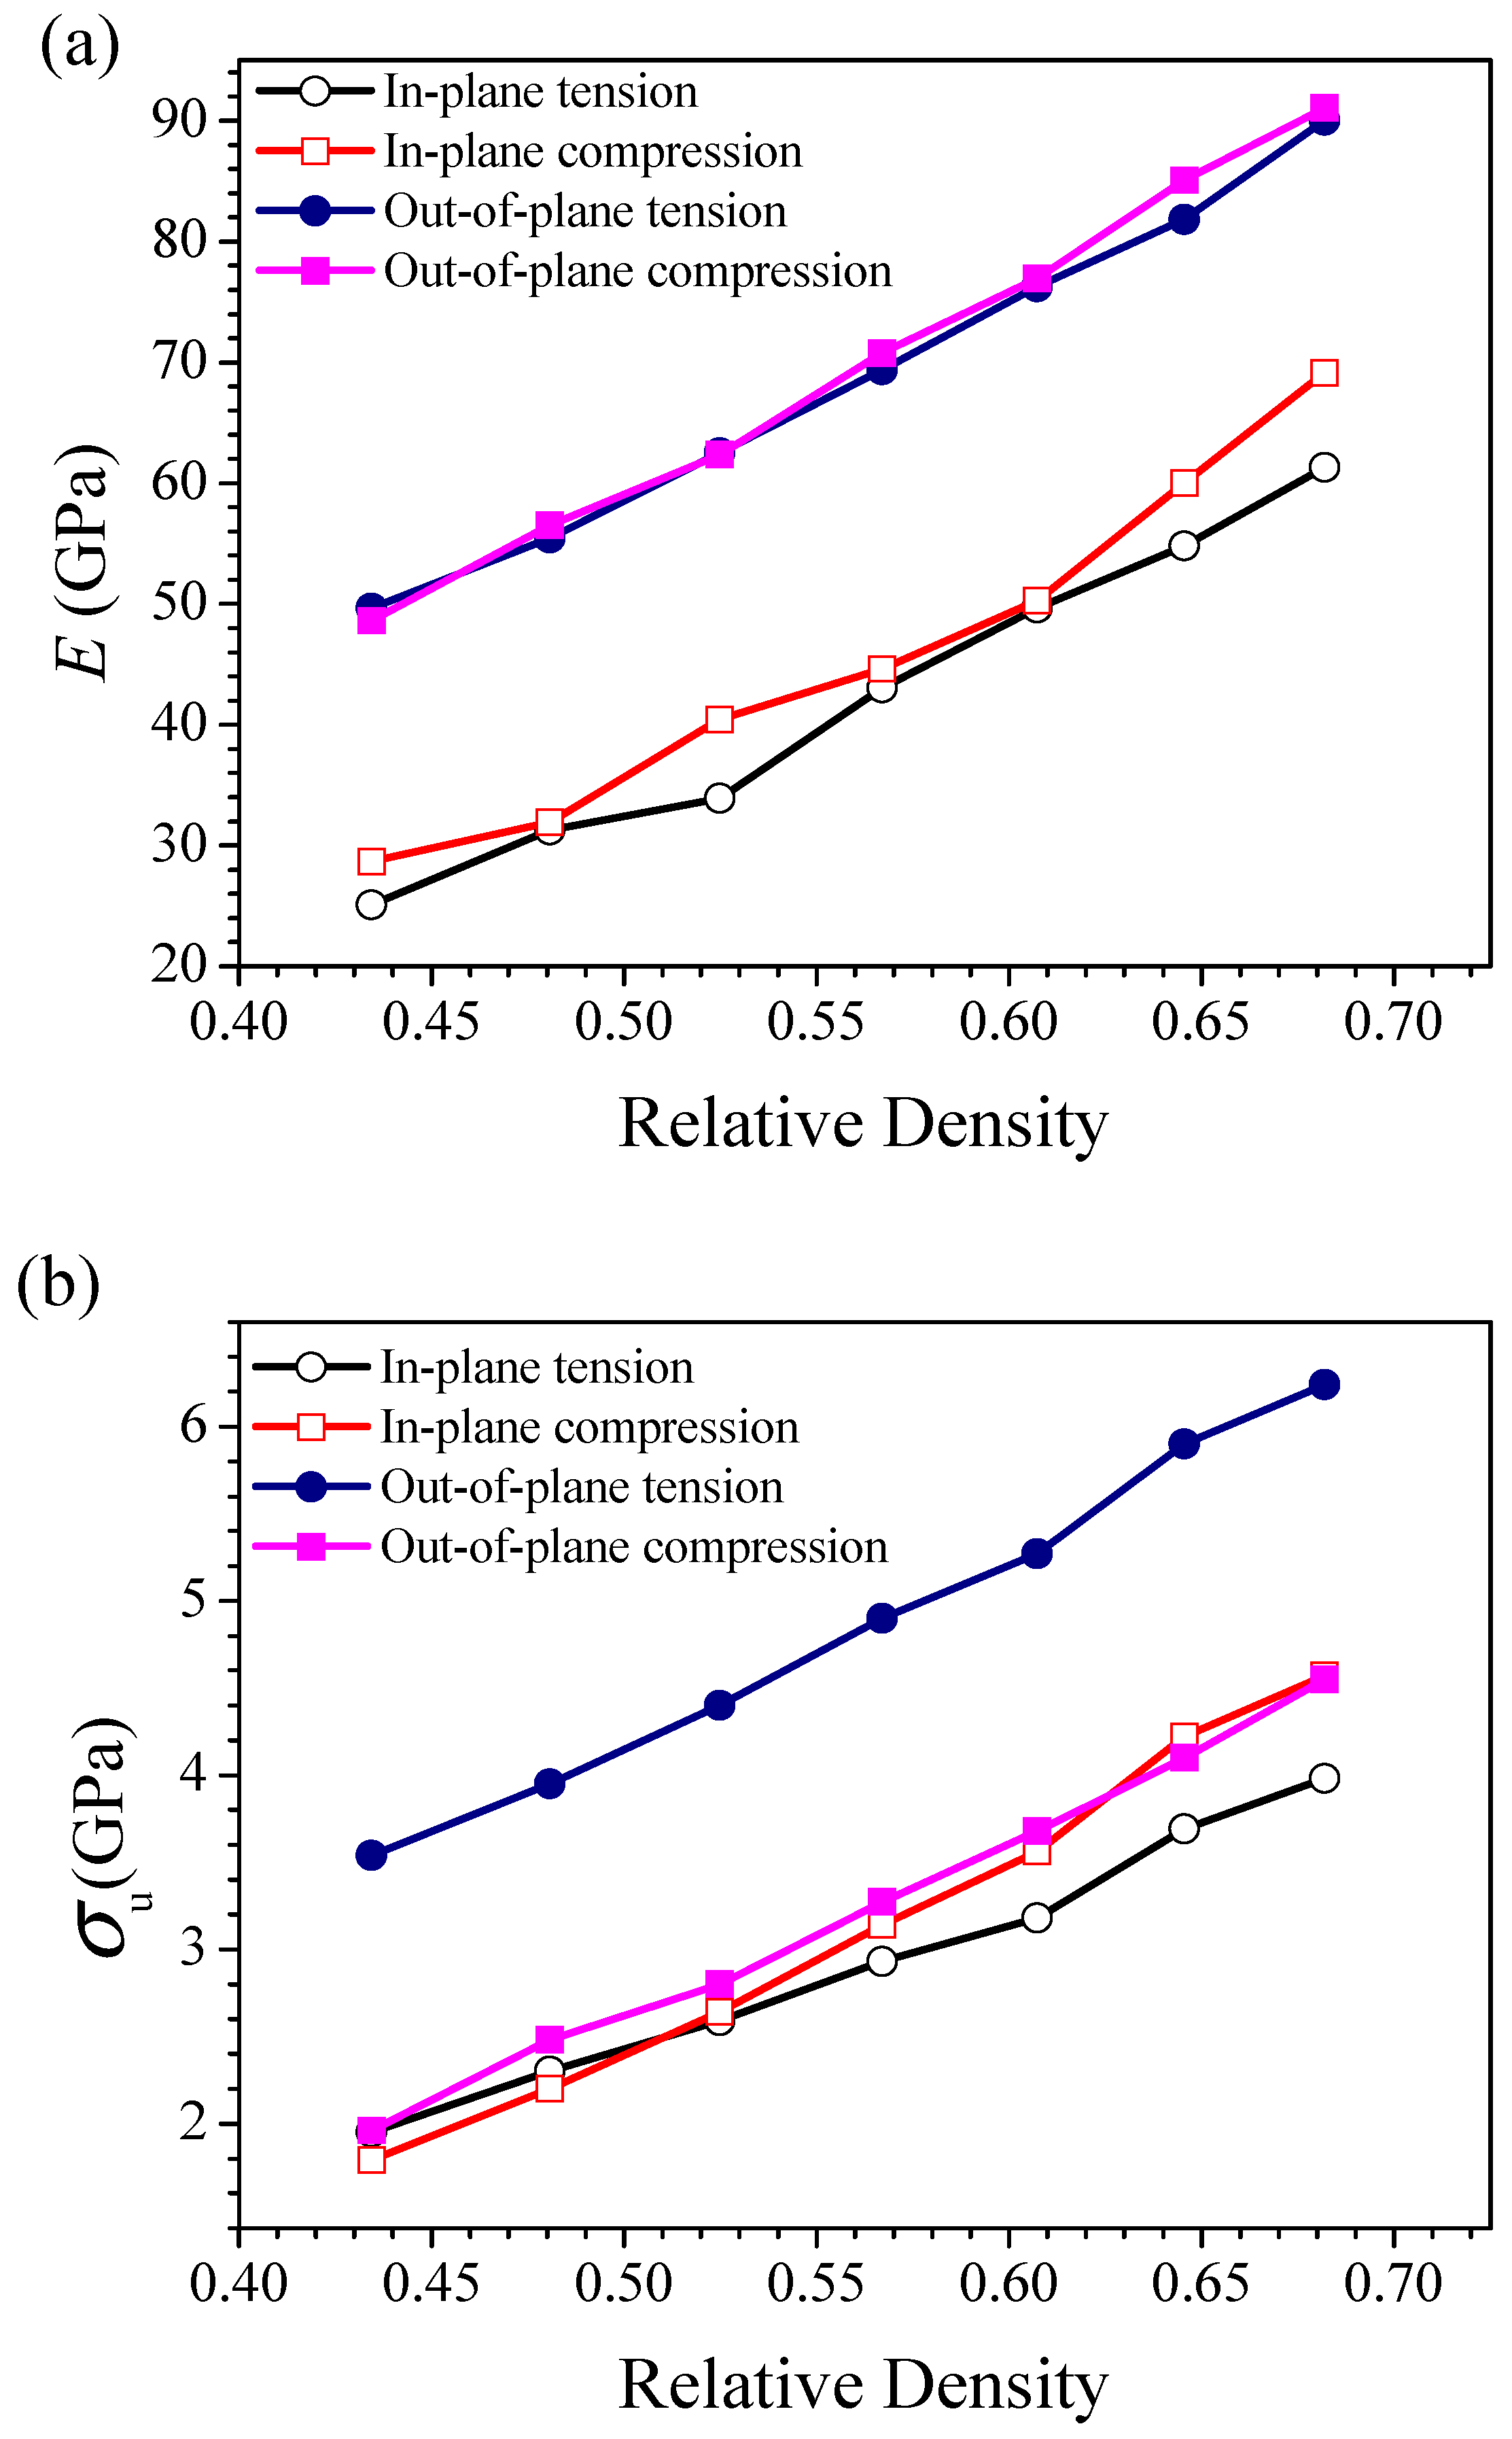
3.2. Mechanical Properties of HONNs

In this section, we focus on Young’s modulus E and ultimate strength σu of the HONNs. As shown in Figure 4a,b, they strongly depend on the relative density and loading direction and show approximately linear relationship in both Young’s modulus E and ultimate strength σu with respect to the relative density. The Young’s moduli E (as shown in Figure 4a) increase with the increase of the relative density and the out-of-plane Young’s moduli E are obviously higher than the in-plane Young’s moduli, which is similar to traditional honeycomb materials [54]. The compressive moduli are slightly bigger than the tensile moduli in the in-plane direction, while they are almost equal in the out-of-plane direction. Similar to the E, the ultimate strengths σu (as shown in Figure 4b) increase with the increase of the relative density. Figure 4b also shows that the ultimate strengths of out-of-plane tension are significantly higher than those in other three cases. It is noted that, although the out-of-plane compressive Young’s moduli E are higher than both the in-plane tensile and compressive Young’s moduli, the ultimate strengths of out-of-plane compression have similar values with both the in-plane tension and compression owing to the smaller strain (around 0.05) corresponding to the ultimate strengths.
As the relative density changes from 0.43 to 0.68, in the in-plane direction, the tensile modulus increases by 144.1% from 25.1 GPa to 61.28 GPa; the compressive modulus increases by 141% from 28.7 GPa to 61.17 GPa; σut increases by 104.1% from 1.95 GPa to 3.69 GPa; and σuc increases by 155.3% from 1.79 GPa to 4.57 GPa. For the out-of-plane direction, the tensile modulus increases from 49.66 GPa to 90.06 GPa by 81.3%; the compressive modulus increases from 48.63 GPa to 91.06 GPa by 87.2%; σut increases from 3.54 GPa to 6.24 GPa by 76.2%; and σuc increases from 1.96 GPa to 4.55 GPa by 132.1%. From Figure 4 it can be seen that the out-of-plane mechanical properties are generally superior to those of the in-plane direction. The main reason for this phenomenon is the in-plane direction has a weakness in ligament (marked in Figure 3b,c) which may induce stress concentration and lead to successive deformation and rupture of ligament. Compared with the in-plane direction, the samples have a more homogeneous deformation in the out-of-plane direction.

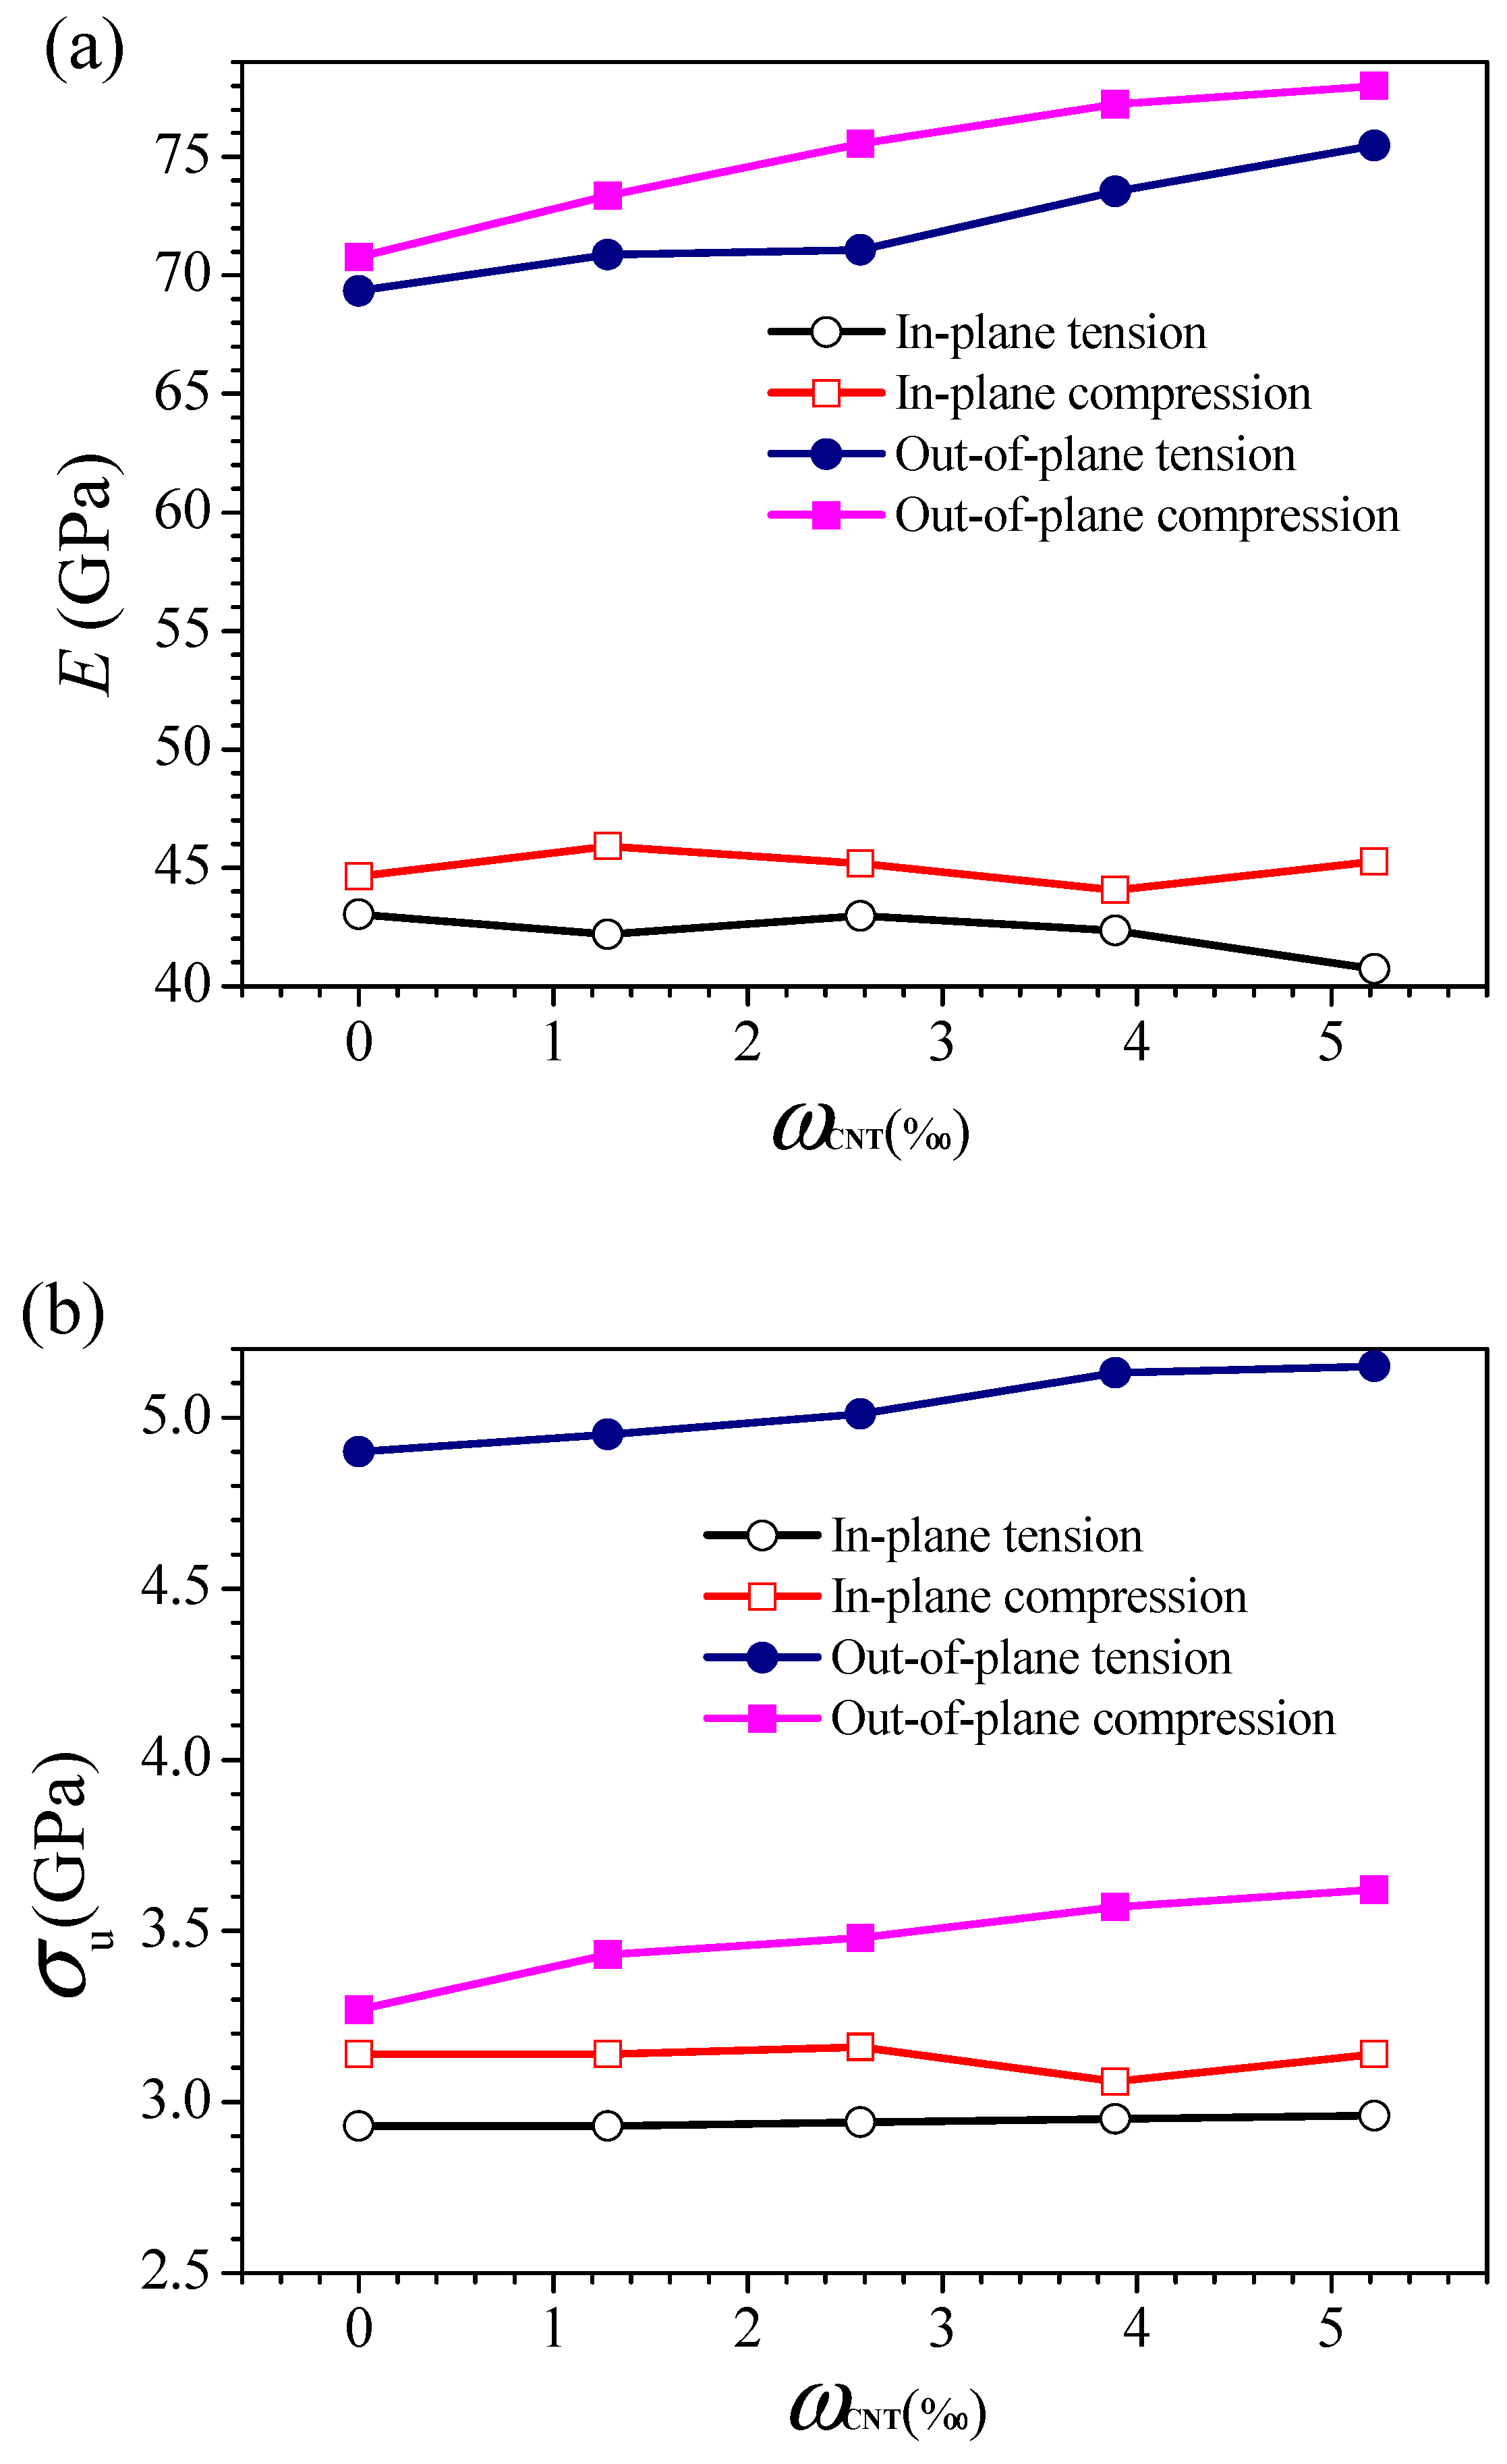
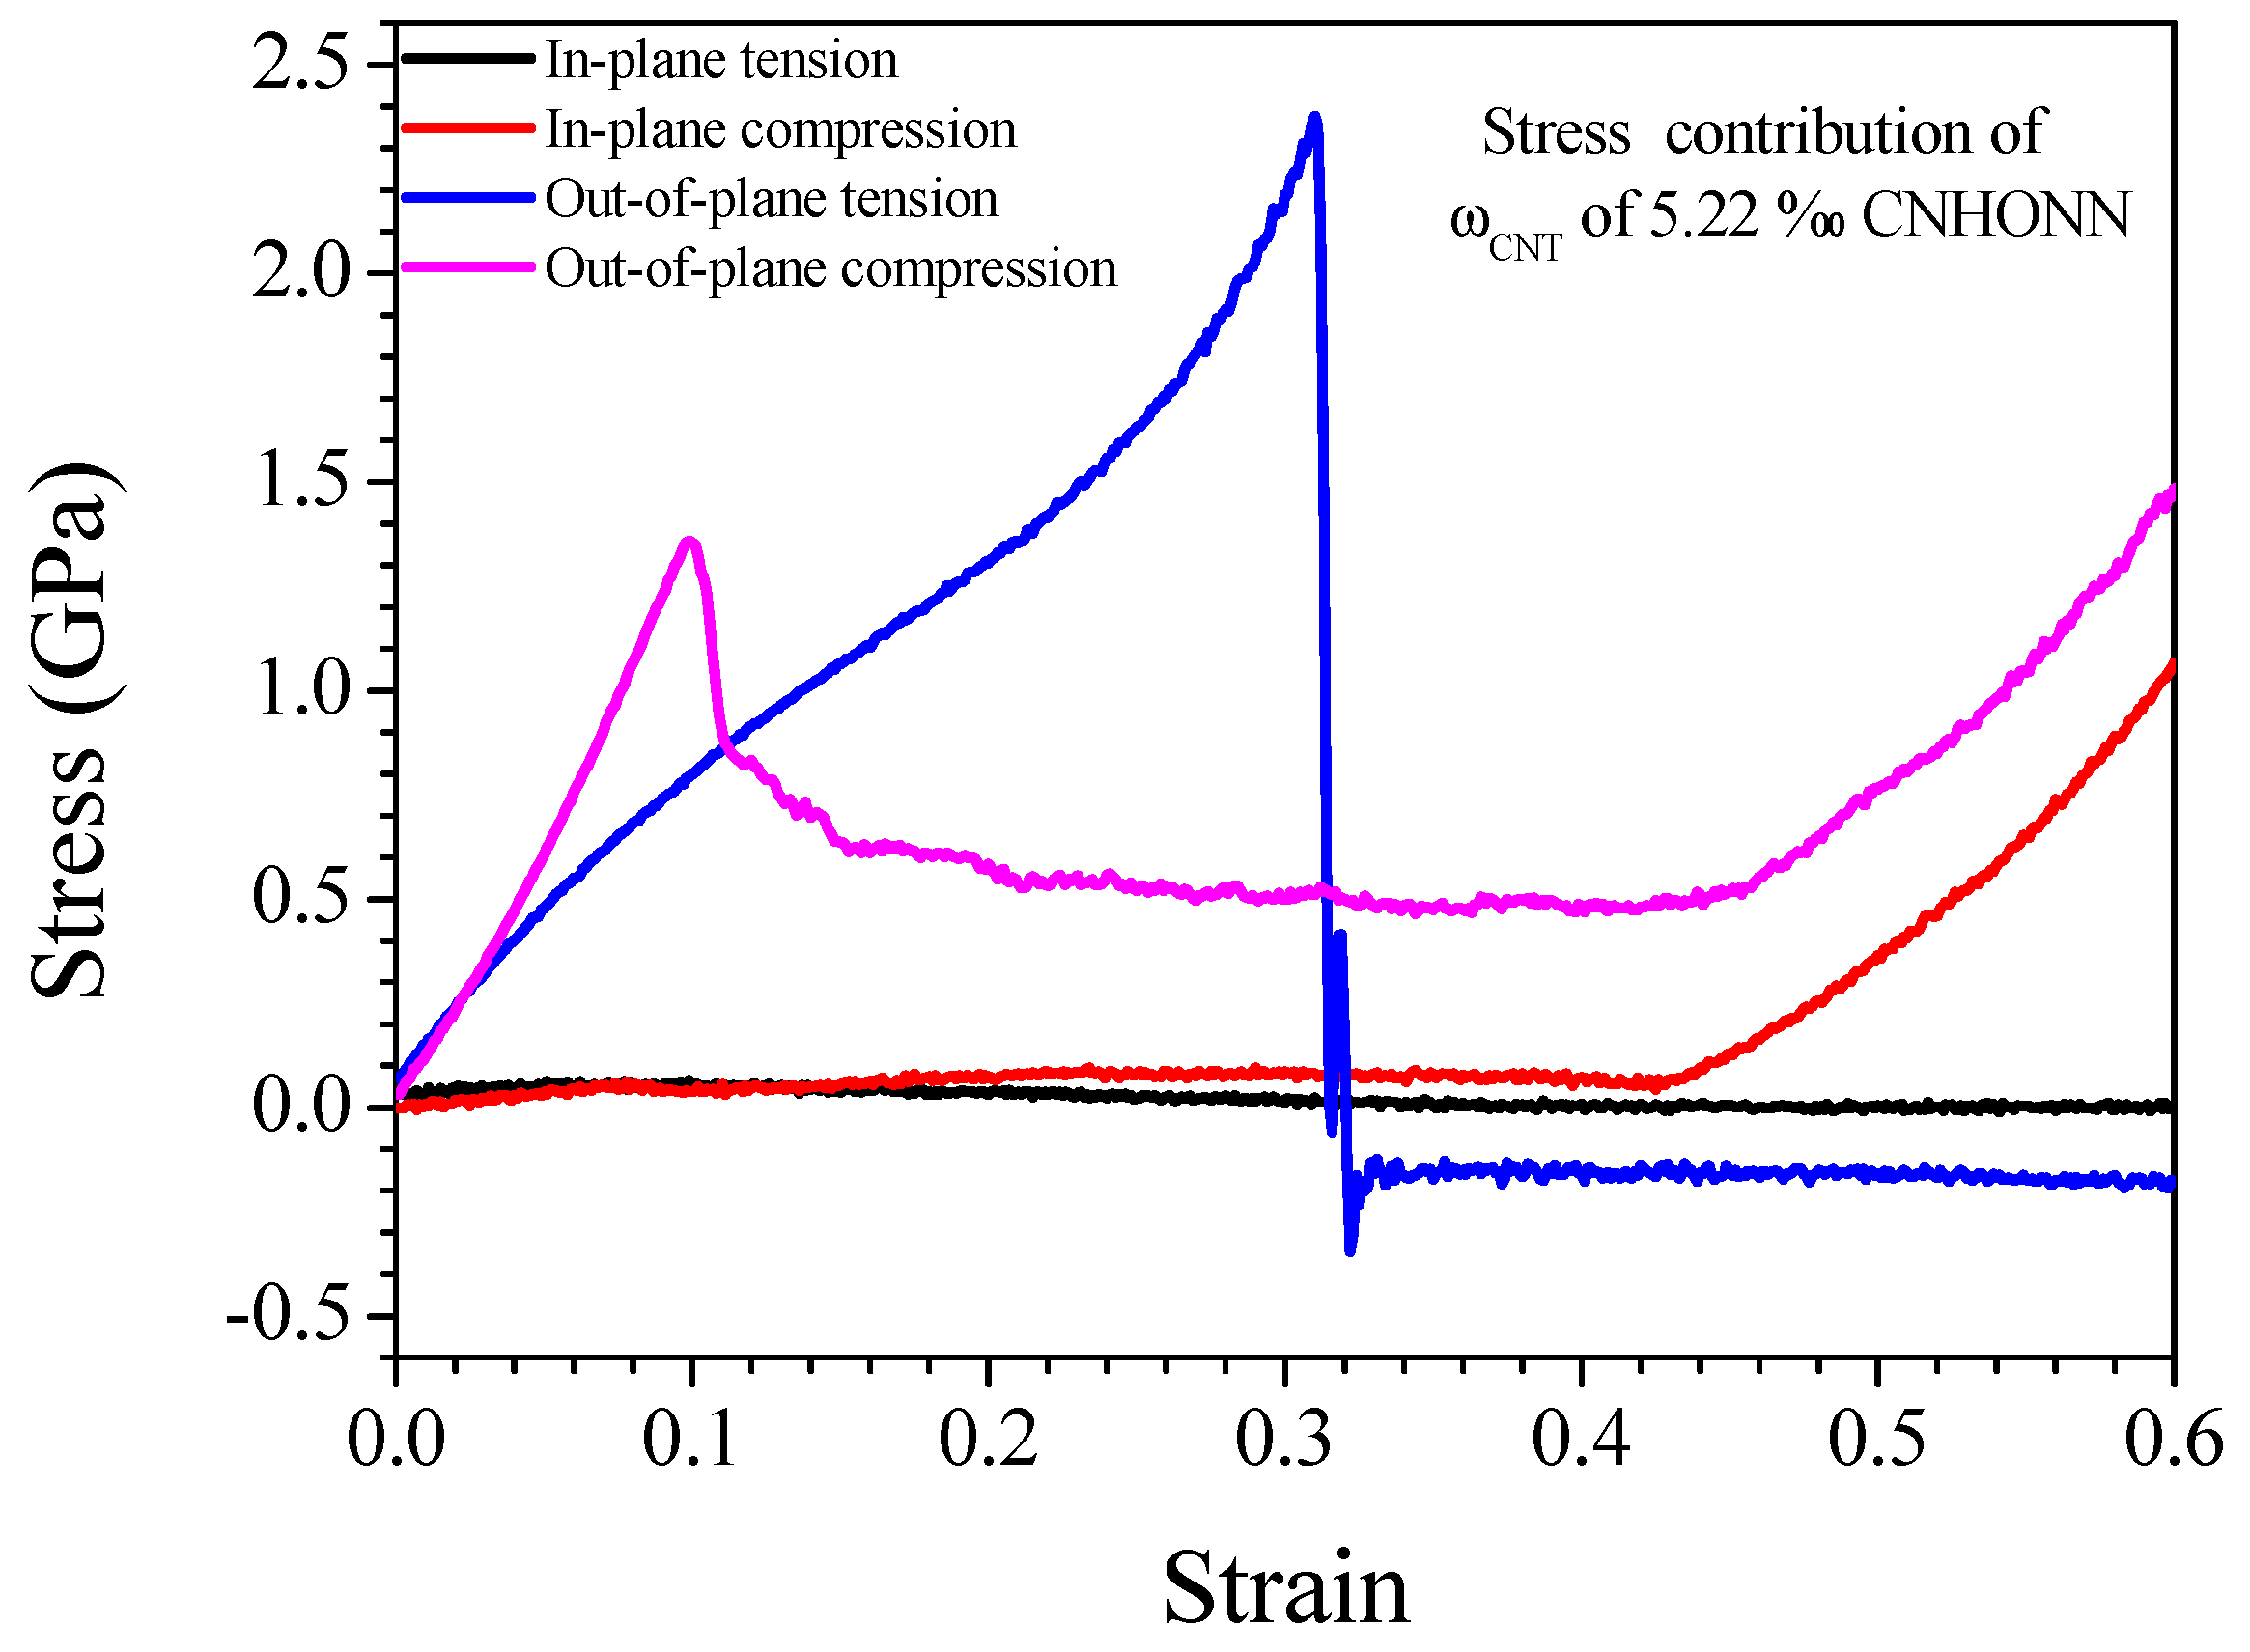
3.3. Effect of CNTs on Mechanical Properties

Figure 5 plot the mechanical properties of Group 4 (as listed in Table 1) of the CNHONNs with different additions of CNTs ωCNT, suggesting that the effect of CNTs strongly depends on deforming direction. In the out-of-plane direction, both the tensile and compressive mechanical properties increase with the increase of ωCNT. As compared to the HONNs with the same relative density, the increase of mass fraction ωCNT of CNTs ranging from 1.28‰ to 5.22‰ can make the increase of the tensile modulus ranging from 2.2% to 8.8%, the tensile strength ranging from 1% to 5.1%, the compressive modulus ranging from 3.6% to 10.2%, the compressive strength ranging from 4.9% to 10.7%. But in the in-plane direction, the mechanical properties of CNHONNs cannot be strengthened or even may be weakened by the addition of CNTs.
Figure 6 plots the average stress of the CNTs embedded in the CNHONNs with a ωCNT of 5.22‰ with respect to strain. The stresses in the CNTs considerably depend on the loading directions. Compared to the in-plane tension and compression, Figure 6 shows that the CNTs can bear more loads during the out-of-plane loadings, resulting in a better reinforcement of CNHONNs in the out-of-plane direction due to the addition of CNTs. The interface between CNT and Ni is so weak that the load cannot be effectively transferred in the in-plane direction, resulting in defects at the interface, which is similar to the CNT-reinforced metallic glass nanocomposites [40]. This is why the in-plane mechanical properties of the CNHONNs are similar to those of the HONNs and sometimes they are lower than those of HONNs, as evidenced by the result in Figure 5. The main reason for the difference in the in-pane and out-of-plane reinforcing effect of CNTs is the anisotropy of CNTs and the weak interfacial bonding between C and Ni.
Moreover, the stress-strain curves of CNHONN are shown in Figure 7. As for the in-plane tension (see Figure 7a), it can be seen that as the strain increases, the stresses increase linearly for all samples at the initial stage up to peak stresses (i.e., the ultimate strengths) around a strain of 0.08 and then drop sharply owing to the fracture of Ni matrix. The toughness of the CNHONNs, except the ωCNT of 3.89‰, is slightly higher than that of the HONNs. As for the in-plane compression (see Figure 7b), the stress-strain curves of all samples almost overlapped and reach a peak stress around a strain of 0.068. For out-of-plane tension (see Figure 7c), similar to the in-plane tension, the stresses reach peak values around a strain of 0.088 and then decrease dramatically. Particularly, the area under the curve between the 0.12 and 0.31 of strain values largely increases with the increase of ωCNT indicating that the endurance capability of the CNHONNs can be enhanced by the addition of the CNTs, even after the nickel matrix fractures. At around a strain of 0.31, the second sharp decline occurs in the stress-strain curves of the CNHONNs due to the failure of the CNTs. As for the out-of-plane compression (see Figure 7d), the stresses reach peak values around the strain of 0.05 and the plateau stresses generally increase with the increase of ωCNT, which demonstrates that the energy absorption capacity of the CNHONNs can be improved by the addition of the CNTs.

4. Conclusions

In the present study, MD simulations were conducted to investigate the mechanical behavior of HONNs with different relative densities and CNHONNs with different ωCNT. The stress-strain curves of HONN were obtained under the in-plane tension and compression, out-of-plane tension and compression. The variations of the curves were analyzed through MD snapshots which enable detailed analyses of atomic behaviors. The fraction of HCP atoms was also given to explain the deformation mechanism in the HONNs. The overall mechanical properties of the HONNs, such as Young’s modulus E and ultimate strength σu, linearly increase with the increase of the relative density and in the out-of-plane direction they are generally superior to those in the in-plane direction. As for the effects of CNTs to the mechanical properties of CNHONNs, it strongly depends on loading directions. Our analysis revealed that, compared to the in-plane loadings, the CNTs can bear more loads during the out-of-plane loadings (i.e., the axial direction of the CNTs), resulting in a better reinforcement of CNHONNs in the out-of-plane direction due to the addition of CNTs. Furthermore, CNTs show a nice reinforced effect on energy absorption capacity in out-of-plane direction.

Author Contributions

Conceptualization, Y.Z. and W.-G.J.; Methodology, D.-S.L.; Software, Y.Z.; Validation, Y.Z., W.-G.J. and Q.-H.Q.; Formal Analysis, D.-S.L.; Investigation, Y.Z.; Resources, W.-G.J.; Data Curation, D.-S.L.; Writing-Original Draft Preparation, Y.Z. and W.-G.J.; Writing-Review & Editing, Q.-H.Q.; Visualization, Y.Z.; Supervision, W.-G.J.; Project Administration, W.-G.J.; Funding Acquisition, W.-G.J.

Funding

This research was funded by National Natural Science Foundation of China (grant number 11772145 and 11372126).

Acknowledgments

This work was supported by the National Natural Science Foundation of China (Grant Nos. 11772145 and 11372126).

Conflicts of Interest

The authors declare no conflict of interest.

References

  1. Larminie, J.; Dicks, A. Fuel Cell Systems Explained, 2nd ed.; John Wiley & Sons Ltd.: West Sussex, UK, 2003. [Google Scholar]
  2. Ivers-Tiffee, E.; Weber, A.; Herbstritt, D. Materials and technologies for sofc-components. J. Eur. Ceram. Soc. 2001, 21, 1805–1811. [Google Scholar] [CrossRef]
  3. Radovic, M.; Lara-Curzio, E. Mechanical properties of tape cast nickel-based anode materials for solid oxide fuel cells before and after reduction in hydrogen. Acta Mater. 2004, 52, 5747–5756. [Google Scholar] [CrossRef]
  4. Martinez, A.; Gerdes, K.; Gemmen, R.; Poston, J. Thermodynamic analysis of interactions between ni-based solid oxide fuel cells (sofc) anodes and trace species in a survey of coal syngas. J. Power Sources 2010, 195, 5206–5212. [Google Scholar] [CrossRef]
  5. Mukhopadhyay, M.; Mukhopadhyay, J.; Sharma, A.D.; Basu, R.N. Effect of anode configuration on electrical properties and cell polarization in planar anode supported sofc. Solid State Ion. 2013, 233, 20–31. [Google Scholar] [CrossRef]
  6. Nelson, P.A.; Elliott, J.M.; Attard, G.S.; Owen, J.R. Mesoporous nickel/nickel oxide-a nanoarchitectured electrode. Chem. Mater. 2002, 14, 524–529. [Google Scholar] [CrossRef]
  7. Nelson, P.A.; Owen, J.R. A high-performance supercapacitor/battery hybrid incorporating templated mesoporous electrodes. J. Electrochem. Soc. 2003, 150, A1313. [Google Scholar] [CrossRef]
  8. Xu, M.; Li, T.; Yang, M.; Andersson, M. Solid oxide fuel cell interconnect design optimization considering the thermal stresses. Sci. Bull. 2016, 61, 1333–1344. [Google Scholar] [CrossRef] [Green Version]
  9. Iijima, S. Helical microtubules of graphitic carbon. Nature 1991, 354, 56. [Google Scholar] [CrossRef]
  10. Treacy, M.J.; Ebbesen, T.; Gibson, J. Exceptionally high young’s modulus observed for individual carbon nanotubes. Nature 1996, 381, 678. [Google Scholar] [CrossRef]
  11. Ebbesen, T.; Lezec, H.; Hiura, H.; Bennett, J.; Ghaemi, H.; Thio, T. Electrical conductivity of individual carbon nanotubes. Nature 1996, 382, 54. [Google Scholar] [CrossRef]
  12. Berber, S.; Kwon, Y.K.; Tománek, D. Unusually high thermal conductivity of carbon nanotubes. Phys. Rev. Lett. 2000, 84, 4613. [Google Scholar] [CrossRef] [PubMed]
  13. Qiao, Y.; Li, C.M.; Bao, S.J.; Bao, Q.L. Carbon nanotube/polyaniline composite as anode material for microbial fuel cells. J. Power Sources 2007, 170, 79–84. [Google Scholar] [CrossRef]
  14. Jiang, J.; Liu, J.; Zhou, W.; Zhu, J.; Huang, X.; Qi, X.; Zhang, H.; Yu, T. Cnt/ni hybrid nanostructured arrays: Synthesis and application as high-performance electrode materials for pseudocapacitors. Energy Environ. Sci. 2011, 4, 5000–5007. [Google Scholar] [CrossRef]
  15. Xie, X.; Hu, L.; Pasta, M.; Wells, G.F.; Kong, D.; Criddle, C.S.; Cui, Y. Three-dimensional carbon nanotube-textile anode for high-performance microbial fuel cells. Nano Lett. 2011, 11, 291–296. [Google Scholar] [CrossRef] [PubMed]
  16. Peigney, A.; Laurent, C.; Flahaut, E.; Rousset, A. Carbon nanotubes in novel ceramic matrix nanocomposites. Ceram. Int. 2000, 26, 677–683. [Google Scholar] [CrossRef] [Green Version]
  17. Qian, D.; Dickey, E.C.; Andrews, R.; Rantell, T. Load transfer and deformation mechanisms in carbon nanotube-polystyrene composites. Appl. Phys. Lett. 2000, 76, 2868–2870. [Google Scholar] [CrossRef] [Green Version]
  18. Curtin, W.A.; Sheldon, B.W. Cnt-reinforced ceramics and metals. Mater. Today 2004, 7, 44–49. [Google Scholar] [CrossRef]
  19. Frandsen, H.L.; Ramos, T.; Faes, A.; Pihlatie, M.; Brodersen, K. Optimization of the strength of sofc anode supports. J. Eur. Ceram. Soc. 2012, 32, 1041–1052. [Google Scholar] [CrossRef]
  20. Zeng, S.; Xu, M.; Parbey, J.; Yu, G.; Andersson, M.; Li, Q.; Li, B.; Li, T. Thermal stress analysis of a planar anode-supported solid oxide fuel cell: Effects of anode porosity. Int. J. Hydrogen Energy 2017, 42, 20239–20248. [Google Scholar] [CrossRef]
  21. Sun, Y.; Sun, J.; Liu, M.; Chen, Q. Mechanical strength of carbon nanotube–nickel nanocomposites. Nanotechnology 2007, 18, 505704. [Google Scholar] [CrossRef]
  22. Hwang, J.Y.; Neira, A.; Scharf, T.W.; Tiley, J.; Banerjee, R. Laser-deposited carbon nanotube reinforced nickel matrix composites. Scr. Mater. 2008, 59, 487–490. [Google Scholar] [CrossRef]
  23. Dai, P.-Q.; Xu, W.-C.; Huang, Q.-Y. Mechanical properties and microstructure of nanocrystalline nickel-carbon nanotube composites produced by electrodeposition. Mater. Sci. Eng. A 2008, 483–484, 172–174. [Google Scholar] [CrossRef]
  24. Hwang, J.Y.; Lim, B.K.; Tiley, J.; Banerjee, R.; Hong, S.H. Interface analysis of ultra-high strength carbon nanotube/nickel composites processed by molecular level mixing. Carbon 2013, 57, 282–287. [Google Scholar] [CrossRef]
  25. Borkar, T.; Hwang, J.; Hwang, J.Y.; Scharf, T.W.; Tiley, J.; Hong, S.H.; Banerjee, R. Strength versus ductility in carbon nanotube reinforced nickel matrix nanocomposites. J. Mater. Res. 2014, 29, 761–769. [Google Scholar] [CrossRef]
  26. Song, Q.S.; Aravindaraj, G.K.; Sultana, H.; Chan, S.L.I. Performance improvement of pasted nickel electrodes with multi-wall carbon nanotubes for rechargeable nickel batteries. Electrochim. Acta 2007, 53, 1890–1896. [Google Scholar] [CrossRef]
  27. Liu, X.; Gurel, V.; Morris, D.; Murray, D.W.; Zhitkovich, A.; Kane, A.B.; Hurt, R.H. Bioavailability of nickel in single-wall carbon nanotubes. Adv. Mater. 2007, 19, 2790–2796. [Google Scholar] [CrossRef]
  28. Chen, Y.S.; Huang, J.H. Arrayed cnt-ni nanocomposites grown directly on si substrate for amperometric detection of ethanol. Biosens. Bioelectron. 2010, 26, 207–212. [Google Scholar] [CrossRef] [PubMed]
  29. Choi, T.; Kim, S.H.; Lee, C.W.; Kim, H.; Choi, S.K.; Kim, S.H.; Kim, E.; Park, J.; Kim, H. Synthesis of carbon nanotube-nickel nanocomposites using atomic layer deposition for high-performance non-enzymatic glucose sensing. Biosens. Bioelectron. 2015, 63, 325–330. [Google Scholar] [CrossRef]
  30. Zhou, Y.; Jiang, W.G.; Feng, X.Q.; Li, D.S.; Qin, Q.H.; Liu, X.B. In-plane compressive behavior of graphene-coated aluminum nano-honeycombs. Comput. Mater. Sci. 2019, 156, 396–403. [Google Scholar] [CrossRef]
  31. Qin, Z.; Qin, Q.H.; Feng, X.Q. Mechanical property of carbon nanotubes with intramolecular junctions: Molecular dynamics simulations. Phys. Lett. A 2008, 372, 6661–6666. [Google Scholar] [CrossRef]
  32. Esfarjani, K.; Gorjizadeh, N.; Nasrollahi, Z. Molecular dynamics of single wall carbon nanotube growth on nickel surface. Comput. Mater. Sci. 2006, 36, 117–120. [Google Scholar] [CrossRef]
  33. Shibuta, Y.; Maruyama, S. A molecular dynamics study of the effect of a substrate on catalytic metal clusters in nucleation process of single-walled carbon nanotubes. Chem. Phys. Lett. 2007, 437, 218–223. [Google Scholar] [CrossRef]
  34. Oguri, T.; Shimamura, K.; Shibuta, Y.; Shimojo, F.; Yamaguchi, S. Ab initio molecular dynamics simulation of the dissociation of ethanol on a nickel cluster: Understanding the initial stage of metal-catalyzed growth of carbon nanotubes. J. Phys. Chem. C 2013, 117, 9983–9990. [Google Scholar] [CrossRef]
  35. Fukuhara, S.; Shimojo, F.; Shibuta, Y. Conformation and catalytic activity of nickel—Carbon cluster for ethanol dissociation in carbon nanotube synthesis: Ab initio molecular dynamics simulation. Chem. Phys. Lett. 2017, 679, 164–171. [Google Scholar] [CrossRef]
  36. Song, H.Y.; Zha, X.W. Influence of nickel coating on the interfacial bonding characteristics of carbon nanotube–aluminum composites. Comput. Mater. Sci. 2010, 49, 899–903. [Google Scholar] [CrossRef]
  37. Song, H.Y.; Zha, X.W. Mechanical properties of nickel-coated single-walled carbon nanotubes and their embedded gold matrix composites. Phys. Lett. A 2010, 374, 1068–1072. [Google Scholar] [CrossRef]
  38. Zhou, X.; Song, S.; Li, L.; Zhang, R. Molecular dynamics simulation for mechanical properties of magnesium matrix composites reinforced with nickel-coated single-walled carbon nanotubes. J. Compos. Mater. 2015, 50, 191–200. [Google Scholar] [CrossRef]
  39. Duan, K.; Li, L.; Hu, Y.; Wang, X. Enhanced interfacial strength of carbon nanotube/copper nanocomposites via ni-coating: Molecular-dynamics insights. Phys. E Low-Dimens. Syst. Nanostruct. 2017, 88, 259–264. [Google Scholar] [CrossRef]
  40. Rezaei, R.; Shariati, M.; Tavakoli-Anbaran, H.; Deng, C. Mechanical characteristics of cnt-reinforced metallic glass nanocomposites by molecular dynamics simulations. Comput. Mater. Sci. 2016, 119, 19–26. [Google Scholar] [CrossRef]
  41. Silvestre, N.; Faria, B.; Canongia Lopes, J.N. Compressive behavior of cnt-reinforced aluminum composites using molecular dynamics. Compos. Sci. Technol. 2014, 90, 16–24. [Google Scholar] [CrossRef]
  42. Choi, B.K.; Yoon, G.H.; Lee, S. Molecular dynamics studies of cnt-reinforced aluminum composites under uniaxial tensile loading. Compos. Part B Eng. 2016, 91, 119–125. [Google Scholar] [CrossRef]
  43. Zhou, X.; Liu, X.; Sansoz, F.; Shen, M. Molecular dynamics simulation on temperature and stain rate-dependent tensile response and failure behavior of ni-coated cnt/mg composites. Appl. Phys. A 2018, 124, 506. [Google Scholar] [CrossRef]
  44. Stukowski, A. Visualization and analysis of atomistic simulation data with ovito–the open visualization tool. Model. Simul. Mater. Sci. Eng. 2009, 18, 015012. [Google Scholar] [CrossRef]
  45. Plimpton, S. Fast parallel algorithms for short-range molecular dynamics. J. Comput. Phys. 1995, 117, 1–19. [Google Scholar] [CrossRef]
  46. Foiles, S.; Baskes, M.; Daw, M.S. Embedded-atom-method functions for the fcc metals cu, ag, au, ni, pd, pt, and their alloys. Phys. Rev. B 1986, 33, 7983. [Google Scholar] [CrossRef]
  47. Stuart, S.J.; Tutein, A.B.; Harrison, J.A. A reactive potential for hydrocarbons with intermolecular interactions. J. Chem. Phys. 2000, 112, 6472–6486. [Google Scholar] [CrossRef]
  48. Boda, D.; Henderson, D. The effects of deviations from lorentz–berthelot rules on the properties of a simple mixture. Mol. Phys. 2008, 106, 2367–2370. [Google Scholar] [CrossRef]
  49. Kutana, A.; Giapis, K.P. Transient deformation regime in bending of single-walled carbon nanotubes. Phys. Rev. Lett. 2006, 97, 245501. [Google Scholar] [CrossRef]
  50. Jiang, L.Y.; Huang, Y.; Jiang, H.; Ravichandran, G.; Gao, H.; Hwang, K.; Liu, B. A cohesive law for carbon nanotube/polymer interfaces based on the van der waals force. J. Mech. Phys. Solids 2006, 54, 2436–2452. [Google Scholar] [CrossRef]
  51. Yi, L.; Chang, T.; Feng, X.Q.; Zhang, Y.; Wang, J.; Huang, B. Giant energy absorption capacity of graphene-based carbon honeycombs. Carbon 2017, 118, 348–357. [Google Scholar] [CrossRef]
  52. Faken, D.; Jónsson, H. Systematic analysis of local atomic structure combined with 3d computer graphics. Comput. Mater. Sci. 1994, 2, 279–286. [Google Scholar] [CrossRef]
  53. Paul, A.; Ramamurty, U. Strain rate sensitivity of a closed-cell aluminum foam. Mater. Sci. Eng. A 2000, 281, 1–7. [Google Scholar] [CrossRef]
  54. Zhang, J.; Ashby, M. The out-of-plane properties of honeycombs. Int. J. Mech. Sci. 1992, 34, 475–489. [Google Scholar] [CrossRef]
Figure 1. (a) Perspective view and (b) In-plane (top) view (x-y plane) of representative volume elements (RVE) for highly ordered nanoporous nickel (HONN); and in-plane views for CNT-reinoforced HONNs(CNHONNs) with ωCNT of (c) 1.28‰, (d) 2.58‰, (e) 3.89‰ and (f) 5.22‰.
Applsci 09 00352 g001
Figure 2. Stress-strain curves and the hexagonal close-packed (HCP) atom fraction η of group 4 for HONNs along different deformation direction.
Applsci 09 00352 g002
Figure 3. Atomic snapshots at specified macro loading strain: (a, d, g and j) peak stress, (b, e, h and k) stage of collapse or strain-softening, (c, f, i and l) densification or rupture of samples. Identification of atomic configurations is based on common neighbor analysis (CNA) and four types of atoms are painted in different colors: green for face-centered-cubic (FCC) atoms, blue for body-centered-cubic (BCC) atoms, red for hexagonal close-packed (HCP) atoms and gray for non-12-coordinated atoms.
Applsci 09 00352 g003
Figure 4. (a) Young’s modulus E and (b) ultimate strength σu of HONNs with different relative density.
Applsci 09 00352 g004
Figure 5. (a) Young’s modulus E and (b) ultimate strength σu of CNHONNs with different ωCNT of CNTs.
Applsci 09 00352 g005
Figure 6. Stress contribution of CNTs in the CNHONN in the case of ωCNT of 5.22‰ along different deformation direction.
Applsci 09 00352 g006
Figure 7. Stress-strain curves of CNHONNs along different deformation direction: (a) In-plane tension, (b) In-plane compression, (c) Out-of-plane tension and (d) Out-of-plane compression.
Applsci 09 00352 g007aApplsci 09 00352 g007b
Table 1. Parameters of RVEs of HONNs.
GroupRadius of the Pore(Å)Relative DensityNumber of Atoms
142.240.43112,720
240.480.48123,920
338.720.52134,800
436.960.57146,320
535.20.61155,680
633.440.65165,840
731.680.68175,440

