1. Introduction
In the field of historical buildings, the role of monitoring and diagnostics is increasingly important for the purpose of securing the masonry structures and also the decorative apparatuses. Often the normal degradation over time or the external climatic causes can compromise the stability of historical plasters [
1,
2]. The potential detachment of plaster can be further dangerous if it comes from masonry vaults, with the risk of material inside historical buildings containing residential or public functions falling. The Non-Destructive Testing Laboratory of the Politecnico di Torino introduced an impact method to be applied on the wall surface. By means of an instrumented hammer, the impact of a known mass with predetermined energy against the plaster surface was produced. The force–time diagrams produced by the impact of a mass of known energy against the test surface were analyzed. The knowledge of the evolution over time of the forces between the impact mass and the tested material allows to evaluate the parameters that other impulsive methods would not allow. For example, the concrete sclerometer test was limited to the detection of a single quantity, i.e., the elastic energy returned by the material after the impact, proportional to the rebound length of the mass. In the case of the impact hammer test, in addition to the elastic energy returned by the material, the given energy, the dissipated energy, the duration of the impact, and the maximum force can also be evaluated. The impact method allowed to assess the elastic and anelastic properties of the materials [
3].
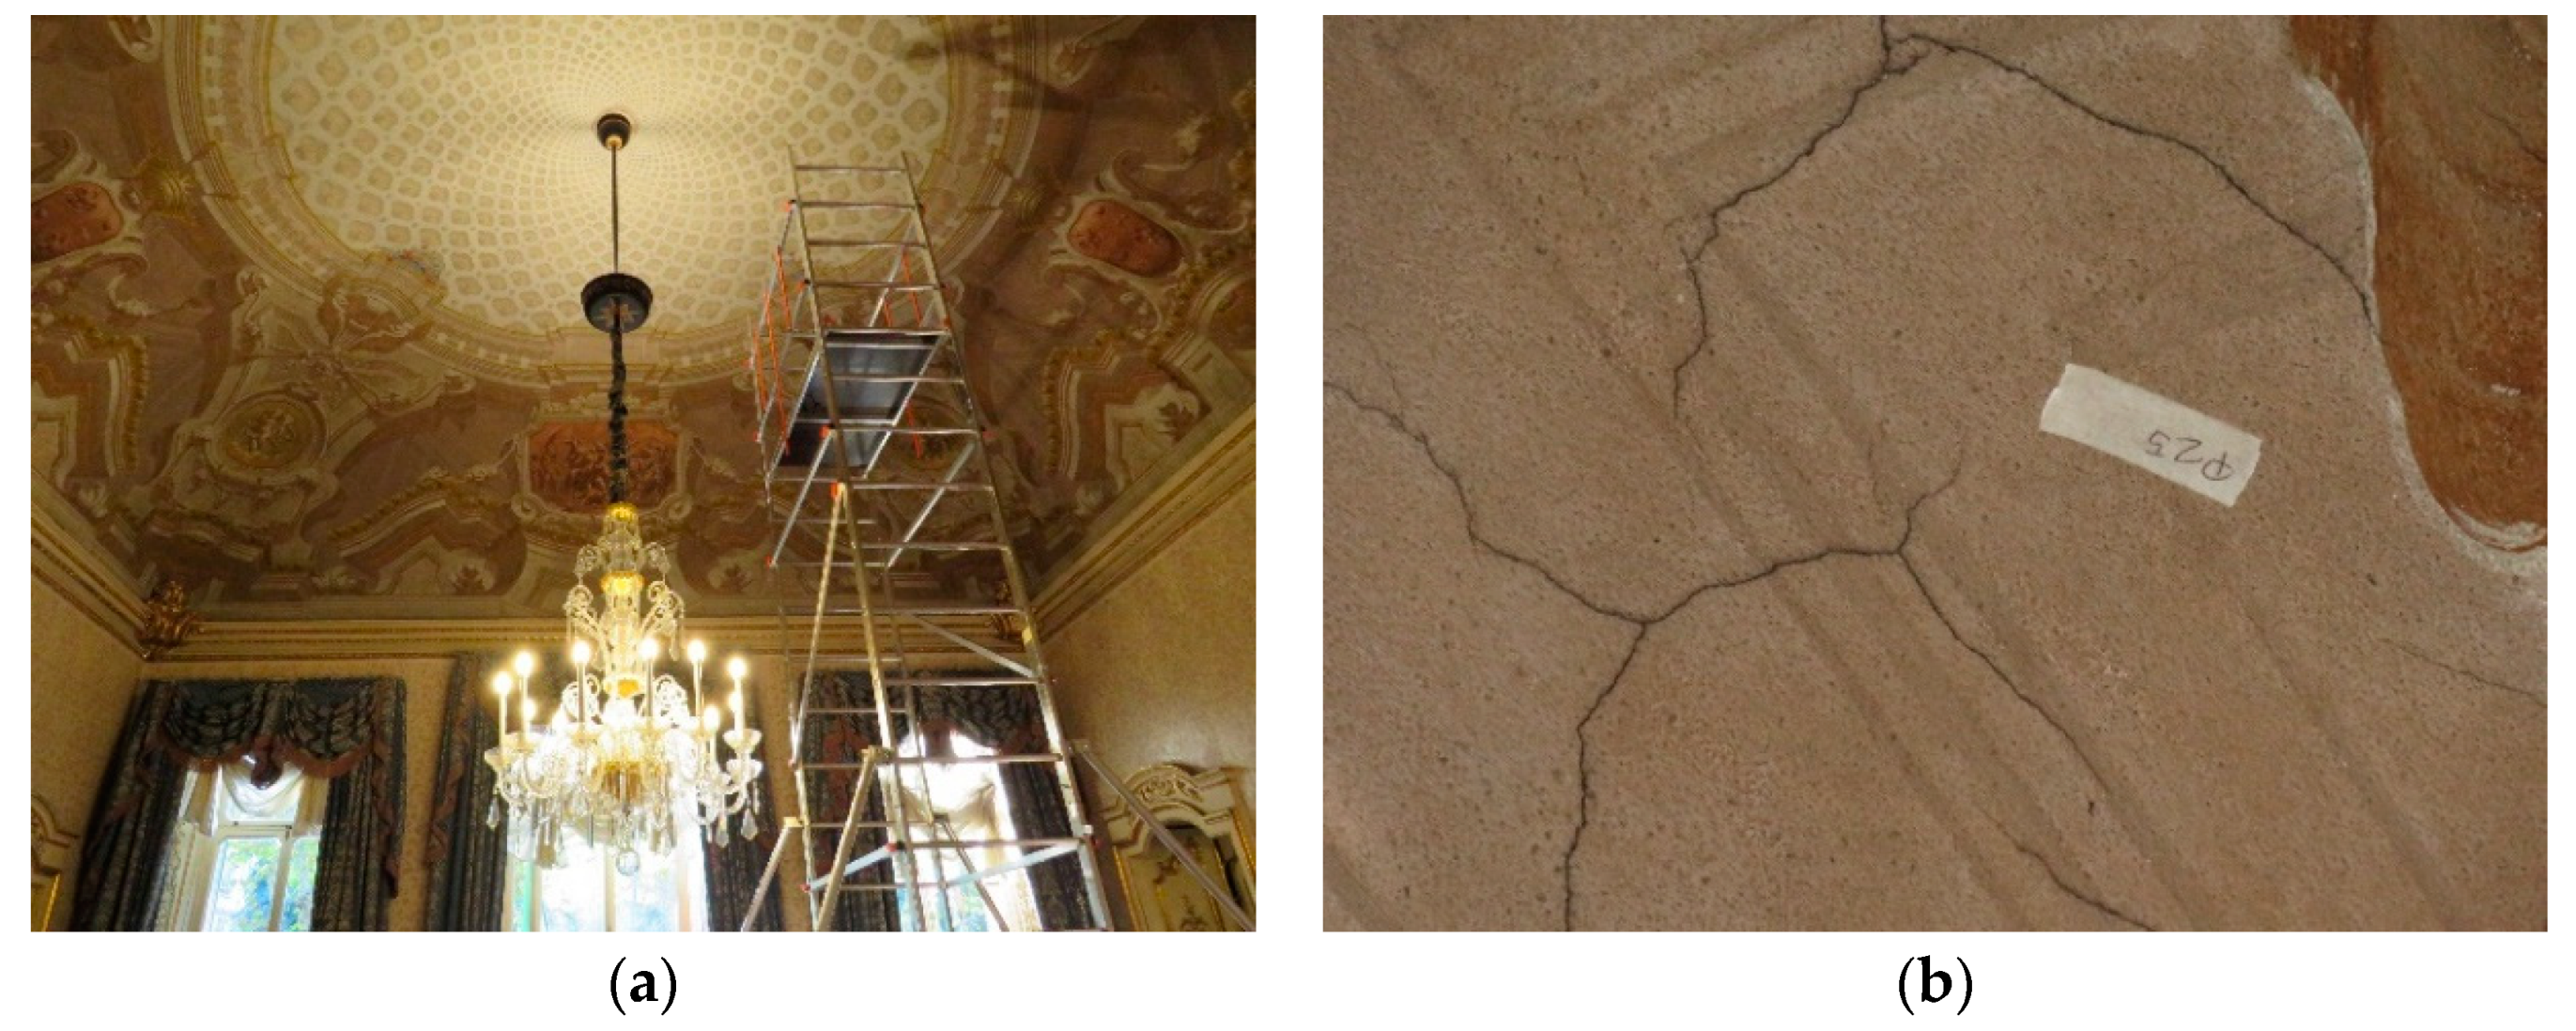
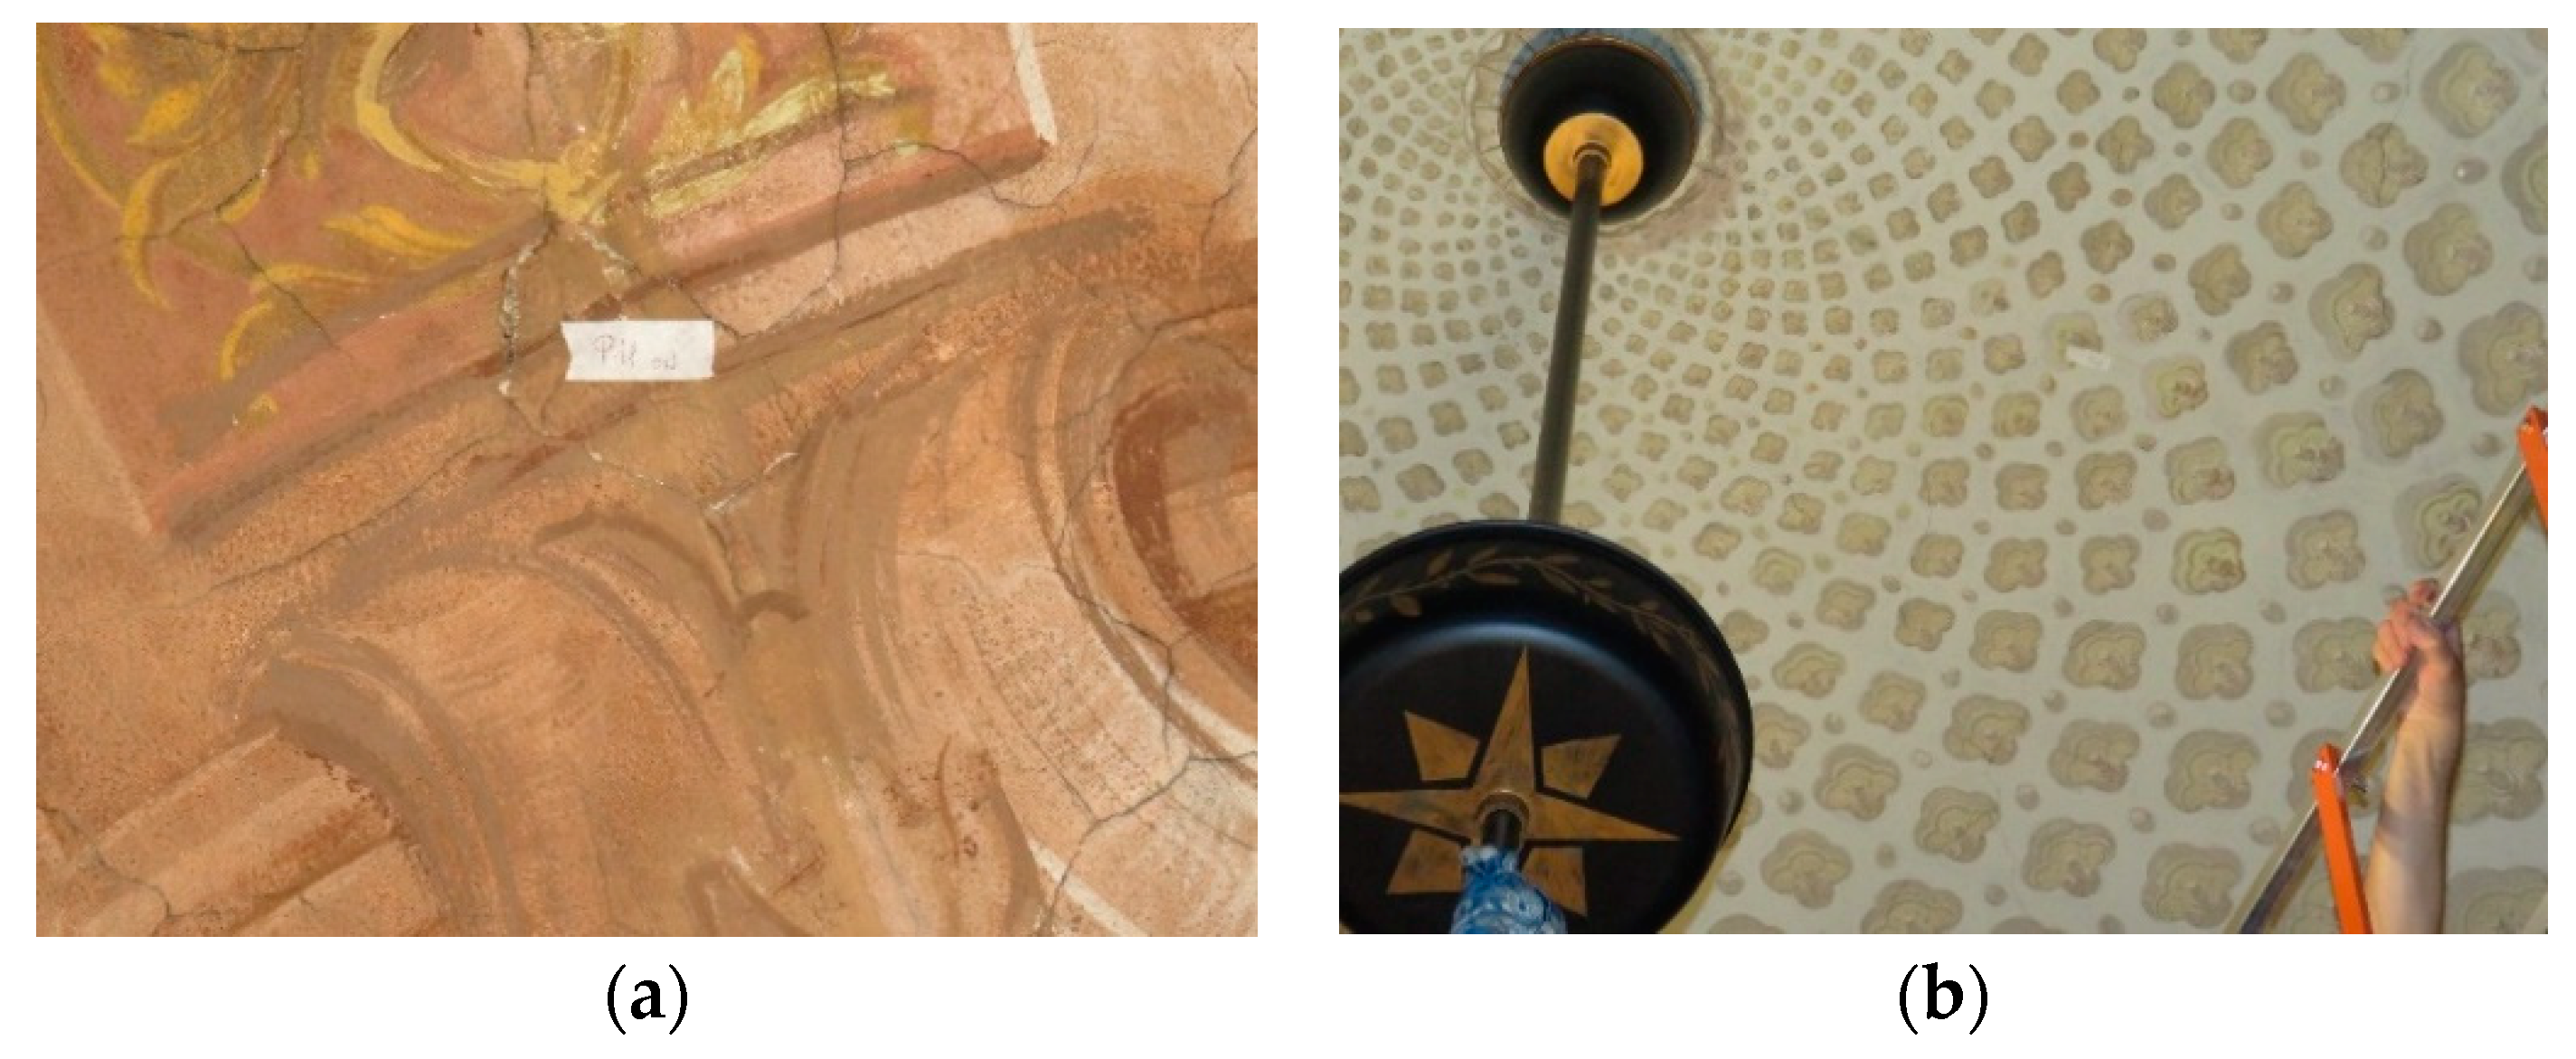
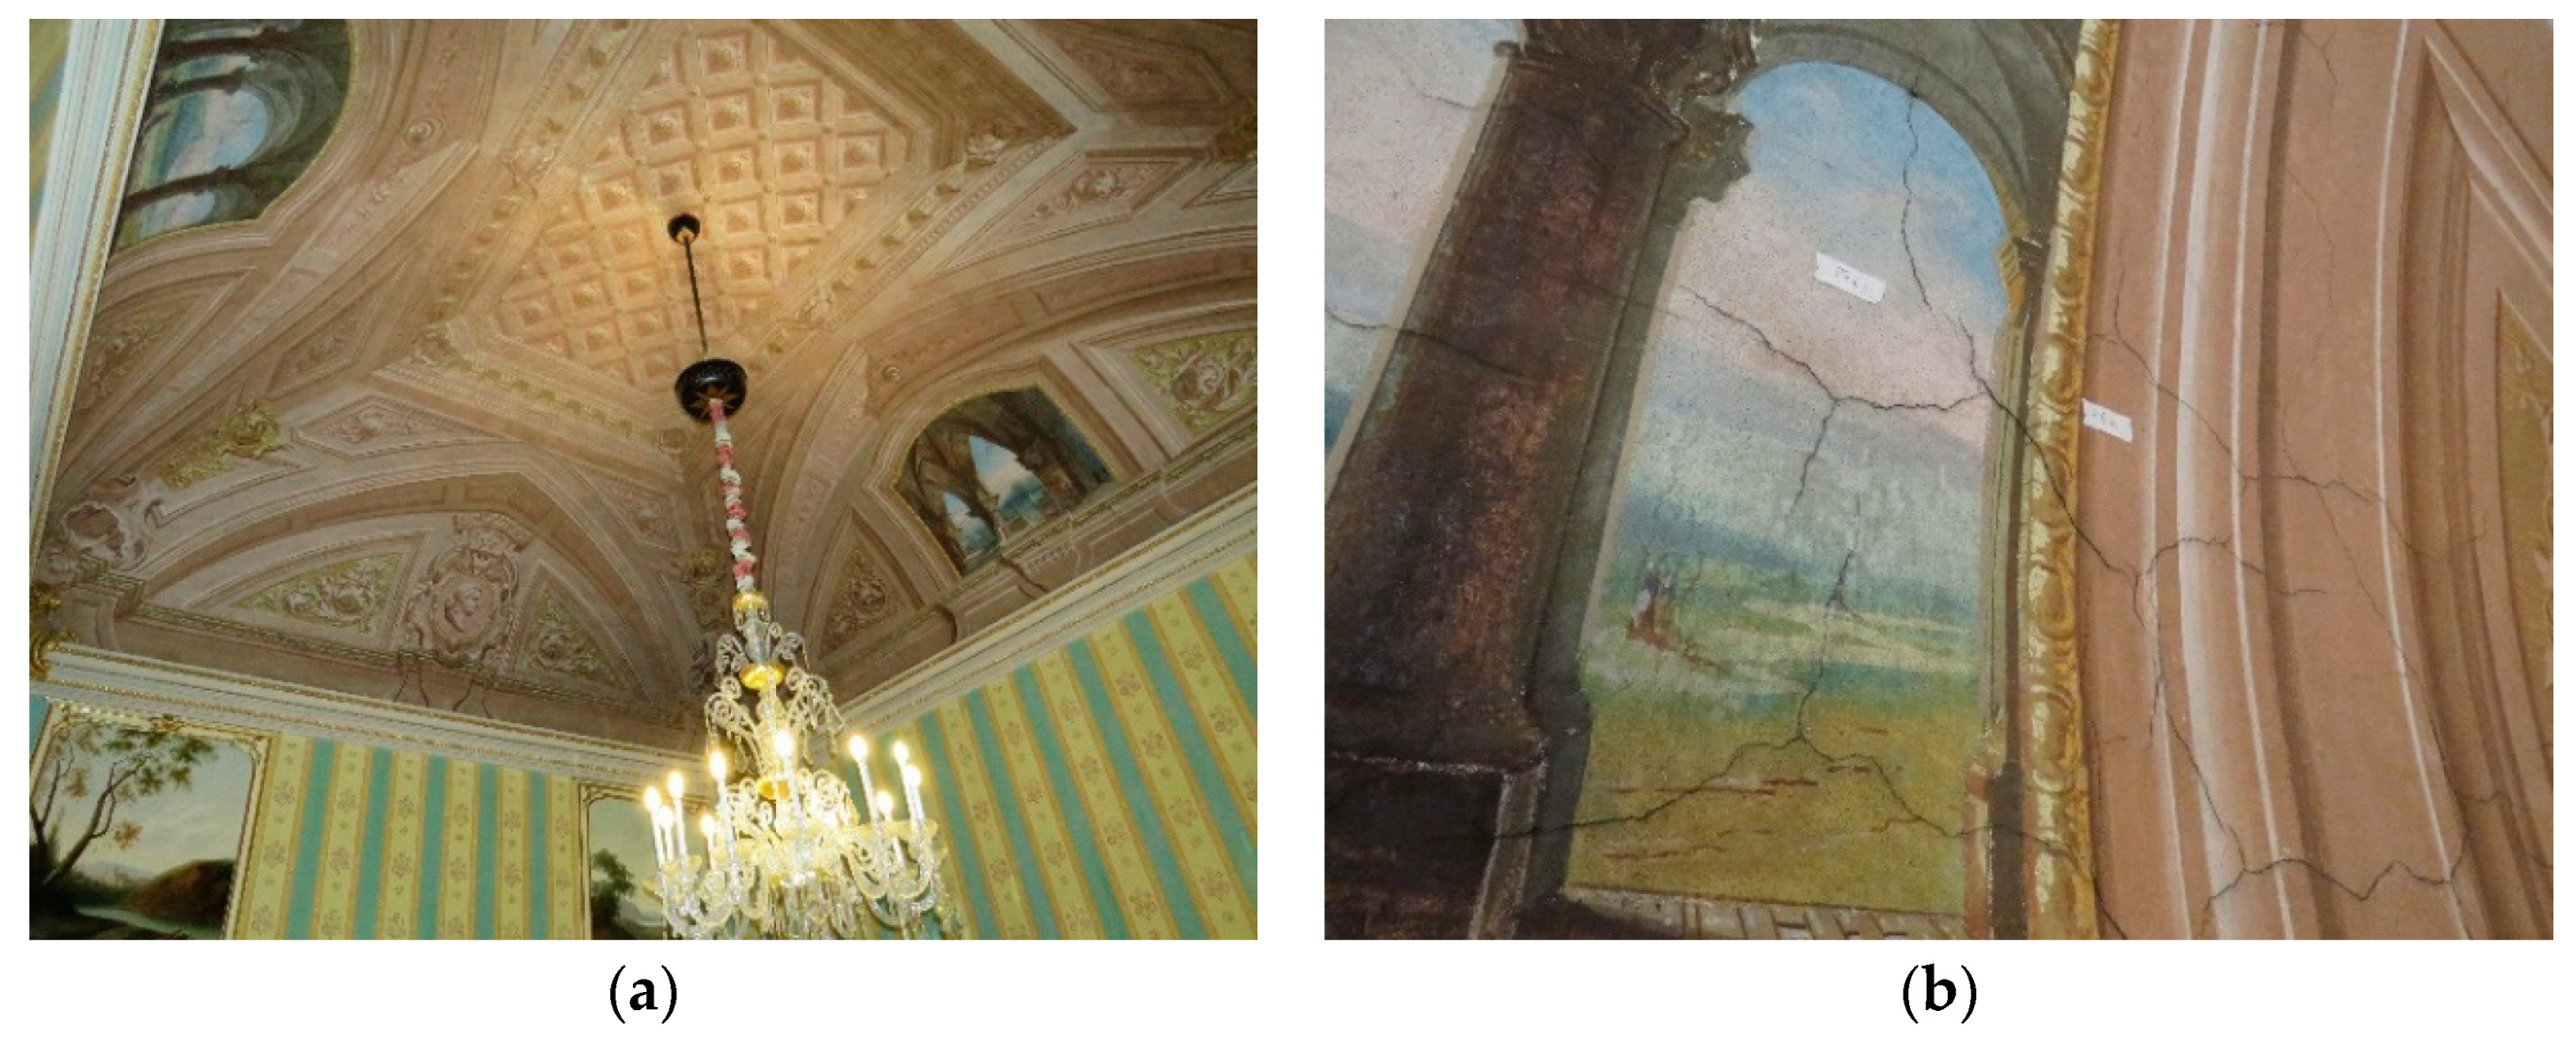
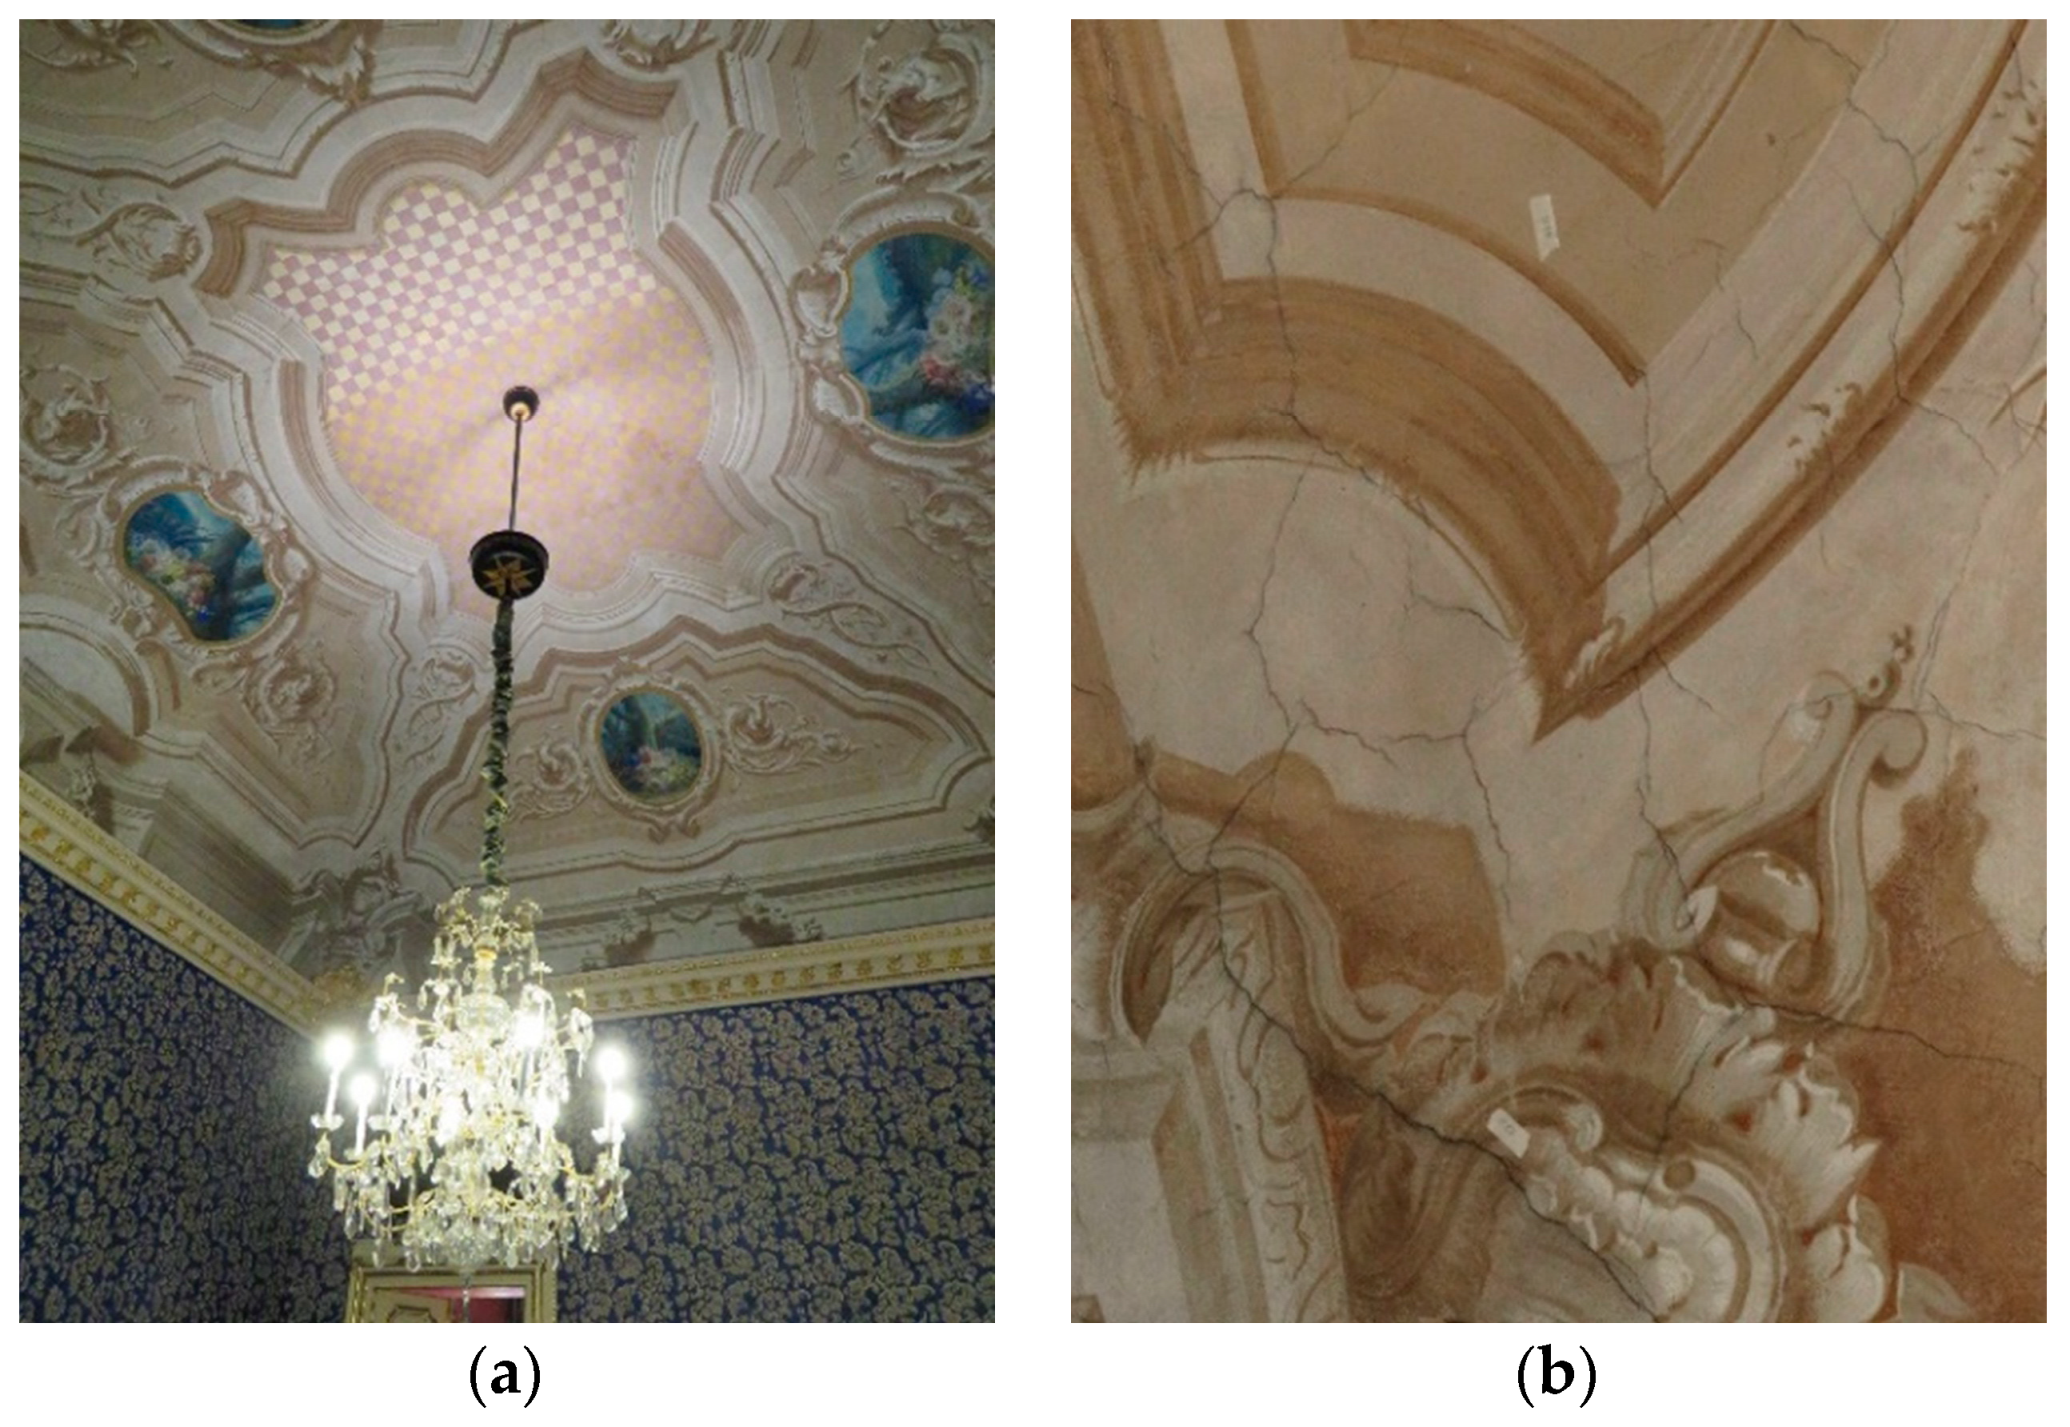
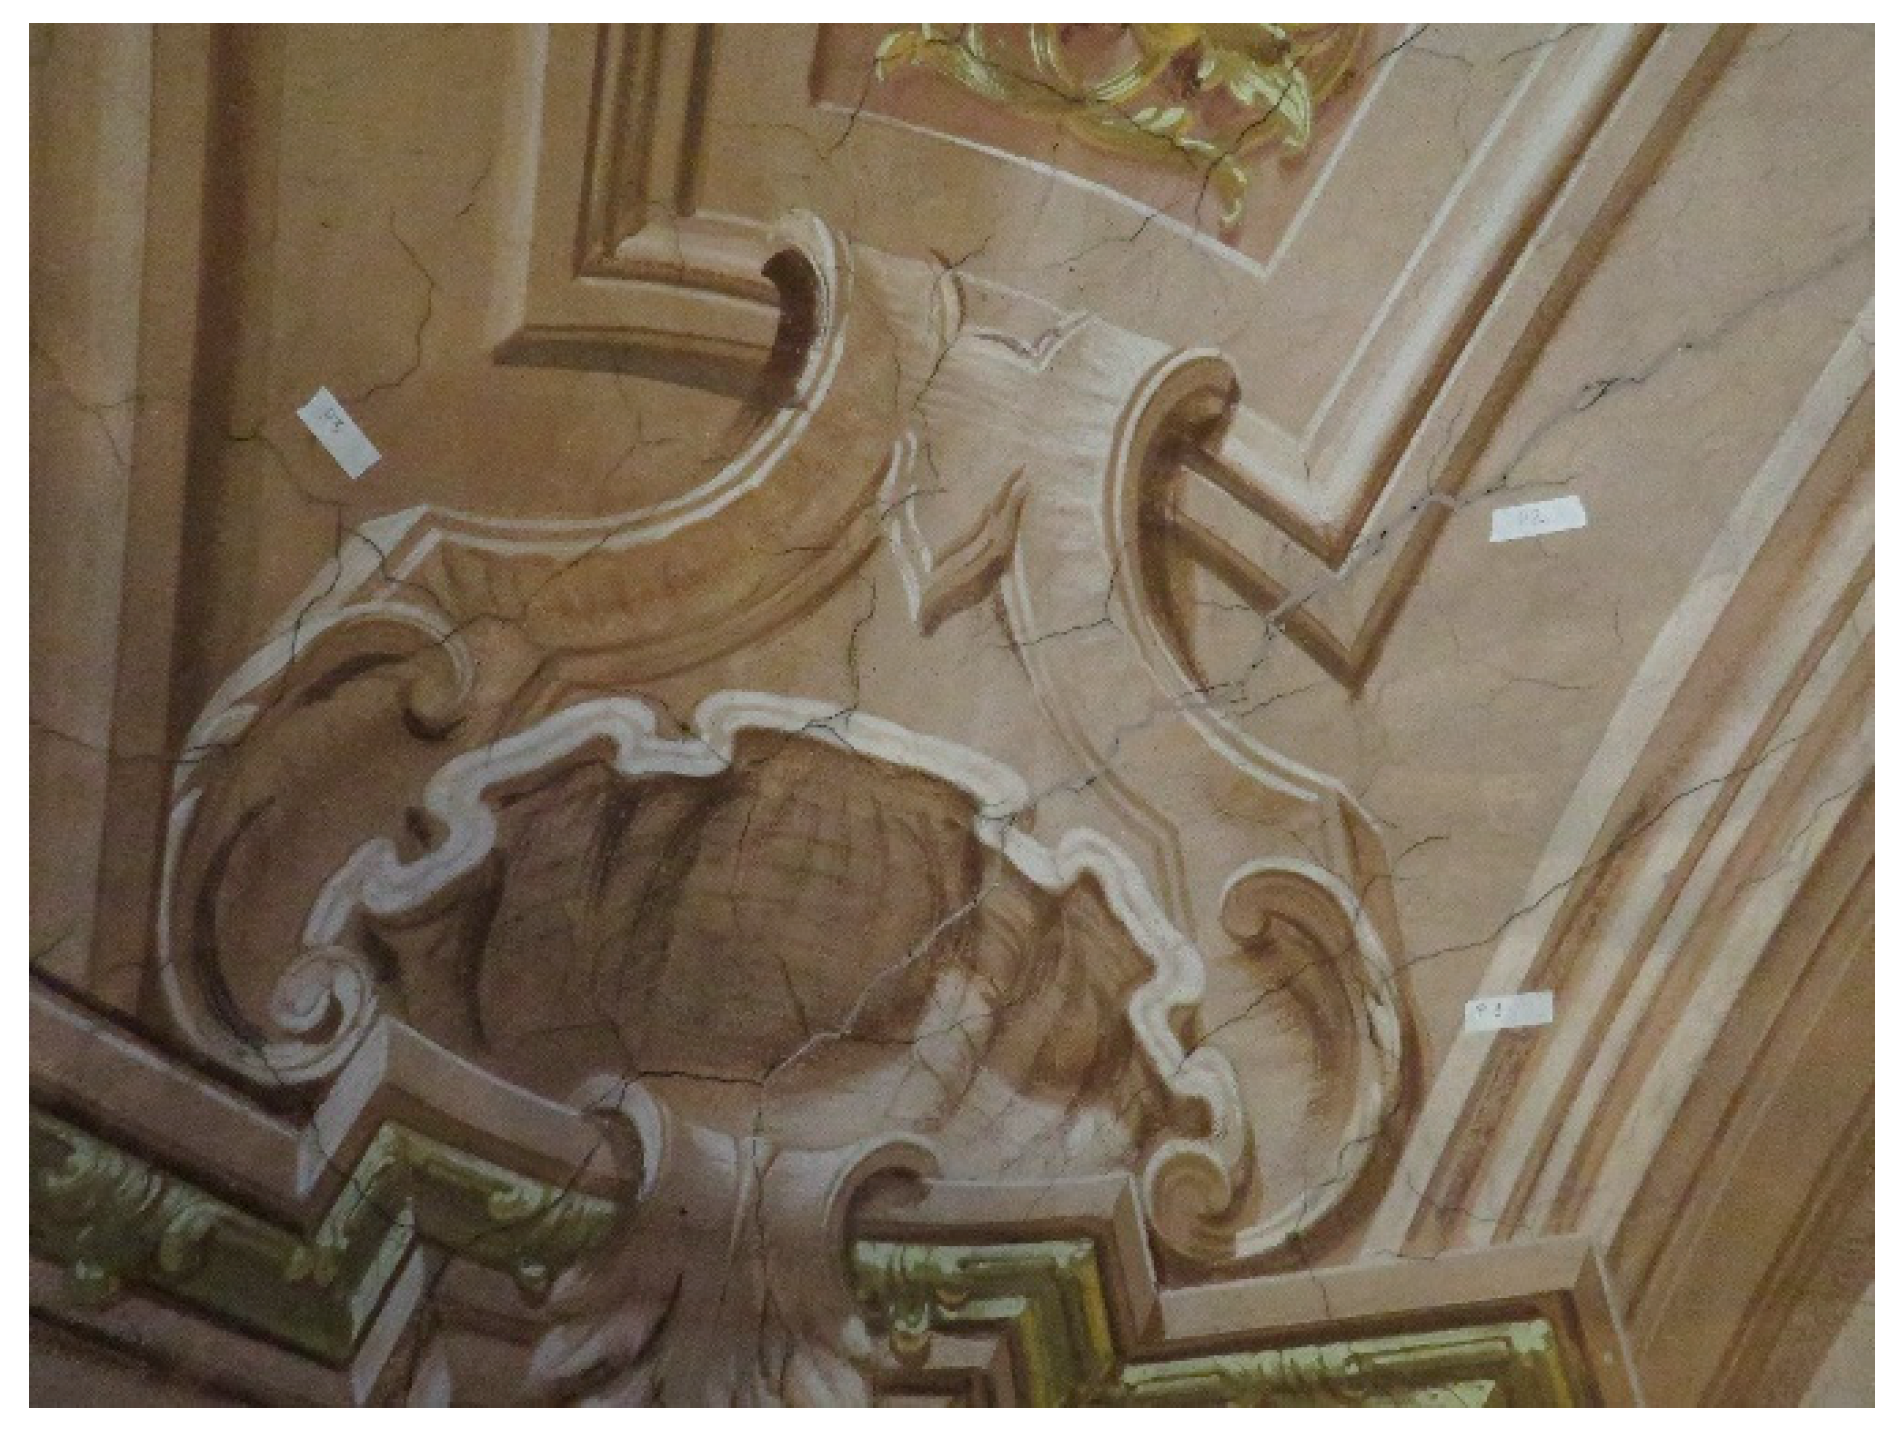
An experimental analysis of the stability of the decorated plaster covering three masonry vaults of the Birago Palace (16th century, planned by Filippo Juvarra) in the center of Turin was described by the use of the impact method test. The frescoed vaults of the Pelagi, Blu, and Giunta rooms showed some small cracks branched out in a layer of plaster that needed an evaluation regarding the risk of detachment (
Figure 1,
Figure 2 and
Figure 3). Surveys carried out on several points of the vaulted surfaces allowed mapping of the points of potential detachment of the de-coated plaster.
2. Equipment Setup and Methods
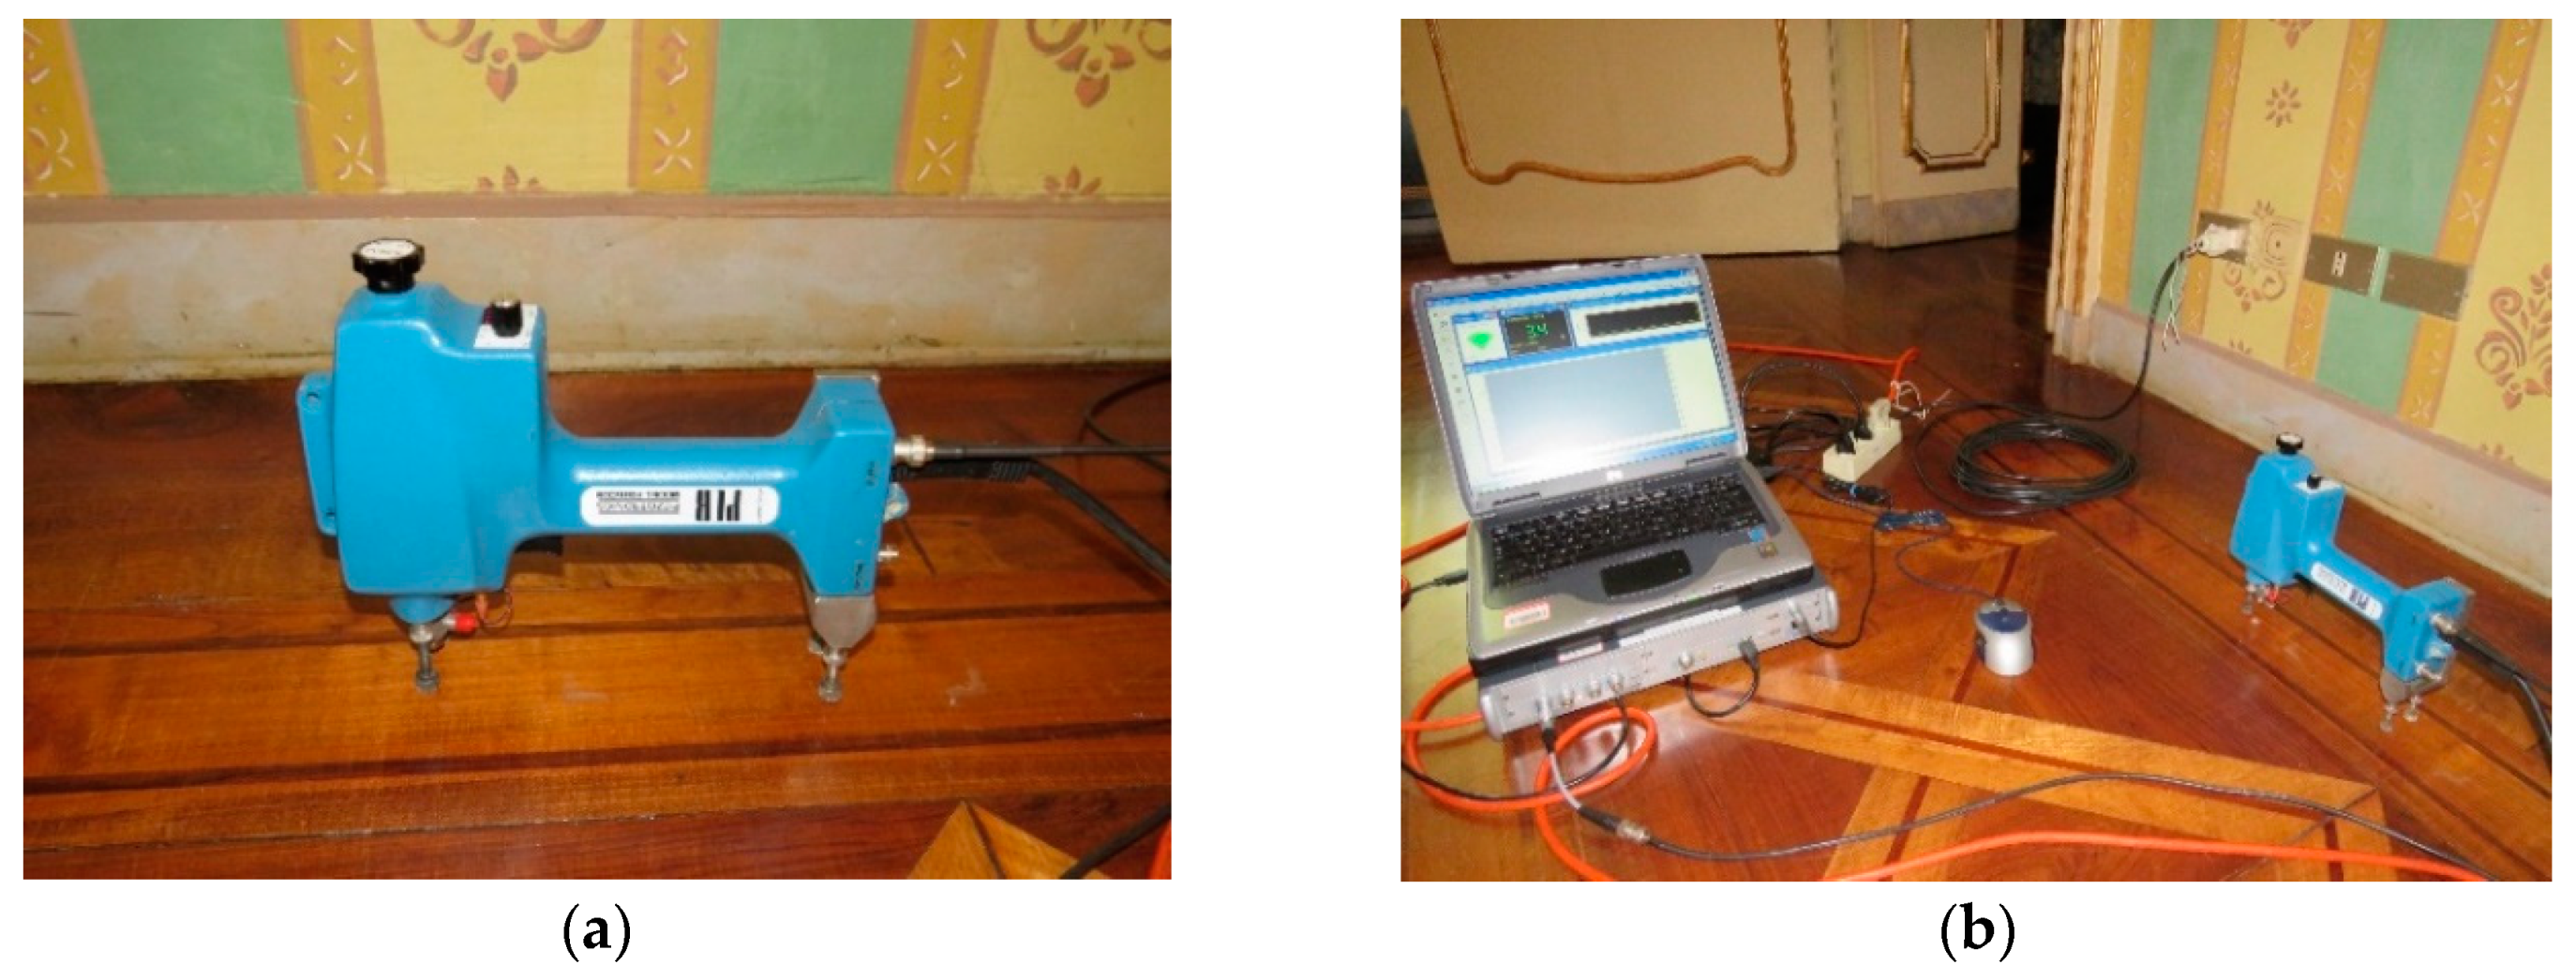
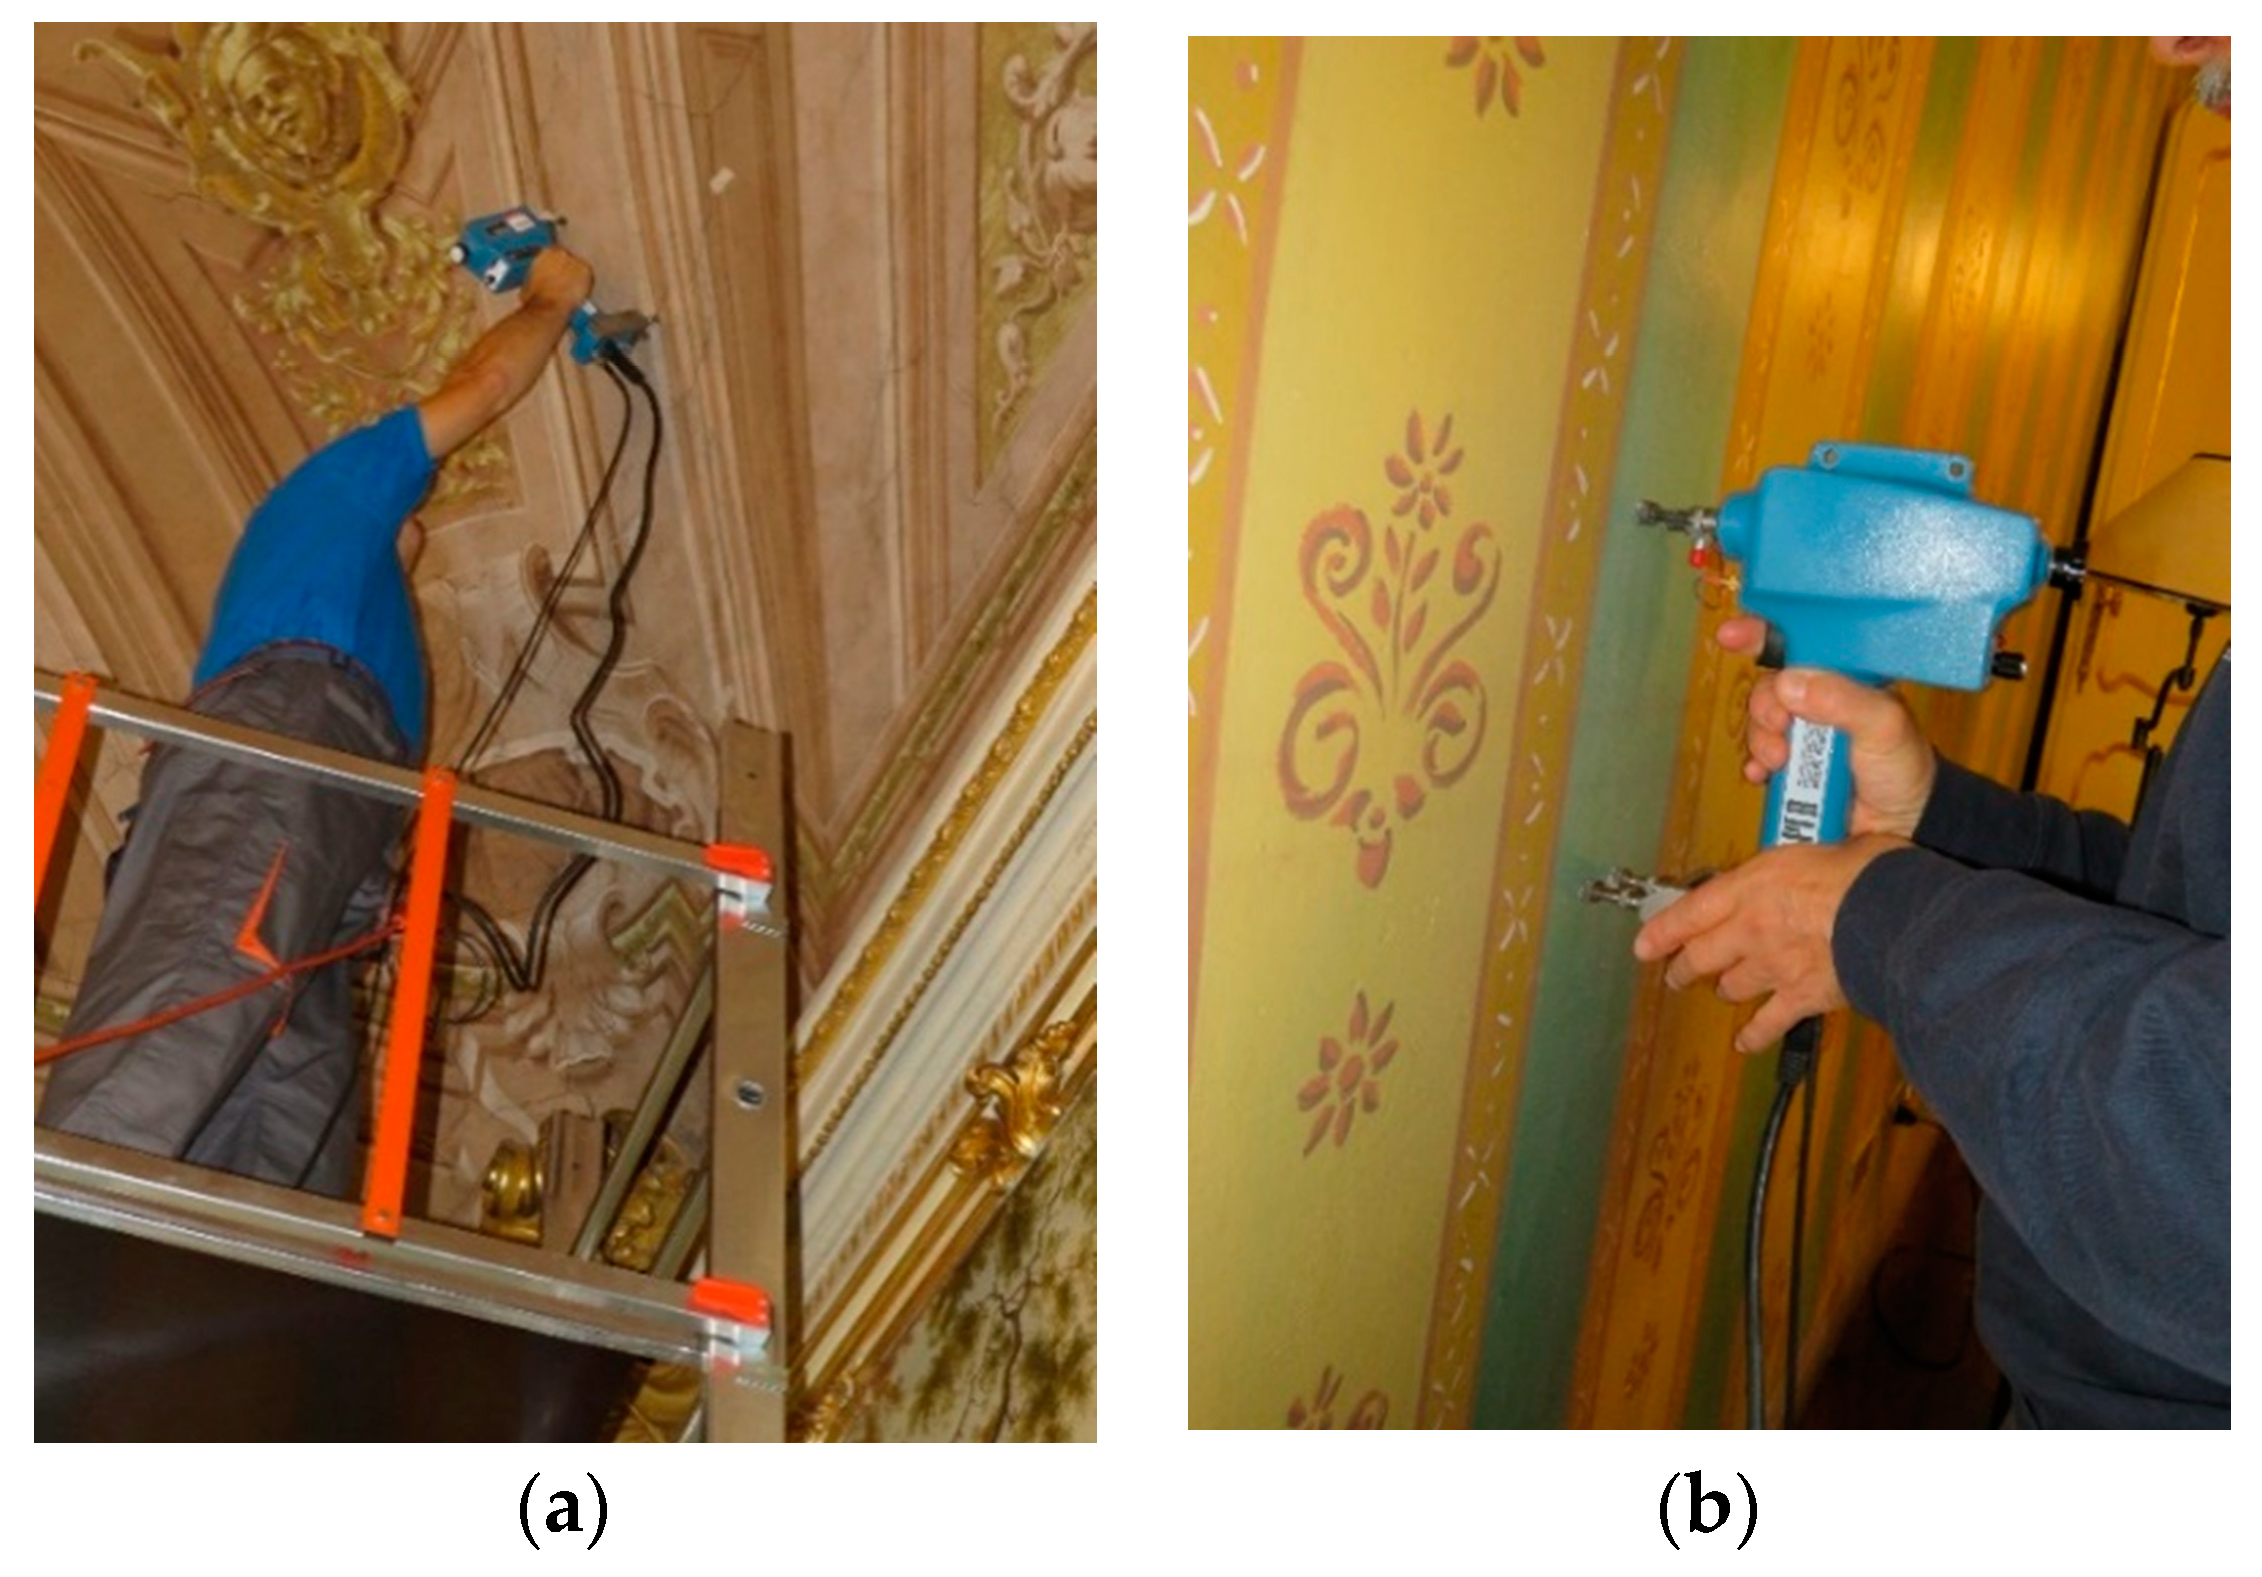
The instrumentation used to carry out the tests consisted of an impact instrumented hammer and a data analyzer. The electric impact hammer used was: PCB Piezotronics; model 086B09; force variable from 44.48 N to 4448.26 N; 208M51 model PCB force sensor; force sensor sensitivity 2.47 mV/N (
Figure 4a). The electric impact hammer was predetermined energy, characterized by the presence of one amplifier level and impedance adapter and a spherical head (10 mm diameter) in cemented steel rigidly connected to a piezoelectric impulse transducer with a total mass of 207 g.
The LMS Pimento multi-channel signal analyzer, with the “real-time” acquisition and recording function, had the following characteristics: model MSP 424; number of channels 4; input range: ±316 mV ÷ ±31.6 mV; 24-bit ADC (analog digital converter); bandwidth greater than 20 kHz (on all channels); signal sampling rate up to 100 ksample/second; and personal computer interface: FireWire IEEE1394—managed by its own dedicated software (
Figure 4b).
The points of the vault were randomly selected according to the logistic possibilities of movement inside the three rooms through mobile scaffolding. Most of the points chosen were found inside the cracked areas where there was a need to evaluate the adherence of the plaster on the masonry vault. Several points were also analyzed in non-cracked areas in order to compare the experimental results with the cracked points. For each point, at least three acquisitions were made to improve the statistical data (
Figure 5a). For each single point test, the instrumented hammer was positioned with the impact mass perpendicular to the test surface. The perpendicularity was achieved by means of the four metallic footsies (
Figure 5b). The test consisted in generating a small impact of the hammer’s mass against the test surface, with an absolutely non-destructive intensity, and therefore, also compatible with the conservation of the frescoed surfaces. The impact was triggered by a trigger control on the electric impact hammer.
3. Impact Energy Principles
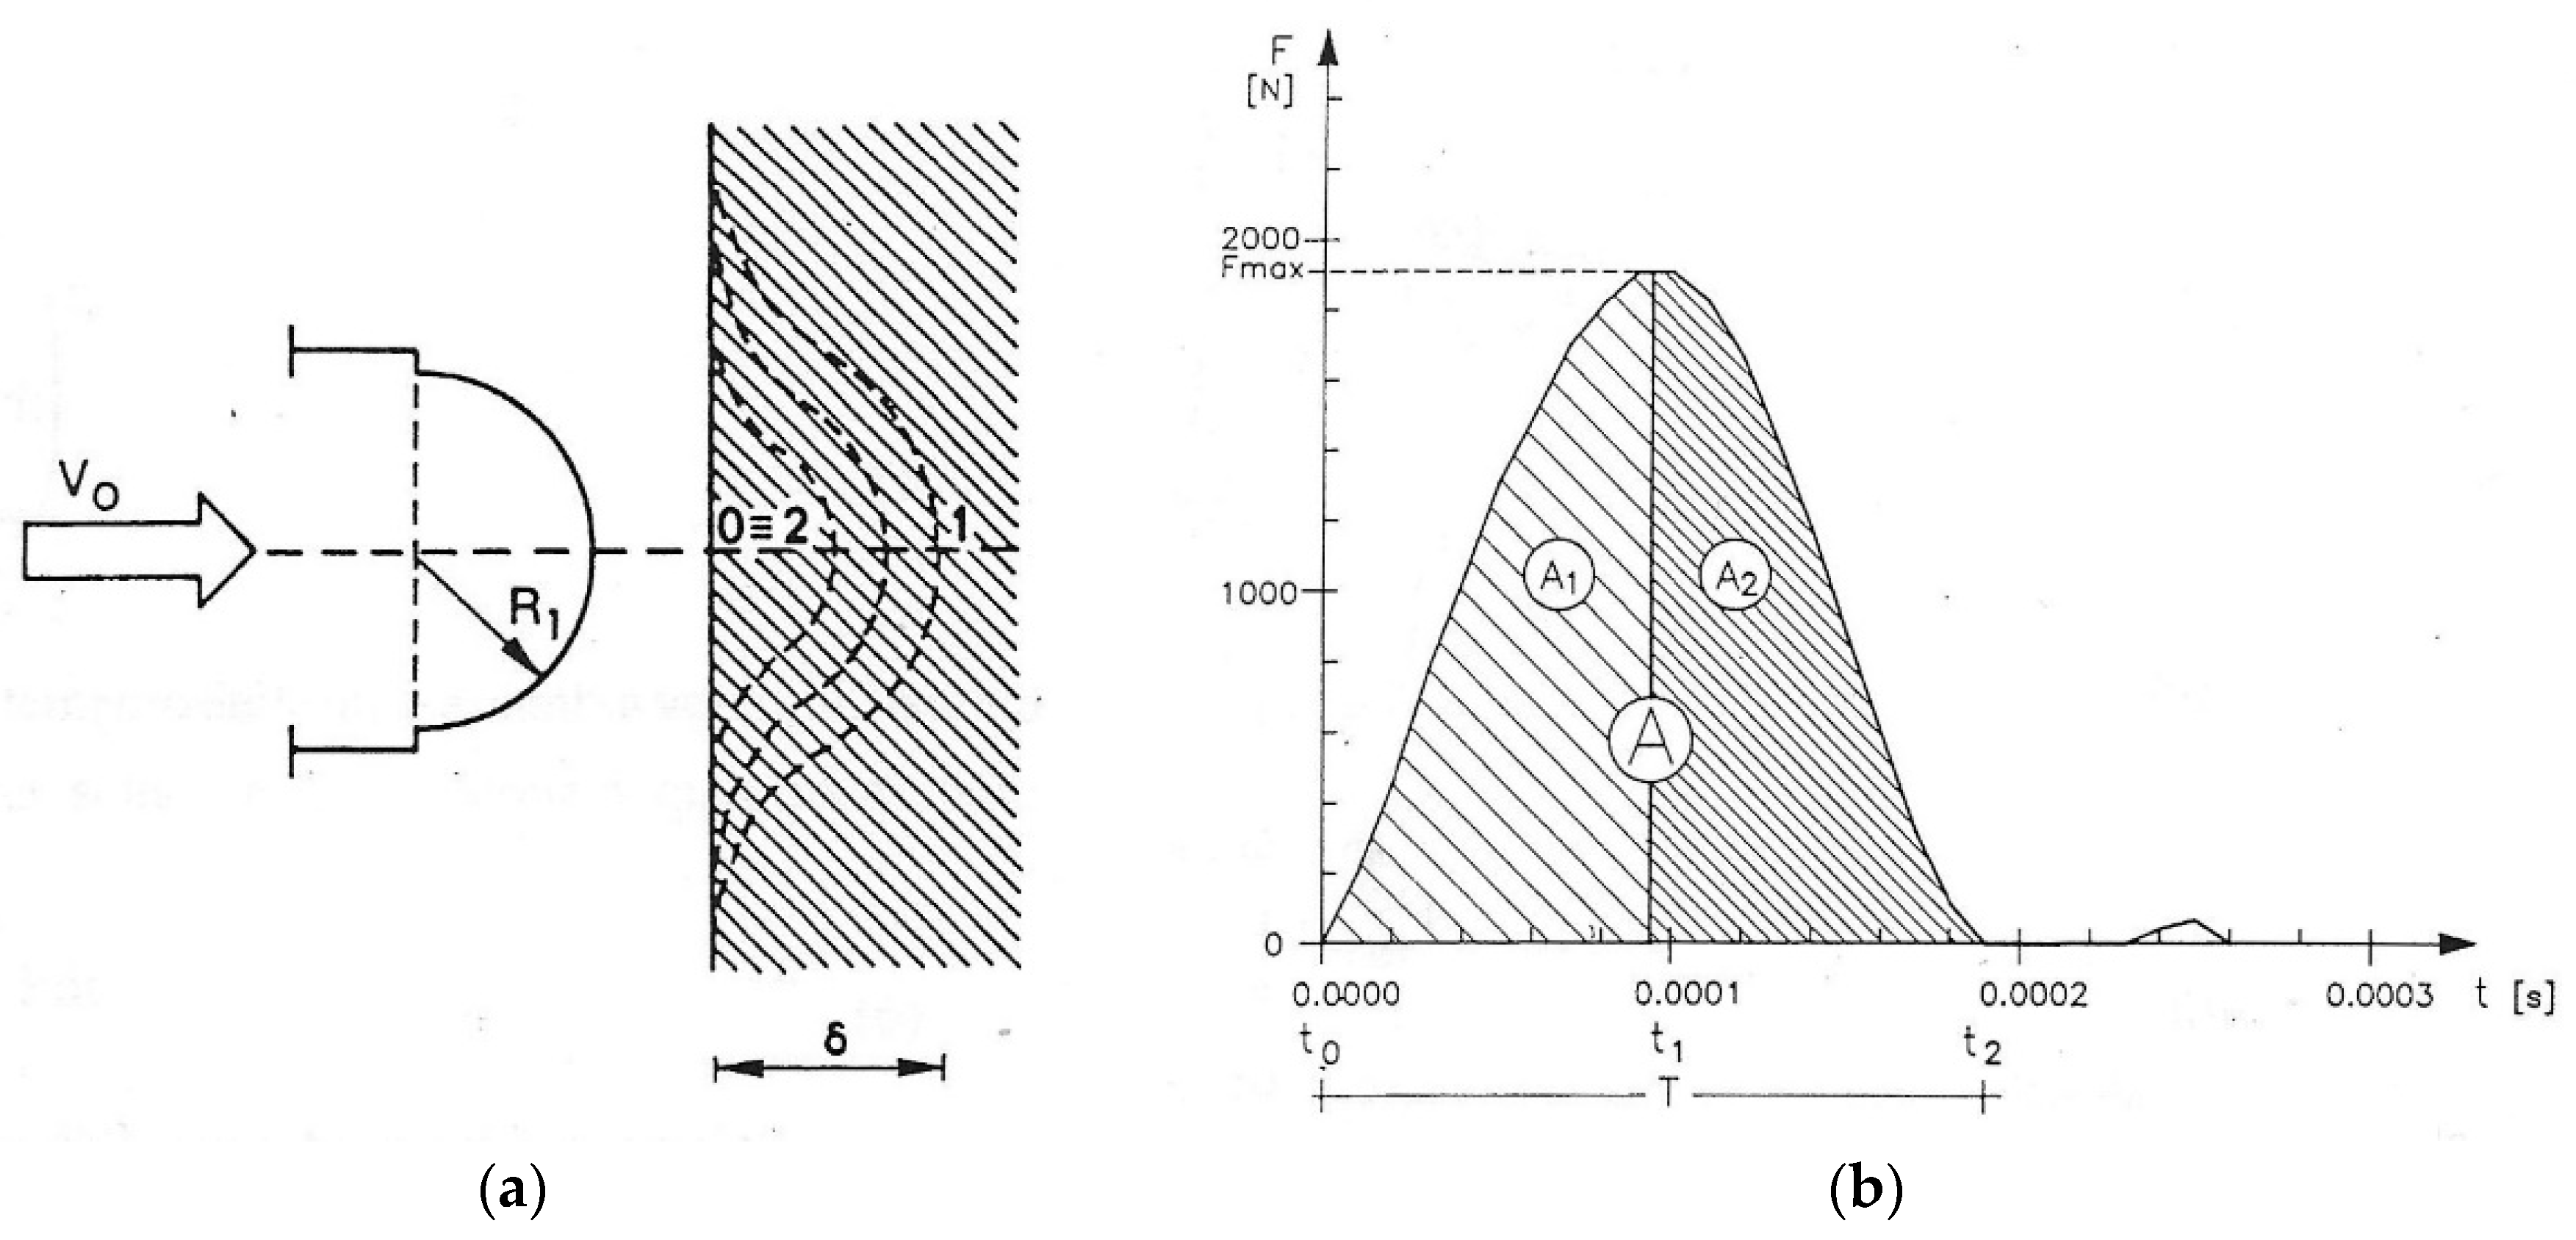
The following are some energy considerations to better understand the theory underlying the impact method. Consider the impact of a mass
m with a semispherical surface and having a velocity
v0 on the flat surface of a semi-finished space. The direction of impact is perpendicular to this surface. Moreover, the velocity
v0 of all points of the mass is equal and coinciding with the velocity
v0 of its center of gravity. In this case the kinetic energy of the mass at the moment of impact is given by Equation (1):
and the momentum is:
Considering the instant
t0 in which the mass touches the surface and the instant
t1 in which the maximum contact deformation
δ occurs and in which the velocity
v0 is canceled (
Figure 6a), the corresponding momentum variation results:
and therefore:
The force impulse is given by the area
A1 subtended to the curve (
F,
t) obtained experimentally as shown in the
Figure 6b.
The kinetic energy provided by the mass is:
Subsequently from the instant
t1, in which the vector displacement of the mass changes direction, at the instant
t2, in which the contact between mass and flat surface ceases, the change in momentum of the mass results:
wherein
v2 is the velocity of displacement of the mass from the surface, and results
v2 <
v0. The value of the integral (6) is given by the area
A2. The ratio between initial and final mass momentum provides the return coefficient
e that measures the elasticity of the impact:
In the perfectly elastic collision e = 1, in the perfectly inelastic collision e = 0.
Figure 6b shows that the return coefficient is given by the following equation:
The energy returned in the collision is given by:
The ratio between the energy supplied and returned is given by:
The energy dissipated
εd in the impact due to the elasticity of the materials is given by:
Therefore, in the case of a perfectly elastic impact:
4. Experimental Results at Birago Palace Tests
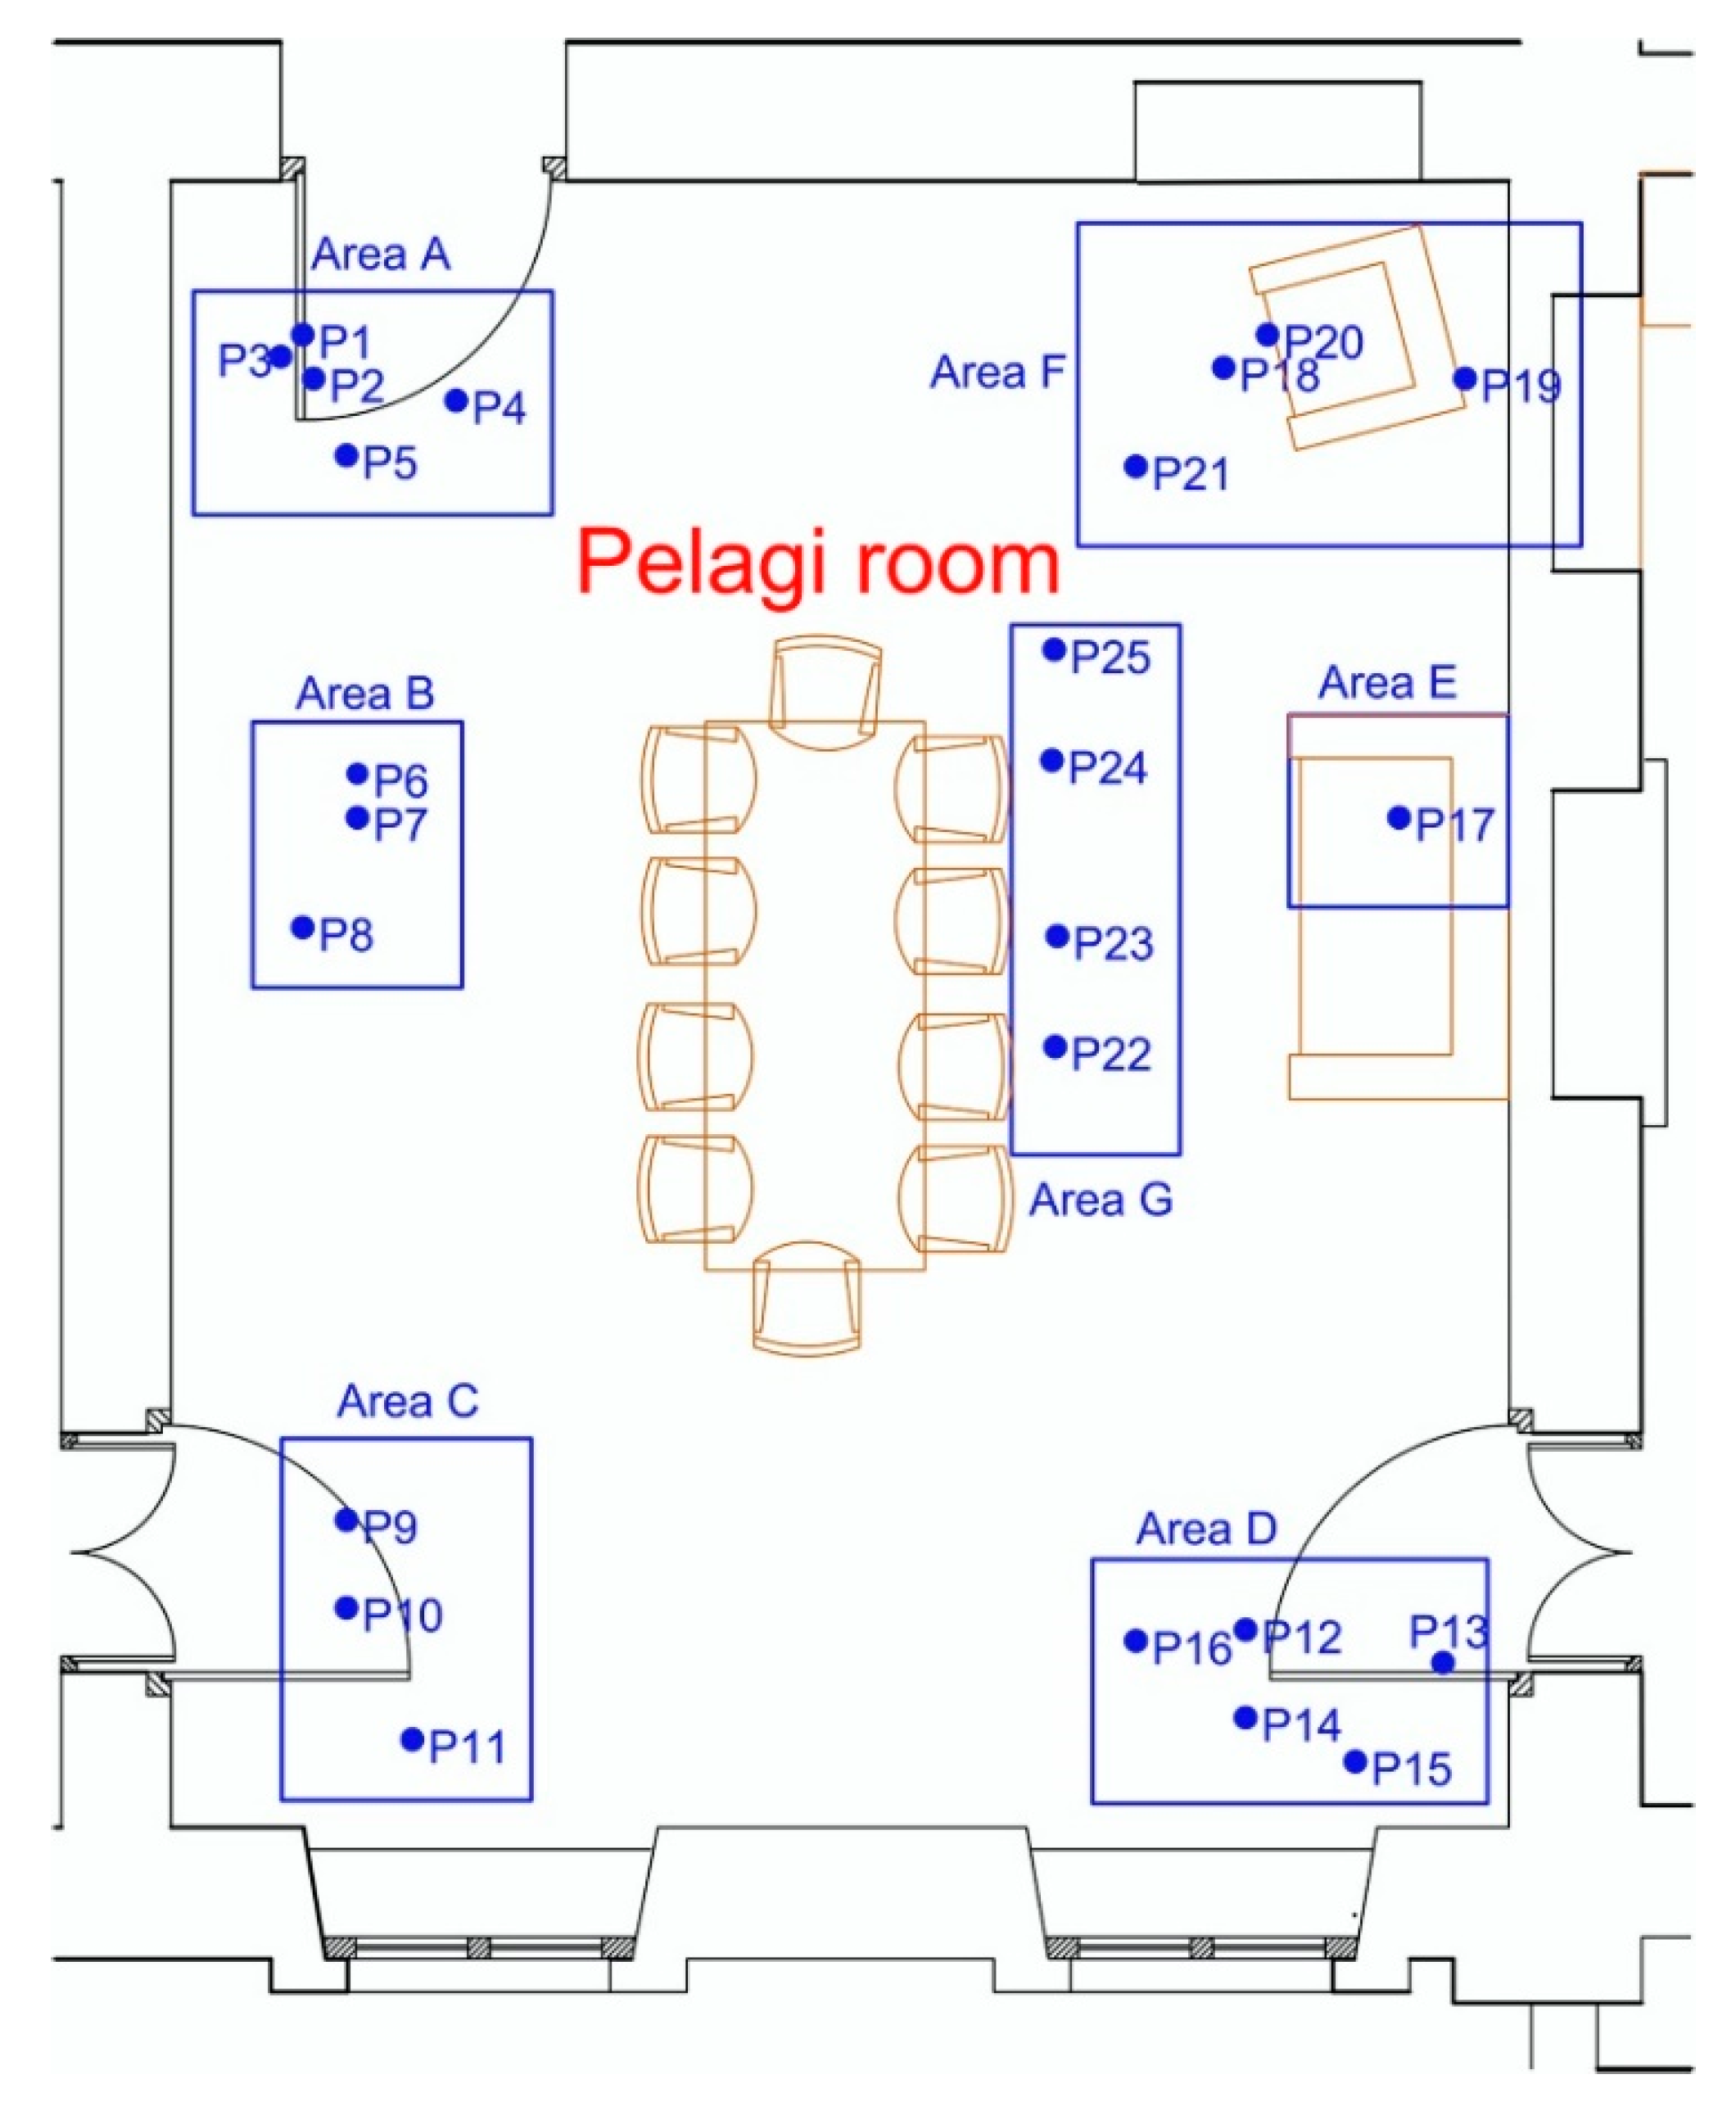
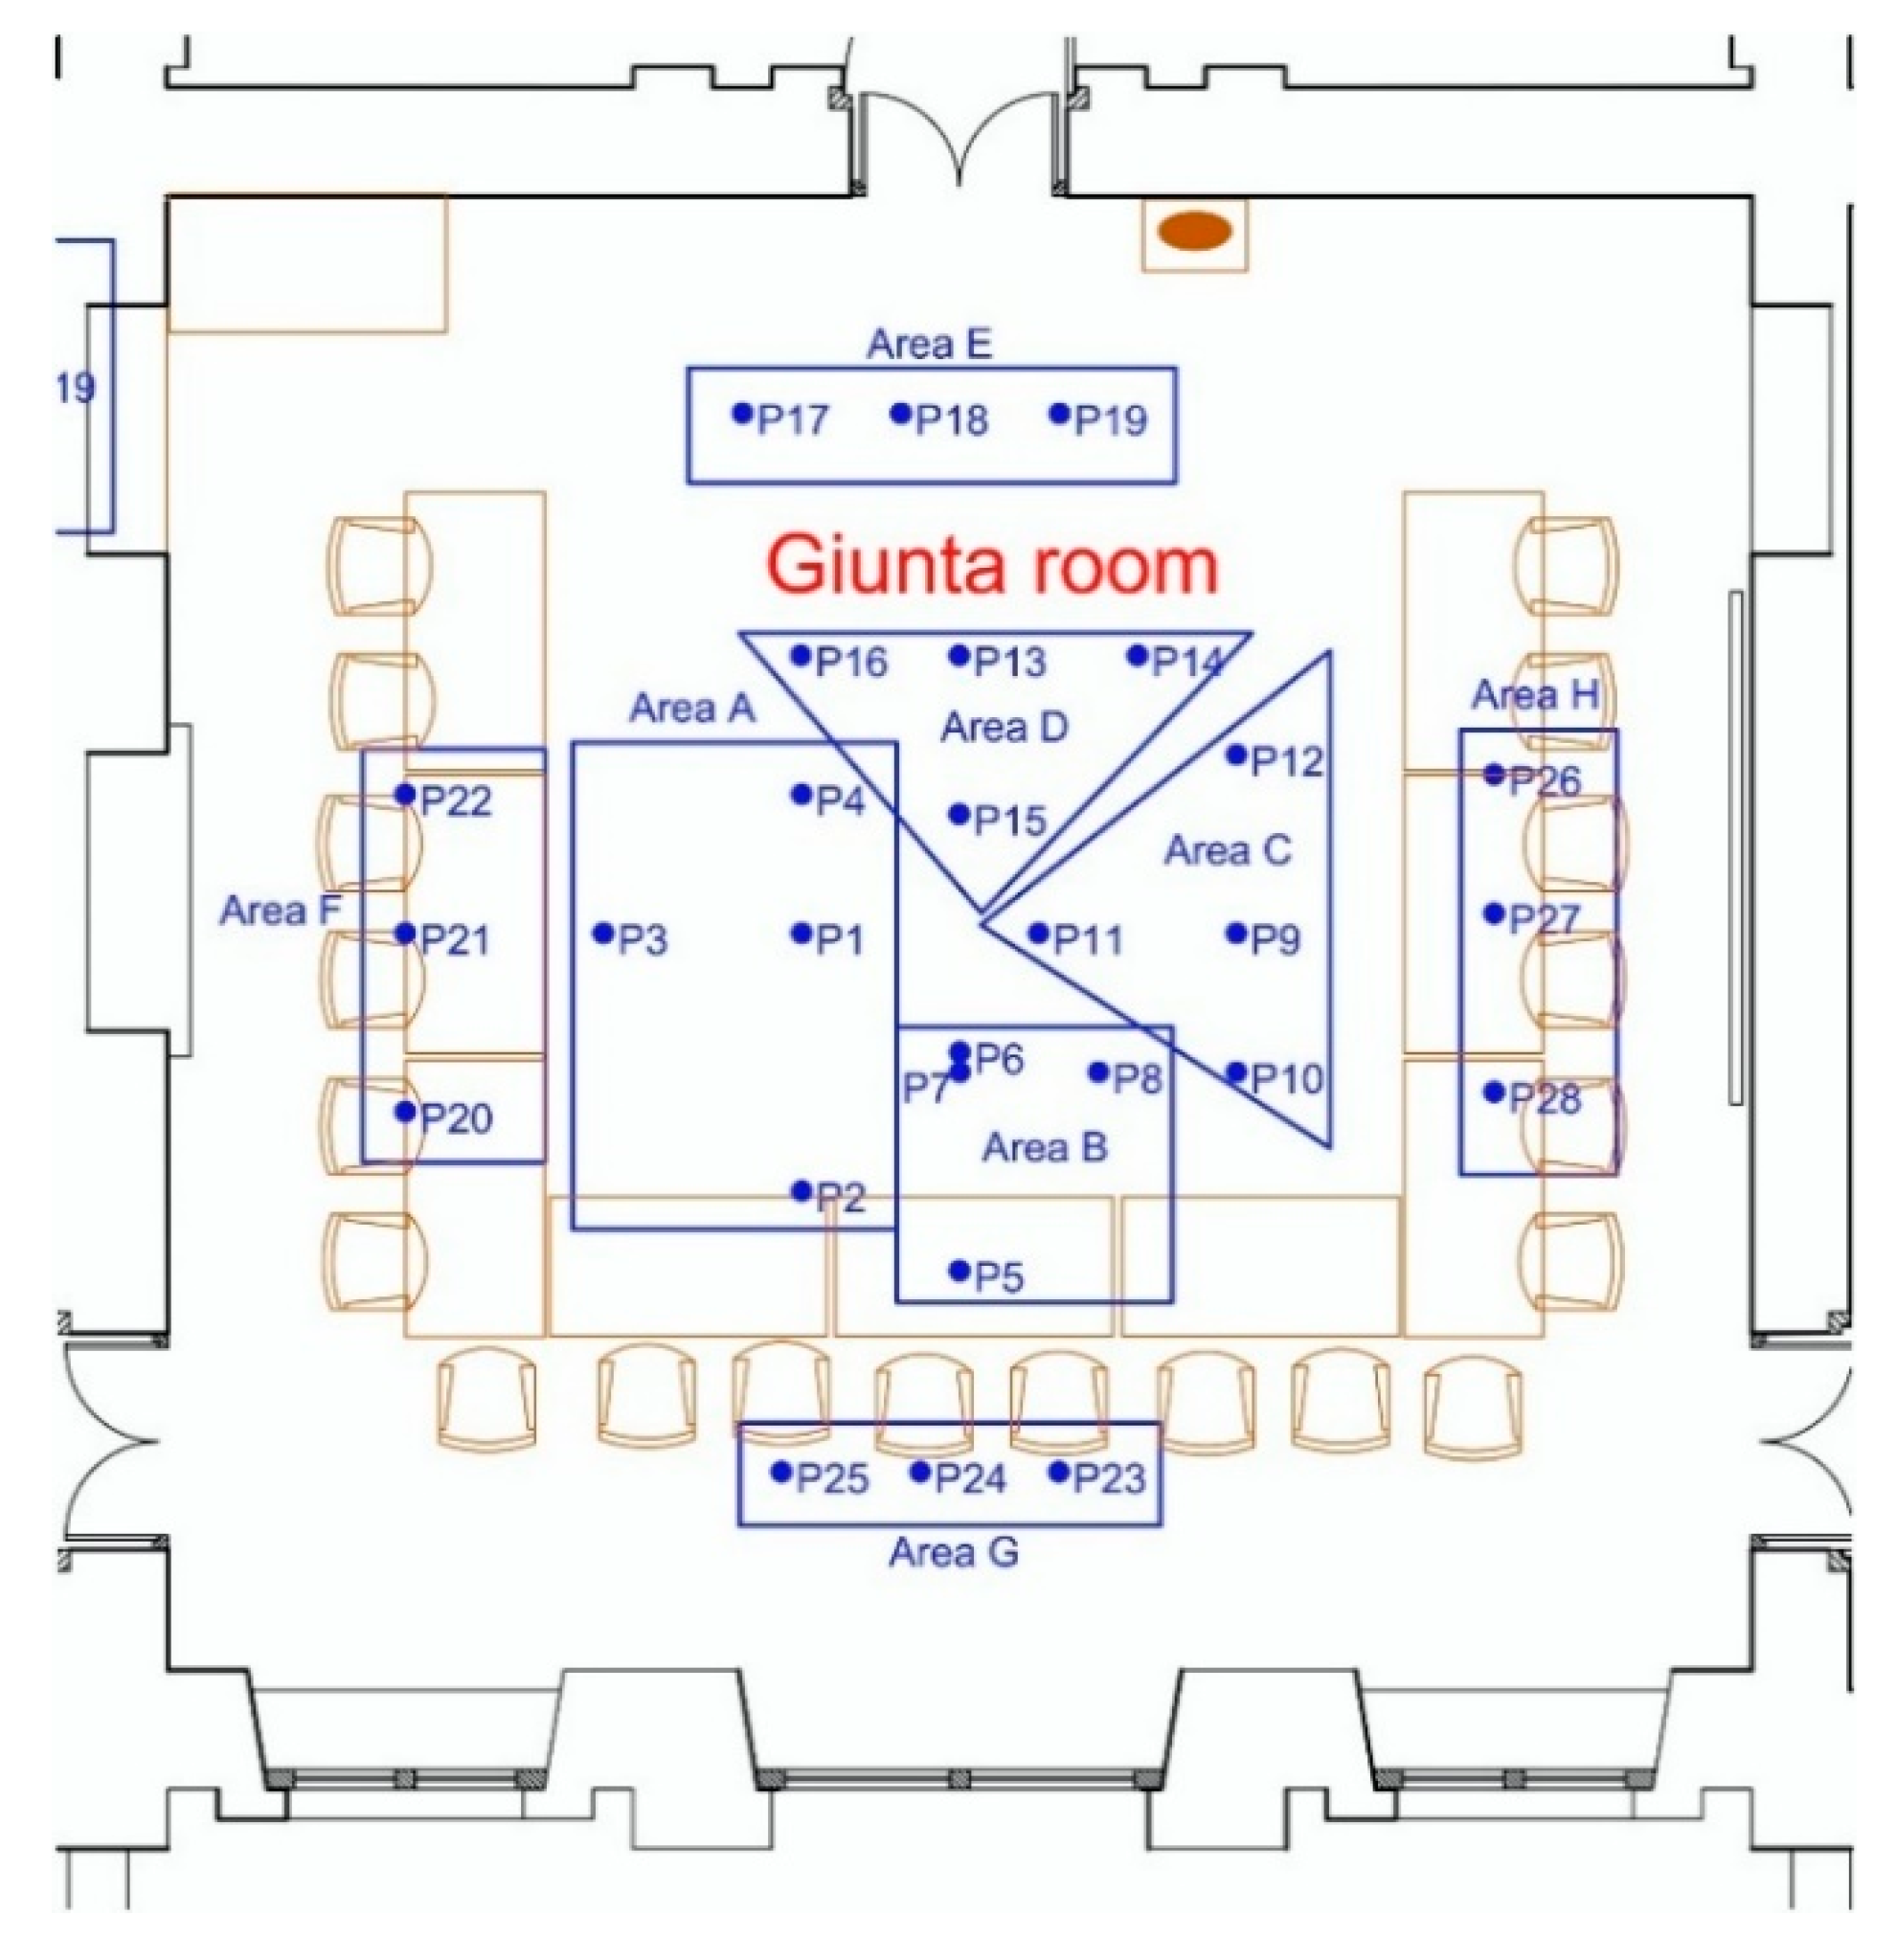
In the impact test carried out at Birago Palace in Turin (Italy), every masonry vault was divided into survey areas as shown in
Figure 7, labeled with alphabet letters, within which both apparently intact and potentially damaged points were tested. For each point, at least three impacts were performed to obtain a better statistical response, and the return coefficient
e was evaluated. The maps of the areas tested and the force–time curves of some tested points are shown, respectively, in the Pelagi (
Figure 8 and
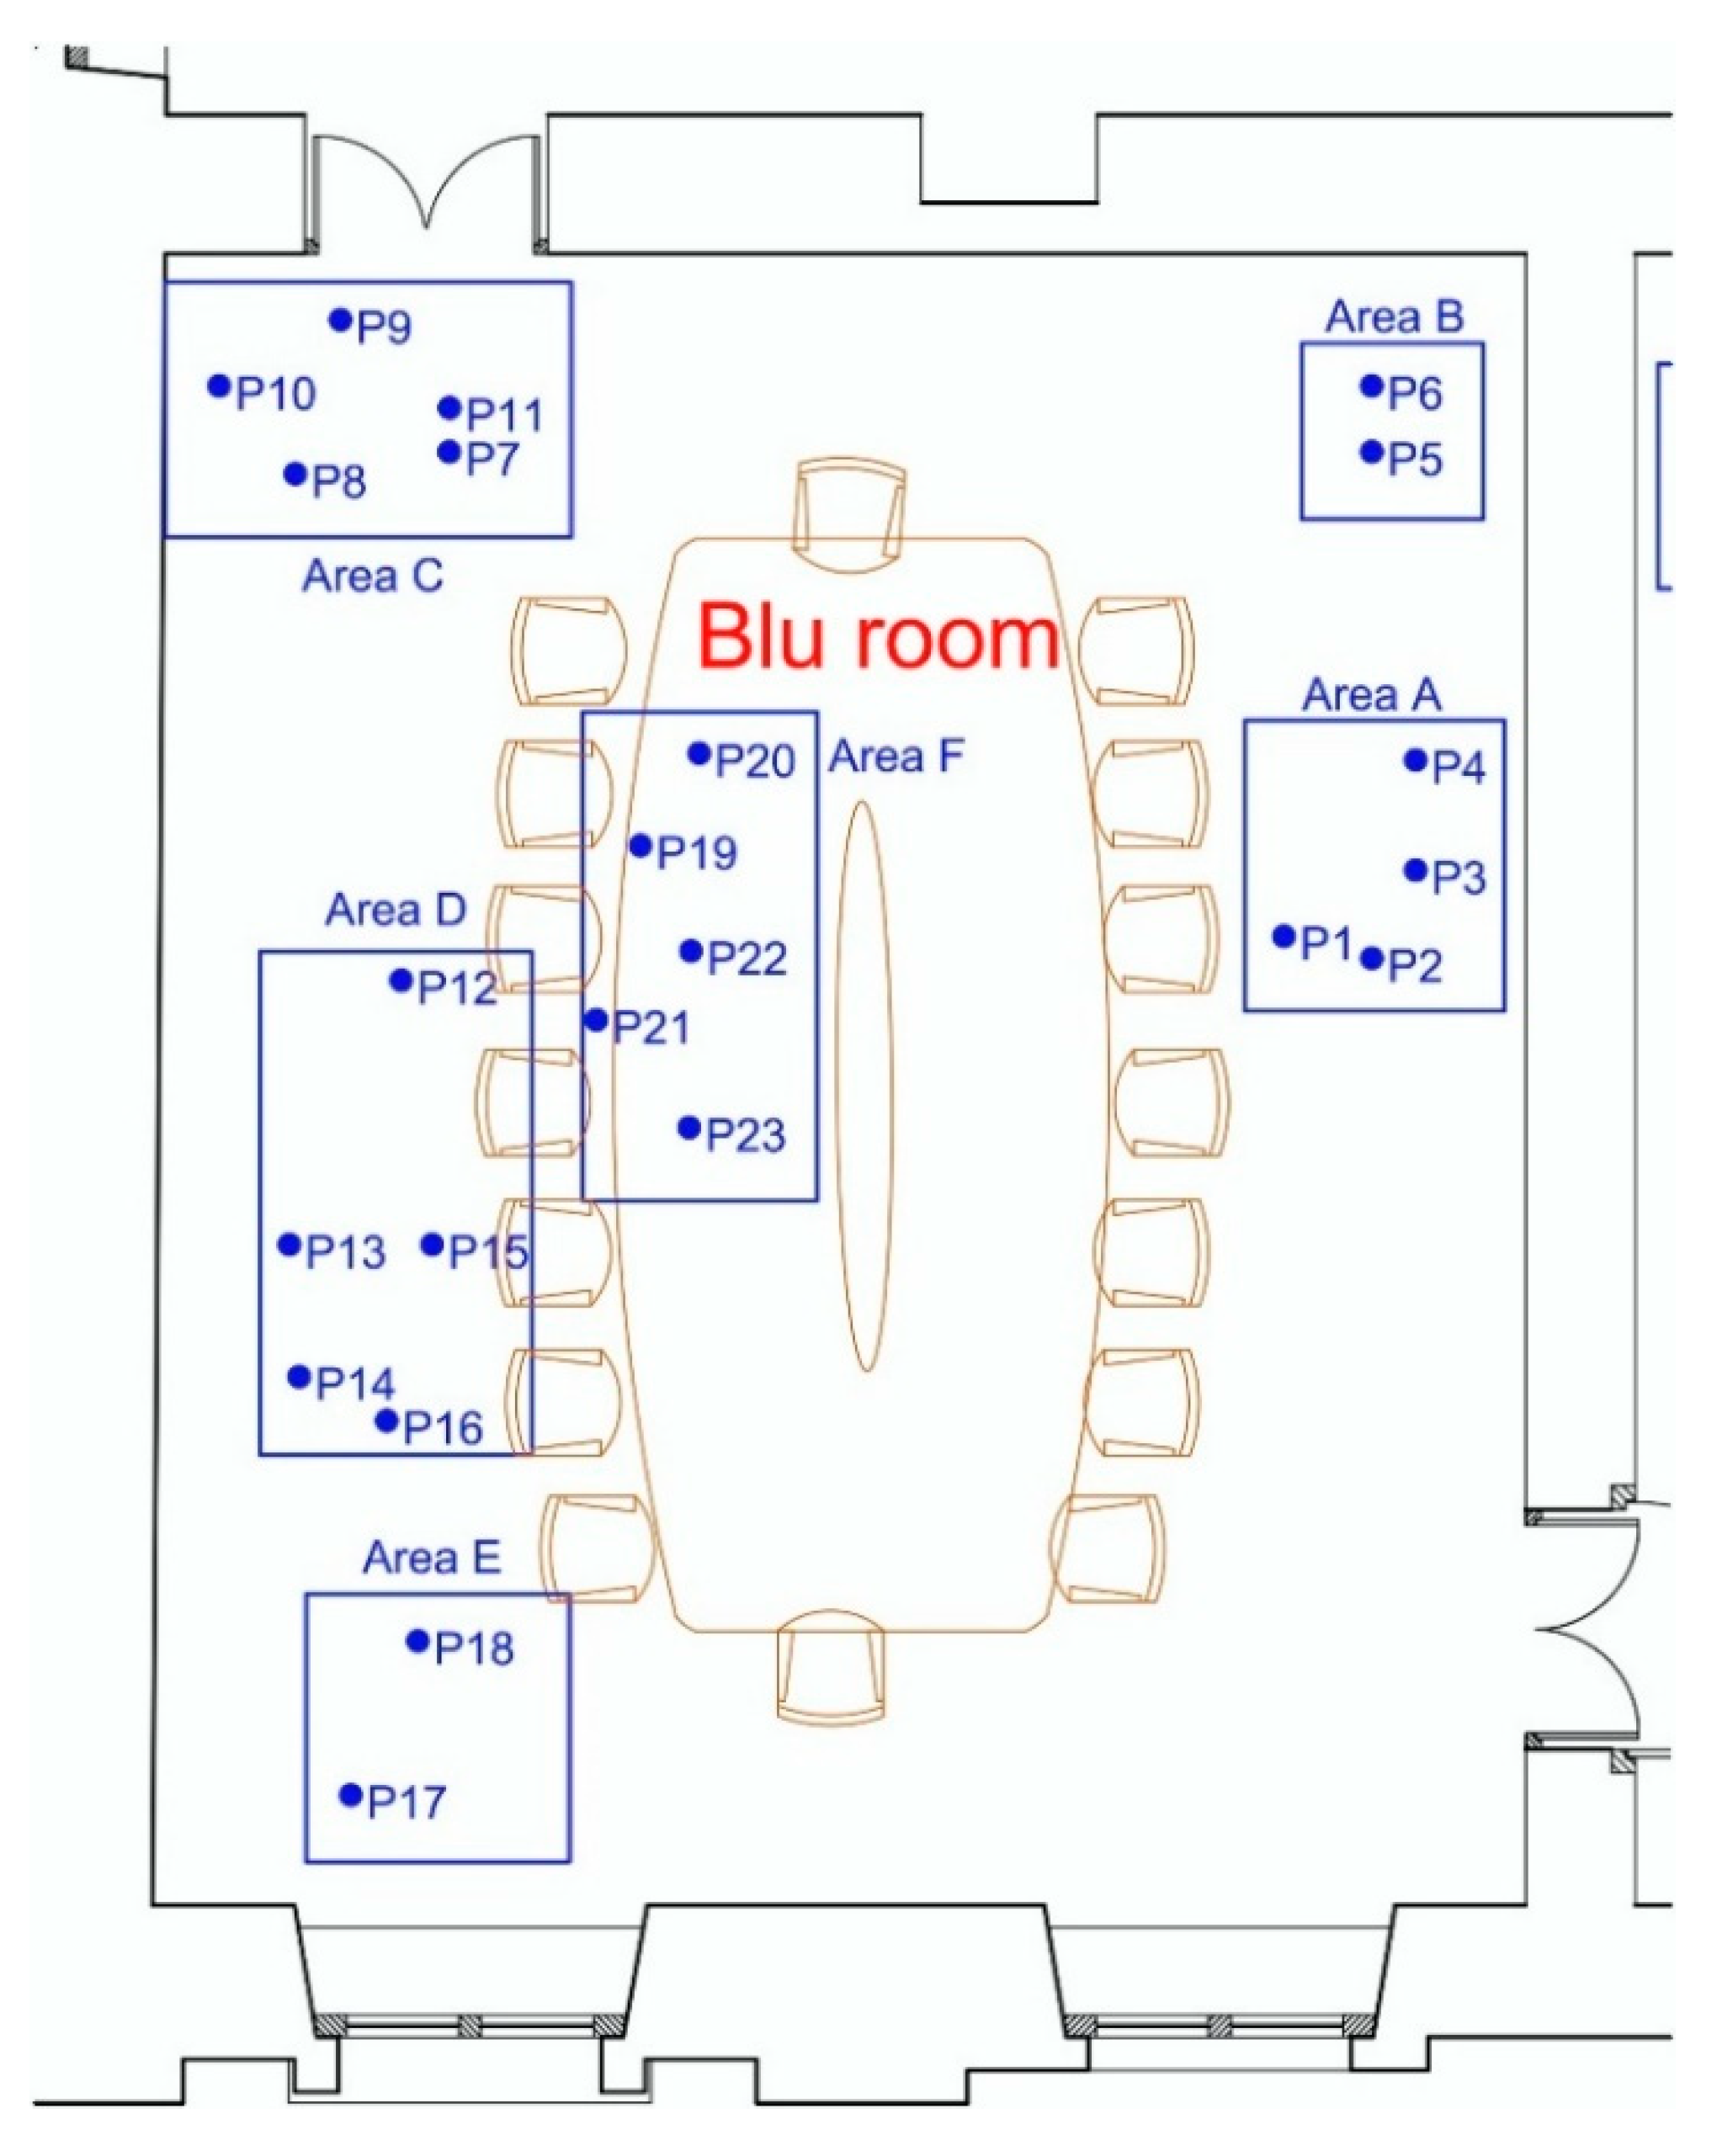
Figure 9), Blu (
Figure 10 and
Figure 11), and Giunta rooms (
Figure 12 and
Figure 13).
Table 1,
Table 2 and
Table 3 show the coefficient averages for each point.
It is possible to observe that most of the points tested had a return coefficient
e lower than 1. This means that the energy returned was lower than that emitted, because part of this energy was dissipated by the tested structure through sufficient bonds in the interface between the plaster and the masonry surface. On the contrary, the return coefficient
e > 1 showed a returned energy greater than the one emitted: in this case the material was already damaged [
4,
5] because it was partly or completely disconnected and returned more energy due to the deformations and the microscopic movements active due the non-perfect adherence between plaster and masonry surface.
5. Discussion
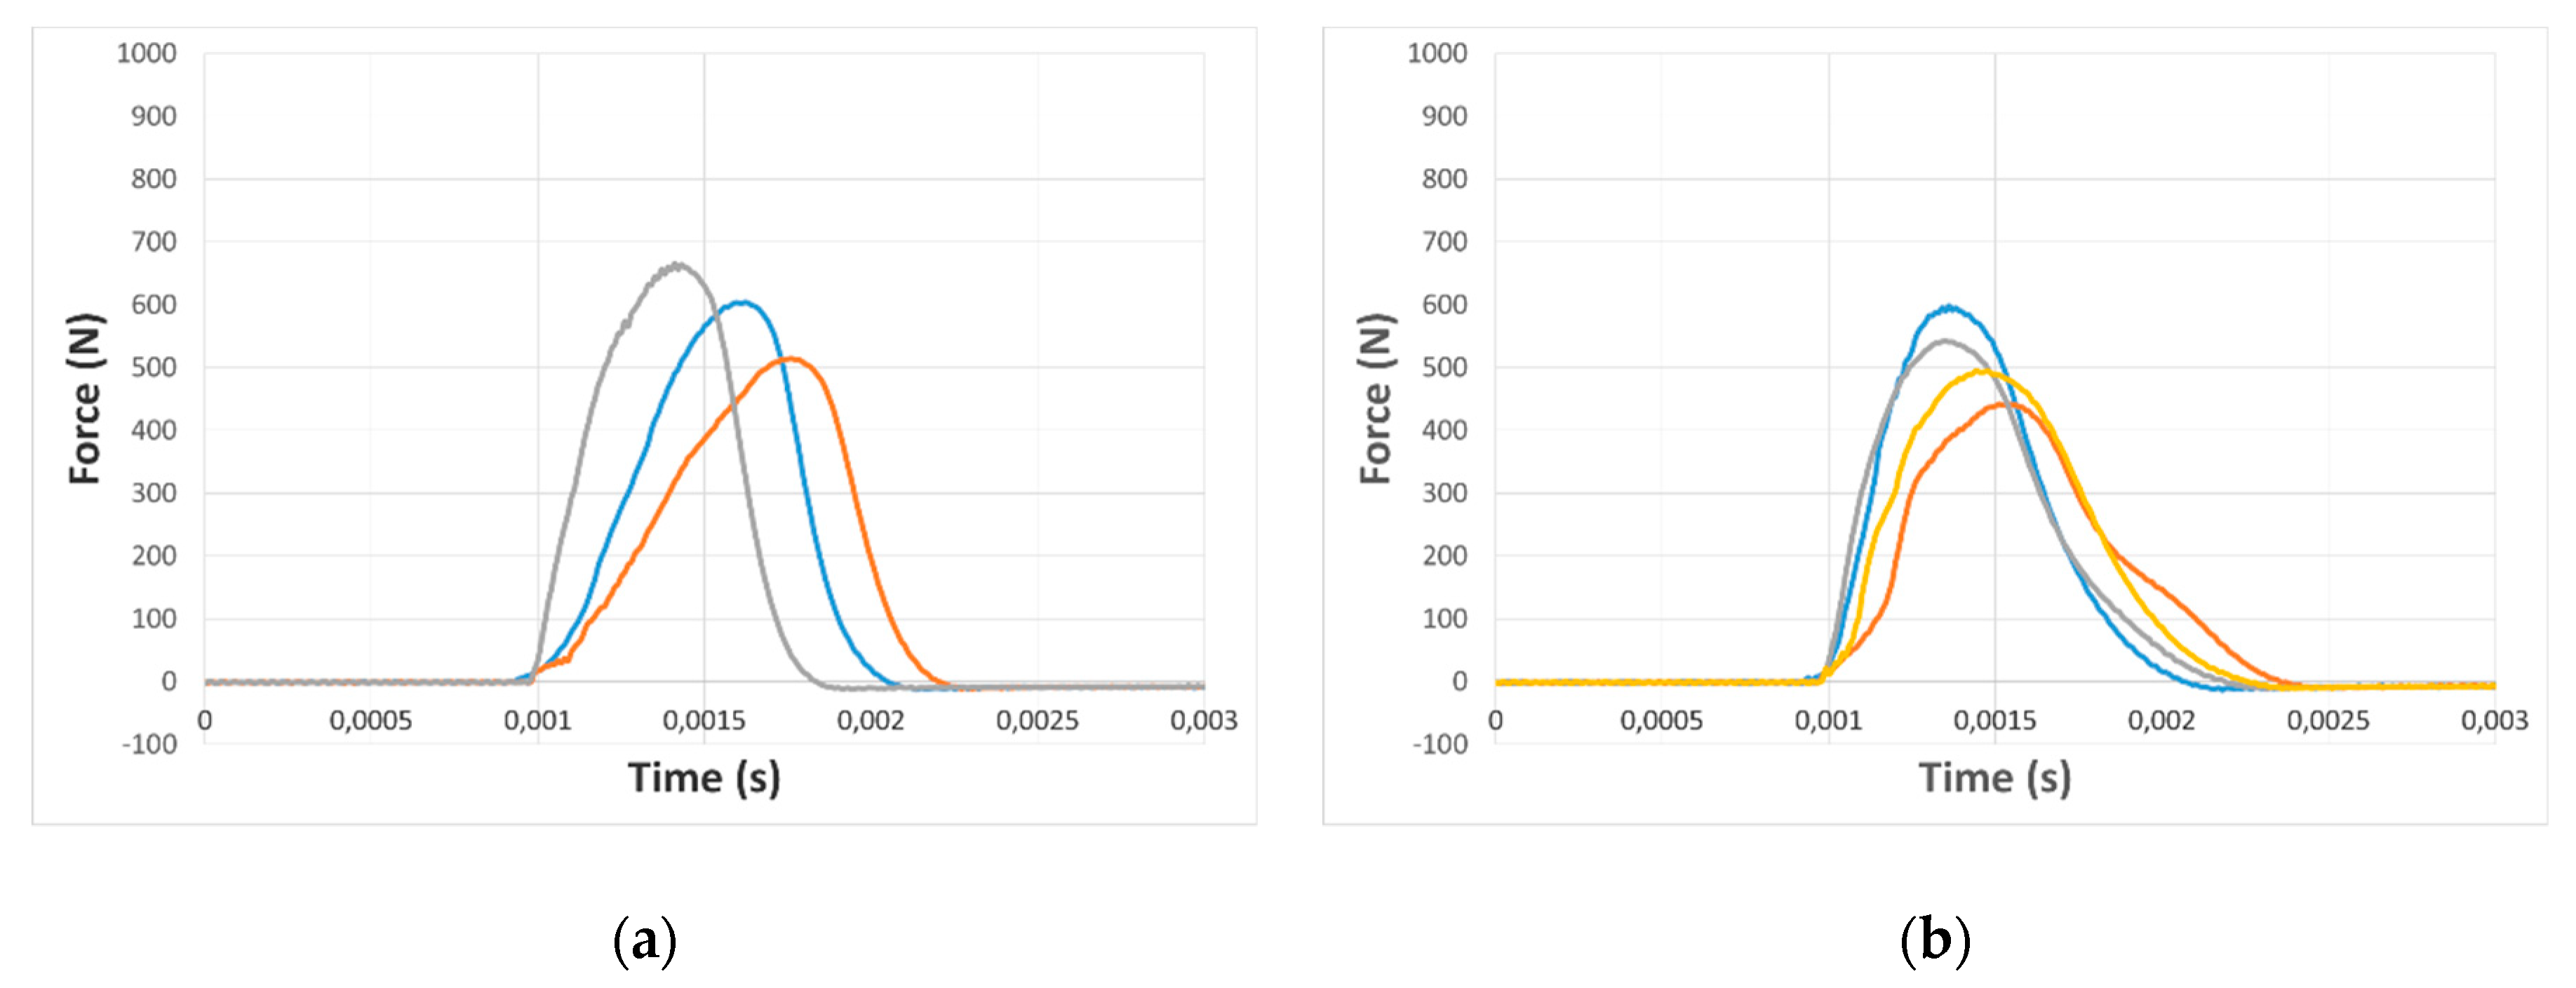
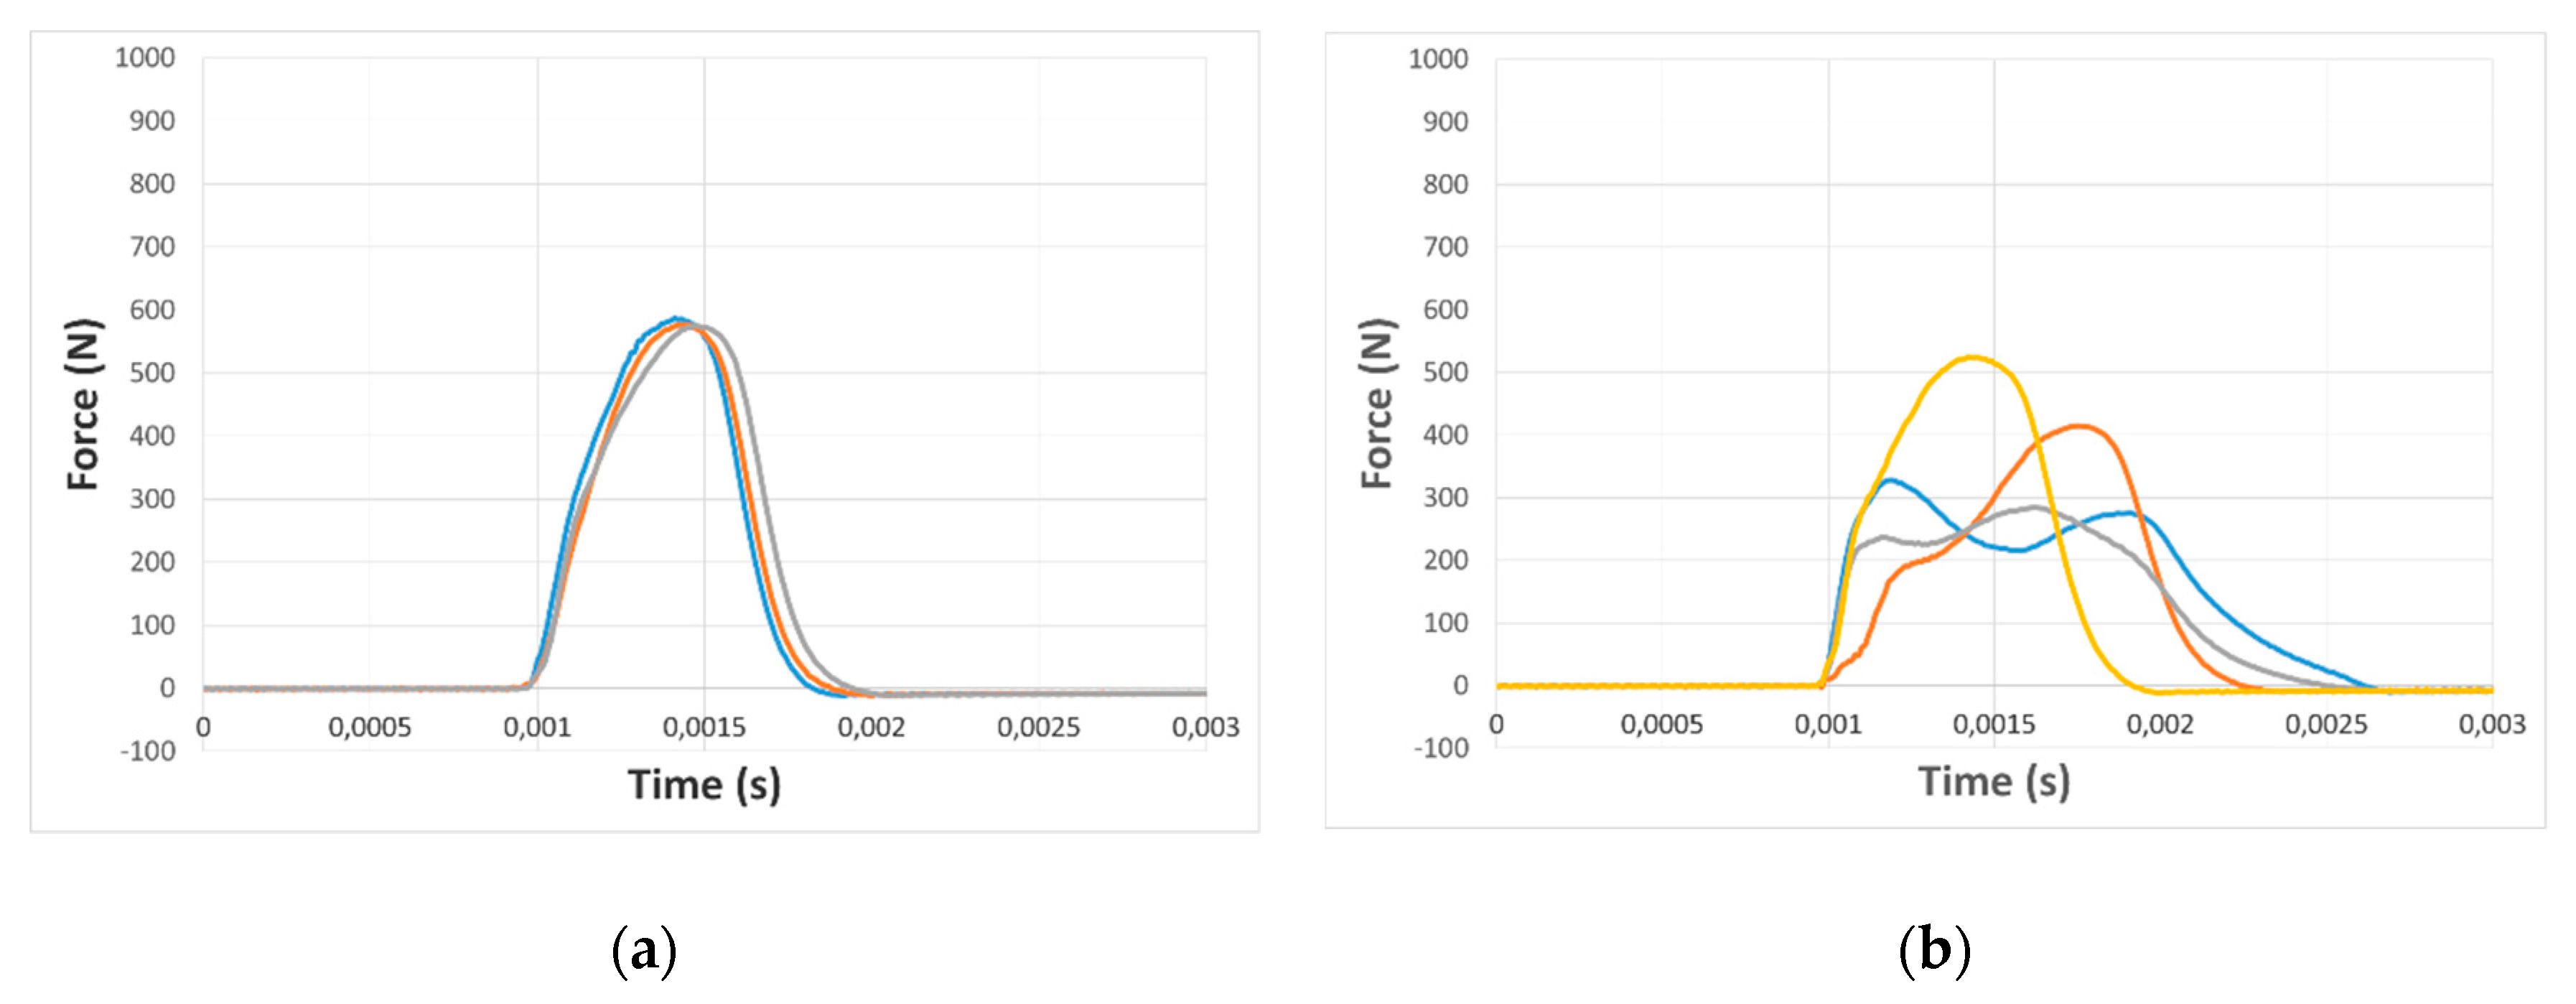
The points where the plaster was still adherent to the wall surface showed more symmetrical and regular force–time curves, with higher values than the maximum impact force as the material was more compact (
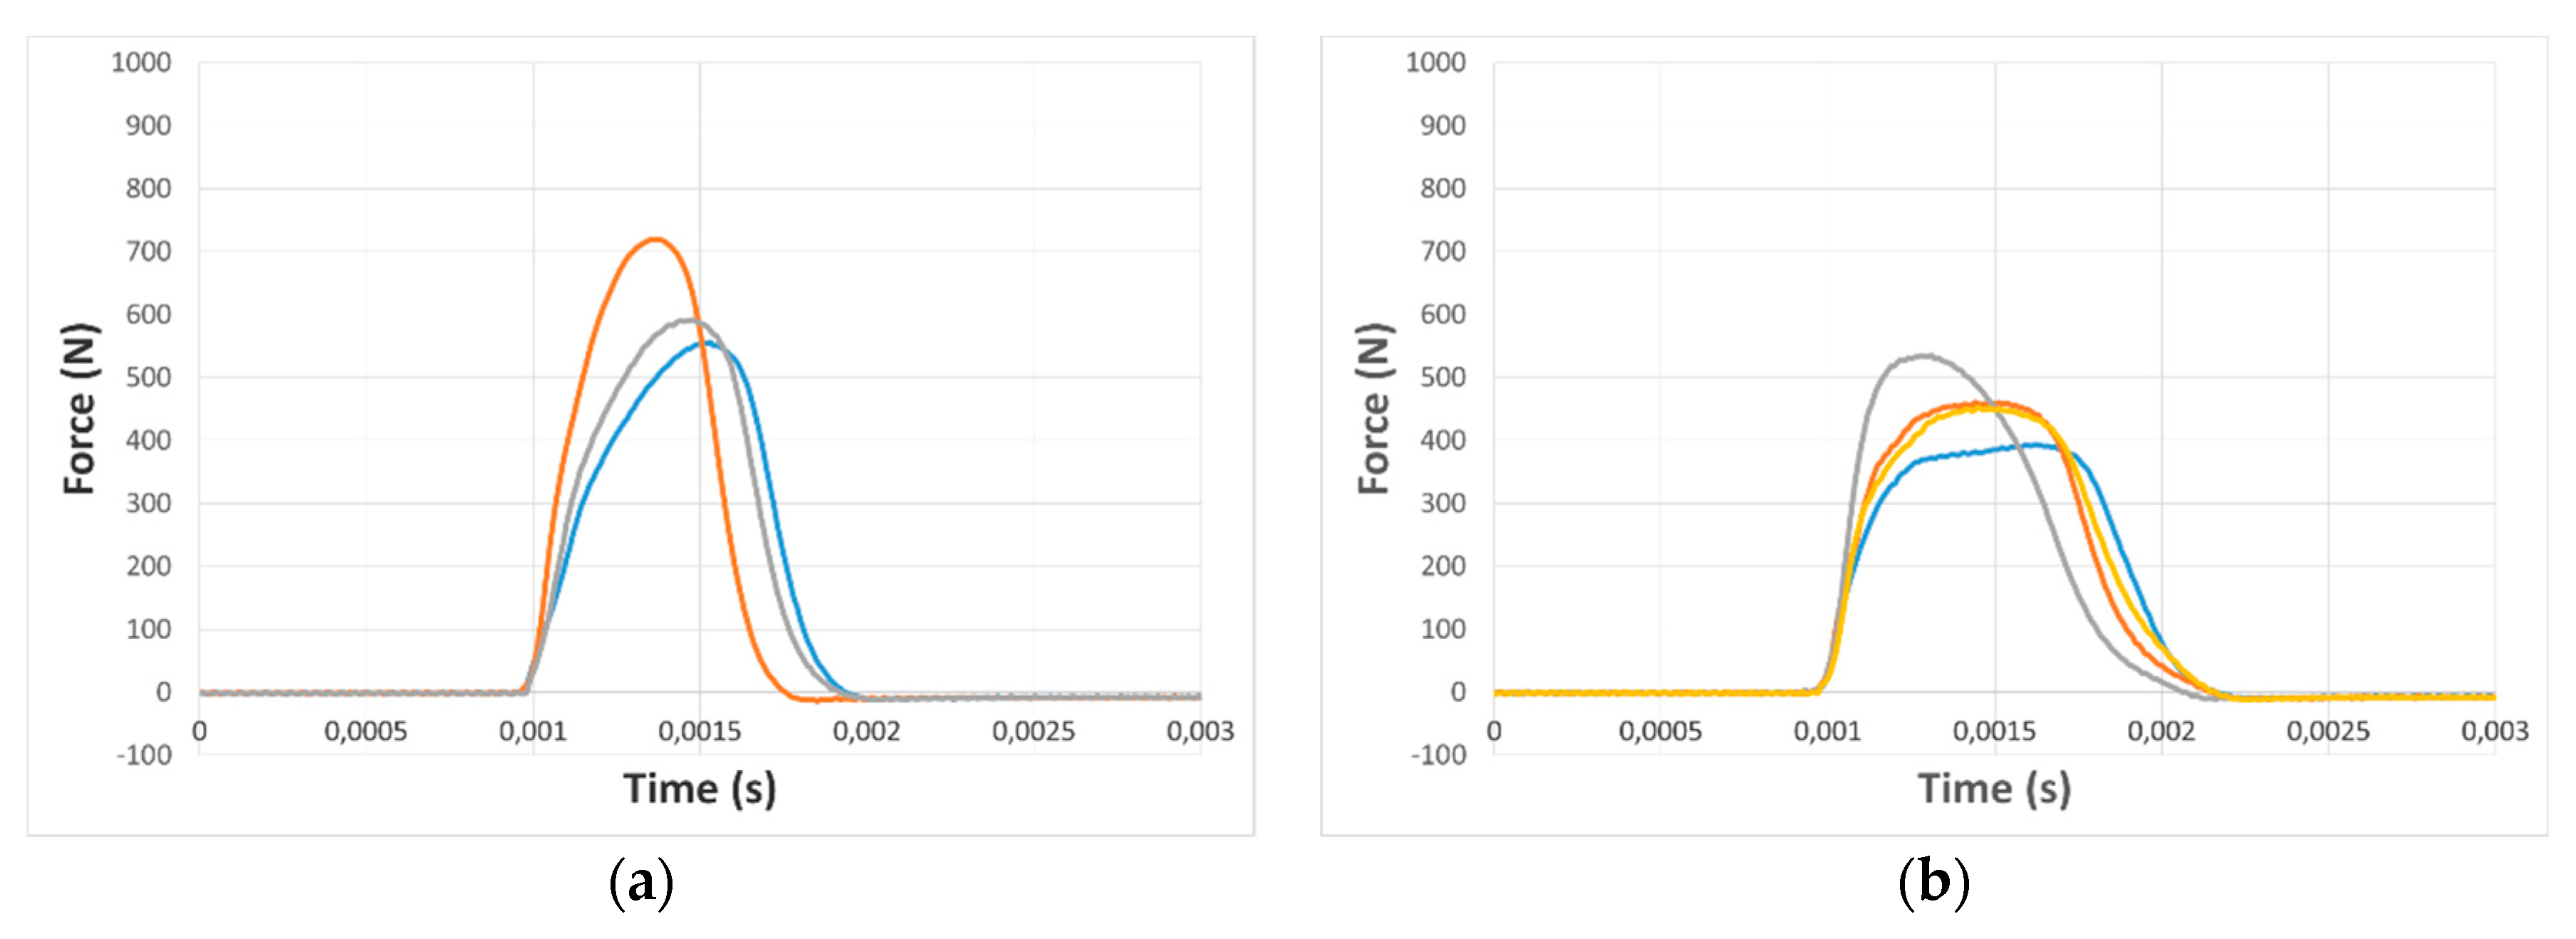
Figure 9a,
Figure 11a and
Figure 13a). On the contrary, in the points already covered by previous stuccoing, lower values of the maximum force and more asymmetric curves were recorded in which the area after maximum force was greater than that which preceded it (
Figure 9b,
Figure 11b and
Figure 13b).
Overall, the impact test showed the stability and safety of the adhesion between decorated plaster and masonry surfaces of the vaults examined in the three rooms. Some points of lesser safety regarding adherence have emerged. Some of these concerns point to previously stuccoed areas only a few decades old. This point highlighted the potential critical stability of some of the plaster, which had already been the subject of micro-grouting, and for which restorations had not been perfectly carried out. On the contrary many other previously stuccoed points showed a return coefficient <1. The impact method was therefore also useful to qualify the effectiveness of previous restoration work.
On the masonry vault of the rooms some points of potential detachment of plaster have been found, characterized by a return coefficient
e > 1 (
Table 1,
Table 2 and
Table 3). These results were in agreement with what has been possible to perceive qualitatively with a simple hand knock on the point under investigation. Some of these points with a high return coefficient were stuccoed previously, a sign that some critical issues of potential detachment already existed in the past (
Figure 14). In some cases, as for point P15 of the Giunta room, the impact method confirmed the presence of an installation channel that feeds the chandelier as a zone with weak adherence of the plaster (
Figure 13b and
Figure 14b).
The decorated surfaces of the vaults therefore appeared to be in a good state of conservation. The ramified cracks present in most of the surface derive from the shrinkage effects of the historical plaster mortar, due to different reasons: climatic conditions, setting of the binders (lime and cement), binder/inert quantity ratio.
6. Conclusions
The impact method was used to evaluate the adherence of the decorated plaster of some masonry vaults. The method confirmed its non-destructive typology and has proved its validity also for the diagnostics of historical buildings. In the campaign tests carried out to evaluate the adherence of the decorated plaster on three masonry vaults of the Birago Palace (Turin, Italy), the impact method clearly highlighted points of critical and potential detachment, as well as confirmed the effectiveness of the consolidation of many previously stuccoed points.


