Article

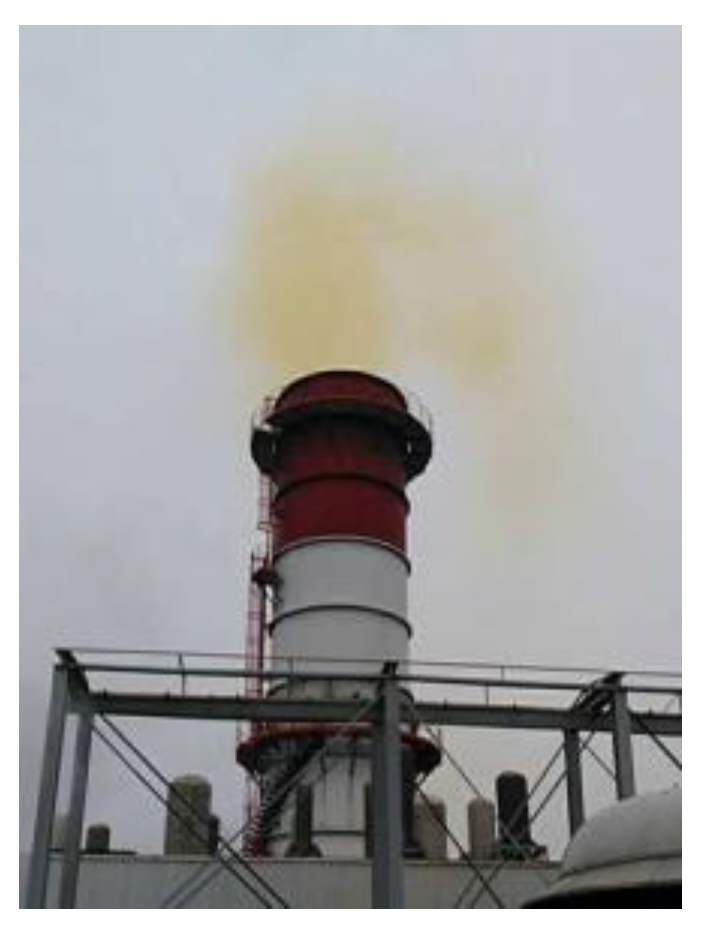
Mechanism Research and Countermeasure Analysis of Yellow Plume during the Gas Turbine Start-Up Period

1
GUODIAN Environmental Protection Research Institute Co. Ltd., No. 10 Pu dong Road, Nanjing 210000, China
2
Insititute of Engineering Thermophysics, Chinese Academy of Sciences, No. 11 North Fourth Ring West Road, Beijing 100190, China
*
Author to whom correspondence should be addressed.
Appl. Sci. 2019, 9(2), 251; https://doi.org/10.3390/app9020251
Submission received: 25 October 2018 / Revised: 29 December 2018 / Accepted: 7 January 2019 / Published: 11 January 2019
(This article belongs to the Section Mechanical Engineering)

Abstract

:
The problem of yellow plume exists in most heavy-duty gas turbine units under start-up and low load conditions. How to suppress the yellow plume is a difficult problem in gas turbine power plants. It is judged that yellow plume is caused by the high NO2 concentration in flue gas. From the point of view of mechanism research, this study analyzed the causes of yellow plume by numerical simulation combined with experimental research; obtained influence factors of the conversion of NO into NO2; analyzed the degree of influence of these factors on the formation of yellow plume; verified the results through on-site measurement of a 6FA gas turbine unit; and finally proposed the countermeasures to suppress yellow plume from the gas turbine side and the heat recovery steam generator (HRSG) side.

1. Introduction

Gas-fired power generation is cleaner and more efficient than coal-fired power generation, thus, in recent years, China’s installed capacity of natural gas power generation has expanded rapidly under the background of increasing economic affordability. By the end of 2017, the installed capacity of China’s natural gas power generation projects was 75.7 gigawatts, accounting for 4.3% of the total installed capacity of the country. According to the “13th Five-Year China electricity plan”, China’s installed capacity of gas power generation projects will reach 110 million kilowatts in 2020. As China’s gas-fired power plants are mainly located in economically developed and environmentally sensitive areas, the pollutant emission standards of gas power plants are getting higher and higher [1,2]. At present, the emission problem of yellow plume of the gas turbine still exists in most domestic heavy-duty gas turbine units under start-up and low load conditions, as shown in Figure 1. How to suppress yellow plume is a difficult problem to be solved urgently in gas power plants. It is judged that yellow plume is caused by the increase of NO2 content in flue gas. From the point of view of mechanism research, this study used numerical simulation combined with experimental research to analyze the causes of yellow plume and obtain the influence factors of yellow plume. Combined with the on-site measurement results of one 6FA gas turbine unit, the study analyzed and verified the preceding results, and gave the countermeasures to suppress yellow plume.

2. Research Progress

2.1. International Research Progress

Tuttle, Shisler and Mellor [3] studied the yellow plume phenomenon of gas turbine exhaust, showing that the emitted nitrogen oxides contained more NO2. Laurendeay [4] proposed simple mechanism conditions for NO decomposition and NO2 formation in typical combustion. Chen [5] found that the higher is the CH4 ratio, the higher is the proportion of NO2 in the product NOx by changing the ratio of H2-CH4 in the fuel.Klaus [6] and others conducted studies on the spectral measurement of NOx and successfully developed a system that can measure gas turbine exhaust. Feitelberg and Correa [7] simulated the chemical reaction of the turbine exhaust in the heat recovery steam generator (HRSG). The calculations show that CO and NO in flue gas can promote oxidation to generate NO2 at less than 800 °C. However, this study lacks in-depth analysis and experimental study of the effects of CO volume fraction, NO volume fraction, temperature, steam volume fraction and other components. Sorrentino, Sabia, Bozza, Ragucci and Joannon [8] found that internal exhaust gas recirculation represents a promising strategy to stabilize the oxidation process for new technologies that limit system temperatures to reduce pollutants (NOx and CO) emissions. Galbiati, Cavigiolo, Effuggi, Gelosa and Renato [9] studied the possibility of reducing fuel–NOx emissions using a laboratory-scale burner for mild combustion. However, neither Sorrentino nor Galbiatit analyzed the influencing factors of NO2 formation, mainly discussing the influencing factors of NOx formation instead.

2.2. Research Progress in China

Xu Wei [10] measured the smoke composition of GE’s STAG 109FA SS gas turbine and its matched three-pressure reheat HRSG. The unit has a NO2 volume fraction of 67 × 10−6 between 25 MW and 80 MW load, and the smoke is reddish brown. When the load is between 80 MW and 125 MW, NO2 volume fraction can reach 23 × 10−6, and the smoke is yellow.
Through the measurement of the flue gas composition during the start-up period of the gas turbine, Wang Weiqun [11] and others analyzed that the smoke from the chimney is mainly caused by NO2 in the flue gas and presented a proposal to reduce NOx emissions, but did not thoroughly analyze the influencing factors of yellow smoke or study the influence of flue gas parameters in the HRSG on the formation of yellow plume.

3. Study on the Mechanism of Yellow Plume

Two methods were used to study the mechanism of yellow plume of gas turbines: numerical simulation and experimental research.

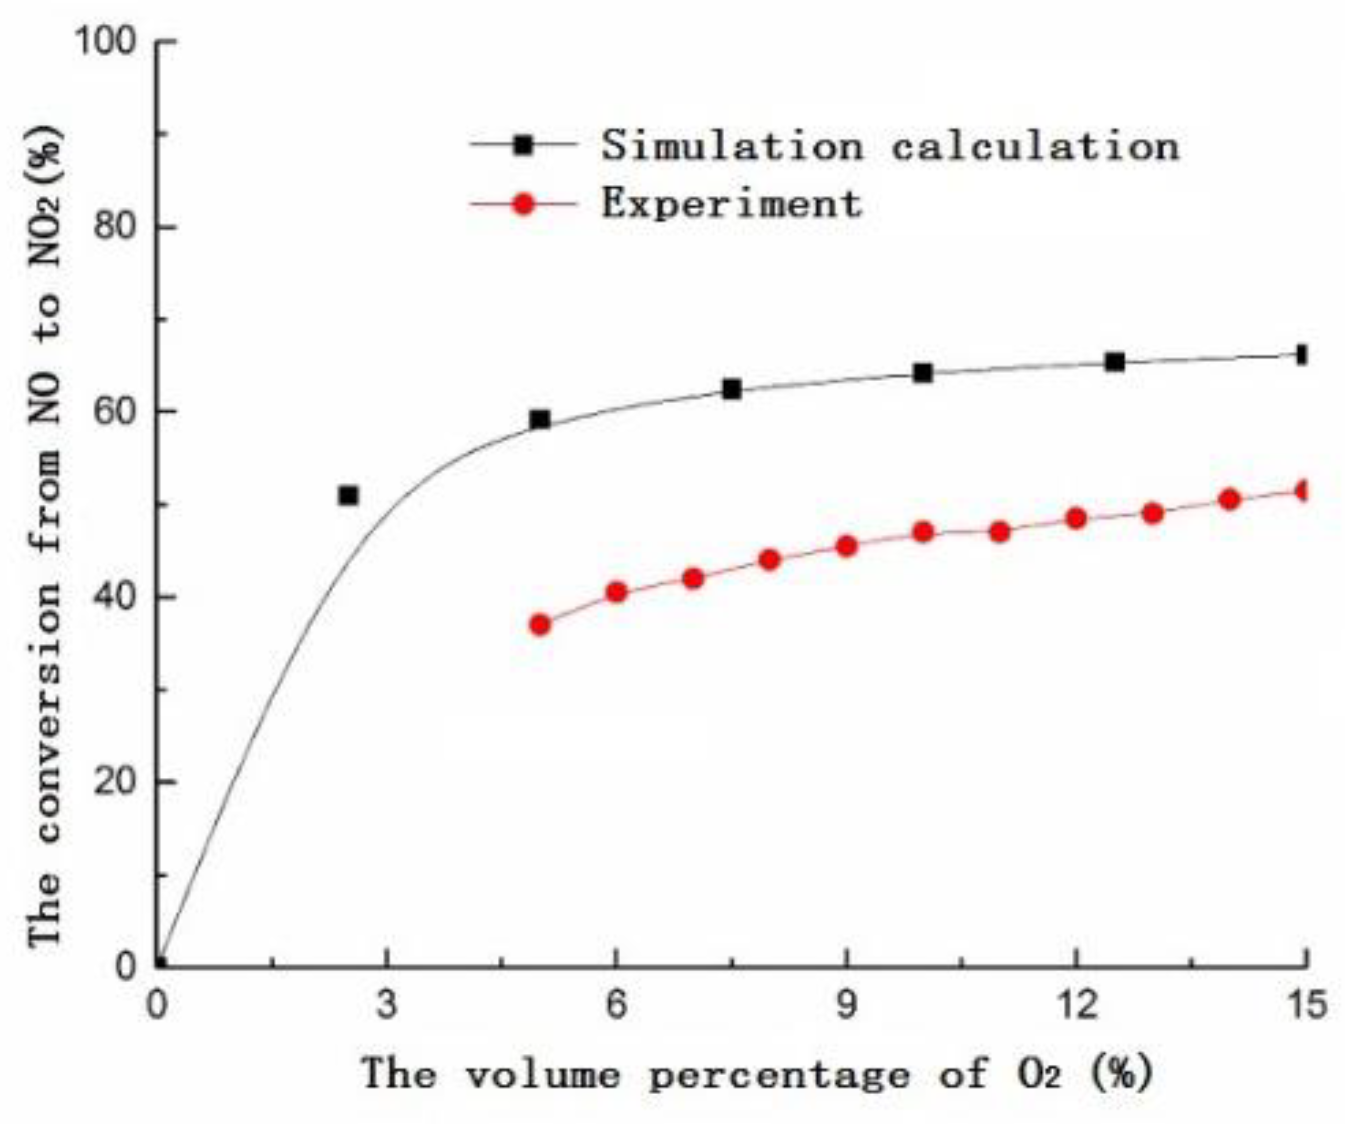
3.1. Numerical Simulation

This project was aimed at studying the turbine exhaust conditions during the start-up period of the gas and steam combined cycle [12,13], using CHEMKIN simulation method which is a subroutine that can be used to solve chemical problems with flowing combustion processes. [14]. By changing the temperature of the flue gas and the volume fraction of O2/CO/H2O in the flue gas, this study investigated the influence of various factors on the conversion of NO to NO2, which would provide a theoretical basis for finding a feasible and effective method to suppress yellow plume.
As shown in Figure 2, the plug–flow model was used to calculate the reaction law of NO conversion to NO2 under a certain flue gas condition and residence time, and the model put forward the following five hypotheses: (1) the flow of reactants is in steady state; (2) the reactants do not mix in the flow direction; (3) the reactants is in a one-dimensional flow state on the radial direction; (4) the model ignores the role of viscous force; and (5) the reactants meet ideal gas properties.
The volume percentages of reactants components of the gas turbine under the basic operating conditions are: CO, 50 × 10−6; CO2, 0.04; H2O, 0.09; N2, 0.749925; NO, 25 × 10−6; O2, 0.12. The residence time (reaction time) of the gas was assumed to be 2 s.
The reaction mechanism was as follows: the mutual promotion of oxidation of CO and NO occurs through a three-step chain reaction mechanism of self-conduction [15,16,17].
As shown in Figure 3, the first step of the reaction is not to stabilize the pyrolysis of the substance, but to react slowly. The first two steps of the reaction produce the free radical OH, thus initiating a chain reaction. Then, the third, fourth and fifth reactions lead to the oxidation of NO and CO, and the three-step reactions do not have a net consumption of free radicals. When the temperature is less than 550 °C, every mole of CO is oxidized into CO2, while one mole of NO is oxidized into NO2. At lower temperature (<450 °C), the first step of the reaction is too slow to provide enough free radical O.
When the temperature is too high (above 650 °C), free radical H is easily destroyed. If the free radical H is destroyed, it will lead to oxidation decoupling of CO and NO. For example, as the temperature increases, the fourth step of the reaction will become weaker, and the free radical H is destroyed as follows:
H + O2 → OH + O
When the temperature is about 850 °C, about 50% of free radical H at the fourth step is destroyed, and the rest free radical H is destroyed by Reaction (6). In addition, only 20% of the consumed HO2 results in NO oxidation to NO2. The rest of free radical HO2 is destroyed as follows:
HO2 + OH → H2O + O2
The reactor was insulated from the outside and the temperature was set to be constant. From 400 to 950 °C, the residence time of mixed gases in the reactor was 2 s at each temperature.

3.2. Experimental Research

As shown in Figure 4, each gas was supplied by gas tanks, and the gases were mixed by a flow controller E according to a certain ratio, and the flow rate of the added water was controlled by the peristaltic pump F. The mixed gas entered the heating cable G for preheating, and then entered the electric resistance furnace H for heating. The reacted gases were discharged through the smoke analysis instrument I. The controllable flow rate of the flow controller was 0–1000 mL/min, the temperature of the heating cable was controlled by the temperature controller, the maximum power of the resistance furnace was 1 kW, the rated temperature was 900 °C, and the flow control range of the peristaltic pump was 0.00025–48 mL/min.
The residence time of the gas in the experiment was also about 2 s, the same as the CHEMKIN software. The data of the four experiments were arithmetically averaged and compared with the data calculated by CHEMKIN software. As shown in Figure 5, the experimental and calculated NO conversion trends are basically the same. However, the peaks of the two results are in different temperature ranges. Because the gas stayed in the resistance furnace for a short period of time and was heated to the corresponding temperature in the experiment, it took more time. However, the results of the simulation calculations and the experiments are highly consistent in terms of trends.

3.3. Mechanism Analysis

Figure 6 shows that, as the temperature increases, the NO conversion rate first increases and then decreases. In the interval of 650–700 °C, the NO conversion rate reaches the highest, which is about 60%. When the temperature is lower than 450 °C or higher than 850 °C, the conversion rate of NO to NO2 is extremely low. Figure 6 shows that, when there is no CO in the inlet gas, the conversion of NO is very low. The conversion of NO significantly increases when the CO is introduced into the resistance furnace. The concentration of CO in flue gas is 50 ppm. It is indicated that CO has the effect of promoting the conversion of NO to NO2.
Figure 7 shows that, as the volume fraction of the inlet CO increases, the conversion rate of NO increases, when the reaction temperature is 550–650 °C. It takes a certain amount of time for the gas to be heated to the corresponding temperature during the experiment, but the gas stays in the resistance furnace for a short time. Thus, due to the limitation of the retention time, the experimental was not fully carried out under the ideal condition. As a result, the conversion rate of the simulation calculation is higher than that of the experiment.
Figure 8 shows that, in the experiment, the O2 concentration change has little effect on the conversion of NO to NO2. When the oxygen concentration reaches 12% or more and the reaction temperature is around 650 °C, the conversion rate of NO in the experiment is basically maintained at 40–50%. However, if there is no oxygen, the conversion rate will be very low.
Figure 9 shows that the NO to NO2 conversion rate decreases with the increase of the inlet NO volume fraction when the reaction temperature is around 650 °C. Because NO and NO2 are contaminants, it is not recommended to reduce the conversion rate from NO to NO2 by increasing the concentration of NO.
Figure 10 shows that, in the absence of water vapor, the NO conversion ratio is lower. The NO conversion ratio in the experiment is slightly higher than the calculation results, but it is still below 10%. When water is added, the volume fraction of water vapor reaches 9%, and the conversion rate is greatly improved. Therefore, water vapor is an important condition for the conversion of NO to NO2.
In the experiment on water vapor, the residual gas was discharged using N2 at the end of the experiment, and the sudden expansion and shrinkage section in the heater caused a small portion of the gas residue, which may have resulted in a small portion of the gas residue in the heating furnace. Therefore, the conversion rate without water addition in experiment is higher than the conversion rate of simulated calculation.
During the start-up period of the gas turbine, the main factors affecting the generation of yellow plume are the CO content and temperature. CO, which is produced by incomplete combustion, is the main influencing factor of NO conversion to NO2. At the temperature range of 600–700 °C, the concentration ratio of NO to NO2 is the highest. Simultaneously, the oxygen content and water vapor content in the flue gas are important influencing factors of the generation of yellow plume. The presence of oxygen and water vapor has a significant impact on conversion rates, but, if oxygen and water vapor are present and reach a certain concentration, then the effect of increased concentration on the conversion rate is less pronounced.

4. On-Site Measurement of the 6F Unit

To verify the influencing factors of yellow plume, the author chose a gas and steam combined cycle unit for on-site measurement. The PG 6111FA+E unit was selected for this test. The unit is equipped with DLN2.6 burners. The burners are improved compared to DLN2.0+ burners [18]. Each combustion chamber has 1 PM1 nozzle, 2 PM2 nozzles, 3 PM3 nozzles and 15 QUAT nozzles, as shown in Figure 11. The PM1 nozzle is placed in the center, the PM2 and PM3 nozzles are evenly arranged around the PM1, and the 15 QUAT nozzles are placed at the edge of the combustion chamber. The fully premixed combustion mode [19] is adopted in the burners.
To analyze the effect of the internal environment of the HRSG on the conversion from NO to NO2, the positions of the measuring points are marked in the red circles of Figure 12: Test Point 1 is the inlet position of the diffusing section, Test Point 2 is the inlet position of the HRSG, and the Point 3 is the outlet of the chimney of the HRSG.
At the on-site test, the yellow plume was produced more under the low-load conditions (lower than 50% rated load) of start-up process, as shown in Figure 13 and Figure 14. Yellow plume is caused by high NO2 content in the exhaust.

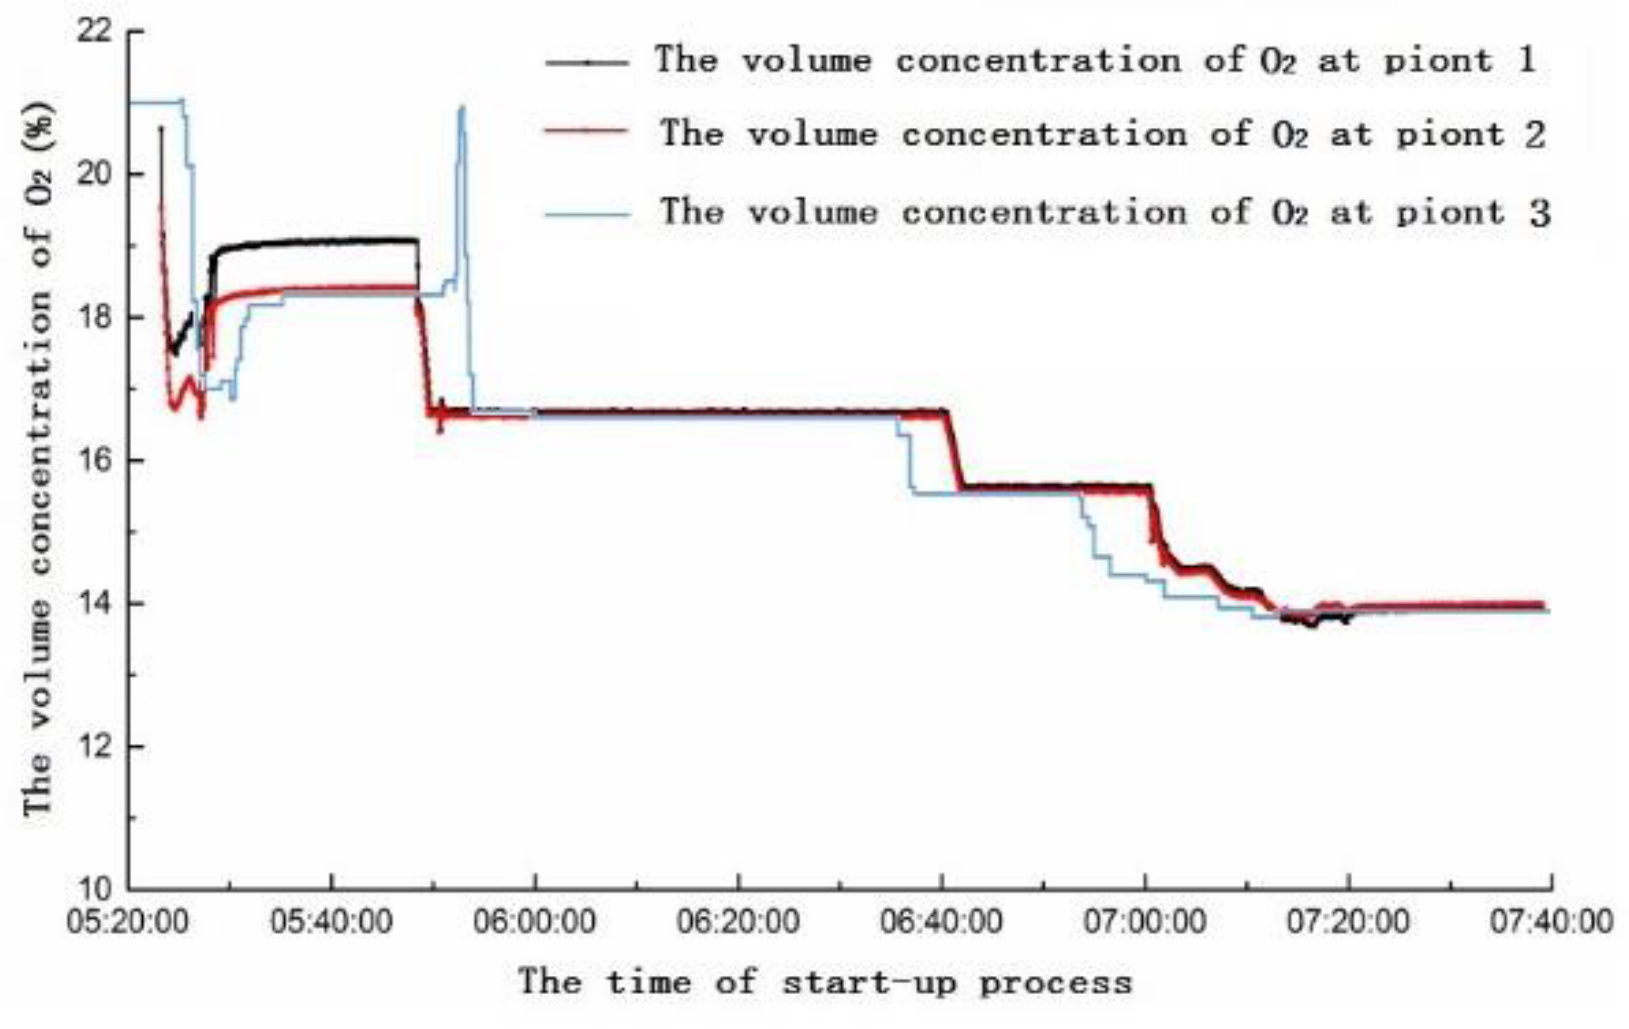
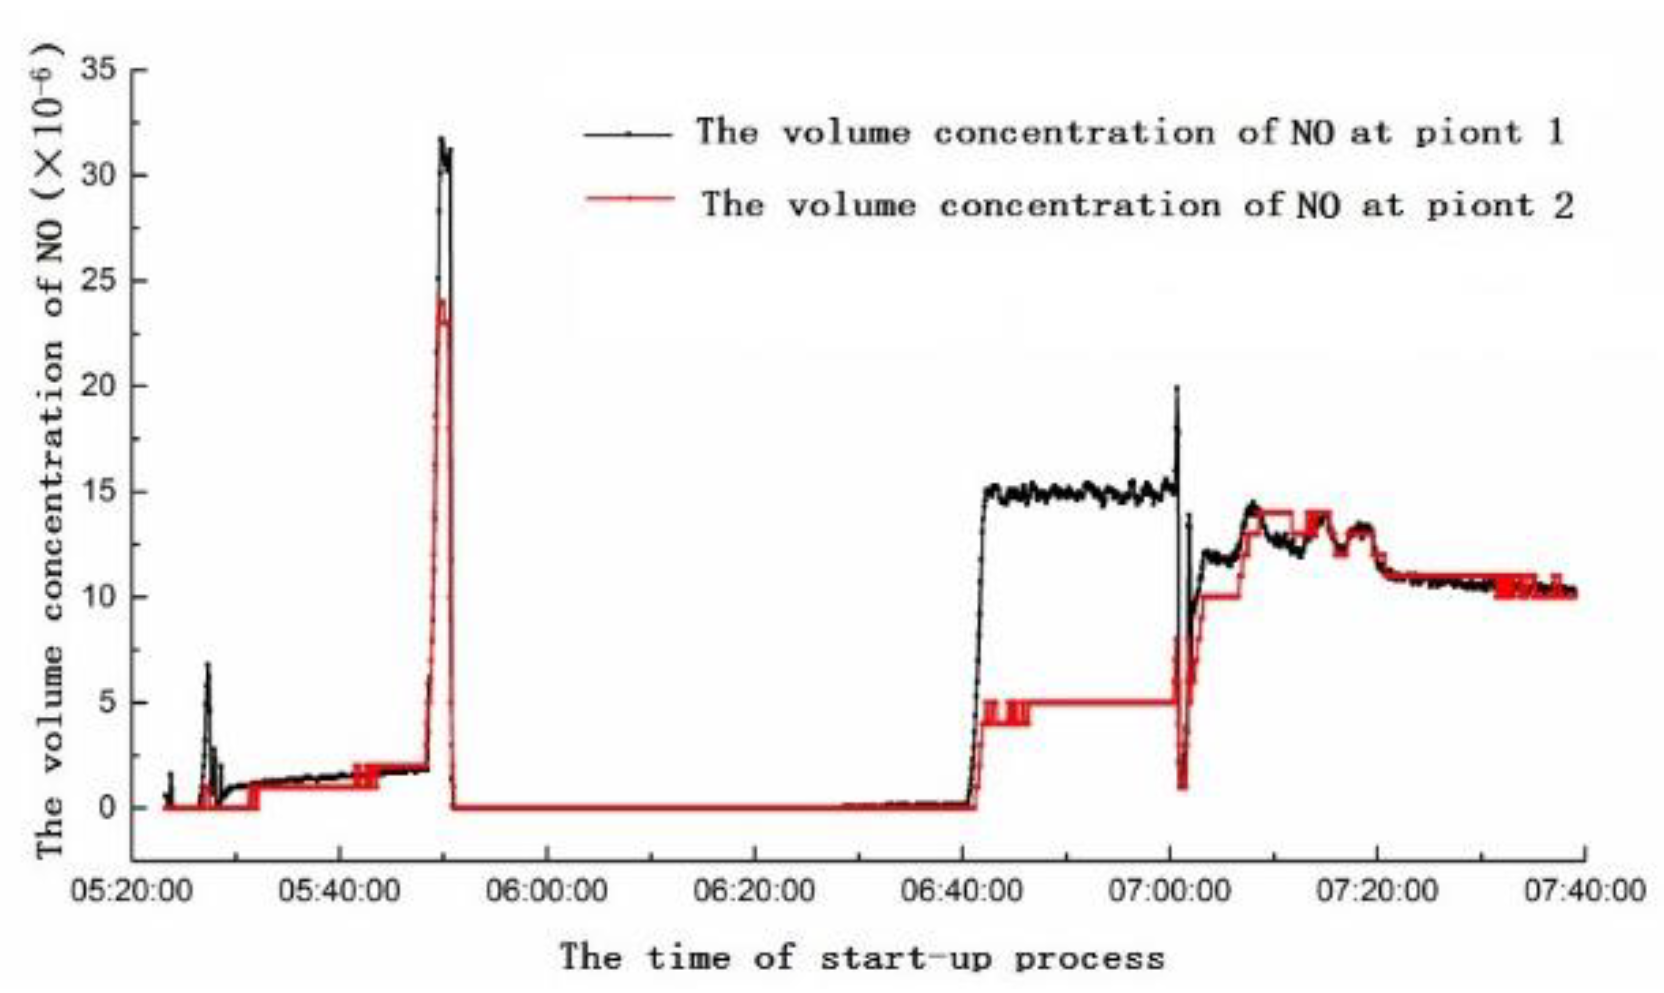
4.1. Analysis of Yellow Plume Formation at Different Stages of the Start-Up Period

During the start-up period of the gas turbine, when the unit has no load, the NO2 is mainly generated from the combustion chambers of gas turbine and the diffusion section where the conversion from NO to NO2 happens because of rich-oxygen. As can be seen in Figure 13, Figure 14 and Figure 15, when the gas turbine reaches a load of 10 MW, the exhaust temperature of the gas turbine reaches 500 °C, and the NO2 is mainly from the combustion chambers of gas turbine. As can be seen in Figure 15, Figure 16 and Figure 17, when the gas turbine reaches the load of 14–15 MW, the exhaust gas temperature reaches 600 °C, the CO and oxygen concentrations are sufficient, and the NO2 in the exhaust comes from two parts: one is produced in the combustion chambers of gas turbine, and the other is produced by the conversion of NO to NO2 in diffusion section, which connects the gas turbine with the HRSG.

4.2. Analysis of the Position of Yellow Plume Formation in HRSG

In the HRSG, the conversion of NO into NO2 occurs in the diffusion section. The main reasons that the reaction conditions convert NO to NO2 are provided. The temperature is high (close to the turbine exhaust temperature), the concentrations of carbon monoxide and oxygen are sufficient, and residence time (reaction time) is enough (about 1 s). When the flue gas enters the heat exchange surface of the HRSG, it is rapidly cooled to below 500 °C, and then the conversion reaction becomes slow. In Figure 18 and Figure 19, it can be seen that the process of converting from NO2 to NO happens in the region between Point 2 and Point 3 from 6:00 to 6:40.

5. Analysis of Countermeasures for Yellow Plume

5.1. Discussion on Control Measures from Gas Turbine Side

The yellow plume is mainly from the gas turbine side. As shown in Figure 20, the nozzles of the 6F unit are adjusted during the start-up period. As shown in Figure 21, the fuel flow rate and the opening angle of the compressor inlet guide vanes (IGV) of the 6F unit are changing during the start-up period.
During the start-up period, the burner adjustment and unit pollutant emission are summarized as follows:
(1)
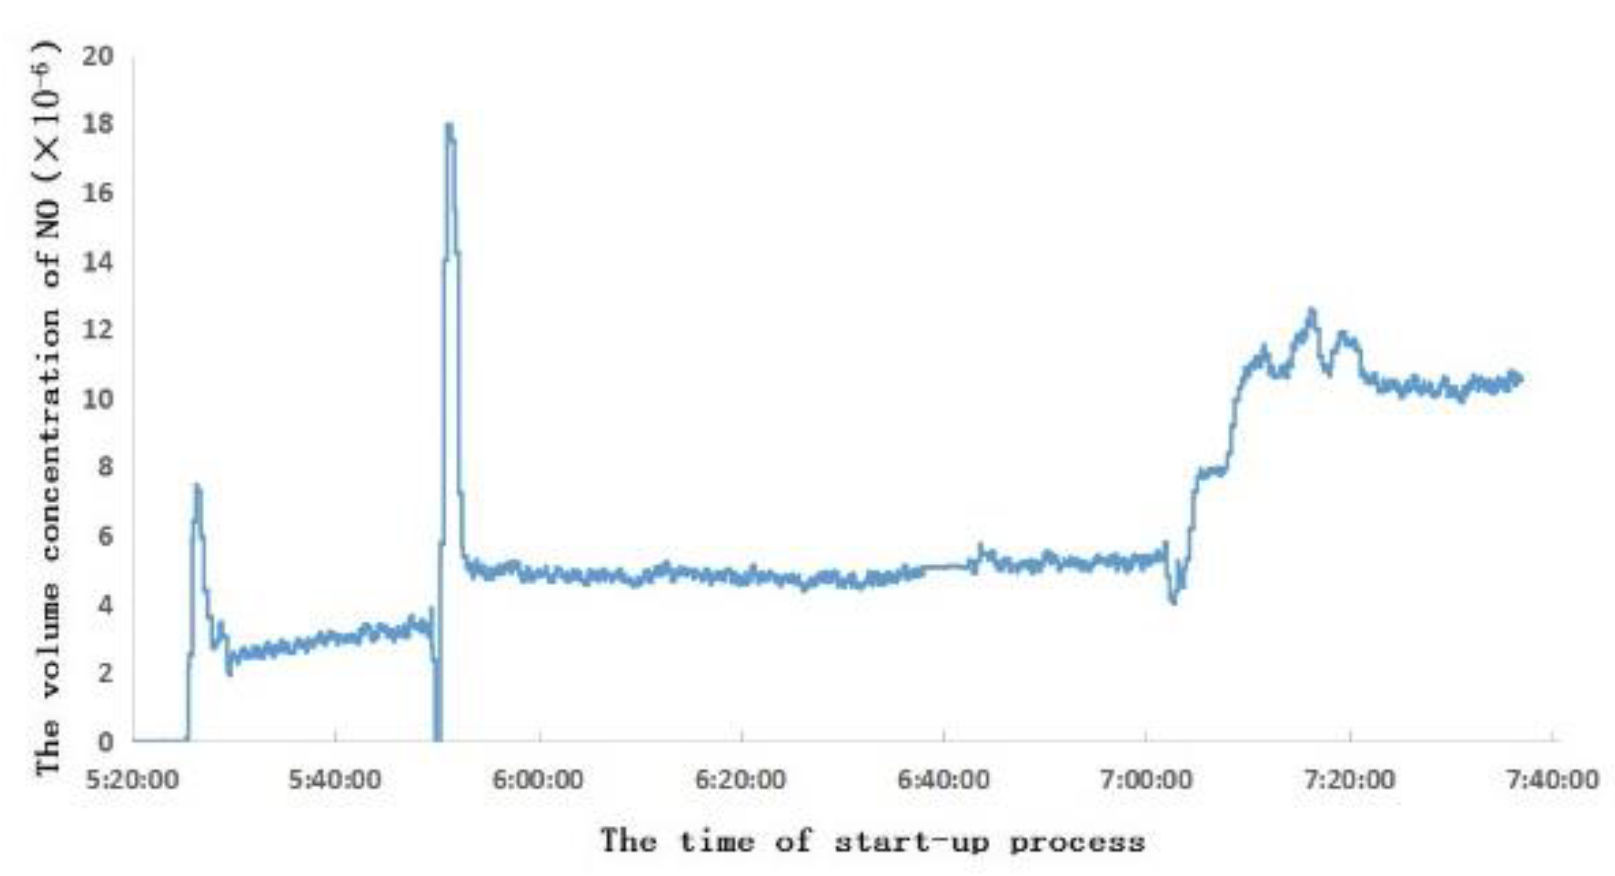
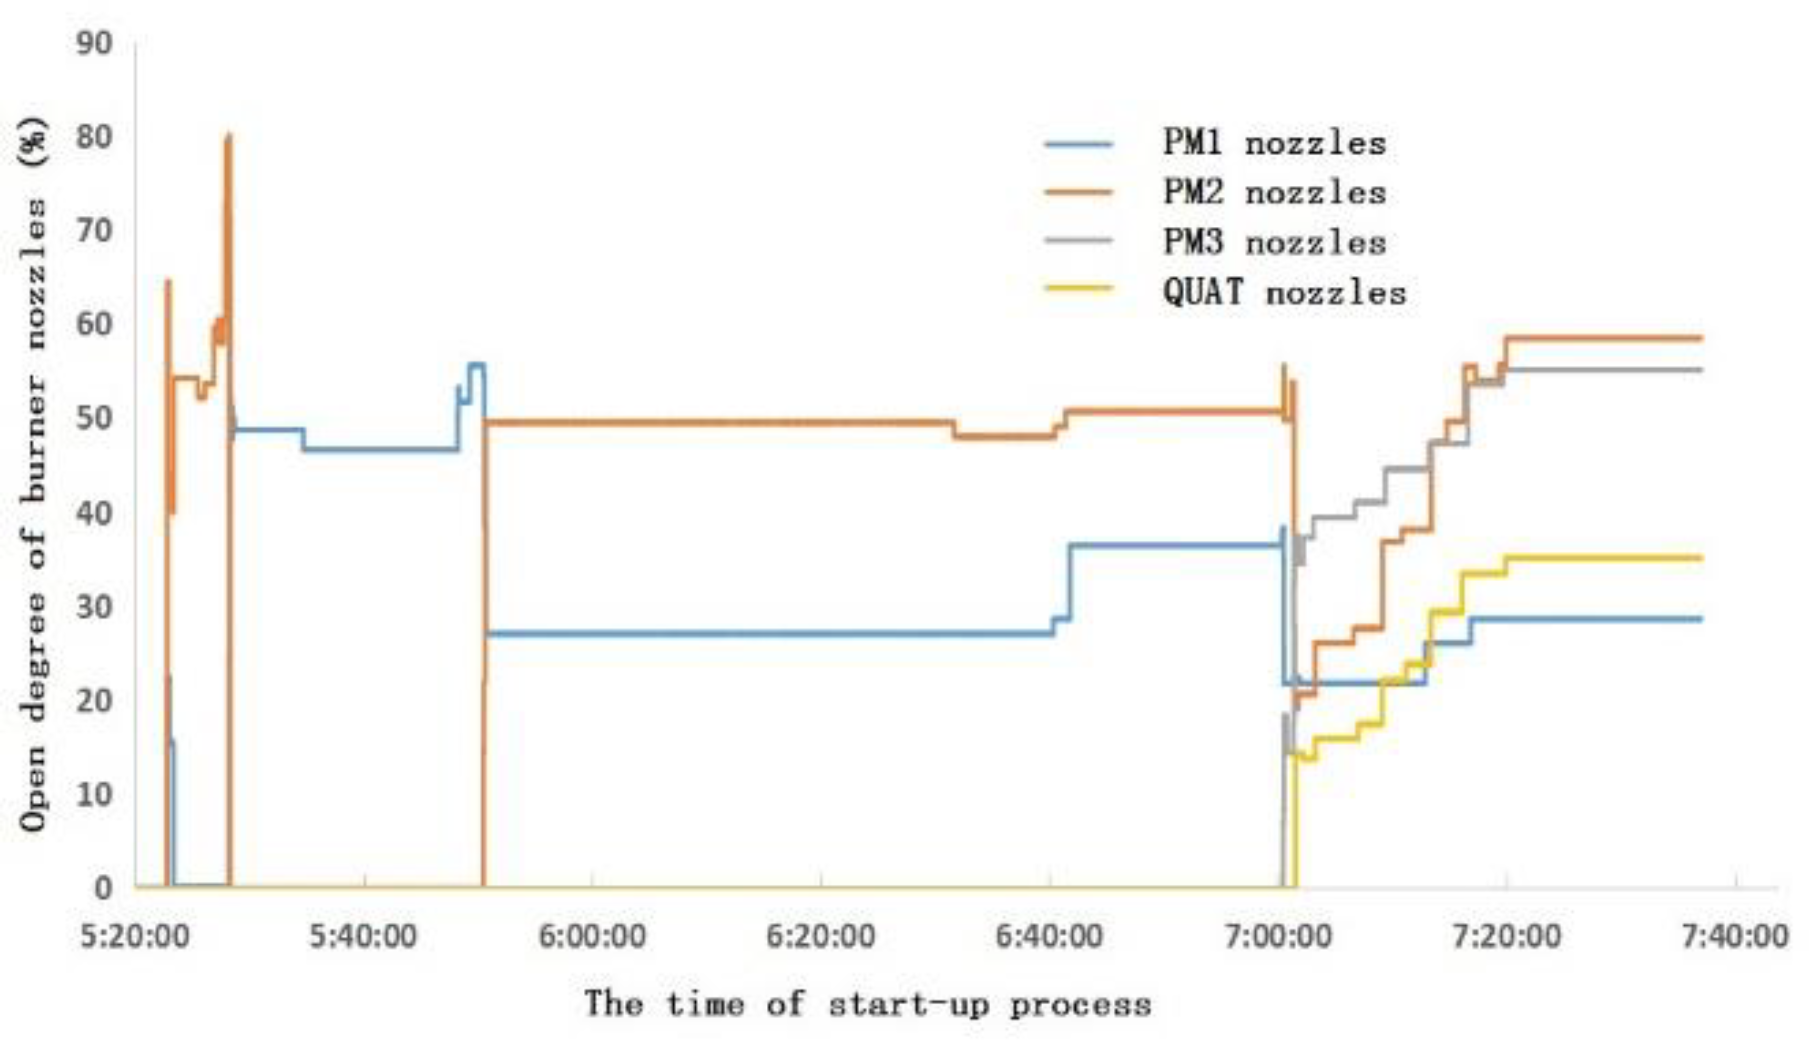
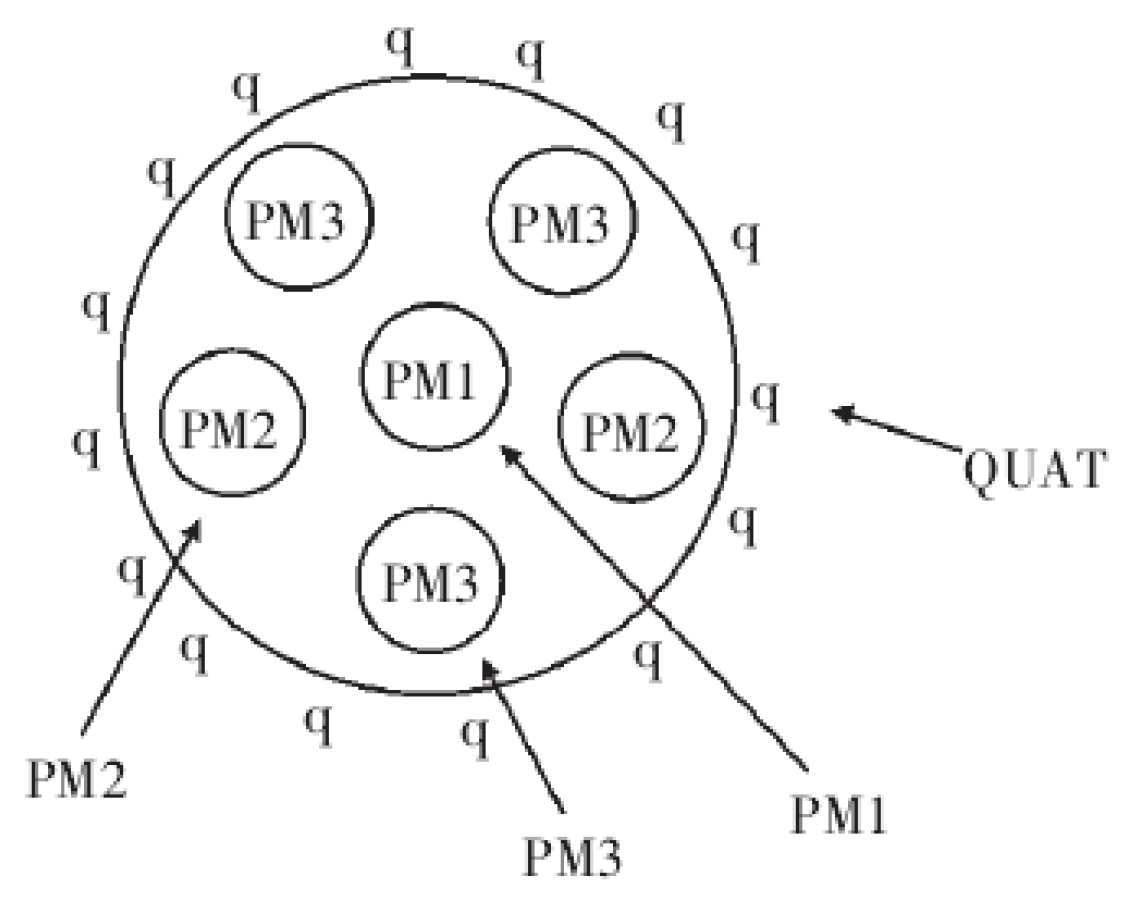
The gas turbine starts to ignite, PM1 and PM2 open simultaneously. With the success of ignition, gas flow of PM2 gradually increases, while gas flow of PM1 gradually decreases. When only the PM2 nozzle is opened, the NO is relatively low. When the open degree of PM2 reaches 80%, there is a sudden increase of NO concentration.
(2)
When the rated speed of gas turbine reaches 95%, PM1 nozzle begins to open, while PM2 gradually reduces the amount of fuel until the fuel valve is fully closed. When only PM1 nozzle is open, the unit and the NOx concentrations change little. Then, the unit starts to connect to the grid.
(3)
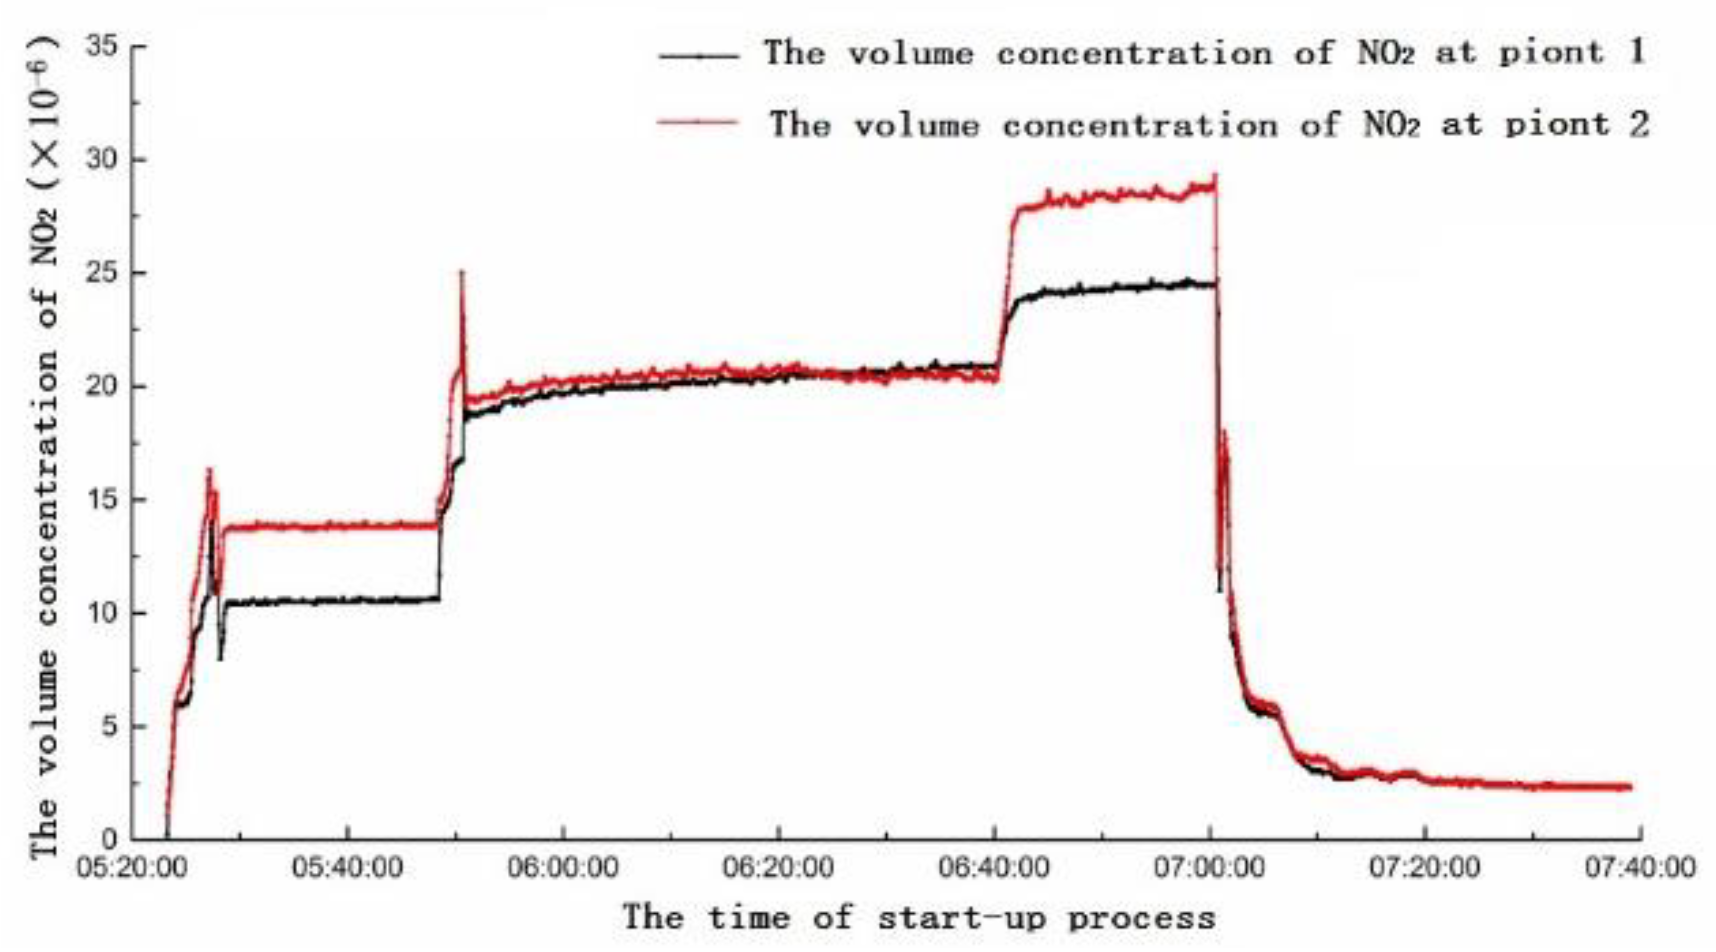
When the gas turbine is connected to the grid successfully and begins to load up, the combustion mode is switched over and PM2 is put into operation. In the switching process, the combustion temperature is relatively high, and the NO reaches the highest value. With the open degrees of PM2 and PM1 entering a stable state, the NO rapidly drops back to normal, and the NO2 enters a stable and high concentration period. After that, the open degree of PM1 increases, and the gas turbine load increases. With the increase of combustion temperature, NO concentration increases slightly from the previous stage, and NO2 enters the highest concentration period.
(4)
When the gas turbine needs to increase to the base load, the combustion mode changes again. The open degrees of PM2 and PM1 decrease, PM3 and QUAT nozzles gradually open, and the switching moment has the characteristics of sudden increase of NO concentration. After switching successfully, PM1, PM2, PM3 and QUAT nozzles all open. Then, the nozzles gradually increase open degree, and the gas engine load increase. At this time, the combustion temperature of gas turbine increases gradually, the concentration of NO increases gradually, and the concentration of NO2 has a gradual downward trend. Because the open degree of each nozzle is changing, the concentration of NO has small fluctuations. Although PM1 is in premixed mode, its fuel coefficient (fuel equivalent ratio) is relatively high, which plays a role in stabilizing the flame and adjusting combustion dynamic stability. PM2 and PM3 nozzles are in the lean combustion limit region or even slightly lower. Subsequently, the gas turbine reaches the stable base load; at this time, the fuel flow rate of each nozzle reaches the optimal ratio, and the concentrations of NO and NO2 reach a steady low state.
Based on the above research and analysis, several measures to suppress the yellow plume from the gas turbine side are proposed as follows:
(1)
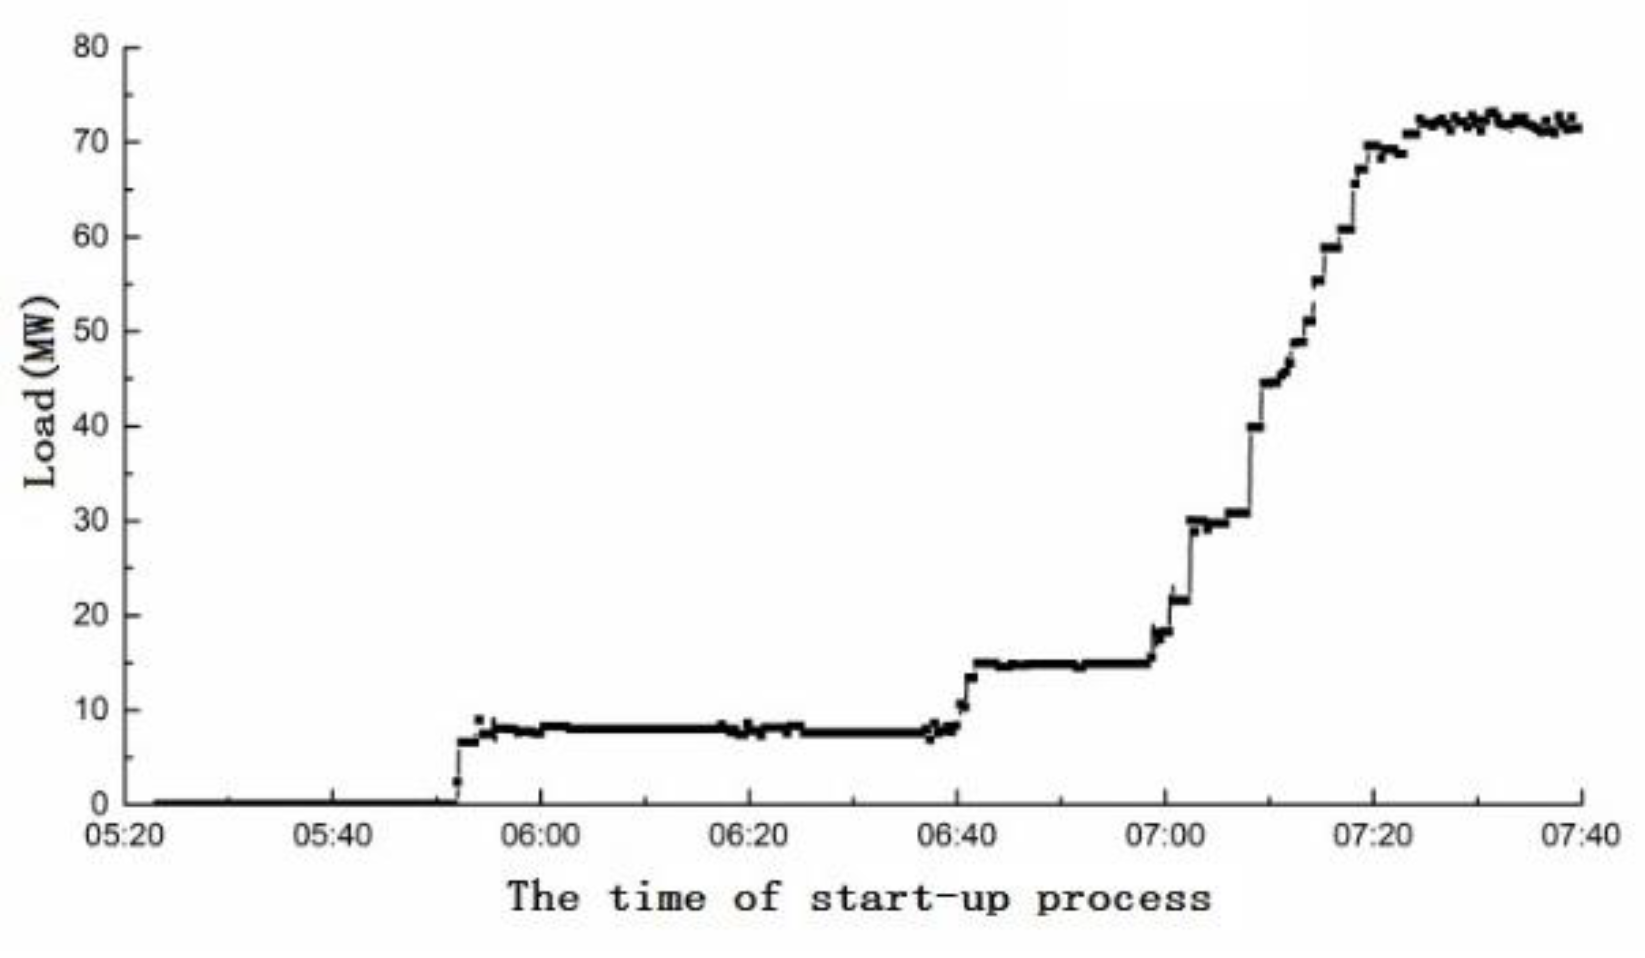
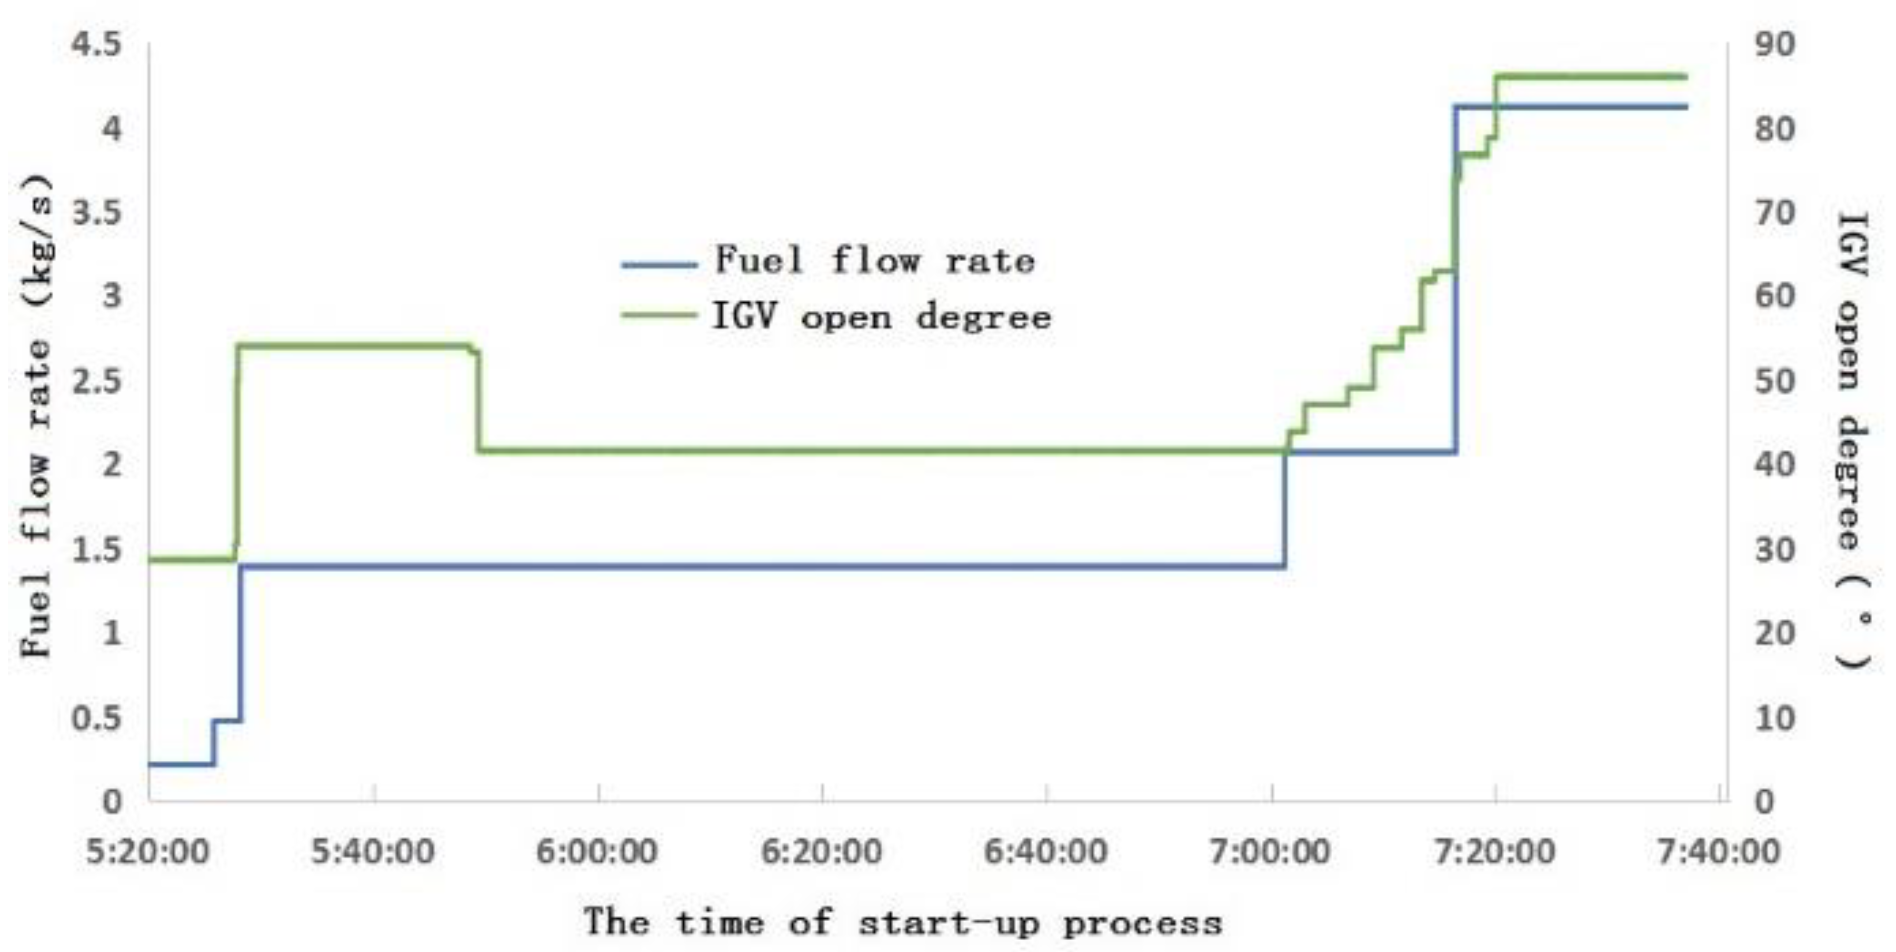
The time from the unit being connected to the grid successfully to full load should be reduced, and the rate of load rise needs to increase. For the 6F unit, the running time of PM1 + PM2 premixed mode should be reduced to shorten the yellow plume time.
(2)
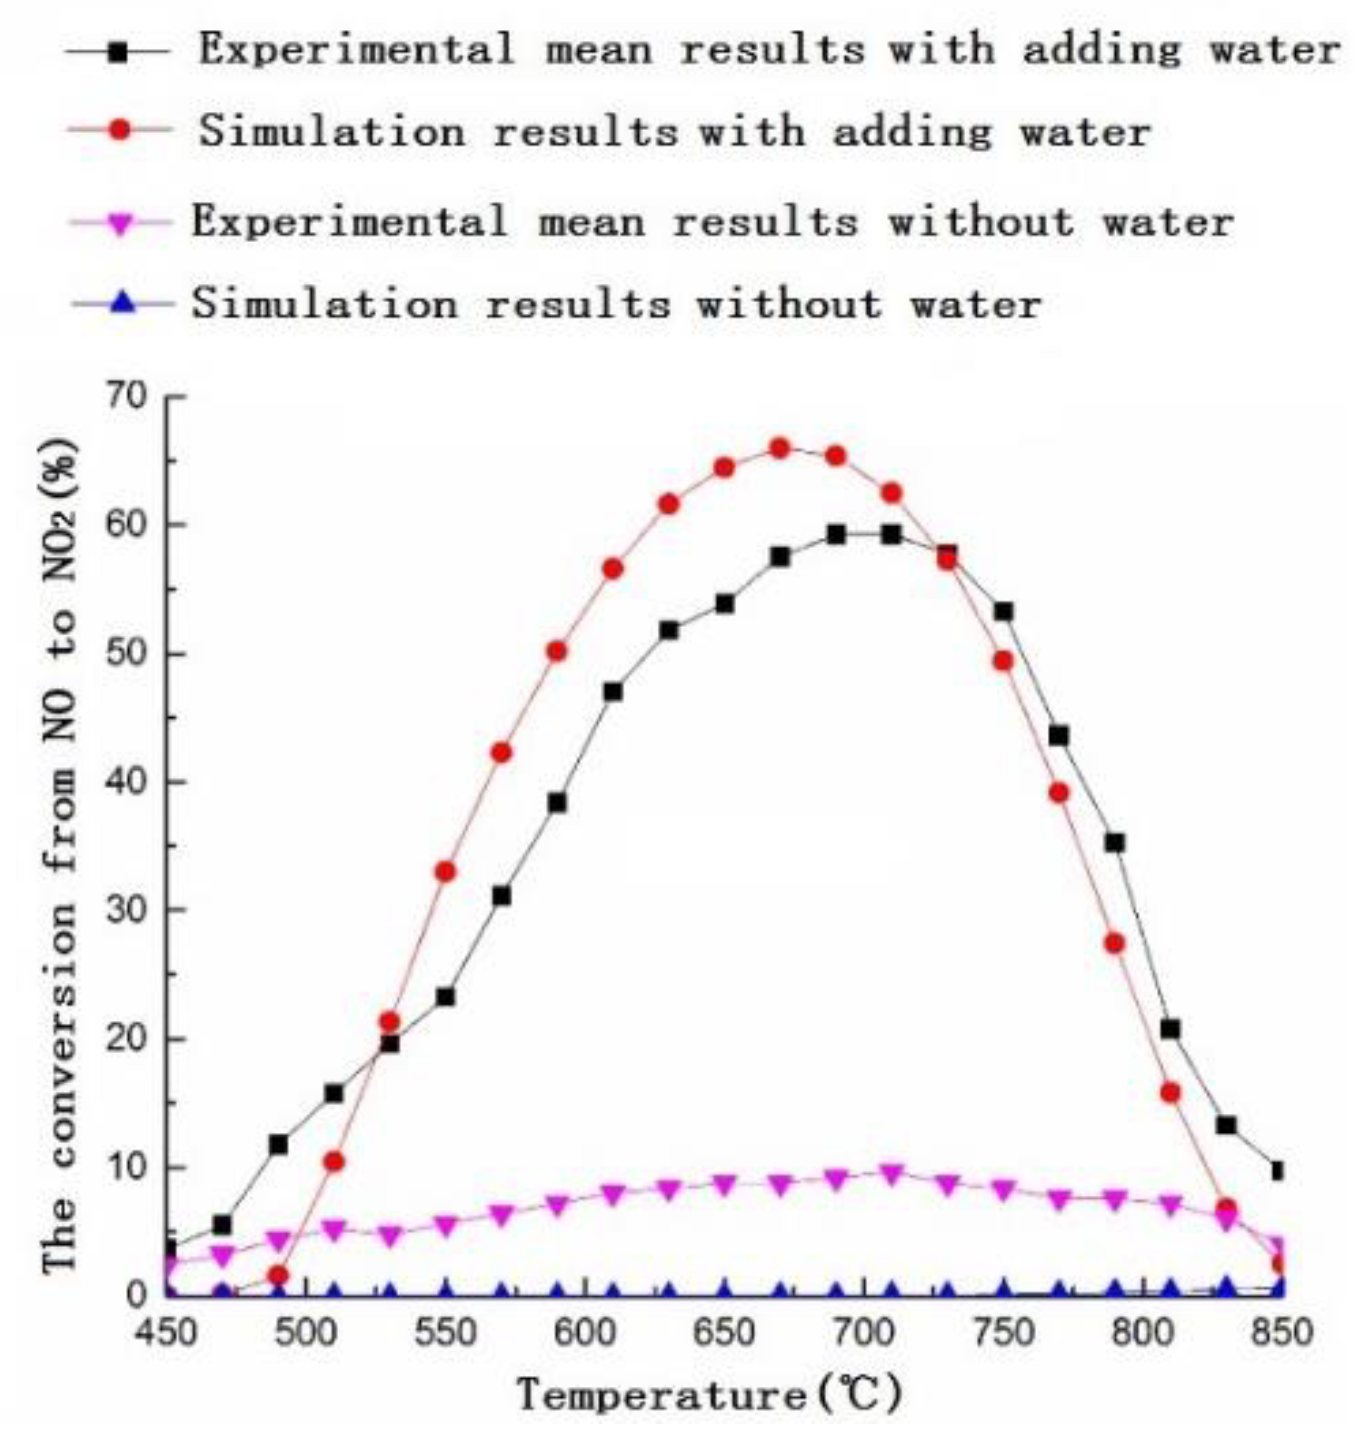
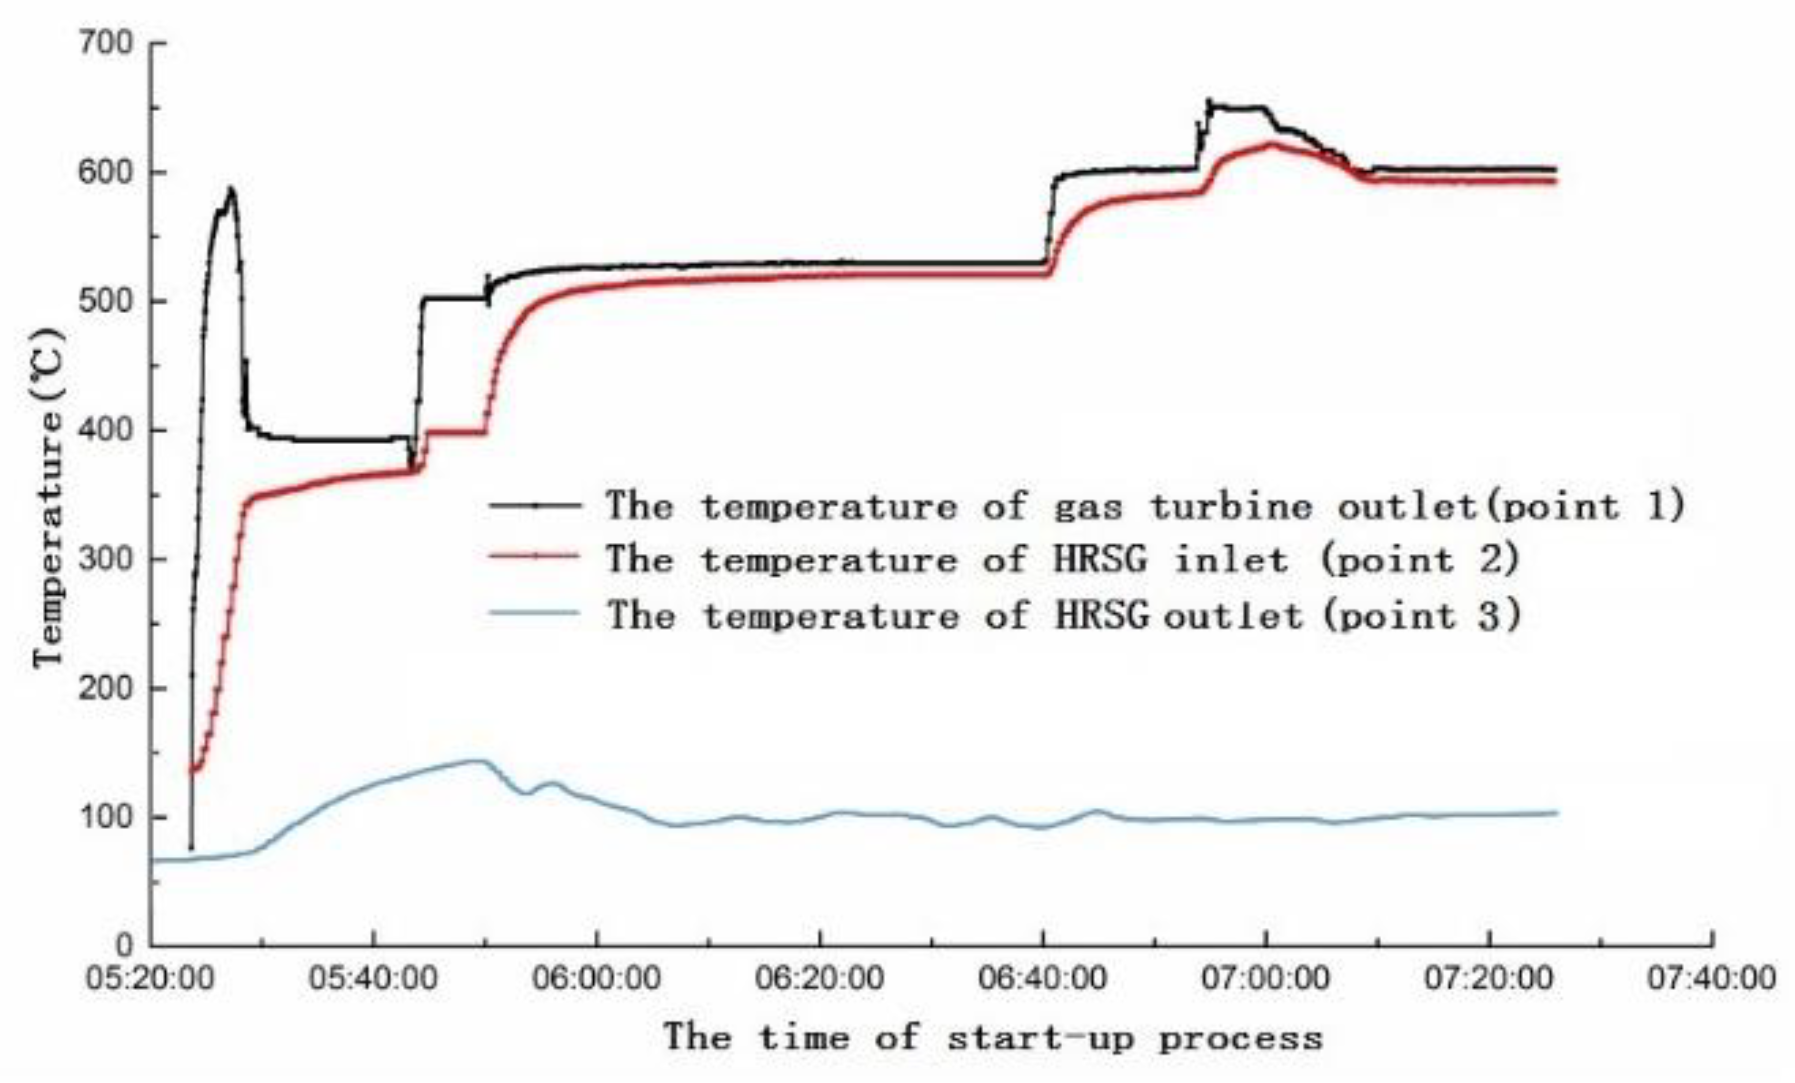
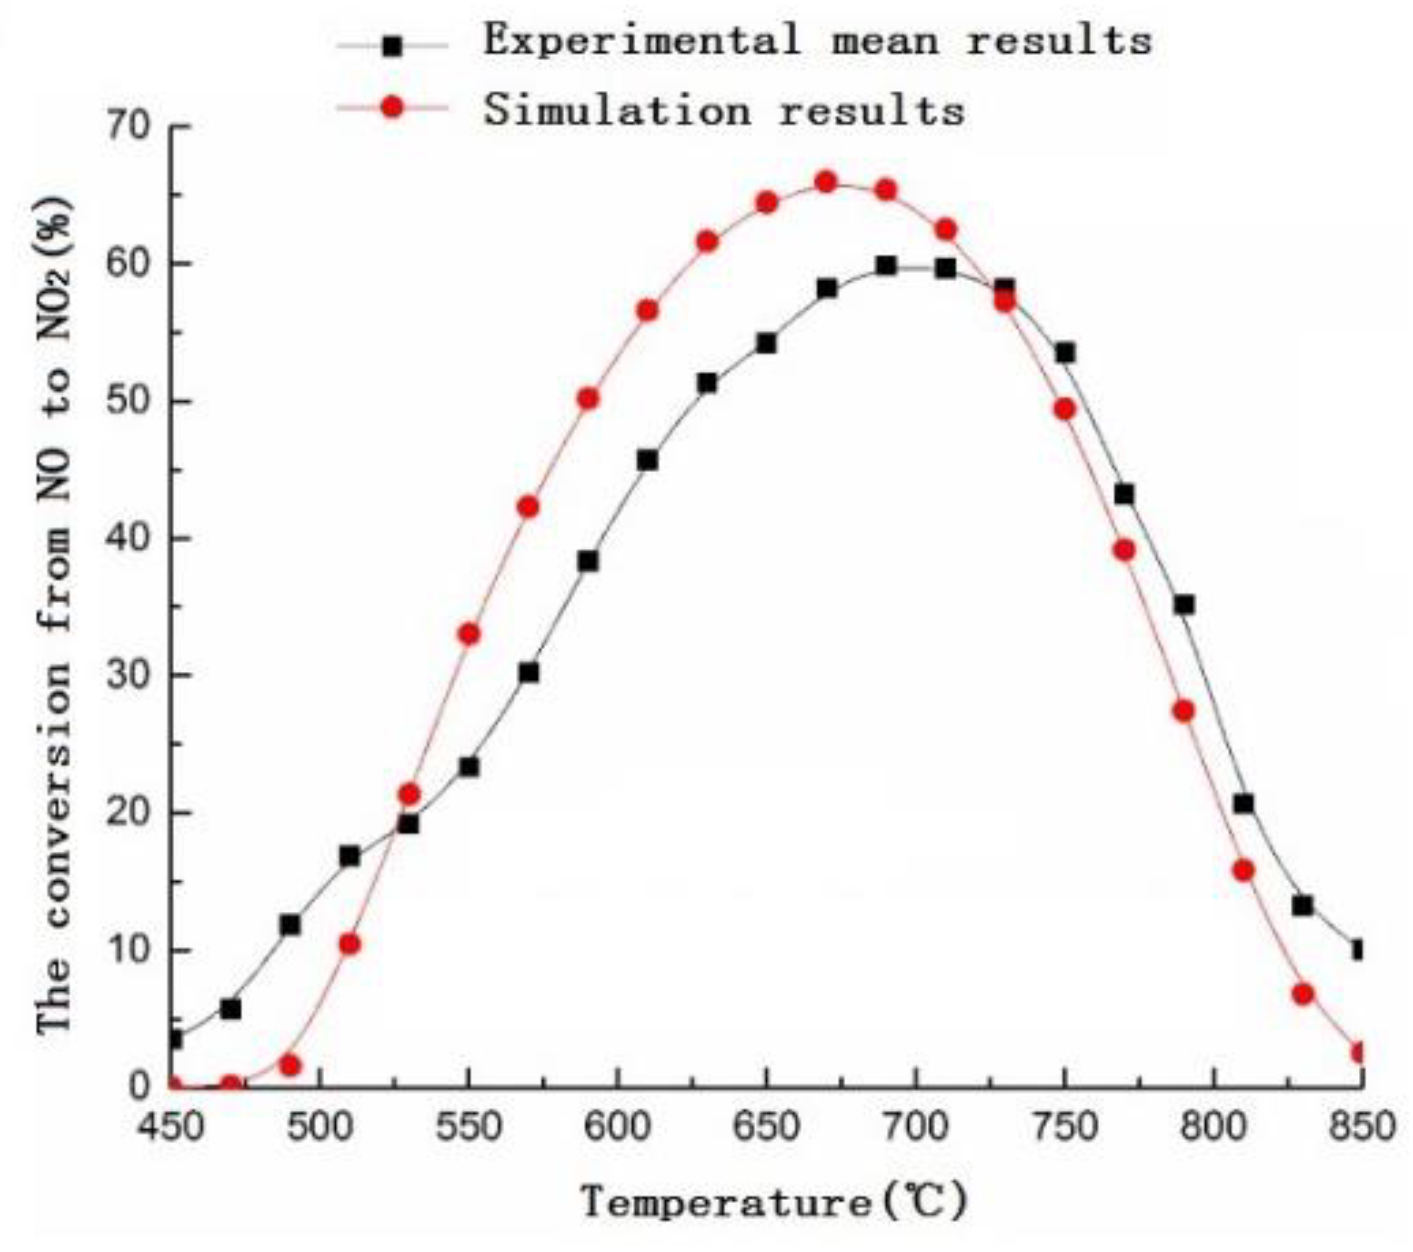
The start-up strategy of the gas turbine should be adjusted. The exhaust temperature of gas turbine during the start-up period should not exceed 500 °C to reduce the NO conversion to NO2 in the HRSG, which can alleviate the phenomenon of yellow plume.
(3)
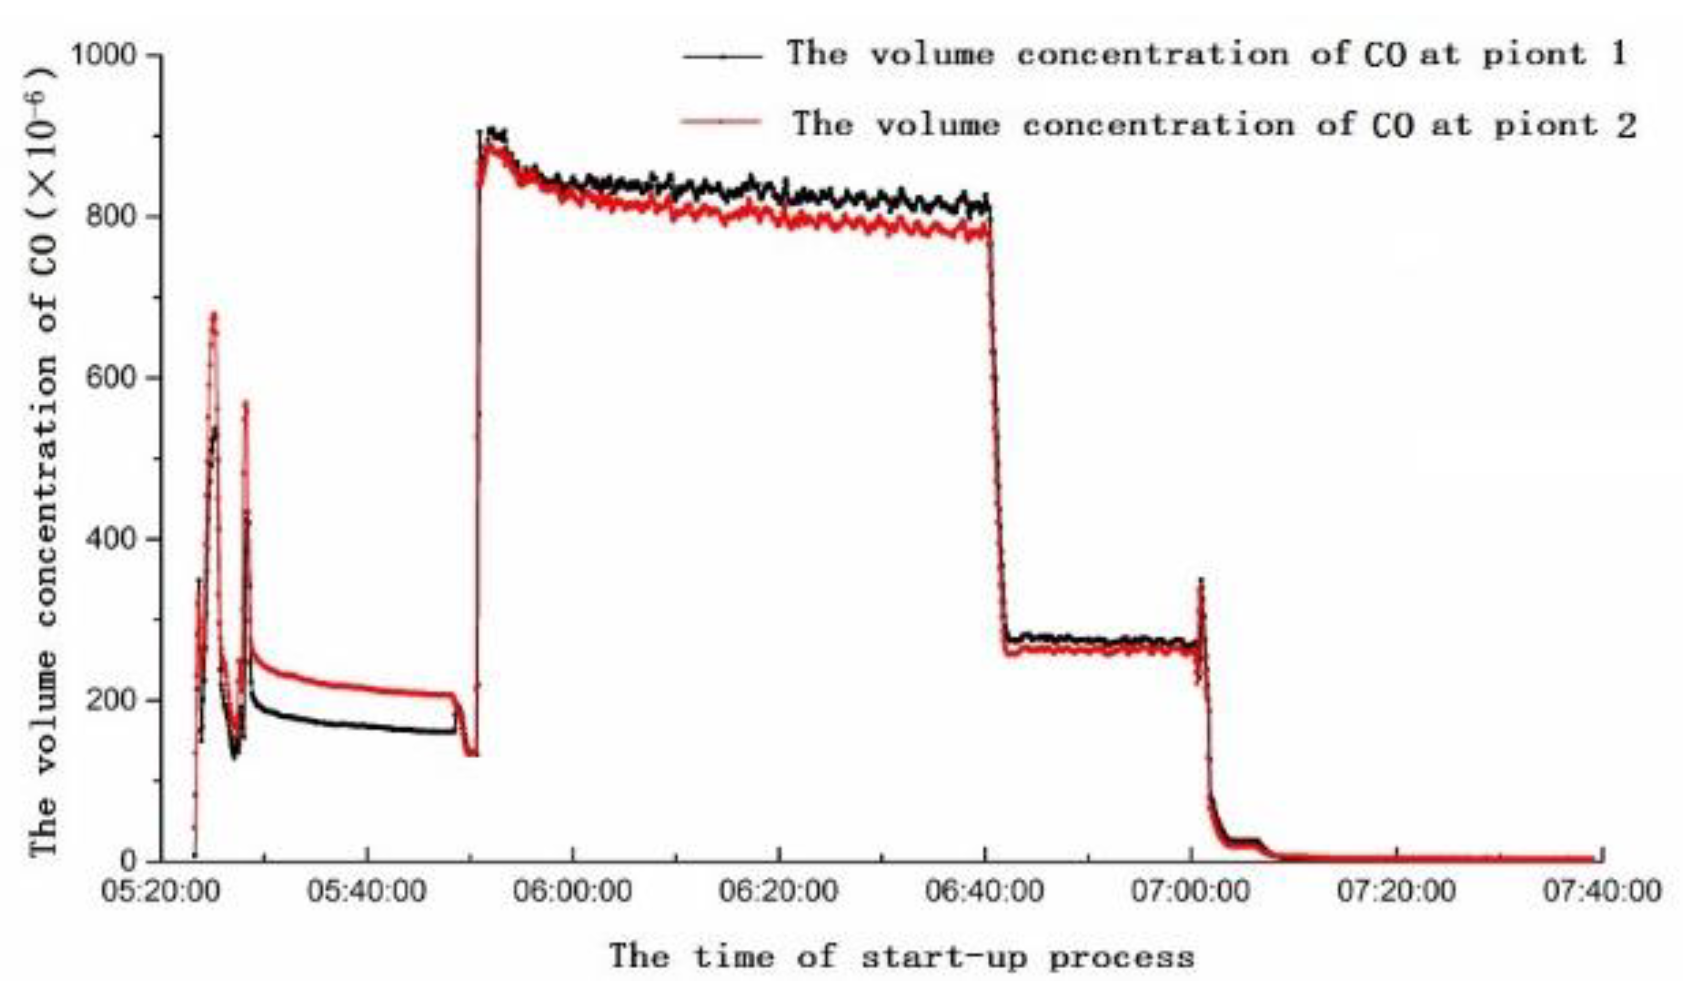
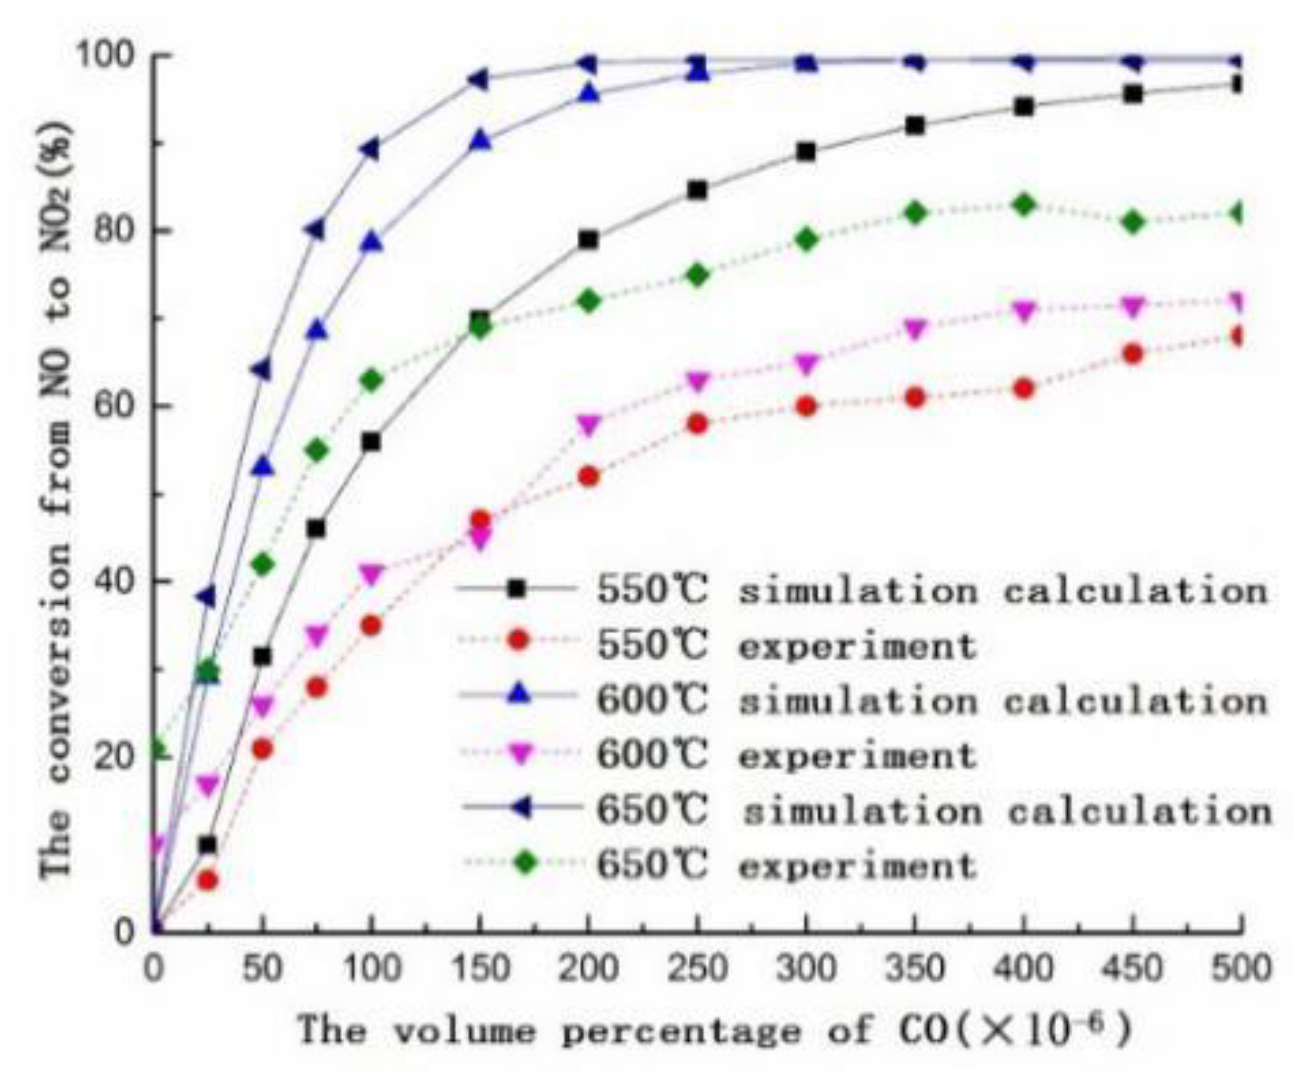
The combustion efficiency during the start-up period should be increased, then the content of CO is reduced, thus the yellow plume could be alleviated. For example, upgrading the combustion system of the gas turbine could make CO in the combustion chamber stay a sufficient time to complete combustion, thus the content of CO is reduced.

5.2. Discussion on Control Measures from the HRSG Side

As shown in Figure 15, the exhaust temperature of gas turbine and the inlet temperature of the HRSG can reach about 600 °C. This temperature range makes NO transform rapidly to NO2, which makes the NO2 content at Test Point 2 obviously higher than at Test Point 1. At the same time, due to the existence of CO, O2, H2O and other appropriate factors, the conversion conditions of NO to NO2 are better in the HRSG.
Based on the above research and analysis, several measures to suppress yellow plume from the HRSG side are proposed as follows:
(1)
CO catalytic oxidation device [20] should be installed in the diffusion section, which connects the gas turbine with the HRSG, which can reduce the content of CO and NO2. Simultaneously, the flue gas temperature should rise to improve the efficiency of the HRSG.
(2)
Catalytic reduction method [21] should be adopted in the flue. The NO2 would be reduced to NO, thus yellow plume would be eliminated.
(3)
The flue gas should be sprayed and NO2 absorbed in the flue or chimney of the HRSG [22], thus the sewage would be neutralized by alkaline substances, or the alkaline solution could be directly sprayed inside the chimney.

6. Conclusions

Based on the analysis of yellow plume emission during the gas turbine start-up period, the key factors of yellow plume generation were analyzed by means of simulation analysis and mechanism experiment. It is summarized that temperature and CO concentration are the two factors that have the greatest impact on yellow plume, while water vapor and oxygen are also essential conditions.
Combined with 6F gas turbine unit on-site test results, it is summarized that the production of NO2 is mainly from the gas turbine side, and the conversion of NO to NO2 in the HRSG is mainly from the expansion section, which connects the gas turbine with the HRSG. Based on the above research, the paper proposes several measures to suppress yellow plume from the gas turbine side and the HRSG side.

Author Contributions

Conceptualization, Z.L. and K.W.; methodology Y.L.; software, C.S.; validation, Y.L., W.S. and B.W.; formal analysis, C.S.; investigation, Y.L.; resources, Z.L.; data curation, W.S.; writing—original draft preparation, Y.L..; writing—review and editing, Z.L.; visualization, K.W.; supervision, B.W.; project administration, K.W.; funding acquisition, Z.L.

Funding

The financial support of this project was provided by Jiangsu province “six talents summit” high-level talent selection and training funding scheme in China under grant number JNHB-080.

Conflicts of Interest

The authors declare no conflict of interest.

References

  1. Liu, Z.; Li, Y.; Wang, K. The Environmental Protection Status Quo of China’s gas Power Plants and the Trending in Policies. Electr. Power 2018, 51, 147–153. [Google Scholar]
  2. Liu, Z.; Wang, K.; Li, Y. Study on denitration scheme of gas power plant based on environmental protection standard. Electr. Power Technol. Environ. Prot. 2017, 33, 18–21. [Google Scholar]
  3. Tuttle, J.H.; Shisler, R.A.; Mellor, A.M. Nitrogen Dioxide Formation in gas Turbine Engines: Measurements and Measurement Methods. Combust. Sci. Technol. 1974, 9, 261–271. [Google Scholar] [CrossRef]
  4. Laurendeau, N.M. Fast Nitrogen Dioxide Reactions: Significance during NO Decomposition and NO2 Formation. Combust. Sci. Technol. 1975, 11, 89–96. [Google Scholar] [CrossRef]
  5. Chen, R.H. NOx and NO2 Emission of Swirl-Stabilized Nonpremixed Flames of a H2/CH4 Mixture. Combust. Sci. Technol. 2012, 120, 321–333. [Google Scholar] [CrossRef]
  6. Schäfer, K.; Brockmann, K.; Heland, J.; Wiesen, P.; Jahn, C.; Legras, O. Multipass open-path Fourier-transform infrared measurements for nonintrusive monitoring of gas turbine exhaust composition. Appl. Opt. 2005, 44, 2189. [Google Scholar] [CrossRef] [PubMed]
  7. Feitelberg, A.S.; Correa, S.M. The Role of Carbon Monoxide in NO2 Plume Formation. In ASME 1999 International Gas Turbine and Aeroengine Congress and Exhibition; American Society of Mechanical Engineers: New York, NY, USA, 2000; p. V002T02A005. [Google Scholar]
  8. Sorrentino, G.; Sabia, P.; Bozza, P.; Ragucci, R.; de Joannon, M. Impact of external operating parameters on the performance of a cyclonic burner with high level of internal recirculation under MILD combustion conditions. Energy 2017, 137, 1167–1174. [Google Scholar] [CrossRef]
  9. Galbiati, M.A.; Cavigiolo, A.; Effuggi, A.; Gelosa, D.; Rota, R. Mild combustion for fuel-NOx reduction. Combust. Sci. Technol. 2004, 176, 1035–1054. [Google Scholar] [CrossRef]
  10. Xu, H.; Hu, D.; Zhou, X.; Liu, H. Study on NOx emission from gas turbine and denitrification technology. Energy Environ. 2017, 5, 29–31. [Google Scholar]
  11. Wang, W.; Hua, W.; Sun, H. The causes and solutions of gas turbine chimney emission yellow smoke. Electr. Power Technol. Environ. Prot. 2016, 32, 33–35. [Google Scholar]
  12. Institute of Power Machinery and Engineering, Department of Thermal Engineering, Tsinghua University. Gas Turbine and Gas-Steam Combined Cycle Device; China Electric Power Press: Beijing, China, 2007. [Google Scholar]
  13. Zhu, B. Chemical Reaction Engineering; Chemical Industry Press: Beijing, China, 2012. [Google Scholar]
  14. Wei, Y.; Zhang, D.; Ran, B.; Mao, Y. SCR Process Simulation and Test Study Based on Catalytic Reaction Kinetics. Dongfang Electr. Rev. 2015, 29, 14–19. [Google Scholar]
  15. Yao, Q.; Li, S.; Wang, Y. Introduction to Combustion: Concept and Application; Tsinghua University Press: Beijing, China, 2008. [Google Scholar]
  16. Turns, S.R. An Introduction to Combustion Conceps and Applications; The McGraw-Hill Companies, Inc.: New York, NY, USA, 2000. [Google Scholar]
  17. Glassman, I. Combustion; Academic Press: Orlando, FL, USA, 2008. [Google Scholar]
  18. Cai, G. Application of fully premixed DLN2.6+ combustor in China. Power Energy 2017, 38, 315–319. [Google Scholar]
  19. Lou, H.; Chen, X.; Mao, Z. Brief Analysis of DLN-2.6 Combustion System of GE gas Turbine. Zhejiang Electr. Power 2011, 30, 70–73. [Google Scholar]
  20. McDeed, D.; Pyros, G.; Bravato, A. Operating A Gas Turbine Power Plant at Low Load Conditions. U.S. Patent 2015/011563, 23 July 2015. [Google Scholar]
  21. Yang, J.H.; Yang, J.; Chun, D.H.; Kim, H.; Lee, H.; Jung, H. Catalytic process for decolorizing yellow plume. Korean J. Chem. Eng. 2011, 28, 418–423. [Google Scholar] [CrossRef]
  22. Zhou, Y.; Wang, Z.; Cheng, S.; Li, P.; Xue, Z.; Shao, J. A Device for Eliminating Yellow Smoke from Chimneys in the Early Stages of Gas Turbine Startup. Patent CN107261842A, 20 October 2017. [Google Scholar]
Figure 1. The yellow plume during the start-up period.
Applsci 09 00251 g001
Figure 2. The plug–flow model.
Applsci 09 00251 g002
Figure 3. The chain reaction mechanism.
Applsci 09 00251 g003
Figure 4. Test system: A, N2 gas tank; B, O2 gas tank; C, CO gas tank; D, NO gas tank; E, flow controller; F, peristaltic pump; G, heating cable; H, resistance furnace; I, smoke analysis instrument.
Applsci 09 00251 g004
Figure 5. Effect of temperature on the conversion.
Applsci 09 00251 g005
Figure 6. Effect of temperature and CO on the conversion.
Applsci 09 00251 g006
Figure 7. Effect of CO concentration on the conversion.
Applsci 09 00251 g007
Figure 8. Effect of O2 concentration on the conversion.
Applsci 09 00251 g008
Figure 9. Effect of NO concentration on the conversion.
Applsci 09 00251 g009
Figure 10. Effect of water vapor on the conversion.
Applsci 09 00251 g010
Figure 11. Nozzles arrangement of DLN-2.6 burners.
Applsci 09 00251 g011
Figure 12. Arrangement of measuring points in the HRSG.
Applsci 09 00251 g012
Figure 13. The load change during the start-up period.
Applsci 09 00251 g013
Figure 14. NO2 measurements at Point 1 and Point 2.
Applsci 09 00251 g014
Figure 15. The flue gas temperature of turbine outlet and HRSG inlet.
Applsci 09 00251 g015
Figure 16. Oxygen concentration at Point 1 and Point 2.
Applsci 09 00251 g016
Figure 17. CO concentration at Point 1 and Point 2.
Applsci 09 00251 g017
Figure 18. NO concentration at Point 1 and Point 2.
Applsci 09 00251 g018
Figure 19. NO concentration at Point 3.
Applsci 09 00251 g019
Figure 20. Open degree of burner nozzles during the start-up period.
Applsci 09 00251 g020
Figure 21. Open degree of inlet guide vanes (IGV) and fuel flow rate during the start-up period.
Applsci 09 00251 g021

