Article

Table Recognition for Sensitive Data Perception in an IoT Vision Environment

1
College of Cyber Science, Nankai University, Tianjin 300350, China
2
College of Computer Science, Nankai University, Tianjin 300350, China
*
Author to whom correspondence should be addressed.
Appl. Sci. 2019, 9(19), 4162; https://doi.org/10.3390/app9194162
Submission received: 18 June 2019 / Revised: 4 September 2019 / Accepted: 16 September 2019 / Published: 4 October 2019

Abstract

:
Internet of Things (IoT) technology allows us to measure, compute, and decide about the physical world around us in a quantitative and intelligent way. It makes all kinds of intelligent IoT devices popular. We are continually perceived and recorded by intelligent IoT devices, especially vision devices such as cameras and mobile phones. However, a series of security issues have arisen in recent years. Sensitive data leakage is the most typical and harmful one. Whether we are just browsing files unintentionally in sight of high-definition (HD) security cameras, or internal ghosts are using mobile phones to photograph secret files, it causes sensitive data to be captured by intelligent IoT vision devices, resulting in irreparable damage. Although the risk of sensitive data diffusion can be reduced by optical character recognition (OCR)-based packet filtering, it is difficult to use it with sensitive data presented in table form. This is because table images captured by the intelligent IoT vision device face issues of perspective transformation, and interferences of circular stamps and irregular handwritten signatures. Therefore, a table-recognition algorithm based on a directional connected chain is proposed in this paper to solve the problem of identifying sensitive table data captured by intelligent IoT vision devices. First, a Directional Connected Chain (DCC) search algorithm is proposed for line detection. Then, valid line mergence and invalid line removal is performed for the searched DCCs to detect the table frame, to filter the irregular interferences. Finally, an inverse perspective transformation algorithm is used to restore the table after perspective transformation. Experiments show that our proposed algorithm can achieve accuracy of at least 92%, and filter stamp interference completely.

1. Introduction

The Internet of Things (IoT) is a huge network consisting of various information-sensing devices on the Internet to connect people, machines, and objects at any time and any place [1]. The development of IoT technology allows us to perceive and understand the states and laws of the world, to measure, compute, and decide on various issues around us in a quantitative and intelligent way. It makes a twinned digital space corresponding to the physical world, which makes people’s lives more convenient and intelligent.
The deployment and application of IoT devices is the cornerstone of the IoT [1,2]. Today, the number of intelligent IoT devices has exceeded 4 billion [3]. These IoT devices are generally embedded in sensors, and scattered throughout the physical world, to be used to sense the external environment and collect data. We are continually perceived and recorded by intelligent IoT devices, especially vision devices such as cameras and mobile phones.
However, while these intelligent IoT devices have made our lives more intelligent and convenient, a series of data security issues have arisen [4,5,6,7]. Sensitive data leakage is the most typical and harmful one. Whether we are just browsing files unintentionally in sight of HD security cameras, or internal ghosts are using mobile phones to photograph secret files, it causes sensitive data to be captured by intelligent IoT vision devices, resulting in irreparable damage. At present, there are some ways to prevent sensitive data from leaking by using intelligent IoT vision devices. For example, optical character recognition (OCR)-based packet filtering reduces the risk of sensitive data spreading through the IoT. However, such methods do not work well for sensitive data presented in table form [8,9]. For plaintext documents, the contents of words or sentences in a captured image are indeed of users’ interest. However, in a table document, for a more accurate and sensitive data perception, we should extract the table structure, and obtain the data in every table cell, because each table cell represents a different meaning. In particular regarding financial data, a set of numbers recognized by OCR is meaningless and useless: only after the table structure is recognized can we know what the numbers represent. However, table images captured by the intelligent IoT vision devices face the issue of perspective transformation, which causes table-frame lines to be tilted, and the original parallel relationships and vertical relationships of the table frame lines to be broken, as shown in Figure 1. In addition, there are circle stamps and irregular handwritten signatures that may also exist in the table. These have a bad effect on the results of OCR.
Therefore, a table-recognition algorithm based on the ruling-line feature is proposed in this paper to solve the problem of identifying sensitive table data captured by intelligent IoT vision devices. A table frame is made up of some vertical and horizontal ruling lines. The table frame can be detected while the ruling lines are detected. In this paper, a novel image structure element named “Directional Connected Chain (DCC)” is used to detect diagonal lines (See in Section 3.1). Then, the algorithm (see Section 3) based on DCC is proposed for recognition of the table by intelligent IoT vision device images.
Table recognition lacks an evaluation metric at present. Most research incorporates accuracy and recall, which regard all table cells and error types as the same, as evaluation metrics, but this is unreasonable. An evaluation metric that takes table-cell importance degree and error types into consideration is put forward in this paper.
A dataset [10] labeled with table-cell importance degree is also proposed, and classified into nine categories according to perspective transformation angles.
To evaluate our algorithm, a prototype system is implemented. Experiments are conducted based on the benchmark and dataset proposed. Experiments show that our proposed algorithm can achieve accuracy of at least 92%, higher than the existing method by 10%, and filter stamp interference completely.
The rest of the paper is arranged as follows. Section 2 describes the ideas and limitations of past works. Section 3 shows the details of our proposed work. Section 4 presents the experimental results and discussions. Finally, the concluding remarks are given in Section 5.

2. Related Works

2.1. Table-Recognition Methods

An important and primary step in table recognition is table detection. At present, most research on table recognition is aimed at scanned documents. Table features, such as text blocks [11,12], word spacing [13,14], column spacing [15], junctions [16], and ruling lines [17] are used to detect tables in scanned document images. All the above methods assume that the text lines and table boundaries are parallel, but they are not parallel in intelligent IoT vision device-captured images due to perspective transformation [18,19].
There is a small amount of research on table recognition in intelligent IoT vision device-captured images, all of which is based on the junction detection method [20,21,22]. These methods match the corners of table cells to labels which include connectivity information between junctions. However, junction miss and junction error are common in these methods and the performance is unsatisfactory.
The ruling-line feature is considered in order to achieve table recognition in intelligent IoT vision device-captured images in our method. Zheng et al. [23] presented a structure named directional single connected chain (DSCC), which can be used to search diagonal lines in scanned documents. Because ruling lines in intelligent IoT vision device-captured tables, which are subject to perspective transformation, are diagonal, DSCC can be referenced to recognize intelligent IoT vision device-captured tables. However, the DSCC search algorithm that Zheng et al. [23] proposed will make too many broken lines, which affects the performance of table-frame detection. Therefore, a new chain-search algorithm, which has more resistance to line breakage, is proposed. The chain searched by our algorithm is named the directional connected chain (DCC), because it is not singly connected, while DSCC is singly connected. Then, the table-recognition method is proposed based on DCC.

2.2. Table-Recognition Evaluation Metric

There are various types of tables, and the table-recognition evaluation metric should be different, as the focus is different. Li et al. [24] analyzed error types that occurred during table recognition, and proposed the overlapping areas between the detected table area and reference table area as an evaluation metric. Wang et al. [25] proposed the ratio of intersection between detected table area and reference table area to the ratio of these two tables, respectively. Kasar et al. [26] proposed area precision and area recall. However, these metrics, based on area, do not reflect the error type effect on the recognition result. Silva [27] proposed Completeness (C) and Purity (P), using C to represent miss error and split error of table cell, and P to represent merge error and false error. Although Silva considered error types, he did not notice the difference of the severe degree in these errors. Hu et al. [28] proposed a random graph probing to compare the results returned by the recognition system and the ground truth. However, all the above studies do not take the important element of table cells into consideration.

3. Recognition Method Design

The table-recognition process we propose is divided into five steps based on DCC. As Figure 2 shows, it preprocesses the image, searches DCCs in an intelligent IoT vision device-captured image, detects the table frame by five techniques based on DCC, restores the table by inverse perspective transformation to get a table where the ruling lines are parallel, and extracts the table cells and contents for sensitive data analysis.
Since the techniques of image preprocessing are quite mature, the discussion of them will be very brief here. The intelligent IoT vision device-captured image usually suffers from uneven lighting and light noise, which will have a negative effect on table recognition. Therefore, to reduce these interferences, the intelligent IoT vision device-captured image is processed as a binary image by Gaussian weighted local threshold binarization and morphological denoising and enhancement for further processing [29,30].
The following table-recognition steps are discussed in detail in the next section. In addition, to make the paper more easily understandable, Table 1 shows the symbols that will be used in next sections.

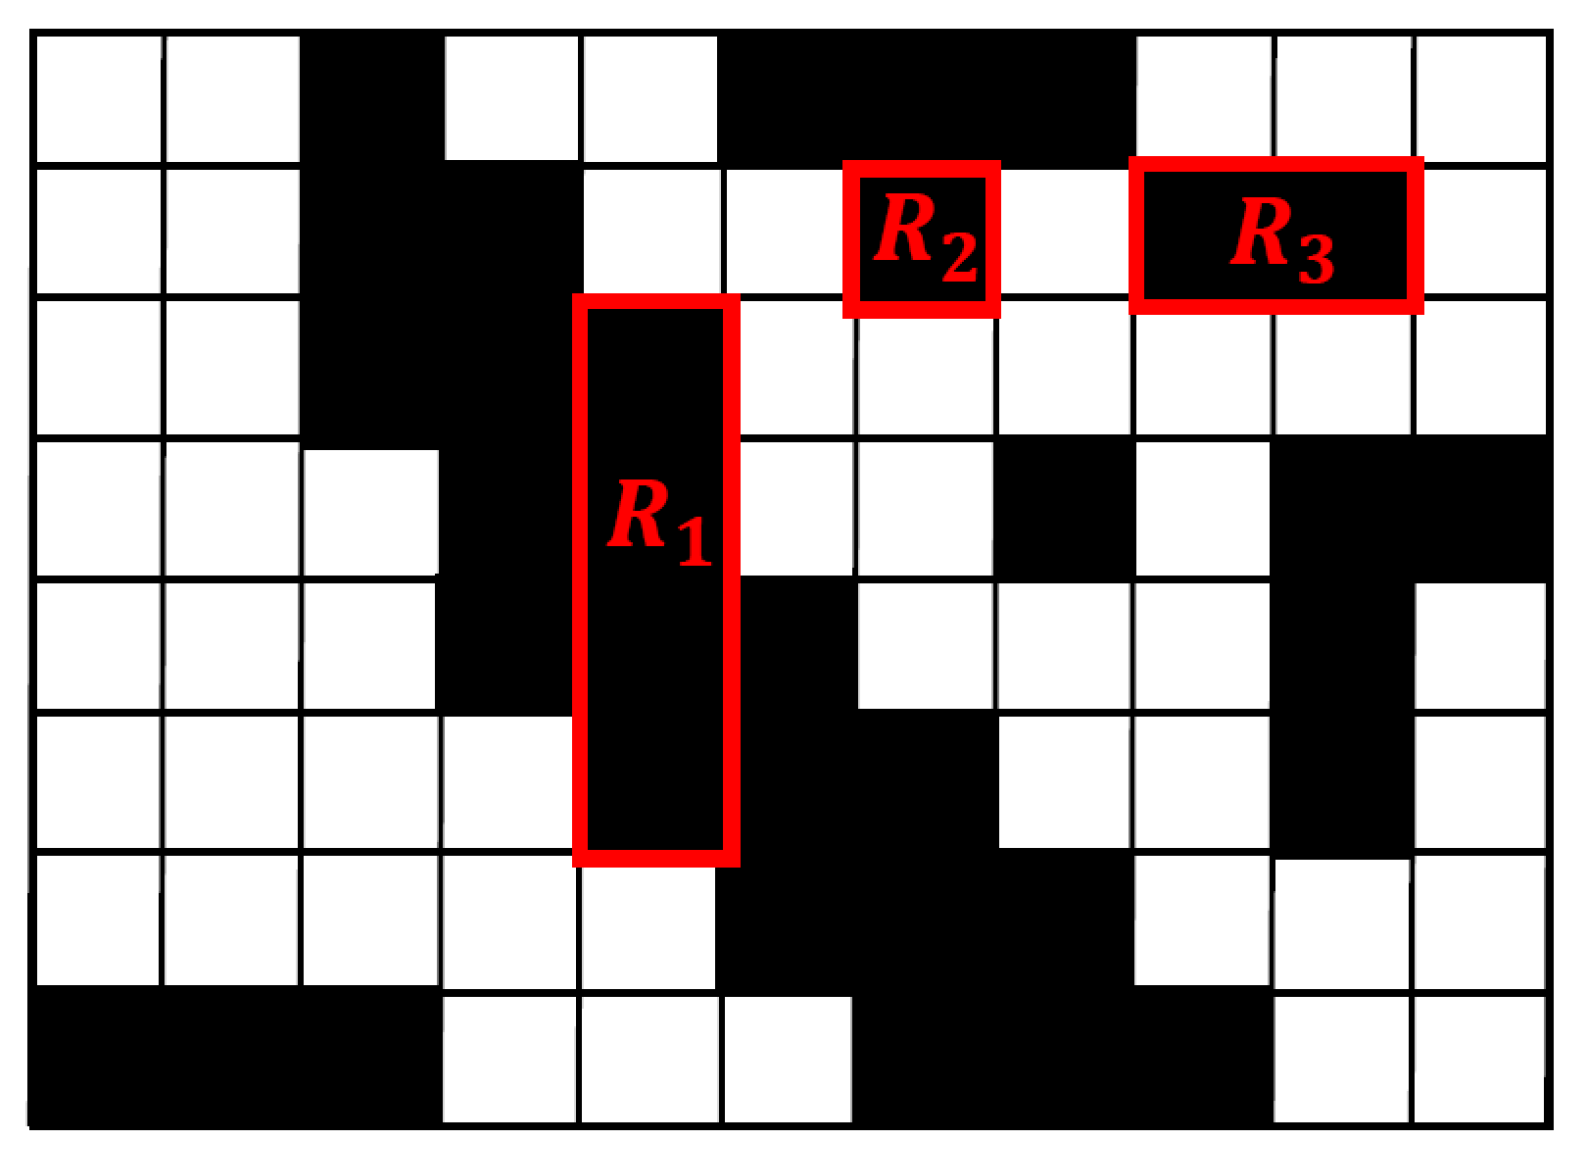
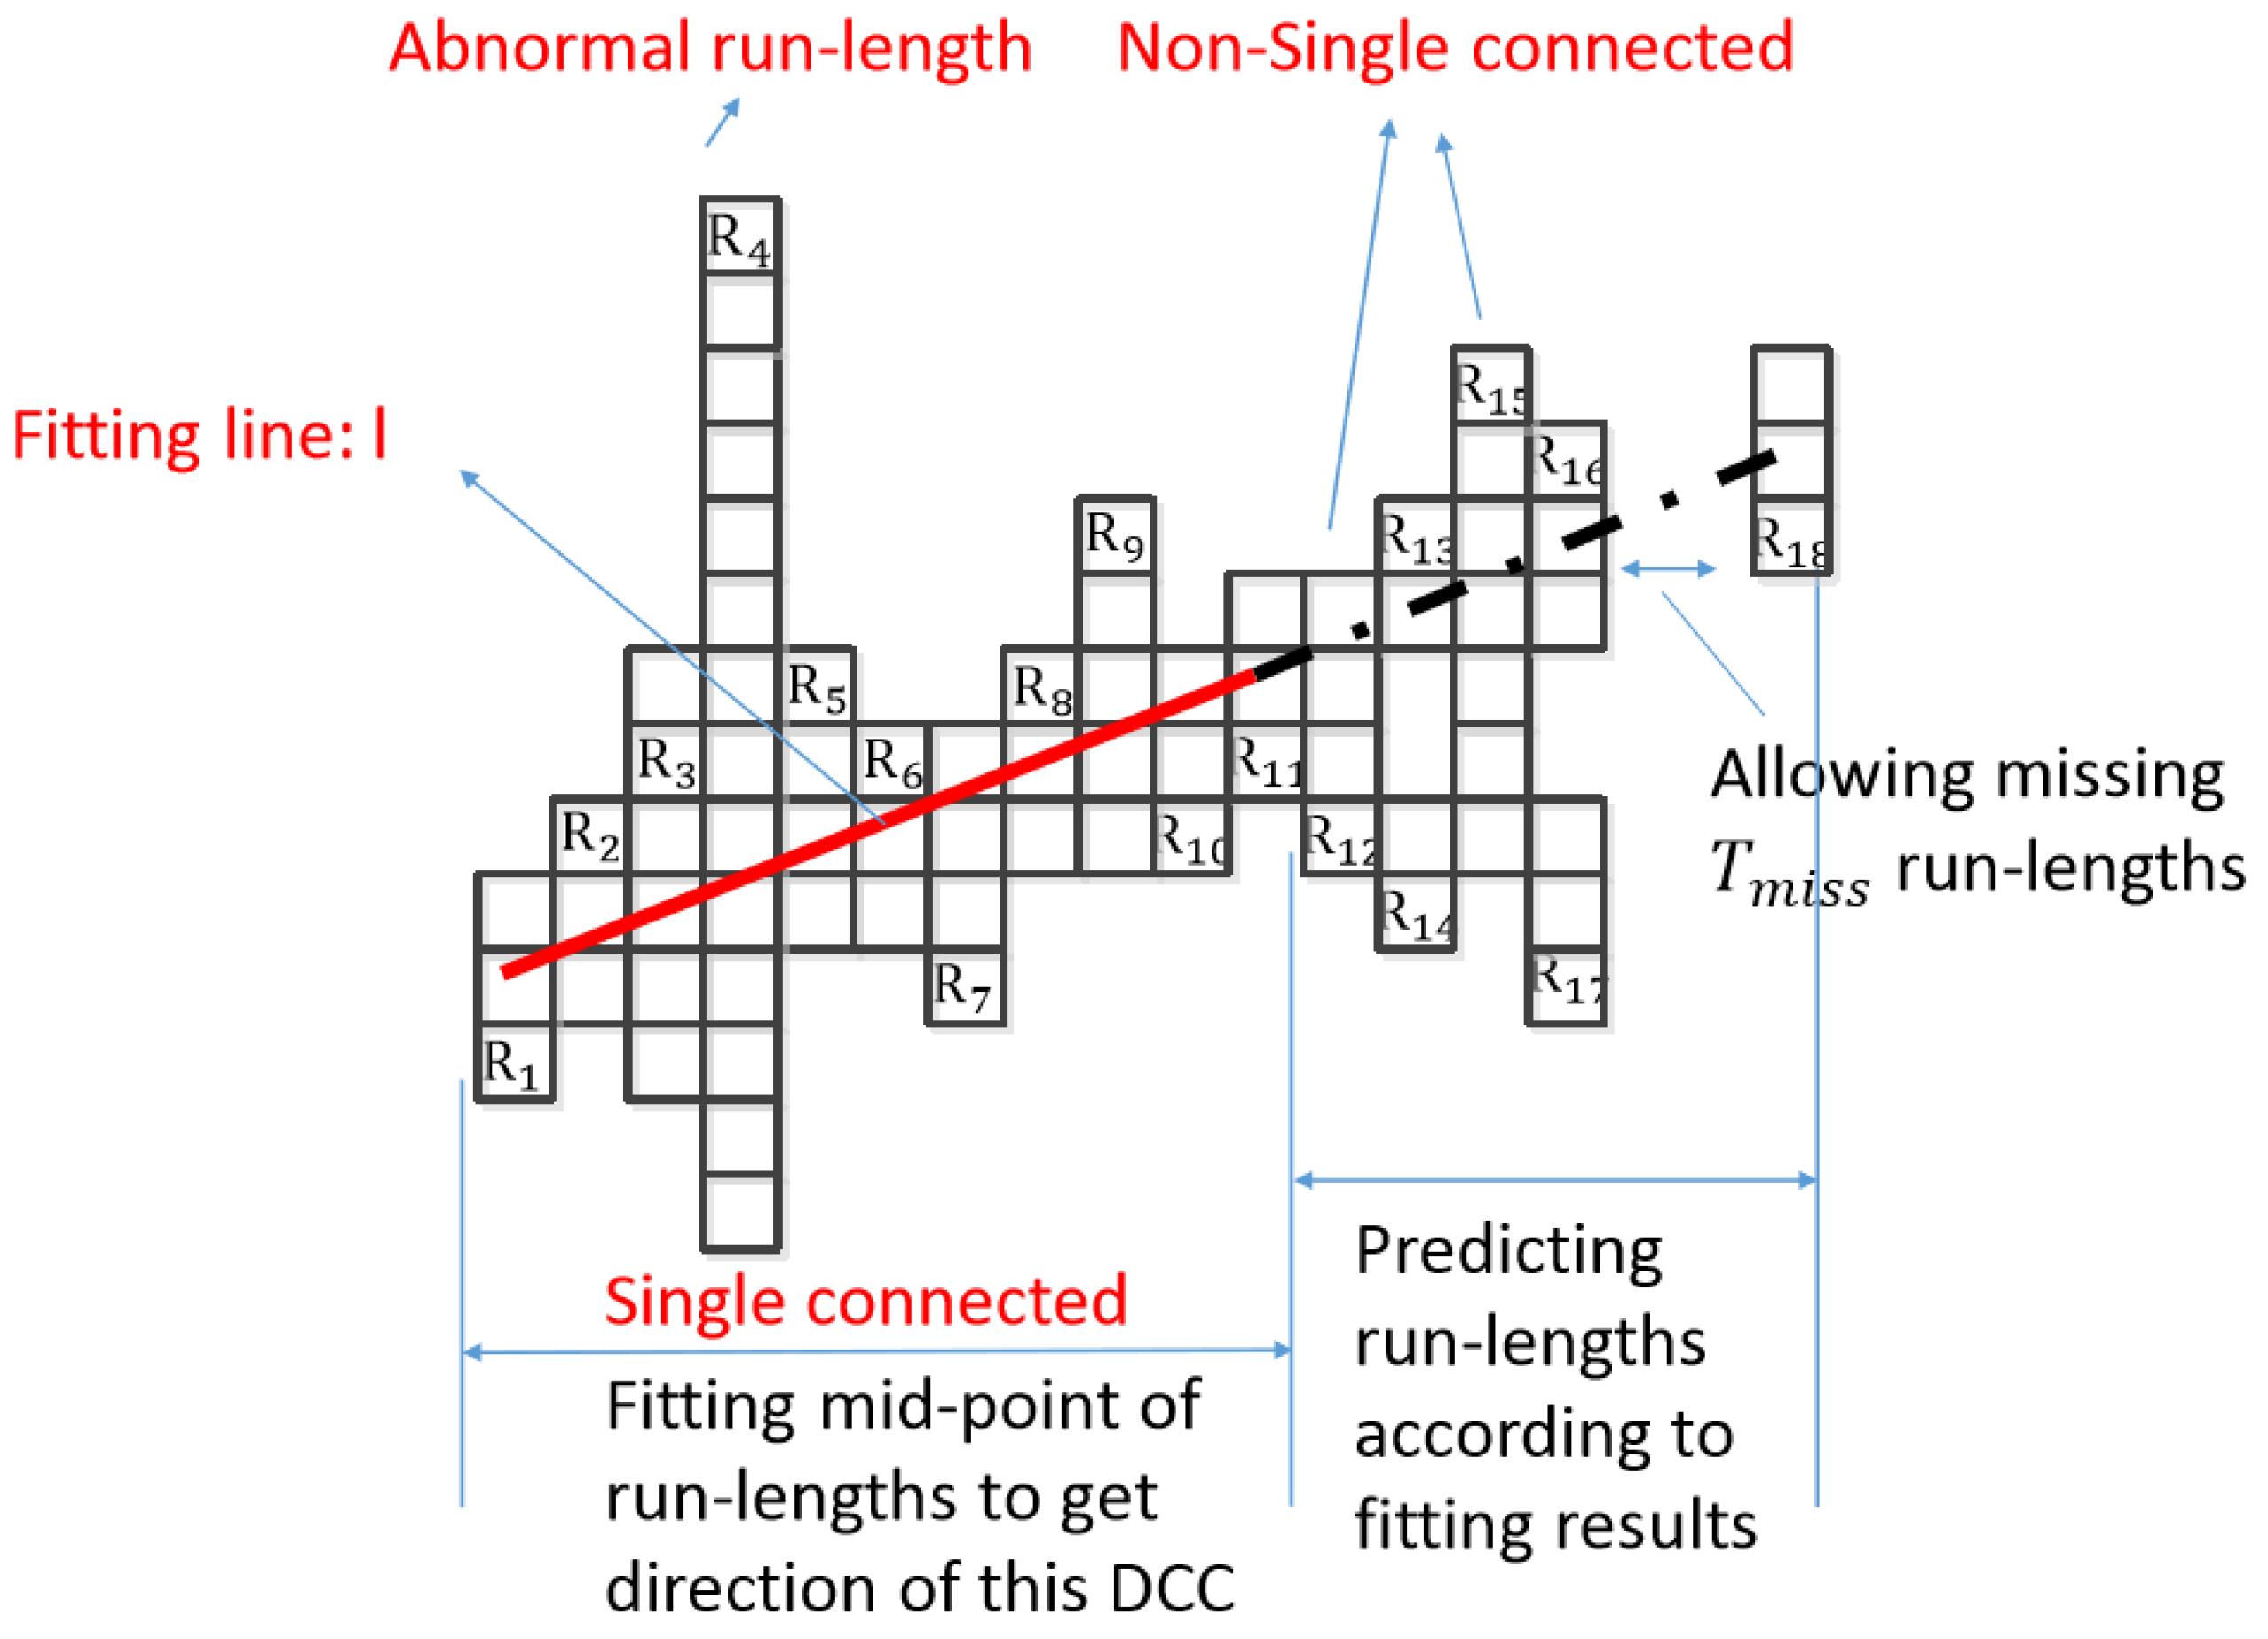
3.1. Directional Connected Chain (DCC)

DCC is a novel image structure element and is made up of run lengths. The definition of a run length and Directional Connected Chain (DCC) are explained in this section. Run length includes horizontal run length and vertical run length. Vertical run length is a black continuous pixel segment in the vertical direction and the segment width is only one pixel. Correspondingly, horizontal run length is a black continuous pixel segment in the horizontal direction and the segment length is only a pixel. Figure 3 is an image consisting of pixels, in which R 1 is a vertical run length, R 3 is a horizontal run length, and R 2 can represent both a horizontal run length and a vertical run length.
DCC is a series of adjacent run lengths. It includes horizontal DCC and vertical DCC. Horizontal DCC is made up of a series of adjacent vertical run lengths, and it is used to detect horizontal lines and diagonal lines whose angles are less than 45 . Correspondingly, vertical DCC is made up of a series of adjacent horizontal run lengths, and it is used to detect vertical lines and diagonal lines whose angles are larger than 45 .
DCC can go in any direction by connecting run lengths. Therefore, DCC can be used to represent a diagonal line. As Figure 4 shows, the vertical run lengths through which the red line passes make up a horizontal DCC.
Perspective transformation makes table ruling lines become diagonal lines of different diagonal angles. In addition, most stamps and signatures are in an irregular shape, which are easy to distinguish from long straight lines in tables. Therefore, DCC is used in this paper to achieve table recognition.
DCC can represent the straight line of a table, so the DCC search is a key step in table recognition. As Figure 4 shows, DCC search can be divided into two steps: determining the direction of a DCC, and predicting the run lengths that should be on the DCC.
The first step is to determine the direction of DCC. DCC is made up of adjacent run lengths, but adjacent run lengths can be either singly connected or non-singly connected. For a run length, if there is only one adjacent run length on each side, such as R 2 , or one side has no run length and one side has only one connected run length, such as R 1 , it is singly connected. Otherwise, it is non-singly connected, such as R 12 . The DCC will create branches and goes to several directions if there is a non-singly connected run length. In addition, the first T n run lengths will determine the direction of a DCC. Therefore, when searching a DCC, the T n adjacent single connected run lengths should be found first. However, if the number of searched adjacent singly connected run length is less than T n , these searched run lengths make up a DCC, and the DCC search ends, which need not go to the next process in the first step and second step. If T n adjacent singly connected run lengths are found, they become a part of a new DCC, and then we get a line l by the least-square method of fitting for mid-points of these T n adjacent singly connected run lengths [31]. The fitting line can be represented as Equation (1).
y = k x + b
where k represents slope, and b represents intercept. As Figure 4 shows, R 1 , R 2 , , R 11 are the single connected run lengths that were searched for in first step, and l is the fitting line.
The second step is to predict the run lengths, which appear after T n in the first step, and determine whether they should be included in the DCC. The fitting line l obtained from the first step is used to predict the y-coordinate of the run length at the next x-coordinate. If there is indeed a run length at the predicted position, then the run length is appended to the DCC. It means we should add the run lengths on the extension of l to the DCC. As Figure 4 shows, the run lengths on the dashed line are appended to the DCC in this prediction step. R 14 and R 17 are removed because they are not on extension of l. Although the first T n run lengths are singly connected in the first step, the run lengths appended during prediction step need not be singly connected, and the chain that was searched by above the algorithm is known as the DCC.
The following should be noted: (1) The run length whose length is longer than threshold M l i n e should be skipped in DCC fitting, such as R 4 (we call it as abnormal run length, and M l i n e is the largest width of the lines in a photograph); (2) Once a run length is appended in the prediction process, the line l should be refitted; (3) In the prediction process, the miss of two run lengths is allowed in order to avoid line breaks caused by pixel miss. As Figure 5a shows, different colors represent different DCCs, which are generated from Figure 1.

3.2. Table-Frame Detection

A DCC represents a line, and thus a ruling-line of the table should be a single DCC. But the searched DCCs in Section 3.1 may be broken by pixel miss. In addition, other interferences such as stamps and characters, which not belong to the table frame, will also be searched as a series of DCCs. To detect the table, these valid broken DCCs should be merged, and invalid interference DCCs should be removed. By the following five techniques, the table can be detected successfully with the elimination of invalid DCCs and the detection of table ruling lines. These five techniques are: removing abnormal DCC, merging broken DCC, removing short DCC, extending incomplete DCC, and merging overlapped DCCs. In addition, during the detecting process, stamp interference and irregular handwritten signature can be filtered while removing abnormal DCCs and short DCCs.
Since removing short DCCs and extending incomplete DCCs are relatively simple compared to other tasks, a brief introduction to them is given here. There is text, light noise, etc. existing in the intelligent IoT vision device-captured image. The lines comprising them are also recognized as DCCs. To recognize a table, these interferences should be removed. By observation, the lengths of them are short, so that the lines comprising them are usually searched for as short DCCs. We can remove them by filtering DCCs, whose length is shorter than T l e n g t h , as shown in the following equation.
T l e n g t h = β s i = 0 n l e n ( C [ i ] ) n
where l e n ( C [ i ] ) represents the length of DCC C [ i ] , n is the number of total DCCs, β s is a coefficient. AS Figure 5c shows, different colors mean different DCCs, and there are many short DCCs that compose characters and light noise. It can be seen clearly that those interference DCCs are removed with this technique, as shown in Figure 5d.
A non-singly connected run length cannot be the start of a DCC, and some separate run lengths are not appended to a DCC, which means that the searched-for DCC cannot represent a complete ruling-line of a table. As shown in Figure 5d, there are several incomplete ruling lines in the middle region, such as the blue one, the yellow one, the red one and so on. These DCCs should be extended to both sides by the prediction method introduced in Section 3.1. Figure 5e shows the extension result of Figure 5d. Those incomplete DCCs are completed successfully by this technique in Figure 5e, such as the blue one, the yellow one, the red one and so on.
The following are the details for removing abnormal DCC, merging broken DCC, and merging overlapped DCC. In addition, the techniques used in the stamp interference process are also introduced.

3.2.1. Abnormal DCC Removal

By statistical analysis on 603 intelligent IoT vision device-captured tables photographed by ourselves, it is found that concentration of the slopes of DCCs is to a certain slope in every photograph, and is approximate to Gaussian distribution, be they horizontal DCCs or vertical DCCs. The reason for this is that though the table ruling lines become skew lines in the course of perspective transformation, the sloping angle is not large. Based on this feature, the abnormal DCC will be removed by creating a statistic for the frequency of slopes and retaining the DCC, whose slope is close to the maximum. Figure 6 shows the slope distribution of horizontal DCCs in Figure 5b. It can be seen clearly that those abnormal DCCs, such as the dark green DCC and grass green DCC at the upper left part of Figure 5a, are removed with this technique, as shown in Figure 5b.
In summary, this section demonstrates that the DCCs belonging to the table should have approximative slopes, and how to find this slope to remove the abnormal DCCs.

3.2.2. Broken DCC Mergence

A ruling-line in a table should be recognized as a DCC, but sometimes it will be recognized as several broken DCCs because of missing pixels. As shown in Figure 5b, the four borders of the table are broken to several DCCs, which should be merged to recognize a complete table frame. Given that there are two DCCs, C 1 and C 2 , the fitting lines of them respectively are l 1 and l 2 , and the representations of them are Equation (3).
y 1 = k 1 x + b 1 y 2 = k 2 x + b 2
where k 1 and k 2 respectively represents slopes of l 1 and l 2 , and b 1 and b 2 respectively represent intercept of l 1 and l 2 .
Interval distance and fitting deviation are first defined here. As Figure 7 shows, interval distance is the distance between l 1 and l 2 in a horizontal direction. It can be computed by Equation (4)
D ( C 1 , C 2 ) = s t a r t 2 x e n d 1 x
where s t a r t 2 x represents the x-coordinate of the starting point on l 2 , e n d 1 x represents the x-coordinate of the end point on l 1
A fitting deviation is the deviation of mutual prediction between l 1 and l 2 . It can be computed by Equation (5):
p ( C i , x ) = k i x + b i
d i f f m ( C 1 , C 2 ) = | p ( C 1 , s t a r t 1 ) p ( C 2 , s t a r t 1 ) | + | p ( C 1 , e n d 2 ) p ( C 2 , e n d 2 ) |
where p ( C i , x ) represents the y-coordinate predicted by C i when the x-coordinate is x. s t a r t 1 x represents the x-coordinate of the starting point on l 1 . e n d 2 x represents the x-coordinate of the end point on l 2 .
As a result, if l 1 and l 2 satisfy Equation (6), then they will be merged.
| k 1 k 2 | < G a p k ; | b 1 b 2 | < G a p b ; D ( C 1 , C 2 ) < G a p T ( C 1 , C 2 ) ; d i f f m ( C 1 , C 2 ) < β m .
where G a p k represents the threshold of slope difference, G a p b represents the threshold of intercept difference, and G a p T ( C 1 , C 2 ) represents threshold of interval distance between l 1 and l 2 . Given that l e n ( C 1 ) and l e n ( C 1 ) are respectively used to represent the length of C 1 and the length of C 2 , G a p T ( C 1 , C 2 ) is computed by Equation (7):
G a p T ( C 1 , C 2 ) = l e n ( C 1 ) 10 , l e n ( C 1 ) l e n ( C 2 ) ; l e n ( C 2 ) 10 , l e n ( C 1 ) < l e n ( C 2 ) ; 20 , G a p T ( C 1 , C 2 ) > 20 .
As Figure 5c shows, it is the broken DCC mergence result of Figure 5b. It is clear that the broken DCCs are merged successfully, such as those four broken boundaries of the table in Figure 5b.
In summary, this section demonstrates that two broken DCCs should be merged when they satisfy Equation (6) to find the table frame.

3.2.3. Overlapped DCC Mergence

Overlapped DCCs will appear after broken DCC mergence and DCC extension, such as the DCCs in the middle region of Figure 8. They may belong to the same ruling-line, but have now become overlapped because of the mistake during slope computing, and thus they should be merged. Before that, overlapped distance and overlapped deviation are defined. Given that C represents a DCC, and d P L ( ( x , y ) , C ) represents the distance from the point (x,y) to C, overlapped distance will be the larger one between d P L ( ( s t r a t 2 x , s t a r t 2 y ) , C 1 ) and d P L ( ( e n d 1 x , e n d 1 y ) , C 2 ) . In addition, the overlapped deviation between C 1 and C 2 is:
d i f f o ( C 1 , C 2 ) = d P L ( s t a r t 2 , C 1 ) + d P L ( e n d 1 , C 2 ) e n d 1 x s t a r t 2 x ,
C 1 and C 2 are merged, if they satisfy Equation (9),
| k 1 k 2 | < T k ; | b 1 b 2 | < T b ; d L L ( C 1 , C 2 ) < T d i s ; d i f f o ( C 1 , C 2 ) < T d i f f .
where T k represents the threshold of slope difference, T b represents the threshold of intercept difference, d L L ( C 1 , C 2 ) represents overlapped distance, T d i s represents the threshold of overlapped distance, and T d i f f represents threshold of overlapped mistake. Figure 5f shows the result of Figure 5e by this technique, and the overlapped DCCs in the middle region in Figure 5e are merged successfully.
In summary, this section demonstrates that two DCCs may overlap, which makes a table become several lines. Therefore, if two DCCs satisfy Equation (9), they should be merged.

3.2.4. Stamp and Handwritten Signature Interference Processing

It is found that a stamp will be searched for as a series of short DCCs with various slopes to form a circle, by observing and analyzing lots of tables with stamps, as shown in Figure 5a. Therefore, the stamp can be filtered by abnormal DCC remove and short DCC removal, as mentioned above.
First, the abnormal DCC removal is introduced here. There are great differences between slopes of DCCs in a stamp and those of a table. In addition, table ruling lines generally are the long DCCs, as shown in Figure 5a. Based on the above features, when calculating the frequency of DCC slopes, the length of DCCs is also considered to be a parameter for the weight of the slopes, so that slopes in a stamp can be filtered. The weight of a DCC slope can be computed in Equation (10),
W K ( c ) = b a s e + l e n ( c ) b a s e
where b a s e represents a threshold, and the DCC whose length is smaller than it will have little effect on slope frequency statistic. There is obvious stamp interference in Figure 5a, and it is clear that a part of the stamp is filtered in Figure 5b by abnormal DCC remove.
Figure 5d shows the result of Figure 5c after short DCC remove, and clearly the stamp is filtered completely.
In addition, a handwritten signature belongs to the category of character interference, so it can be removed like other characters during recognition using the above five techniques. As Figure 5f shows, the handwritten signature is removed completely.
This section demonstrates that interference such as circle stamps and irregular handwritten signatures can be searched for as a series of short DCCs with various slopes. Therefore, those interferences can be filtered by abnormal DCC removal and short DCC removal.

3.3. Table Restoration and Table-Cell Extraction

To analyze the data in every table cell, we should restore the table by inverse perspective transformation, and extract the table cells.

3.3.1. Table Restoration by Inverse Perspective Transformation

The perspective transformation table can be restored easily by inverse perspective transformation using Equations (11) and (12).
[ x , y , w ] = [ u , v , w ] × A A = a 11 a 12 a 13 a 21 a 22 a 23 a 31 a 32 a 33
x = x w = a 11 u + a 21 v + a 31 a 13 u + a 23 v + a 33 y = y w = a 12 u + a 22 v + a 32 a 13 u + a 23 v + a 33
In the equations, (x, y) is the coordinate in perspective transformation image, (u, v) is the corresponding coordinate in restoration image, and A is the perspective transformation matrix.
From the above equations, it can be seen that the critical problem of inverse perspective transformation is computing a perspective transformation matrix, which requires four points in the perspective transformation table and four corresponding points in the restoration table. The four points selected are the vertexes of the outermost frame of the table, because it can hold most the table information. To get the matrix, we first determine the outermost frame in the perspective transformation table, then compute coordinates of its four vertexes based on the intersection of the edges, and finally compute the corresponding coordinates of those four vertexes in the restoration table.
Determining a table’s outermost frame is important in computing the matrix. There are still some interference DCCs beyond the table’s outermost frame. Therefore, a table’s outermost frame-determination algorithm is proposed to remove these interferences and determine the outermost frame. Ruling lines in a table generally are long, so the DCCs, which are shorter than a certain threshold both in the horizontal direction and vertical direction, are first filtered. Furthermore, the outermost frame is a quadrilateral, so its horizontal edges can cover both vertical edges. Based on this feature, as Figure 9 shows, vertical DCCs can be used to determine the range of horizontal DCCs in a table. Correspondingly, horizontal DCCs can be used to determine the range of vertical DCCs in a table. It means that the leftmost x-coordinate of vertical DCCs is the left boundary on horizontal direction of a table, and the rightmost x-coordinate of vertical DCCs is the right boundary on horizontal direction of the table. After that, DCCs that are out of the boundary are filtered. In addition, the leftmost vertical DCC, the rightmost vertical DCC, the topmost horizontal DCC and the bottommost DCC are selected as the outermost frame of the table. Algorithm 1 shows this Table outermost border detection algorithm. Figure 5g shows the outermost frame of the table in Figure 1 by this algorithm.
After determining the outermost frame of the table, the intersection points of its edges will be computed as its four vertexes, which can be represented as
V t r a n s f o r m = ( x l b , y l b ) , ( x r b , y r b ) , ( x r t , y r t , ( x l t , y l t ) ) .
In addition, given that the length of the longer horizontal edge is W e , and the length of the longer vertical edge is H e , we should restore the table, instead of the whole image, so the corresponding vertexes of V t r a n s f o r m in restoration image is
V r e s t o r a t i o n = ( 0 , 0 ) , ( W e , 0 ) , ( H e , W e ) , ( 0 , H e ) .
These eight coordinates are put into Equations (11) and (12), then the perspective transformation matrix will be computed, and the table is restored by inverse perspective transformation.
In summary, this section demonstrates that a perspective transformation table should be restored by inverse perspective transformation. To implement it, the perspective transformation matrix is computed by obtaining the four vertexes of the table outermost frame. Algorithm 1 shows how to detect table outermost frame.
Algorithm 1 Table outermost border detection.
Input: v e r t i c a l D C C s , h o r i z o n t a l D C C s
Output: The four point of the table outermost border: p 1 , p 2 , p 3 , p 4
  1:
h m a x ( l e n ( c ) f o r c i n v e r t i c a l D C C s )
  2:
w m a x ( l e n ( c ) f o r c i n h o r i z o n t a l D C C s )
  3:
h o r i z o n t a l D C C s [ c f o r c i n h o r i z o n t a l D C C s i f l e n ( c ) > w / 3 ]
  4:
v e r t i c a l D C C s [ c f o r c i n v e r t i c a l D C C s i f l e n ( c ) > h / 3 ]
  5:
l e f t = r i g h t m i n ( v e r t i c a l D C C [ 0 ] . s t a r t . x , v e r t i c a l D C C [ 0 ] . e n d . x )
  6:
for l i n e in v e r t i c a l D C C s do
  7:
     s t a r t , e n d l i n e . s t a r t . x , l i n e . e n d . x
  8:
    if s t a r t > e n d then
  9:
        s t a r t , e n d e n d , s t a r t
10:
    end if
11:
    if s t a r t < l e f t then
12:
        l e f t s t a r t
13:
    end if
14:
    if e n d > r i g h t then
15:
        r i g h t e n d
16:
    end if
17:
end for
18:
b o t t o m = t o p m i n ( h o r i z o n t a l D C C [ 0 ] . s t a r t . y , h o r i z o n t a l D C C [ 0 ] . e n d . y )
19:
for l i n e in h o r i z o n t a l D C C s do
20:
    s t a r t , e n d l i n e . s t a r t . y , l i n e . e n d . y
21:
    if s t a r t > e n d then
22:
        s t a r t , e n d e n d , s t a r t
23:
    end if
24:
    if s t a r t < b o t t o m then
25:
        b o t t o m s t a r t
26:
    end if
27:
    if e n d > t o p then
28:
        t o p e n d
29:
    end if
30:
end for
31:
h o r i z o n t a l D C C s [ c f o r c i n h o r i z o n t a l D C C s i f c . s t a r t > = l e f t a n d c . e n d < = r i g h t ]
32:
v e r t i c a l D C C s [ c f o r c i n v e r t i c a l D C C s i f c . s t a r t > = b o t t o m a n d c . e n d < = t o p ]
33:
while l e n ( h o r i z o n t a l D C C s ) > 0 and j < l e n ( h o r i z o n t a l D C C [ 0 ] ) < w / 2 do
34:
    del h o r i z o n t a l D C C [ 0 ]
35:
end while
36:
while l e n ( h o r i z o n t a l D C C s ) > 0 and j < l e n ( h o r i z o n t a l D C C [ 1 ] ) < w / 2 do
37:
    del h o r i z o n t a l D C C [ 1 ]
38:
end while
39:
while l e n ( v e r t i c a l D C C s ) > 0 and l e n ( v e r t i c a l D C C s [ 0 ] ) ) < h / 2 do
40:
    del h o r i z o n t a l D C C [ 0 ]
41:
end while
42:
while l e n ( v e r t i c a l D C C s ) > 0 and l e n ( v e r t i c a l D C C s [ 1 ] ) ) < h / 2 do
43:
    del h o r i z o n t a l D C C [ 1 ]
44:
end while
45:
if l e n ( h o r i z o n t a l D C C s ) < 2 or l e n ( v e r t i c a l D C C s ) < 2 then
46:
    r e t u r n F a l s e
47:
end if
48:
p 1 c r o s s P o i n t ( h o r i z o n t a l D C C s [ 0 ] , v e r t i c a l D C C s [ 0 ] )
49:
p 2 P o i n t ( h o r i z o n t a l D C C s [ 0 ] , v e r t i c a l D C C s [ 1 ] )
50:
p 3 c r o s s P o i n t ( h o r i z o n t a l D C C s [ 1 ] , v e r t i c a l D C C s [ 0 ] )
51:
p 4 c r o s s P o i n t ( h o r i z o n t a l D C C s [ 1 ] , v e r t i c a l D C C s [ 1 ] )

3.3.2. Table-Cell Extraction

In the restoration table, to analyze the data in every table cell, the table cells must be extracted, and the table contents should be recognized.
For table-cell extraction, the important step is to detect the table frame. The method of table-frame detection was discussed in Section 3.2. First, the DCCs are searched for in the restoration table by the method introduced in Section 3.1, and then the table frame is detected by the methods mentioned in Section 3.2. After that, the vertexes of all the table cells will be obtained by computing intersection points of horizontal ruling lines and vertical ruling lines. Figure 5i shows the table frame recognized in the end.
For table contents, the recognition method is quite mature [32,33], and thus it will not be discussed in this paper.
By the above steps, the whole table recognition can be recognized, and then the data can be analyzed to determine if sensitive data exists.

4. Experiments and Analysis

4.1. Evaluation Metric and Dataset

It is difficult to determine an accurate evaluation metric for table recognition at present [34]. This paper proposes a more comprehensive metric which takes table-cell importance degrees and error types into consideration.
First, all table cells are not the same because the content importance degree of table cells are different. Table cells can be divided into fixed fields and entry fields. Entry fields aim at collecting information while fixed fields aim at recoding fixed contents, like the item that tells you what should be collected. If entry fields occur error during the table-recognition process, the major table information will be missed, and the table will be meaningless. Therefore, errors occurring in entry fields will be more severe than that in the fixed fields. As Figure 1 shows, the table cells labeled in blue belong to entry fields, and table cells labeled in yellow belong to fixed fields. Because of the different roles that the two fields play, different weights should be given to them during the computing accuracy stage. The weights can be manually labeled by observing features of the dataset, and they can be computed by Equation (13),
ω 1 = n 1 n ω 2 = n 2 n
where ω 1 and ω 2 represent the weights of the non-local region and local region, respectively, n 1 and n 2 represent the number of table cells in non-local region and local region, respectively, and n represents the total number of table cells.
Secondly, errors occurring in table recognition include miss, fault, merge, and split at the table-cell level [9], and they should be taken into consideration during evaluation process, too. Miss means miss of cells in a table. Fault means wrong recognition of objects that are not in the table. Merge means mergence of several table cells. Split means division of a table cell. Merge and split are the most common errors because they themselves are table cells. But miss and fault are the more severe errors, because table cells at fault are themselves not table cells, and miss means cells in a table completely disappear. Therefore, different penalty coefficients should be given to these errors in evaluation.
Based on the above two considerations, a more comprehensive evaluation metric is proposed as below:
F = ω 1 F 1 + ω 2 F 2
F 1 = m a x ( ( 1 n = 1 4 θ i n 1 i n 1 ) × 100 % , 0 )
F 2 = m a x ( ( 1 n = 1 4 θ i n 2 i n 2 ) × 100 % , 0 )
where θ i represents penalty coefficient of error i, n 1 i represents the number of table cells with error i in the non-local region, and n 2 i represents the number of table cells with error i in the local region.
Because of the lack of a relevant dataset, this paper proposes a dataset with 603 intelligent IoT vision device-captured tables which are in Chinese, English, or with stamps. In addition, the non-local region and local region are labeled in the proposed dataset, and they are classified by the angles of perspective transformation. According to the rotation angle when capturing using the intelligent IoT vision device [35], perspective transformation [36] can be classified into three categories:
  • The general rotation made by rotating the intelligent IoT vision device around the z-axis only;
  • The table becomes trapezoid by rotating the intelligent IoT vision device around x-axis or y-axis;
  • The table becomes an arbitrary quadrilateral by rotating the intelligent IoT vision device around both x-axis and z-axis, or y-axis and z-axis;
Furthermore, each category mentioned above can also be divided into three cases: slight, obvious, and serious.

4.2. Experiment Setup

To evaluate the proposed algorithm, we implement a prototype with Python 3.7. A series of experiments are conducted on the testbed server equipped with IBM X3400, 16GB memory, and the operating system Ubuntu Server 16.04 (IBM, Beijing, China). We make comparison with the method proposed in [21,23].
In the experiments, the program is fed with the images from the dataset and the table cells are recognized as rectangles. To rate the result, the recognition output and ground truths are normalized to the same size, and the top-left corner of the table is regarded as the origin of the coordinates. By matching of the relative position between the corresponding rectangles from the results and the ground truth, the error type is determined. Finally, the accuracy is computed by the above benchmark method.

4.3. Perspective Transformation Analysis

405 tables with 15,597 table cells in total are taken from the dataset, in which 11,250 table cells belong to entry fields, and 4347 belong to fixed fields. Based on these data, and the proposed evaluation metric, our method of table recognition is compared to Yuan’s method [22] and Zheng’s method [23] to analyze the recognition results.
As shown in Table 2, the accuracy of our method is higher than Yuan’s [22] and Zheng’s [23], no matter in what kind of perspective transformation. Among them, our method works best in the case of rotation. This is because the ruling lines in the table keep the parallel relationships and vertical relationships after rotation, resulting in only a few DCCs belonging to the table being filtered in the abnormal DCC removal step that was introduced in Section 3.2.1. In addition, no matter what the rotation angle is, the accuracy of our method is over 92%, which implies our method can solve the traditional rotation problem effectively that generally occurs with a scanned document. For the perspective transformation of trapezoids and quadrilaterals, there is little difference in accuracy between the slight case and the obvious case, and all are over 92%. This is for the following two reasons. First, the DCC used in our method can search diagonal lines effectively, which allows the ruling lines of table occurring through perspective transformation to be found successfully. Secondly, the five techniques proposed in Section 3.2 (abnormal DCC remove, broken DCC mergence, short DCC remove, incomplete DCC extension, overlapped DCC mergence) allow the complete ruling lines to be detected, and interference such as irregular handwritten signatures and stamps to be filtered. Therefore, slight and obvious perspective transformation can be solved effectively with our method.
However, the accuracy is not ideal in the case of serious perspective transformation, whether it becomes a trapezoid or a quadrilateral. This is because severe perspective transformation causes the table ruling lines not to be covered by the determined boundary in the outermost frame-determining step introduced in Section 3.3.1, which makes the method fail when finding the table’s outermost frame, and the table cells are all missing. In addition, the accuracy of the trapezoid is lower than that of the quadrilateral in the case of severe perspective transformation. This is because the range of table ruling-line slope will change more widely when transforming to trapezoid, and exceed the threshold that we set in experiments, resulting in the DCC belonging to the table to be filtered.

4.4. Error Type Analysis

The obvious cases of trapezoid and quadrilateral are used to analyze the error types occurring in our method, because these perspective transformation cases are most common. There are 45 tables in every case in this experiment with 1250 table cells of entry fields and 483 table cells of fixed fields. Table 3 and Table 4 show the error types of our method, Yuan’s method, and Zheng’s method in trapezoid and quadrilateral, respectively. From the total number of error table cells, there is a lower error table-cell number in our method compared with other methods, no matter whether in the case of trapezoid or quadrilateral. Furthermore, in every error type, the error number of our method is also less than Yuan’s method, except for split error, which implies our method will have more split error, which is because text or stamp interference is not filtered completely by the short DCC removal and abnormal DCC removal, or the short DCC is extended so long in the DCC extension step that table cells are split. However, there is less split error in our method compared to Zheng’s, because Zheng’s method will merge the DSCCs when their added length is close to the table cell’s. In addition, Zheng’s method has more miss error than our method, because the strict DSCC search algorithm causes more breakage. The above two points are the reasons for the low accuracy of Zheng’s method. The miss error and merge error are more frequent in our method, which implies that the removal techniques, such as abnormal DCC remove and short DCC removal, filter excessively. Meanwhile, there is no fault error in our method, which implies the outermost frame of the table is exactly determined.

4.5. Stamp Interference Analysis

198 tables with stamp in dataset are taken from dataset for this experiment, and it is found that the stamp interference can be removed completely by our method, while Yuan’s method and Zheng’s method cannot do this. Figure 10 shows the removal result of our method and Yuan’s.
In addition, to explore whether stamp interference will affect accuracy or not, 198 tables with stamps and 198 tables without stamps are taken from the dataset. These tables have 17,676 table cells in total, of which 11,322 tables cells belong to entry fields, and 6354 table cells belong to fixed fields. As Table 5 shows, no matter in what kind of perspective transformation, there is little difference in accuracy between tables with stamps and tables without stamps, which implies that stamp interference has no effect on our method. This is because the stamp is searched as a series of short DCCs with various slopes in our method, as shown in Figure 5a. These DCCs can be removed by the abnormal DCC removal step and short DCC removal step introduced in Section 3.2.4. As Figure 5b shows, a part of the DCCs consisting of the stamp are filtered by the abnormal DCC removal. In addition, the stamp interference is removed completely by the next, following the short DCC removal step, as shown in Figure 5d.

4.6. Threshold Analysis

There are some thresholds to our method. To evaluate the effect of the method, the accuracies of different thresholds are tested. Table 6 shows the threshold in experiments. Experiments show that T b , T d i s , T d i f f , β s will affect the table-recognition results with different values, while other thresholds have little effect on the recognition accuracy with different values. Figure 11 shows how those four thresholds effect table-recognition accuracy. As shown in Figure 11c, with T d i s increases, the table-recognition accuracy first increases rapidly, then increases slowly, and finally stays stable. Table 6 shows the optimal value of each threshold when the table-recognition accuracy is optimal.
Finally, a system of intelligent IoT vision device-captured table recognition is designed and implemented based on our proposed algorithm, and has been integrated into a WeChat service product. Users can upload intelligent IoT vision device-captured tables via WeChat and tables will be recognized to analyze if there exists sensitive data on the server side. So far, this system has served over 267,000 people.

5. Conclusions

To prevent sensitive table data from leaking by analyzing photographed table data, this paper proposes an intelligent IoT vision device-captured table-recognition algorithm based on DCC, and solves the perspective transformation problem successfully, removing interferences such as the stamps and irregular handwritten signatures. In addition, a more comprehensive evaluation metric, which takes table-cell importance degree and error type into consideration, is proposed. Furthermore, a public dataset is provided. Finally, a system of intelligent IoT vision device-captured table recognition is designed and implemented, and our proposed algorithm is integrated into it. Experiments show that our proposed method can solve the perspective transformation problem, and remove interference such as stamps successfully. However, our method only addresses cases of images with a single table, and multiple table recognition in an intelligent IoT vision device-captured image requires further study.

Author Contributions

Conceptualization, X.G.; Methodology, Y.X.; Software, W.L.; Supervision, J.Z.

Funding

This work is partially supported by the National Key Research and Development Program of China (2018YFB1003405), the National Natural Science Foundation of China (61702286), the Natural Science Foundation of Tianjin, China (18JCYBJC15600), Open Projects of State Key Laboratory of Computer Architecture, Institute of Computing Technology, Chinese Academy of Sciences (CA RCH201604), Special Funding for Excellent Enterprise Technology Correspondent of Tianjin, China (17JCTPJC49500), the Foundation of Nankai University (91922299), and the Open Project of State Key Laboratory of Digital Publishing Technology.

Conflicts of Interest

The authors declare no conflict of interest.

References

  1. Floris, A.; Atzori, L. Managing the Quality of Experience in the Multimedia Internet of Things: A Layered-Based Approach. Sensors 2016, 16, 2057. [Google Scholar] [CrossRef] [PubMed]
  2. Anjomshoa, F.; Aloqaily, M.; Kantarci, B.; Erol-Kantarci, M.; Schuckers, S. Social Behaviometrics for Personalized Devices in the Internet of Things Era. IEEE Access 2017, 5, 12199–12213. [Google Scholar] [CrossRef]
  3. Karaadi, A.; Sun, L.; Mkwawa, I. Multimedia Communications in Internet of Things QoT or QoE. In Proceedings of the 2017 IEEE International Conference on Internet of Things (iThings) and IEEE Green Computing and Communications (GreenCom) and IEEE Cyber, Physical and Social Computing (CPSCom) and IEEE Smart Data (SmartData), Exeter, UK, 21–23 June 2017; pp. 23–29. [Google Scholar]
  4. Otoum, S.; Kantarci, B.; Mouftah, H.T. On the Feasibility of Deep Learning in Sensor Network Intrusion Detection. IEEE Netw. Lett. 2019, 1, 68–71. [Google Scholar] [CrossRef]
  5. Otoum, S.; Kantarci, B.; Mouftah, H.T. Detection of Known and Unknown Intrusive Sensor Behavior in Critical Applications. IEEE Sens. Lett. 2017, 1, 7500804. [Google Scholar] [CrossRef]
  6. Thirumalai, C.; Kar, H. Memory efficient multi key (MEMK) generation scheme for secure transportation of sensitive data over cloud and IoT devices. In Proceedings of the 2017 Innovations in Power and Advanced Computing Technologies (i-PACT), Vellore, India, 21–22 April 2017. [Google Scholar]
  7. Zhang, Z.; Cho, M.C.Y.; Wang, C.; Hsu, C.; Chen, C.; Shieh, S. IoT Security: Ongoing Challenges and Research Opportunities. In Proceedings of the 2014 IEEE 7th International Conference on Service-Oriented Computing and Applications, Matsue, Japan, 17–19 November 2014; pp. 230–234. [Google Scholar]
  8. Koo, H.I.; Kim, J.; Cho, N.I. Composition of a dewarped and enhanced document image from two view images. IEEE Trans. Image Process. 2009, 18, 1551–1562. [Google Scholar] [PubMed]
  9. Faisal, S.; Ray, S. Table detection in heterogeneous documents. In Proceedings of the 9th IAPR International Workshop on Document Analysis Systems, Boston, MA, USA, 9–11 June 2010; pp. 65–72. [Google Scholar]
  10. Zhang, J.; Xie, Y.; Liu, W.; Gong, X. Dataaset of Table Recognition for Sensitive Data Perception in an IoT Vision Environment. Available online: http://www.mobisys.cc/pages/resource.html (accessed on 8 May 2012).
  11. Kieninger, T.G. Table structure recognition based on robust block segmentation. Proc. SPIE 1998. [Google Scholar] [CrossRef]
  12. Tran, D.N.; Aly, T.; Oh, A. Table detection from document image using vertical arrangement of text blocks. Int. J. Contents 2015, 11. [Google Scholar] [CrossRef]
  13. Armon, R.M.; Fan, Z.; Raineror, E.V. Tabular document recognition. Proc. SPIE 1994. [Google Scholar] [CrossRef]
  14. Wang, Y.; Phillips, I.T. Automatic table ground truth generation and a background-analysis-based table structure extraction method. In Proceedings of the Sixth International Conference on Document Analysis and Recognition(ICDAR), Seattle, WA, USA, 13 September 2001. [Google Scholar]
  15. Mandal, S.; Chowdhury, S.P.; Das, A.K. A simple and effective table detection system from document images. Int. J. Doc. Anal. Recog. (IJDAR) 2006, 8, 172–182. [Google Scholar] [CrossRef]
  16. Neves, L.A.P.; Facon, J. Methodology of automatic extraction of table-form cells. In Proceedings of the 13th Brazilian Symposium on Computer Graphics and Image Processing, Gramado, Brazil, 17–20 October 2000; pp. 15–21. [Google Scholar]
  17. Zanibbi, R.; Blostein, D.; Cordy, J.R. A survey of table recognition. Doc. Anal. Recog. 2004, 7, 1–16. [Google Scholar] [CrossRef]
  18. Liang, J.; Doermann, D.; Li, H. Camera-based analysis of text and documents: A survey. Int. J. Doc. Anal. Recognit. (IJDAR) 2005, 7, 84–104. [Google Scholar] [CrossRef]
  19. Mirmehdi, M. Special issue on camera-based text and document recognition. Int. J. Doc. Anal. Recognit. (IJDAR) 2005, 7, 83. [Google Scholar] [CrossRef]
  20. Seo, W.; Koo, H.I.; Cho, N.I. Junction-based table detection in camera-captured document images. Int. J. Doc. Anal. Recognit. 2015, 18, 47–57. [Google Scholar] [CrossRef]
  21. Yuan, J.; Chen, H.; Cao, H. An efficient junction detection approach for mobile-Captured golf scorecard images. In Proceedings of the 3rd International Conference on Information Technology and Quantitative Management, Rio De Janeiro, Brazil, 21–24 July 2015; pp. 792–801. [Google Scholar]
  22. Yuan, J.; Chen, H.; Cao, H. Junction based table detection in mobile captured golf scorecard images. Ind. IoT Technol. Appl. 2016, 173, 179–188. [Google Scholar]
  23. Zheng, Y.; Liu, C.; Ding, X.; Pan, S. Form frame line detection with directional single-connected chain. In Proceedings of the Sixth International Conference on Document Analysis and Recognition, Seattle, WA, USA, 10–13 September 2001; pp. 699–703. [Google Scholar]
  24. Li, F.; Shi, G.; Zhao, H. A method of automatic performance evaluation of table processing. In Proceedings of the 2009 Chinese Control and Decision Conference, Guilin, China, 17–19 June 2009; pp. 3985–3989. [Google Scholar]
  25. Wang, Y.; Phillips, I.T.; Haralick, R.M. Table structure understanding and its performance evaluation. Pattern Recog. 2004, 37, 1479–1497. [Google Scholar] [CrossRef]
  26. Kasar, T.; Barlas, P.; Adam, S. Learning to detect tables in scanned document images using line information. In Proceedings of the 2013 12th International Conference on Document Analysis and Recognition, Washington, DC, USA, 25–28 August 2013; pp. 1185–1189. [Google Scholar]
  27. Silva, A.C. New metrics for evaluating performance in document analysis tasks application to the table case. Q. Appl. Math. 2007, 1, 164–168. [Google Scholar]
  28. Hu, J.; Kashi, R.S.; Lopresti, D.P.; Wilfong, G. Table structure recognition and its evaluation. Proc. SPIE 2000, 4307. [Google Scholar] [CrossRef]
  29. Jean, S. Image Analysis and Mathematical Morphology; Academic Press, Inc.: Orlando, FL, USA, 1983. [Google Scholar]
  30. Ole, S. Morphology-based black and white filters for topology optimization. Struct. Multidiscip. Opt. 2007, 33, 401–424. [Google Scholar] [Green Version]
  31. Kenneth, L. A method for the solution of certain non-linear problems in least squares. In Proceedings of the Ninth International Conference on Document Analysis and Recognition (ICDAR 2007), Curitiba, Brazil, 23–26 September 2007; pp. 481–485. [Google Scholar]
  32. Smith, R. An Overview of the Tesseract OCR Engine. In Proceedings of the Ninth International Conference on Document Analysis and Recognition (ICDAR 2007), Curitiba, Brazil, 23–26 September 2007; pp. 629–633. [Google Scholar]
  33. Liu, H.; Ding, X. Handwritten character recognition using gradient feature and quadratic classifier with multiple discrimination schemes. In Proceedings of the Eighth International Conference on Document Analysis and Recognition (ICDAR’05), Seoul, Korea, 29 August–1 September 2005; pp. 1520–5363. [Google Scholar]
  34. Hu, J.; Kashi, R.; Lopresti, D.; Nagy, G.; Wilfong, G. Why table ground-truthing is hard. In Proceedings of the Sixth International Conference on Document Analysis and Recognition, Seattle, WA, USA, 10–13 September 2001; pp. 129–133. [Google Scholar]
  35. Hartley, R.; Zisserman, A. Multiple View Geometry in Computer Vision; Cambridge University Press: New York, NY, USA, 2000. [Google Scholar]
  36. Mezirow, J. Perspective transformation. Adult Educ. 1978, 28, 100–110. [Google Scholar] [CrossRef]
Figure 1. Table with perspective transformation and interferences.
Applsci 09 04162 g001
Figure 2. Table-recognition process. DCC: Directional Connected Chain.
Applsci 09 04162 g002
Figure 3. Run length.
Applsci 09 04162 g003
Figure 4. Searching a horizontal DCC.
Applsci 09 04162 g004
Figure 5. Recognition result of each step.
Applsci 09 04162 g005
Figure 6. Slope distribution of horizontal DCC.
Applsci 09 04162 g006
Figure 7. Broken line.
Applsci 09 04162 g007
Figure 8. Overlapped line.
Applsci 09 04162 g008
Figure 9. Outermost frame determination.
Applsci 09 04162 g009
Figure 10. Recognition result of table with stamp interference.
Applsci 09 04162 g010
Figure 11. The effect of different threshold.
Applsci 09 04162 g011
Table 1. The notations of symbols.
SymbolNotationSymbolNotation
Rrun length T d i s the threshold of overlapped distance
k t h e s l o p e o f l e n d i x the x-coordinate of the end point of l i
lthe fitting line s t a r t i x x-coordinate of the starting point of l i
W k the weight of k M l i n e the threshold of the length of run length
bthe intercept of l d P L ( ( x , y ) , C ) the distance from the point (x, y) to C
len(C i )the length of C i d i f f o ( C 1 , C 2 ) overlapped deviation between C 1 and C 2
Cdirectional connected chain G a p T ( C 1 , C 2 ) threshold of interval distance between l 1 and l 2
Aperspective transformation matrix p ( C i , x ) y-coordinate predicted by C i when x-coordinate is x
d L L ( C 1 , C 2 ) overlapped distance D ( C 1 , C 2 ) distance between l 1 and l 2 on horizontal direction
T d i f f the threshold of overlapped mistake
Table 2. Accuracy of various perspective transformation.
MethodRotationTrapezoidQuadrangle
SlightObviousSeriousSlightObviousSeriousSlightObviousSerious
Our method94.84%96.51%92.46%94.42%93.66%79.62%94.41%93.66%84.11%
Yuan’s method89.22%28.38%5.60%81.12%84.91%70.74%92.73%78.50%69.34%
Zheng’s method84.94%82.65%68.90%81.86%77.93%62.98%83.39%78.21%70.00%
Table 3. Numbers of every Error types in obvious case of trapezoid.
MethodEntry FieldsFixed Fields
MissFaultMergeSplitTotalMissFaultMergeSplitTotal
Our method1502314521404119
Yuan’s method600100703005035
Zheng’s method1100295018937031959
Table 4. Numbers of every Error types in obvious case of quadrilateral.
MethodEntry FieldsFixed Fields
MissFaultMergeSplitTotalMissFaultMergeSplitTotal
Our method410368855014726
Yuan’s method2570502625807065
Zheng’s method1260314119837031959
Table 5. Accuracy of stamp.
MethodRotationTrapezoidQuadrangle
SlightObviousSeriousSlightObviousSeriousSlightObviousSerious
with stamp95.17%95.79%92.83%95.63%94.41%85.01%94.56%94.92%88.60%
without stamp95.53%95.72%92.45%95.17%94.48%82.91%93.84%94.80%87.30%
Table 6. Tested thresholds.
ThresholdNotationOptimal Value
G a p k the threshold of slope difference in Equation (6)2
G a p b the threshold of intercept difference in Equation (6)0
β m the threshold of fitting deviation in Equation (6)2
T k the threshold of slope difference in Equation (9)1
T b the threshold of intercept difference in Equation (9)0.4
T d i s the threshold of overlapped distance in Equation (9)40
T d i f f the threshold of mistake in Equation (9)0.4
β s the coefficient in in Equation (2)0.1

