Abstract
To effectively manage a river system, systematic tracking and diagnosing the change and risks of a river system are essentially required to efficiently conserve or restore its conditions. Hence, this study focuses on how to integrate current status assessment, trend prediction, and cause diagnosis in river health to guide early warning decision-making in river protection and management. This study has presented a three-phase approach by coupling spatial with nonspatial information in a highly systematic and reliable way, and an early warning system has been designed. In phase I, the current health status is assessed and nowcasted by using the order degree of each indicator. In phase II, health predictors, including the single perspective-based health index (HI) (e.g., water quality index (WQI) and index of biotic integrity (IBI)) and multi-perspective-based health index, have been forecasted under normal conditions or emerging conditions using predictive models. In phase III, key causal factors threatening the river health have been identified to enable early notification and to address unexpected events before occurrence. Although different modeling methods can be used in each phase to demonstrate this concept, we tested the model of partial least square regression (PLSR) associated with time series. Additionally, the three-phase approach has been integrated with geographic information system (GIS) and a decision support system (DSS) to develop a river health prediction and early warning system (RHP-EWS), an automatic prediction and decision-making tool. This tool was implemented to deal with the landing of typhoon “Maria” in 2018 into the Shanxi River watershed in China. Because of the timely responses and decisions, the drinking water supply was not influenced. However, the models should be extended to other river systems for testing and improvement at different temporal or spatial scales.
1. Introduction
As river systems have beneficial natural and social functions and provide many services and goods, such as shelter, food sources, and ecological refuge for an array of biological species, fresh water, transport mediums, recreation and tourism opportunities, aesthetic and cultural values and aid in flood management to protect society, they have been widely regarded as the most essential of natural resources and as places to experience the serenity of nature [1]. However, many river systems are globally threatened by various human activities such as water extraction, channelization, logging, mining, and pollution from domestic, agricultural, and farming activities [1,2]. For instance, since the late 1980s, algal blooms have frequently occurred, and approximately 41 fish, 65 zooplankton, and 16 macrophyte species have disappeared from the Taihu Lake located in the Yangtze River Delta in China [3]. Nitrogen and phosphorus levels in surface water from the Yangtze River are higher than those in surface water from other areas of China [4]. The United States Environmental Protection Agency (USEPA) has reported that 44% of surveyed streams and rivers in the United States have been impaired for at least one designated use [5]. Evidently, only a strikingly small fraction of the world’s river systems have remained unaffected [1,5,6], and river systems have become one of the most endangered global systems at an alarming rate [7]. Therefore, the increasingly urgent needs to maintain healthy river systems have become important objectives of river management [8].
Philosophically, the term “river health” is useful because it is readily interpreted by the general public and evokes societal concern about human impacts on river systems [9]. For the past few decades, countries across the globe have been in a constant battle to monitor and evaluate the healthy status and variation of a river system and of identifying anthropogenic impacts. Many assessment indices, mathematic methods, and digital tools have been developed in multiple countries such as Australia [6,10], China [8,11,12], the United Kingdom [13], Sweden [14] and the United States [15]. For instance, in Australia, AUSRIVAS (Australian River Assessment System), FARWH (National Framework for the Assessment of River and Wetland Health), IRC (Tasmanian Index of River Condition), and SRA (Sustainable River Audit, systematic river health assessment for the Murray Darling Basin) have been established to assess the health status of the river systems at state or national levels [16]. In China, Xia et al. (2013) established a river health diagnosis index system, which consisted of natural structure index, ecological service index, and social services index [11]. They also designed a GIS-based intelligent river health diagnosis and decision support system (RHD-DSS) to assess the health status and diagnose the causal factors that influenced a river’s conditions or health status [12]. In Europe, the EU Water Framework Directive (WFD), brought into effect in 2000, aims to defend vulnerable water bodies and bring the vast majority of Europe ground and surface waters back to good health by 2027 [17,18]. RIVPACS (River Invertebrate Prediction and Classification System), which is an aquatic biomonitoring system based on macroinvertebrate species for assessing water quality in freshwater rivers, is used across the United Kingdom [19]. In practical terms, river managers hope to obtain answers to the questions: “Are there any risks in a river system and what is the extent of the risks and changing trends? How could managers deal with an emergency even?” Only with a foundational understanding of the future trends of a river system, could river managers be alerted to make timely, precise decisions or policies during extreme events. For these reasons, Adams and Ham (2011) emphasized several advantages of an integrative approach in health/risk evaluations of aquatic environments and early warning information interpretation, which could be carried out with an early warning system [20,21]. Thus, an effort should be made to devise a river health early warning system based on river conditions and local characteristics to consider trends and impacts of normal or unexpected events and situations, which can support a spatial analysis of external factors threatening river health and the extendable, configurable and automatic decision. To better monitor and prevent exceedance of maximum capacity threats, a new, reliable, and effective early warning and decision support tool for river health is required to exhibit a significant health degree, to permit accurate trend prediction, and to identify the source of threats, allowing for rapid response.
However, the conditions and services of a river system are becoming finite and vulnerable under a range of stressors, which include natural stressors (e.g., dramatic alteration of hydrology and channel morphology, habitat fragmentation and loss, high nutrient levels, pollutants, and invasive species), anthropogenic stressors (e.g., water abstraction, dam or weirs construction, highly urbanized regions, industrial regions, and popular tourist regions), and urgent events (e.g., emergency pollution events and dam failure events). Therefore, the primary purposes of this study are: (1) To lay down the basics of a three-phase approach for river health early warning; (2) to define the conceptual framework and components of a river health early warning system based on the three-phase approach; and (3) to design the structure of an integrated computer tool, the river health prediction and early warning system (RHP-EWS), into which is integrating the three-phase approach and geographic information technology to predict the risks of exceeding the health limit and to quickly send the alarm information to river managers or end-users to help them make decisions that enable effective responses to emergency threats/risks as early as possible.
2. Materials and Methods
2.1. Study Area
The study area is Zhejiang Province, located in Southeastern China (Figure 1), which is one of the fastest growing regions in China with a current population of nearly 56,570,000 people. With eight major watersheds (i.e., the Qiantang River, Oujiang River, Feiyun River, Ling River, Ao River, Caoe River, Yong River, and Tiao River) most of which flow into the East China Sea, the province has a combined drainage area of nearly 10,480,000 km2 and consists of 70.4% mountain or hilly areas, 23.2% flat areas, and 6.4% rivers or lakes. There are 865 rivers with catchment areas larger than 50 km2, where the flow is dominated by rainfall events and is highly regulated by constructed dams, weirs, and gates along the river systems.
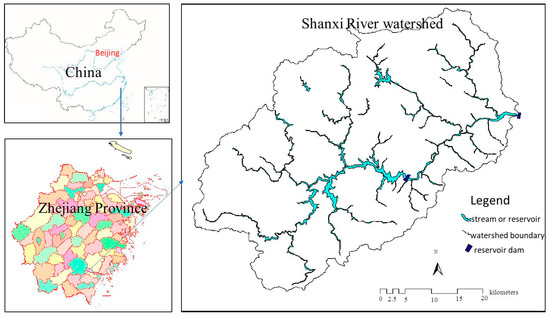
Figure 1.
Location of study area and site.
Public concern about declining river health in Zhejiang Province has been noted since the end of the 1990s. A staged strategy in the development of river management has been adopted. In the early period (2000–2007), the main river issues focused on water quality assessment of major rivers. From 2007 to 2010, managers and researchers focused on acausal diagnosis for degraded river systems, in which a key milestone was the health diagnosis project undertaken on a provincial scale and the development of RHD-DSS. During this stage, the main large rivers were considered. From 2011 to 2014, however, the strategy shifted attention toward medium or small rivers, and some ecological restoration activities were implemented. Since 2014, forecasting future trends and determining precise causes of river health degradation have drawn attention. Particularly, the problems related to how to predict the variation in drinking water health status, how to identify major threats, and how to maintain healthy status have been addressed, which led to the formation of a partnership between the Department of Qiantang Catchment Management and the River Management Bureau of Zhejiang in 2015. This was a joint initiative of the provincial government and the catchment management organization for ecological and environmental conservation and restoration, undertaking extensive consultastion and catchment management and establishing an agreement on a clear vision for river health. Careful management is clearly required based on efficient river health assessment and prediction methodologies. However, the condition of river systems in Zhejiang Province has changed considerably over the past few decades.
2.2. Merits of a Healthy River System
Webster’s dictionary defines “health” as a condition of flourishing, well-being, vitality, or prosperity, which is shorthand for in “good condition” [22]. Although authors have argued that an analogy between human health and ecosystem health oversimplifies a complex issue [9], the incorporation of ecological integrity (maintaining ecosystem structure and function) and human values (when humans value rivers and related goods and services) into the definition of river health is critical [9,23,24]. A robust and complicated river system is comprised of biotic communities and abiotic components that interact with each other in a systematic way [25,26]. Particularly, hydrodynamic mechanisms and biological fitness are the key processes that maintain good self-regulating functions of a river system [25]. Once communities can organize into sets and subsets and pass information back and forth receive the alarm, they undergo tactical changes and begin to produce powerful chemicals. These substances allow other species to regulate their own growth and behavior, enlist their fellow species, and direct new recruits to trouble spots. Additionally, a river system may provide essential goods and services such as clean drinking water or fisheries production, conservation and biodiversity values, and also aesthetic and cultural values [27]. Only if all components of a river system work together under good condition and supply sustainable services for humans, it is considered a healthy system. A river system is healthy when it is running under good internal and external conditions [11]. Good internal conditions indicate that all structural elements are organized and that a system can perform all its vital functions normally and properly; good external conditions imply that a system can recover from normal stresses or requires minimal outside care [11,22]. A healthy river system is clearly sustainable and resilient, while maintaining both societal and ecological necessities with healthy structures, functions, and services [11,27,28].
2.3. Description of the Three-Phase Approach
We have designed a three-phase approach which is a multivariate approach and through which descriptive factors of river health can be compounded to guide in developing management strategies for complex rivers at a temporal-spatial scale. The approach can be summarized as follows:
• Phase I: Assessing current health status
In the first phase, the current health status is evaluated via conducting a single-perspective or multi-perspective assessment. In general, most assessment approaches have been developed with multiple indicators, based on the experience and expertise of the team and drawing on scientific literature. In routine assessment, some of these commonly used indicators are water quality, biotic parameters, or a comprehensive index. Similarly, we have also established a water quality index (WQI) [29], index of biotic integrity (IBI) [30,31], and health index (HI) [11] as the assessment indicators to evaluate the health status. Among these three indicators, WQI and IBI are considered single-objective indicators with which water quality and biotic features can be characterized and quantified. HI has been developed as a multi-perspective indicator to assess the comprehensive health status. WQI is composed of six variables, such as pH, temperature (T), total nitrogen (TN), total phosphorus (TP), dissolved oxygen (DO), and turbidity (Tur) [29], and the fish index of biotic integrity (FIBI), zooplankton index of biotic integrity (ZIBI), phytoplankton index of biotic integrity (PIBI), and benthic index of biotic integrity (BIBI) are compounded into the IBI [30,31]. On the other hand, HI has been constructed with structural and functional variables and is evaluated using the order degree method, which could be found in detail in Xia et al. (2013) [11]. Subsequently, when WQI, IBI, and HI are calculated and compared with the threshold value of each health grade, the current health status is graded.
• Phase II: Forecasting health trends
Given the current health status, the second phase, forecasting health trends, may be carried out, which yields a remarkable advance by forecasting upcoming severe short-term or long-term situations earlier than the original measurements. In this phase, WQI, IBI, and HI are used as the predictors, among which HI is considered as comprehensive objective predictor, while WQI and IBI are categorized as single objective predictors. Basically, after relationships between dependent and independent variables are projected into a new space, a linear regression combination can be constructed. When the residual error is very small, the ideal value of predictor P can be interpreted with its predictive value . Without loss of generality, the predictive model can be described by Equation (1).
where , and , respectively, are the ideal value, predictive value, and predictive residual error of predictor P at time t. P is a predictor such as IBI, WQI, or HI. and can be calculated via Equation (2) [32].
where are the predicted values of or at time t − 1, t − 2, …, t − d of the time series, respectively; are the values of monitoring variables at time t, respectively; and d is the input and feedback delay time interval.
• Phase III: Identifying causal factors
If it is inferred that degradation exists according to the predictive trends, the next phase should be conducted to identify the main causal factors. Generally, river health may be threatened by natural, anthropogenic, or urgent stressors. The method for how to identify these key factors is quantifying the contribution of factors to predictors with the VIP (variable importance in the projection) function of partial least squares regression (PLSR) [33,34]. PLSR was developed for econometrics by Wold in 1975 [33], which has been used to handle multi-collinearity among independent variables [34]. The VIPs represent the importance of model descriptors, both with respect to correlation to Y (dependent variable set) and with respect to X (the projection). Each descriptor is uniquely and independently described by its VIP, which represents a measure of the contribution of the term to the decomposition of X, and the correlation with Y. Moreover, the VIPs are normalized to enable comparison. Terms with the largest VIP value are the most relevant for explaining the dependent variable. The importance degree of independent variable can be obtained with Equations (3) and (4).
where is the variable importance projection of independent variable on dependent variable ; is the ability to explain with ; is the ability to explain with ; is the relative coefficient between and ; are the least partial components of independent variables; and is the hth least partial component.
2.4. Framework of a River Health Warning System and Tool Development
As a river system greatly varies on spatial and temporal scales, prediction and early warning of river health can be considered from the routine of past analysis, current analysis and future analysis. The framework of a river health warning system (RHP-EWS) can be designed with the three-phase approach.
2.4.1. Conceptual Framework of a River Health Early Warning System
To better manage and conserve river systems, a river health early warning system with the ability to analyze and interpret results in real time is required. A system has been designed, through which the current and future conditions of a river system can be characterized and the possible warning scenarios and position can be located. The conceptual framework of this system is illustrated in Figure 2. It begins with characterizing river health features and identifying their indicators, continues with data collection and pre-processing, and then envelopment analysis. Lastly, an early warning tool which is integrated with the three-phase approach, geographic information system (GIS), and decision support system (DSS) techniques, has been developed to address the possible risks and dominant causal factors and to identify sites in need of attention the most. The general processes are shown as follows:
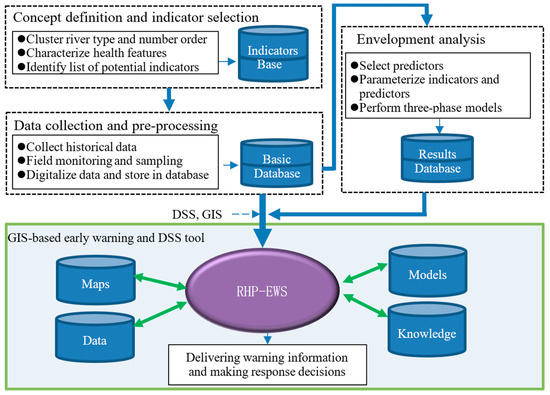
Figure 2.
Conceptual framework of a river health early warning system based on the three-phase approach.
- Concept definition and indicator identification: The system starts with clustering river types, characterizing health features and identifying a list of potential indicators of rivers or watersheds. To assist in setting river health guidelines and in stratifying indicators and field sites, rivers in a watershed are divided into many types or sub-types or sub-catchments with GIS. In turn, each sub-catchment is divided into a series of reaches or rivers, which are each assigned a value for stream order, rainfall, altitude, and slope.
- Data collection and pre-processing: River health data are collected via multiple monitoring or sampling sites that have been selected to cover an extensive range of levels at the reach, sub-catchment, and catchment scales. Monitoring and sampling data are digitized and pre-processed to store in the relevant database. In addition, the geographic map should be previously digitalized sand uploaded.
- Envelopment analysis: After indicators, variables, and predictors have been identified as the parameters of the three-phase approach, data are enveloped and input. Then, short- or long-term trends in river health are analyzed and predicted when normal or extreme threats occur.
- GIS-based early warning and DSS tool design: To efficiently improve prediction and make precise early warning decisions, a GIS-based early warning and DSS tool, the river health prediction and early warning system (RHP-EWS), has been developed, into which the components and processes described above have been integrated. With this tool, multiple-source processed and early warning information could be disseminated to decision-makers or other end-users while efficient timely responses on river health to early warning information could be issued and implemented.
2.4.2. Structure and Interface of RHP-EWS
RHP-EWS is very structured (Figure 3), consisting of a data module, pre-processing module, assessment module, forecasting module and DSS module, as well as an input and output module. The data module manages data that are sourced from real-time field monitoring, user input, other public databases, etc. The preprocessing module is responsible for geographic map digitalization, indicator selection, and data normalization to prepare and preprocess data, and to render data applicable for data fusion. The assessment module exists to compute the values of HI, WQI, and IBI and grade the current health status. Using the forecasting module, HI, WQI, and IBI in future periods can be forecasted with pre-stored predictive models to explore the changing trends of river health under normal or emergency conditions. The DSS module is useful for diagnosing major causal factors that influence the river health conditions. Additionally, the timely response suggestions on treatment measures, times, and locations, which are presented in the form of warning reports, can be imposed with the DSS module based on information from the assessment module and forecasting module. After that, managers and decision-makers can be warned. In this system, GIS has been used to spatially analyze and visualize thematic information (e.g., health grades, health trends, and spatial difference) with dotdensity, bar, line, or category thematic maps.
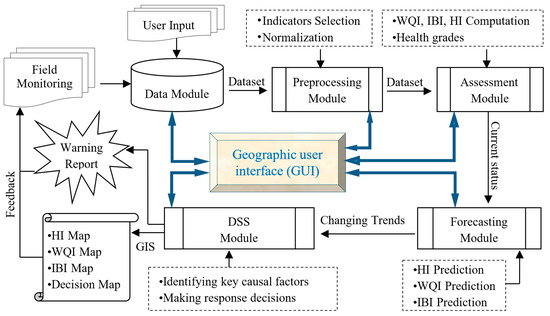
Figure 3.
Structure of the river health prediction and early warning system (RHP-EWS) integrated with the three-phase approach.
The visualized tool has been developed with Visual Basic 6.0 integrating MapX control (developed by Mapinfo Ltd., North Greenbush, NY, USA). The inputs and outputs of each module operate through a geographic user interface (GUI), which has four function blocks: the menu bar, tool bar, parameter setting block, and map operation, and data addressing block (Figure 4). In menu bar, there are seven function menus: File, Data, Models, Assessment, Prediction, EW-DSS (early warning and decision supporting system), and Help. There is a functional button bar through which users can remotely perform the functions of file management and map management. In the map operation and data addressing block, original maps or thematic maps can be visualized as well as original input data and computation or analysis data. Additionally, the functions of zooming in/out on a map and searching for information can be carried out through a pop menu.
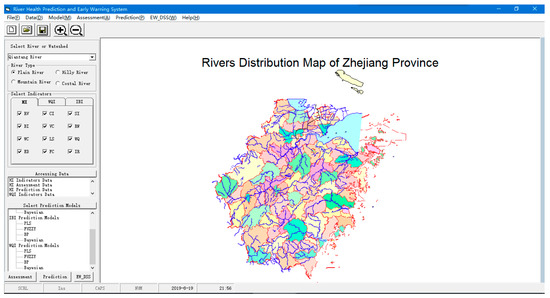
Figure 4.
Geographic user interface of RHP-EWS.
2.4.3. Data Collection, Preprocessing, and Storage
In this system, original data have been classified into three categories as follows: basic data, sensor monitoring, and sampling data. Basic data includes physiographical data, daily flow data, basic water quality data, biological data, and climate data, which are collected and provided by various organizations. Physiographical data including topography and land use, for this study come from the Department of Natural Resources of Zhejiang Province (Administration of Surveying Mapping and Geoinformation, http://www.zjditu.cn/) and are available online. The daily flow data come from the water surveys by Zhejiang’s hydrology gauges. The basic water quality data originate from water surveys of Zhejiang’s hydrology gauges. Biological data are mainly surveyed by the Department of Natural Resources of Zhejiang Province. The Zhejiang Weather Service Center provides climate data including daily precipitation and minimum and maximum temperature values recorded since 1990. In particular, it is very important to establish a suitable monitoring program with a real-time monitoring approach to meet the goals of RHP-EWS, through which sensor monitoring data are collected and often advanced, continuously online in real time to reduce the risks of an incident to users when extreme anthropogenic events (e.g., inadvertent discharges/spills, vandalism, as well as cumulative point and nonpoint source pollution) or extreme natural events (e.g., flooding and algal blooms) occur. In addition, data with manual sampling and examination can supplement and calibrate the real-time sensor monitoring data. After original data collection, indicator values should be transformed and normalized (from 0 to1), where the reference condition (i.e., “best case”) is 1 and the theoretical minimum (i.e., “worst case”) is 0.
Additionally, from a preliminary analysis of health indicators and variables, a set of a priori models is formulated for each stream health indicator. Candidate explanatory variables for the models can be selected based on the t-test. These statistical procedures guide selection of the most important explanatory indicators or variables as the parameters for assessment or prediction models. All original data, standardized data, and selected indicators or variables are stored in the database, which has been designed with Microsoft Access.
2.4.4. Alarm Levels and Response Decisions
Using predictor values as trigger values, these values are then compared with a user-selected threshold level. If a trigger value is less than the threshold, the river health would be in a warning condition so that health grade would be assigned and the alarming signals would be triggered. In this system, health grades have been classified as healthy, fair, poor, serious, and critical grade while warning conditions have been classified into five alarm levels: “No Warning,” “Blue Warning,” “Yellow Warning,” “Orange Warning,” and “Red Warning,” which gradually increase. The “Green” level is the lowest while the “Red” level is the highest. The “No Warning” level means a river system is natural and healthy and provides good services. The “Red Warning” level means a river system is almost lost because of extensive threats so it is important to adopt some immediate treatments. According to the health grades, we have designed the alarm signals with green, blue, yellow, orange, and red solid circles to demonstrate the respective health grades and alarm levels (Table 1).

Table 1.
Health grade and alarm level categories in RHP-EWS.
Previously, some successful measures, experiences, and suggestions (e.g., flood control engineering, ecological restoration, water quality improvement, pollution treatment, release of flood forecasting reports, broadcasting water pollution information, boil water advisories, and evacuation advisories) for addressing risks or threats were digitalized and stored in the knowledge bases. Once one of the alarm signals is triggered by one or more particular causal factors or threats, the tool can tell the users or managers how to deal with and make related responses. When the major causal factors have been identified, the factors are set as the indexed key words to search their corresponding decisions from knowledge bases. Implementation of effective and timely responses to alarm signals are issued and help decision-makers to identify potential new policy options to address future conditions with decisions to meet their goals.
3. Case study
3.1. Study River
The case study site is the Shanxi River watershed situated in the upstream Feiyun River drainage basin in Southern Zhejiang province, China (Figure 1). The total drainage area is approximately 2302 km2 and consists of 70.60% forest, 21.05% agriculture, 2.40% water bodies, and 1.81% residential area. The Shanxi River watershed has more than 14 main tributary streams. Two reservoirs, the Shanxi Reservoir and Zhaoshandu Reservoir, were formed by constructing the Shanxi Dam and Zhaoshandu Dam, which are located in the Shanxi town and Zhaoshandu town, respectively. Additionally, the Shanxi River watershed is an important drinking water source for 5 million people living in Wenzhou city, Pingyang county, Ruian county, Wencheng county, and Taishun county. Its annual water supply is 1.2 billion m3. The intake is located 1 km from Zhaoshandu Dam on the left side. Based on the River Continuum Concept developed by Vannote et al. (1980), the watershed is attributed to the mountain river type, and river orders have been calculated so that rivers have been grouped into headwaters (orders 1–3) and medium-sized streams (orders 4–6). According to stream order classification, the watershed has been divided into 48 sub-catchments or reaches.
We have set 38 monitoring and sampling cross-sections along the river and 3 sampling vertical lines in each cross-section. Some sampling points are under water at 1 m, 3 m, 7 m, 10 m, 20 m, 30 m, and on the bottom in vertical lines. Under normal conditions, the flow condition, water quality, and biologic variables have been monitored with sensors and sampled once per month since 2008. When urgent or emergency events occur, these data are collected every hour.
3.2. Emergency Event
Super typhoon Maria, last year’s eighth typhoon, made landfall with high winds and torrential rains in the coastal regions of the Huangqi peninsula, Lianjiang county, Fujian at 9:10 a.m. on July 11, 2018. Afterward, the typhoon rapidly weakened over land and dissipated on July 12. However, Maria was still to bring a brief period of flooding rain and destructive winds to Shanxi River watershed before dissipating. The maximum rainfall was approximately 400 mm, located at Jiufeng Hydrology Station in Taishun county. Because of the heavy rains, mudslides were considered a serious concern in the higher terrain. Water with a large amount of muds flowed into rivers so that the water became very turbid, which affected the drinking water supply. During this typhoon, the monitoring frequency was set as once per hour from 9:00 a.m. on July 10, 2018 to 9:00 a.m. on July 14, 2018.
4. Results and Discussion
4.1. Health Trend Prediction
In this case study, predictors were forecasted using the PLSR to construct the prediction models. As a preliminary step, the changing health trends were analyzed using RHP-EWS for the Maria event. We collected data for health prediction during the period of July 10 to July 13, 2018. When the collected data were input into RHP-EWS, the HI, IBI, and WQI prediction values per one-hour step over the event period were obtained and the changing health trends of each sub-catchment or reach were predicted and are shown in the prediction thematic maps. Figure 5a is a bar chart thematic map, which illustrates the changing HI trends of all reaches during the Maria event from 1:00 a.m., July 10 to 11:00 p.m., July 13. When one of the charts is clicked, the detailed trend features are presented as a trend line chart. For instance, when we click the bar chart located in Zhaoshandu Reservoir, its detailed HI trend feature is shown as Figure 5b. Figure 5b shows that HI reached the lowest value of 0.62 at 1:00 p.m. on July 12. Before this time, the HI decreased, and after that, the HI trend episode began to rise and reached a constant approximately 3 days later. Thus, the trend analysis yielded a remarkable advance by forecasting upcoming severe situations days earlier than the original measurements.
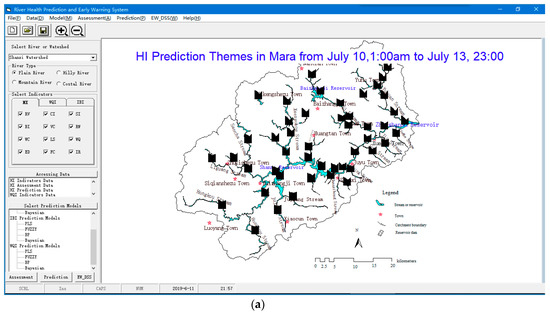
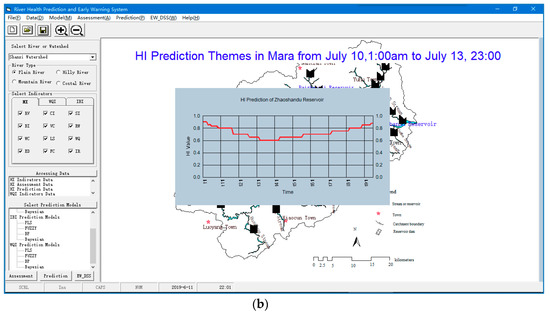
Figure 5.
Health index (HI) prediction over the period of Maria: (a) HI trend thematic map of all reaches and (b) HI trend line chart of Zhaoshandu Reservoir.
4.2. Alarm Signals, Key Causal Factors, and Decisions
Most sites were healthy and there were no alarm signals during the first day. However, at approximately 11:00 am on July 12, the blue alarm signal first appeared in the second reach of the Feiyun River. After this time, blue or stronger alarm signals appeared in more and more reaches. For instance, at 1:00 p.m. on July 12, HI values ranged from 0.853 to 0.45 as shown in Figure 6. Figure 6 provides a spatial distribution of the variation in HI at 1:00 p.m. on July 12. Figure 6 indicates that orange alarm signals appeared in Guixi reach while blue alarm signals appeared in Zhaoshandu Reservoir, Yuquan downstream reach, Huantanken reach, etc. These data revealed a wide variation in health across the 48 reaches. We computed the VIPs of the main causal factors as shown in Figure 7. Figure 7 shows that the turbidity VIP was the largest. Usually, turbidity is caused by particles suspended or dissolved in water, which can be algae or sediment. During this event, the intense rain eroded a large amount of sediment flowing into this water body, which made the water appear cloudy or murky. This result indicated that turbidity was the key causal factor that threatened river health. From the derived warning information, the key causal factor were identified and delivered to policy makers at local and provincial levels. Then, the tool searched the knowledge base to find response decisions, which were then sent to managers who were reminded to improve the ability to treat water.
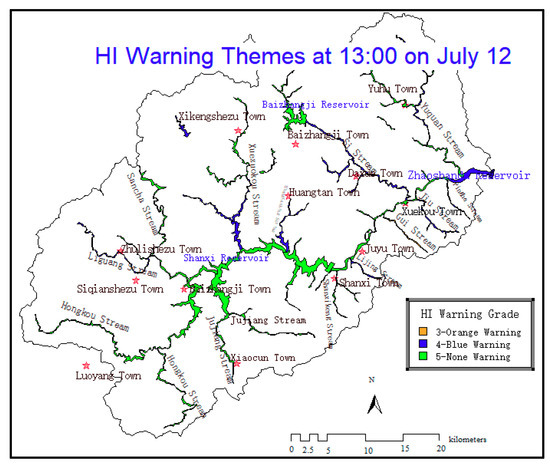
Figure 6.
HI warning thematic maps.
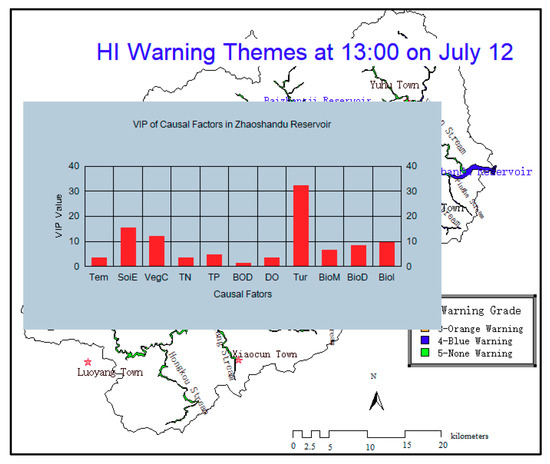
Figure 7.
VIPs of different factors.
4.3. Evaluation of the Three-Phase Method
In this study, we have presented a three-phase approach for understanding the early warning system for river health conditions, assuming that water quality and biotic integrity are fundamental to the health of an entire river system. In relation to model strength, we selected Shanxi Reservoir as the case reach. The root mean square error (RMSE) was utilized to characterize the accuracy of the forecasting model, while the correlation (R2) was used as an indicator to evaluate the performance of the factor identification model. The RMSEs and R2s for 24-h, 48-h, and 72-h prediction and identification, respectively, are shown in Table 2. The results show that the RMSEs varied between 0.031 and 1.32 during the 72-h prediction. The RMSEs of WQI for the three periods were the lowest during each period. This result indicated that the accuracy of the forecasting model was rather good. Additionally, the model for WQI was stronger than those for HI and IBI. However, the results also showed that the RMSEs gradually decreased as the number of time steps ahead increased. In all predictive periods, the correlation R2 was higher than 0.85, which indicated that the correlation between the forecasting factors and the field observation factors was good. In other words, these identified factors sufficiently explained why the health risks or alarm signals were triggered. Based on this correlation, the model performed well and the characteristics made the model very suitable for implementation in practical situations.
Table 2.
Summary performance of the three-phase approach.
However, monitoring, assessment, and forecasting methods need to be developed in the context of an adaptive process to identify values and objectives, to guide management actions and to be responsive to changing user perceptions and values. Johnson et al. (2010) explained that linear models had limitation in modeling most ecosystem responses to stressors [35], and nonlinear models, such as artificial neural networks (ANN) [36], fuzzy logic [37], and the Bayesian method [38], have become more favorable. Therefore, further research could focus on testing nonlinear models with more cases at multiple temporal-spatial scales so that the approach could be further improved.
5. Conclusions and Perspective
Integrating GIS and DSS methods, the RHP-EWS, an integrated system for monitoring, collecting, analyzing, interpreting, and communicating data, and helping managers make timely effective decisions, was developed, which supported the temporal-spatial analysis of natural or anthropogenic threats to river health. RHP-EWS was utilized in treating the Maria super typhoon for managers of the Shanxi River watershed so that spatial distribution and temporal variations of HI, WQI, and IBI were visualized and submitted to managers. According to the alarm signals and decision suggestions from RHP-EWS, the managers were alerted and quickly responded to the risks to take action in advance. The operators of water facilities upgraded the water preprocessing (e.g., improving the filtration capacity and increasing flocculation duration). Meanwhile, to improve the ability of sediment discharge, the command to increase the gate opening degree were sent to dam managers. After these actions were taken, the drinking water supply for Wenzhou citizens was controlled. The tool made it much easier to assess the river health status and forecast its changing trends. It was helpful to notify managers with a timely attention warning and prevent the drinking water quality from being threatened for an effective, rapid response and the first deployed defense against risks. Additionally, the user interface operation was intuitive enough that minimally skilled operators could obtain the necessary information and communicate the important processing information to the managers and users.
However, some issues should receive additional focus. For instance, HI, WQI, and IBI assessment and forecasting should be conducted at different time or spatial scales. Spatial scales are related to three scales: catchment, reach, and segment or section. Temporal scales are classified as short-, medium-, and long-term scales. Therefore, the most suitable scale should be chosen to accurately assess and predict river health. The suitable temporal or spatial scales for a health forecasting model are dictated by the purpose for which the model is to be used. For example, particularly if a trend analysis period is too short, changes in process variables would be too slow to be efficiently detected. In the present study, trend indices were calculated using scaled measurement values to find trend episodes and deviation indices for a short period. Because of the cost of monitoring, biotic indices were only measured at a few sites within a river basin and it is almost impossible to perform continuous long-term measurements for all reaches. Implementing an emergency response plan to issue an early warning before the actual impact is a very difficult task that requires collaborative efforts at all levels of government, including federal, state, county, and local authorities and significant prior planning and practice. For watershed level threats, warning information should be communicated and broadcasted by multilateral agencies to decision-makers at local levels.
Author Contributions
Conceptualization, Y.C. and J.X.; methodology, Y.C., J.X. and W.C.; software, J.X. and C.D.; investigation and data preprocessing, W.C., and C.D.; writing and original draft preparation, Y.C. and J.X.; reviewing, editing and supervision, Z.S.
Funding
This research was funded by Nation Key R & D Program of China (2018YFD0900805), National Natural Science Foundation of China (NSFC) (41471069), and Water Resource Technology Foundation of Zhejiang Province, China (RA1104, RC1527).
Acknowledgments
The authors appreciate help from Xiaojun Wang and Xuanxuan Hu at the Department of Water Resources of Zhejiang Province and Hongbing Wu, Zhichang Xia, and Dong Xu at the Water Resources Conservancy Bureau of Wenzhou for providing us with historical data and arranging the investigation. We also acknowledged Xiaojun Wang and Xuanxuan Hu for arranging the surveying and field sampling.
Conflicts of Interest
The authors declare no conflict of interest.
References
- Vörösmarty, C.J.; McIntyre, P.B.; Gessner, M.O. Global threats to human water security and river biodiversity. Nature 2010, 467, 555–561. [Google Scholar] [CrossRef] [PubMed]
- Estevez, E.; Rodríguez-Castillo, T.; Álvarez-Cabria, M.; Peñas, F.J.; González-Ferreras, A.M.; Lezcano, M.; Barquín, J. Analysis of structural and functional indicators for assessing the health state of mountain streams. Ecol. Indic. 2017, 72, 553–564. [Google Scholar] [CrossRef]
- Guan, B.; An, S.; Gu, B. Assessment of ecosystem health during the past 40 years for Lake Taihu in the Yangtze River Delta, China. Limnology 2011, 12, 47–53. [Google Scholar] [CrossRef]
- Zhang, Q.; Shi, X.; Huang, B.; Yu, D.; Öborn, I.; Blombäck, K.; Wang, H.; Pagella, T.F.; Sinclair, F.L. Surface water quality of factory-based and vegetable-based peri-urban areas in the Yangtze River Delta region, China. Catena 2007, 69, 57–64. [Google Scholar] [CrossRef]
- Dos Santos, D.A.; Molineri, C.; Reynaga, M.C.; Basualdo, C. Which index is the best to assess stream health? Ecol. Indic. 2011, 11, 582–589. [Google Scholar] [CrossRef]
- Woznicki, S.A.; Nejadhashemi, A.P.; Ross, D.M.; Zhang, Z.; Wang, L.; Esfahanian, A.H. Ecohydrological model parameter selection for stream health evaluation. Sci. Total Environ. 2015, 511, 341–353. [Google Scholar] [CrossRef] [PubMed]
- Flint, N.; Rolfe, J.; Jones, C.E.; Sellens, C.; Johnston, N.D.; Ukkola, L. An Ecosystem Health Index for a large and variable river basin: Methodology, challenges and continuous improvement in Queensland’s Fitzroy Basin. Ecol. Indic. 2017, 73, 626–636. [Google Scholar] [CrossRef]
- Wei, M.E.; Zhang, N.; Zhang, Y.; Zheng, B. Integrated assessment of river health based on water quality, aquatic life and physical habitat. J. Environ. Sci. 2009, 21, 1017–1027. [Google Scholar]
- Boulton, A.J. An overview of river health assessment: Philosophies, practice, problems and prognosis. Freshw. Biol. 1999, 41, 469–479. [Google Scholar] [CrossRef]
- Norris, R.H.; Prosser, I.P.; Young, W.J.; Liston, P.; Bauer, N.; Davies, N.; Dyer, F.; Linke, S.; Thoms, M.C. The Assessment of River Condition (ARC): An Audit of the Ecological Condition of Australian Rivers; CSIRO: Canberra, Australia, 2001. [Google Scholar]
- Xia, J.; Lin, J.; Ju, L. Status assessment and causal factors diagnosis of river system health. Afr. J. Agric. Res. 2013, 8, 1817–1827. [Google Scholar]
- Xia, J.; Lin, L.; Lin, J. Development of a GIS-based decision support system for diagnosis of river system health and restoration. Water 2014, 6, 3136–3151. [Google Scholar] [CrossRef]
- Wright, J.F. Development and use of a system for predicting the macroinvertebrate fauna in flowing waters. Aust. J. Ecol. 1995, 20, 181–197. [Google Scholar] [CrossRef]
- Wiederholm, T.; Johnson, K. Monitoring and assessment of lakes and watercourses in Sweeden. In Monitoring Tailor Made II: Information Strategies in Water Management; Ward, R.C., Ottens, J.J., Claessen, F.A.M., Stoks, P.G., Timmerman, J.G., Eds.; Elsevier: New York, NY, USA, 2000; pp. 317–329. [Google Scholar]
- Olsen, A.R.; Sedransk, J.; Edwards, D.; Gotway, C.A.; Liggett, W.; Rathbun, S.; Reckhow, K.H.; Yyoung, L.J. Statistical issues for monitoring ecological and natural resources in the United States. Environ. Monit. Assess. 1999, 54, 1–45. [Google Scholar] [CrossRef]
- Pinto, U.; Maheshwari, B.L. An array of river health assessment approaches and water quality variables have been suggested in the past for assessing the level of river health. Water Res. 2011, 45, 3915–3924. [Google Scholar] [CrossRef]
- Mostert, E. The European Water Framework Directive and water management research. Phys. Chem. Earth Parts A/B/C 2003, 28, 523–527. [Google Scholar] [CrossRef]
- European Policy Office. Fighting to Protect Water. Available online: http://www.wwf.eu/what_we_do/water/ (accessed on 21 August 2019).
- Wright, J.F. An introduction to RIVPACS. In Assessing the Biological Quality of Freshwaters: RIVPACS and Other Techniques; Wright, J.F., Sutcliffe, D.W., Furse, M.T., Eds.; Freshwater Biological Association: Ambleside, UK, 2000; pp. 1–24. [Google Scholar]
- Adams, S.M.; Ham, K.D. Application of biochemical and physiological indicators for assessing recovery of fish populations in a disturbed stream. Environ. Manag. 2011, 47, 1047–1063. [Google Scholar] [CrossRef]
- Agudelo-Vera, C.M.; Blokker, J.M.; Pieterse-Quirijns, E.J. Early warning system to forecasting maximum temperature in drinking water distribution system. J. Water Supply Res. Technol. AQUA 2015, 64, 496–503. [Google Scholar] [CrossRef]
- Karr, J.R. Defining and measuring river health. Freshw. Biol. 1999, 41, 221–234. [Google Scholar] [CrossRef]
- Norris, R.H.; Thoms, M.C. What is river health? Freshw. Biol. 1999, 41, 197–209. [Google Scholar] [CrossRef]
- Bunn, S.E.; Abal, E.G.; Smith, M.J.; Choy, S.C.; Fellows, C.S.; Harch, B.D.; Kennard, M.J.; Sheldon, F. Integration of science and monitoring of river ecosystem health to guide investments in catchment protection and rehabilitation. Freshw. Biol. 2010, 55, 223–240. [Google Scholar] [CrossRef]
- Xia, J.; Chen, Y.; Zhou, Z.; Zhang, Q.; Peng, S.; Wang, J.; Yu, G. Review of mechanism and quantifying methods of river system connectivity. Adv. Water Sci. 2017, 28, 780–787. [Google Scholar]
- Abouali, M.; Nejadhashemi, A.P.; Daneshvar, F.; Woznicki, S.A. Two-phase approach to improve stream health modeling. Ecol. Inform. 2016, 34, 13–21. [Google Scholar] [CrossRef]
- Meyer, J.L. Stream health: Incorporating the human dimension to advance stream ecology. J. N. Am. Benthol. Soc. 1997, 16, 439–447. [Google Scholar] [CrossRef]
- Walsh, C.J.; Booth, D.B.; Burns, M.J.; Fletcher, T.D.; Hale, R.L.; Hoang, L.N.; Livingston, G.; Rippy, M.A.; Roy, A.H.; Scoggins, M.; et al. Principles for urban storm water management to protect stream ecosystems. Freshw. Sci. 2016, 35, 398–411. [Google Scholar] [CrossRef]
- Tyagi, S.; Sharma, B.; Singh, P.; Dobhal, R. Water quality assessment in terms of water quality index. Am. J. Water Resour. 2013, 1, 34–38. [Google Scholar]
- Karr, J.R. Biological integrity: A long-neglected aspect of water resource management. Ecol. Appl. 1991, 1, 66–84. [Google Scholar] [CrossRef] [PubMed]
- Herman, M.R.; Nejadhashemi, A.P. A review of macroinvertebrate- and fish-based stream health indices. Ecohydrol. Hydrobiol. 2015, 15, 53–67. [Google Scholar] [CrossRef]
- Merriam, E.R.; Petty, J.T.; Strager, M.P.; Maxwell, A.E.; Ziemkiewicz, P.F. Landscapebased cumulative effects models for predicting stream response to mountaintop mining in multistressor Appalachian watersheds. Freshw. Sci. 2015, 34, 1006–1019. [Google Scholar] [CrossRef]
- Wold, H. Soft modelling by latent variables; the nonlinear iterative partial least squares approach. In Perspectives in Probability and Statistics; Barlett, M.S., Gani, J., Eds.; Academic Press: Cambridge, MA, USA, 1975; pp. 117–142. [Google Scholar]
- Carrascal, L.M.; Galván, I.; Gordo, O. Partial least squares regression as an alternative to current regression methods used in ecology. Oikos 2009, 118, 681–690. [Google Scholar] [CrossRef]
- Johnson, L.B.; Host, G.E. Recent developments in landscape approaches for the study of aquatic ecosystems. J. N. Am. Benthol. Soc. 2010, 29, 41–66. [Google Scholar] [CrossRef]
- Mathon, B.R.; Rizzo, D.M.; Kline, M.; Alexander, G.; Fiske, S.; Langdon, R.; Stevens, L. Assessing linkages in stream habitat, geomorphic condition, and biological integrity using a generalized regression neural network. J. Am. Water Resour. Assoc. (JAWRA) 2013, 4, 415–430. [Google Scholar] [CrossRef]
- Woznicki, S.A.; Nejadhashemi, A.P.; Abouali, M.; Herman, M.R.; Esfahanian, E.; Hamaamin, Y.A.; Zhang, Z. Ecohydrologic modeling for large-scale environmental impact assessment. Sci. Total Environ. 2016, 543, 274–286. [Google Scholar] [CrossRef] [PubMed]
- Wellen, C.; Arhonditsis, G.B.; Long, T.; Boyd, D. Quantifying the uncertainty of nonpoint source attribution in distributed water quality models: A Bayesian assessment of SWAT’s sediment export predictions. J. Hydrol. 2014, 519, 3353–3368. [Google Scholar] [CrossRef]


© 2019 by the authors. Licensee MDPI, Basel, Switzerland. This article is an open access article distributed under the terms and conditions of the Creative Commons Attribution (CC BY) license (http://creativecommons.org/licenses/by/4.0/).