Abstract
We compared the efficiency droop of InGaN multiple-quantum-well (MQW) blue light-emitting diode (LED) structures grown on silicon(111) and c-plane sapphire substrates and analyzed the efficiency droop characteristics using the rate equation model with reduced effective active volume. The efficiency droop of the LED sample on silicon was observed to be reduced considerably compared with that of the identical LED sample on sapphire substrates. When the measured external quantum efficiency was fitted with the rate equation model, the effective active volume of the MQW on silicon was found to be ~1.45 times larger than that of the MQW on sapphire. The lower efficiency droop in the LED on silicon could be attributed to its larger effective active volume compared with the LED on sapphire. The simulation results showed that the effective active volume decreased as the internal electric fields increased, as a result of the reduced overlap of the electron and hole distribution inside the quantum well and the inhomogeneous carrier distribution in the MQWs. The difference in the internal electric field of the MQW between the LED on silicon and sapphire could be a major reason for the difference in the effective active volume, and consequently, the efficiency droop.
1. Introduction
Over the last two decades, there has been remarkable progress in the development of GaN-based light-emitting diodes (LEDs). Owing to its high efficiency and eco-friendliness, LED-based solid-state lighting has been rapidly replacing conventional light bulbs in general lighting and display applications [1,2,3,4,5,6]. However, the high cost of LED illumination sources is still a hindering factor for increasing their market penetration rate in general lighting applications. One prominent way of lowering the production cost of LEDs is to utilize silicon-based technologies. The growth of InGaN/GaN layers on silicon substrates has attracted great interest because of the low substrate cost and the availability of large size wafers. High-performance GaN-based blue LEDs on silicon have been achieved by overcoming the technological difficulty in their growth caused by the large mismatch in the lattice constant and the thermal expansion coefficients between silicon and GaN [7,8,9,10,11].
Recently, one of the authors of this paper reported the experimental results of the comparison between the device characteristics of InGaN/GaN blue LEDs grown on silicon and sapphire substrates [12]. The efficiency droop of the LED sample on silicon substrates was found to be significantly lower than that of the identically grown LED on sapphire substrates. The reduced efficiency droop of the LED on silicon was attributed to its lower internal electric field [12]. It was shown that internal electric fields of InGaN multiple-quantum-wells (MQWs) on silicon was reduced by ~40% compared to that of the MQWs on sapphire. The polarization-induced internal electric field has been known to increase the electron leakage from MQWs to p-GaN, which could aggravate the efficiency droop problem [13,14,15]. However, evidence of the polarization-enhanced electron leakage was not observed clearly by either experiments or simulations. More specifically, the underlying mechanism for the reduced efficiency droop of the LED on silicon was not clearly identified although, in a previous study, the efficiency droop was shown to be caused by the internal electric field [12].
It is worth mentioning that as the internal field strength increases, the separation of electrons and holes in a quantum well (QW) increases and the carrier distribution in MQWs becomes increasingly inhomogeneous. This results in the reduction of the effective active volume, which contributes to the radiative recombination of electrons and holes. It has been reported that a reduction in the effective active volume of InGaN MQWs leads to a substantial increase in the efficiency droop [16,17,18,19,20]. Therefore, the influence of the internal electric field on the efficiency droop is expected to be explained by the reduced effective active volume due to the increasing internal field strength.
In this paper, we use the rate equation model with the reduced effective active region to interpret the difference in the efficiency droops of the LED structures grown on silicon and sapphire substrates. The ratio of the effective active volume to the physical volume of QWs is determined by fitting the measured external quantum efficiency (EQE) curve of LEDs on silicon and sapphire with the rate equation model. Then, the differences in the degree of efficiency droop and the strength of internal electric fields between LEDs on silicon and sapphire are interpreted by the difference in the effective active volume of InGaN MQWs using modeling simulations. It is demonstrated that, as the strength of the internal electric fields increases, the effective active volume reduces and the efficiency droop increases, revealing the reason for the reduced efficiency droop of LEDs on silicon compared to the LED on sapphire.
In Section 2 of this paper, the growth, fabrication, and characterization of InGaN/GaN LED structures on silicon and sapphire substrates are described. In Section 3, we present the rate equation modeling of the internal quantum efficiency (IQE) with reduced effective active volume and the simulation of the carrier and radiative recombination distribution in QWs. In Section 4, the relation between the reduced effective active volume and the efficiency droop is discussed through the analysis of internal electric fields and carrier distribution in QWs.
2. Experiments
2.1. Sample Growth and Fabrication
The epitaxial layers were grown on c-plane sapphire and silicon(111) substrates using metal-organic chemical vapor deposition. Figure 1 shows schematic diagrams of the layer structures grown on the sapphire and Si(111) substrates. For the growth on silicon substrates, many interlayers were employed between silicon and n-GaN to overcome the lattice and the thermal mismatches and to improve the efficiency of the LED on silicon. The GaN template on Si consisted of an AlN seed layer, an AlGaN buffer layer, a SiN masking layer, an undoped GaN coalescence layer, an AlN interlayer, and an n-doped GaN layer. The crystal qualities were compared using X-ray diffractometry, and threading dislocation density (TDD) measurements. The full widths at half maximum of the X-ray omega rocking curves were 350 and 320 arcsec for GaN/Si and GaN/sapphire, respectively. The TDDs of the GaN layers on sapphire and silicon were estimated to be 3.8 × 10⁸ and 5.3 × 108 cm−2, respectively. The X-ray and TDD data imply that the crystallinity of the GaN films on silicon is slightly worse than that of the films grown on sapphire. Here, we label the LED on sapphire and the LED on silicon as Sample A and Sample B, respectively.
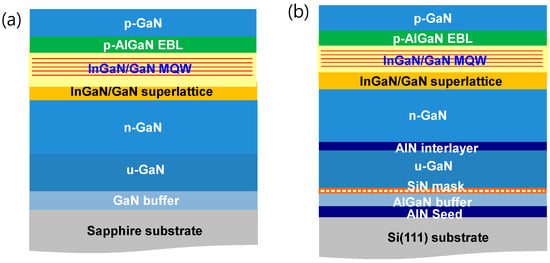
Figure 1.
Schematic cross-sectional diagram of the layer structures grown on (a) c-plane sapphire substrates (Sample A) and (b) silicon(111) substrates (Sample B).
Next, InGaN/GaN LED epitaxial layers were grown on each template of sapphire and silicon. The layer structures on the two templates are identical. The layers were composed of an n-GaN layer, 20 pairs of InGaN/GaN short-period superlattice layers for strain relaxation, five periods of In0.015Ga0.085N/GaN MQW layers, an AlGaN electron blocking layer, and a p-GaN layer. The thicknesses of the InGaN QW and the GaN barrier are 3 and 8 nm, respectively. After the epitaxial growth, LED chips were fabricated as vertical current injection structures with dimensions of 1 mm × 1 mm. The fabricated LED chips were then encapsulated with epoxy resin and packaged as a surface-mount device. The packaged LED samples were soldered on a thick copper block and the temperature was controlled by a thermo-electric cooler (TEC).
2.2. Electroluminescence Efficiency Measurement
For the electroluminescence measurements, the LED sample was placed inside an integrated sphere. The temperature of the sample was maintained at 25 °C by the TEC system. Pulsed currents with a pulse width of 0.5 ms and duty cycle of 1% were applied to the LED sample to reduce self-heating effects, and the device characteristics of the LEDs were measured. From the spectral measurements, the peak wavelength was observed to be ~445 nm at 350 mA for both Sample A, and Sample B. Figure 2 presents the EQE versus current relation (EQE curve) for the measured LED samples. The peak EQEs of Sample A and Sample B were 0.582 and 0.524, respectively. The higher peak EQE for Sample A resulted from its better crystal quality, as one can see from the TDD and X-ray measurement results. For relatively low currents <250 mA, the EQE of Sample A was higher than that of Sample B. By contrast, for currents >250 mA, the EQE of Sample B was higher than that of Sample A. Consequently, the degree of efficiency droop of Sample B was considerably lower than that of Sample A.
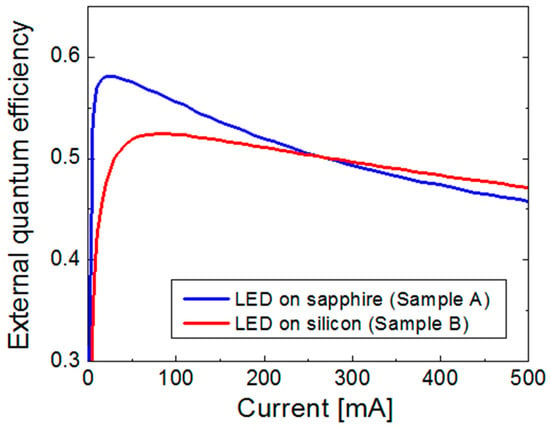
Figure 2.
External quantum efficiency (EQE) versus current relation of the LED on sapphire (Sample A, blue line) and silicon (Sample B, red line) substrates.
The internal electric field of InGaN/GaN QWs was investigated based on the reverse-biased electro-reflectance (ER) measurements [21,22,23]. The internal electric field was determined to be 1.50 MV/cm for Sample A and 0.92 MW/cm for Sample B [12]. The lower field strength for the QWs on silicon could be attributed to the reduced mismatch of the lattice constant between InGaN and GaN layers grown on silicon substrates compared with those grown on sapphire substrates. This interpretation is consistent with the previous strain measurement results of MQWs on sapphire and silicon by micro-Raman spectroscopy and high-resolution transmission electron microscopy [24], which showed that the lattice mismatch between InGaN and GaN layers could be lower due to the larger lattice constant of GaN on silicon substrates. This difference in the internal electric field was regarded as a major reason for the difference in the efficiency droop of EQE between Sample A and Sample B [12].
3. Results
3.1. Rate Equation Modeling and Effective Active Volume
In the ABC rate equation model, the relation between the current, I and carrier density, N can be written as [15,16,17,18]
where q is the elementary charge, and Veff is the effective active volume of QWs. The parameters, A, B, and C represent the coefficient of Shockley–Read–Hall (SRH) recombination, bimolecular radiative recombination, and Auger recombination, respectively. Veff is the active volume that actually contributes to the light emission in QWs, which is believed to be smaller than the physical volume of QWs, V0. Here, we introduce a scaling parameter, k, which represents the ratio of the effective active volume (Veff) to the physical active volume (V0), is defined as
The IQE of LEDs is expressed as
Using Equations (1)–(3), the IQE versus current relation (IQE curve) can be obtained. We perform the fitting of the measured EQE curves of the LEDs on silicon and sapphire using Equations (1)–(3). According to References [25,26], for a given EQE versus current data, the IQE fit curve could be uniquely determined for any set of coefficients A, B, C, and k parameter. That is, the IQE fit curves are identical and hence the same peak IQE is obtained irrespective of the choice of A, B, C, and k parameters. Therefore, the uncertainty of the fit curves and IQE values for different sets of fit parameters could be negligible. Here, k and A are used as fitting parameters for given B and C values. The B coefficient is fixed at 1 × 10⁻¹¹ cm3/s, while the C coefficient is varied from 1 × 10⁻³¹ to 1 × 10⁻³⁰ cm6/s considering the uncertainty of the reported C coefficient values [27,28,29,30,31]. Because the LEDs on silicon and sapphire have the same active layer structures and indium composition in the QWs, the B and C coefficients are believed to be the same. However, k and A can be different because of the difference in the crystal quality and effective active volume in MQWs.
Figure 3 shows semi-log plots of the IQE fitting curves for LEDs on silicon and sapphire when C is 5 × 10⁻³¹ cm6/s. The IQE curves for both samples fit reasonably well with the measured EQE data. The deviation of measured data and fit curves at low currents (<10 mA) are due to the measurement uncertainty of low light output power. The nearly perfect agreement at high currents (>100 mA) implies that the leakage current can be negligible in our samples. The best fits were obtained when k and A were 0.085 and 6.0 × 10⁶ s−1, respectively, for Sample A and 0.125 and 1.15 × 10⁷ s−1, respectively, for Sample B. The higher value of the coefficient A for Sample B indicates that it had a higher nonradiative recombination rate owing to the poorer crystal quality. The peak IQEs were obtained to be 0.743 and 0.676 for Sample A and Sample B, respectively. By comparing the measured EQE and the fitted IQE values, the light extraction efficiencies (LEEs) were obtained to be 0.787 and 0.779 for the LED on sapphire and silicon, respectively. The almost equal LEE values are reasonable considering that the chip and package structures of the two LED samples are identical.
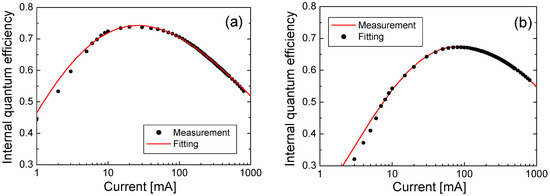
Figure 3.
Measured LED efficiency (solid dots) and theoretical fit (red lines) to obtain the internal quantum efficiency (IQE) as a function of the injection current. (a) LED on sapphire (Sample A) and (b) LED on silicon (Sample B).
Because the k value obtained from the IQE fitting may vary for different C coefficients, we performed the fitting with C varying from 1 × 10⁻³¹ to 1 × 10⁻³⁰ cm6/s. For all of the C coefficient values, almost the same fitting results as in Figure 3 were obtained. Figure 4a shows the k value as a function of the C coefficient. As shown in the figure, k increases with increasing C, implying that, as C decreases, a smaller volume of QWs is effectively used as a light-emitting region. For all values of C, the k of Sample B is higher than that of Sample A, indicating a larger effective active volume of the latter, which resulted in a lower efficiency droop, as shown in Figure 2. As mentioned before, we obtained the same IQE curves for the different values of C and k parameters in Figure 4a.
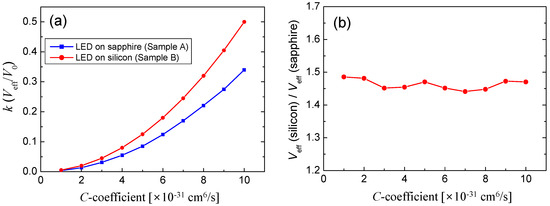
Figure 4.
(a) Ratio of the effective active volume to the physical volume of MQWs (k) as a function of the C coefficient for Sample A and Sample B. (b) Ratio of the effective volume of Sample B to that of Sample A as a function of the C coefficient.
Figure 4b shows plots of the ratio of k of Sample B to the k of Sample A as a function of C. More specifically, it shows the relative ratio of the effective active volume between the two LED samples. With k values vary significantly with the used C coefficient, the ratio of the effective active volume varies in the range from 1.43 to 1.48. That is, the effective active volume of Sample B is ~1.45 times larger than that of Sample A irrespective of the choice of C.
One may perform the IQE fitting with a fixed k value using the A and C coefficients as the fitting parameters. When the effective active volume was assumed to be the same as the physical volume (k = 1), the coefficient C was obtained to be 1.703 × 10⁻³⁰ cm−3 for Sample A and 1.415 × 10⁻³⁰ cm−3 for Sample B. Then, the ratio of C between two samples is 1.204. This ratio was almost the same for other choices of k values. Since the QWs grown on sapphire and silicon substrates are identical, having the same indium composition and thickness, such a large difference in the coefficient C between LED on sapphire and silicon would be unreasonable. Therefore, we believe that it would be more reasonable approach in the IQE fitting to assume that the coefficient C is the same, whereas k is different for the two LED structures.
3.2. Simulation of Carrier and Recombination Rate Distribution
The difference in the effective active volume between the two samples could be related to their difference in the internal electric field of the QWs. In the previous study, based on reverse-biased electro-reflectance measurements, the internal electric fields of the InGaN/GaN QWs on sapphire and silicon substrates were determined to be 1.50 MV/cm and 0.92 MW/cm, respectively [12]. Figure 5 shows the simulated energy band diagram and electron/hole concentration distribution in a QW corresponding to the QW of the sapphire and silicon substrates. For the simulation, we employed the simulation software, APSYS [32]. APSYS solves the QW band structures, the drift, and diffusion equations, and the carrier recombination rates self-consistently, and it has been widely employed for simulating the device characteristics of LED structures. The internal electric field in the QW separates the spatial distribution of electron and hole from each other. Therefore, electrons and holes are more separated in the QW on sapphire substrates, which have larger internal electric fields, as indicated in Figure 5. The differences of the peak carrier concentration between electrons and holes are 1.98 nm for the QW on sapphire and 1.40 nm for the QW on silicon.
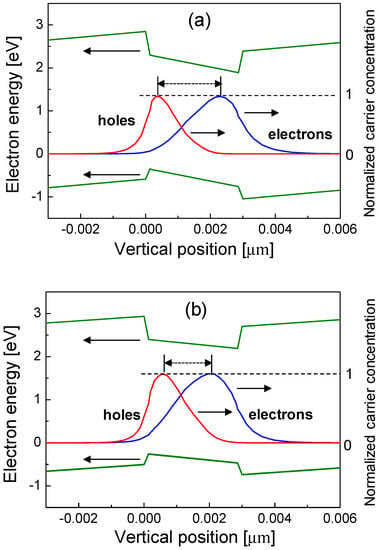
Figure 5.
Simulated energy band diagram and electron/hole concentration profile in an InGaN/GaN QW. (a) QW on sapphire substrates with internal electric field of 1.50 MV/cm. (b) QW on silicon substrates with an internal electric field of 0.92 MV/cm. The differences in the position of the peak carrier concentration are indicated as dotted arrows.
The larger is the separation of the electrons and holes; the smaller is the overlapped region of the electron and hole concentration. This means that the carrier recombination region can be reduced as the internal electric field increases. Figure 6a shows the simulated distribution of radiative recombination rates for the QW on silicon and sapphire along with the recombination rate of the QW without a polarization-induced electric field. The radiative recombination rate was also simulated using the APSYS program. In Figure 6a, the calculated radiative recombination rate was normalized to the peak for each case. With increasing internal electric field, the peak position shifts, and the recombination distribution narrows.
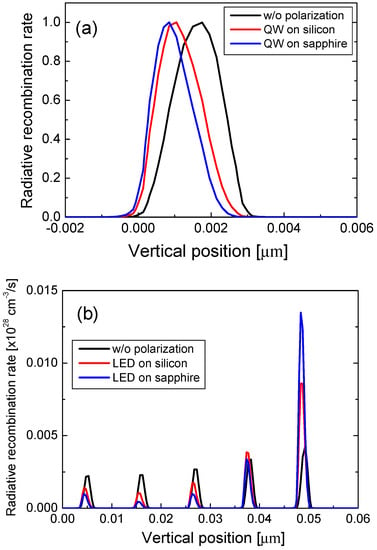
Figure 6.
(a) Normalized radiative recombination rate profile for a QW without an internal electric field (black line), a QW on silicon (red line), and a QW on sapphire (blue line). (b) Radiative recombination rate profile for InGaN/GaN MQWs without an internal electric field (black line), MQWs on silicon (red line), and MQWs on sapphire (blue line).
Figure 6b depicts the distribution of the radiative recombination rate in five QWs for three cases of the internal electric field: without polarization, MQWs on silicon, and MQWs on sapphire. As the internal electric field increases, the radiative recombination rate in the MQWs becomes increasingly inhomogeneous, which results mainly from the restriction of hole transport from the p-side to the n-side QWs with increasing internal electric field [33,34,35]. For the QW without the internal electric field, the radiative recombination rate is reasonably uniform for five QWs. By contrast, for the QW on sapphire, the radiative recombination mostly occurs at the QW adjacent to the p-side layers. For the QW on silicon, although the radiative recombination rate decreases significantly from the p-side to the n-side QWs, the radiative recombination distribution of the MQWs on silicon is more homogeneous than that of the MQWs on sapphire. Therefore, the inhomogeneous recombination distribution in the MQWs could also partly explain the larger effective active volume of Sample B compared with that of Sample A.
4. Discussion
In this section, we quantify the ratio of the effective active volume as a result of the carrier distribution in Figure 6 and compare it with the result of rate equation modeling in Figure 4. The effective width of the radiative recombination deff is determined as the spatially integrated radiative recombination rate divided by half the peak radiative recombination rate:
where Rrad(y) is the radiative recombination rate distribution and y is the vertical position across the QW layer. Using Equation (4), deff of the QW without an electric field, that of the QW on silicon, and that of the QW on sapphire were calculated to be 3.09, 2.82, and 2.45 nm, respectively. That is, deff of the QW without electric field was slightly larger than the physical width of the QW. deff values for silicon and sapphire are smaller than the QW width, and deff of the QW on silicon is 1.15 times larger than that on sapphire.
The effective active volume of the QWs on silicon was estimated to be larger than that of the QWs on sapphire by ~1.45 times in Figure 4b; therefore, the reduced radiative recombination width due to the separation of electrons and holes could only partly account for the reduced effective active volume. The remaining of the reduced effective active volume could be explained by the inhomogeneous distribution of carriers between QWs.
To quantify the effective active volume in the MQW region, we define the effective number of QWs as
where is the radiative recombination rate distribution in the i-th QW and N is the number of QWs which is 5 in our LED samples. is the radiative recombination rate distribution in the p-side QW that has the highest recombination rate between the QWs. For MQWs with perfectly uniform radiative recombination distribution, Neff is 5. If the radiative recombination occurs only at the p-side QW, Neff is 1. That is, Neff varies from 1 to 5 depending on the radiative recombination distribution in the MQWs. Neff was calculated to be 3.51 for the MQW without an internal field, 1.92 for the MQW on silicon, and 1.45 for the MQW on sapphire. The ratio of Neff for the MQW on silicon and sapphire is 1.32, implying that the effective active MQW width of the LED on silicon is 1.32 times larger than that of the LED on sapphire.
Recalling that the ratio of the effective active volume is ~1.45, as shown in Figure 4, and the ratio of the effective QW width (deff) is 1.15, as shown in Figure 6a, the ratio of Neff could explain the remaining ~30% increase in the effective active volume for the LED on silicon. That is, the reduced effective active volume could be attributed to the combined effect of both the reduced active width of a single QW and the reduced effective number of QWs in MQW layers as a result of the internal electric field.
In addition to the internal electric field, the fluctuation of the indium composition inside InGaN QWs may significantly influence the reduction in the effective active volume. However, we believe that the degree of indium fluctuation between the MQWs on silicon and sapphire is not much different, because the structures of MQWs on silicon and sapphire are identical and both MQW layers were grown under the same growth conditions. Therefore, the difference in the effective active volume of MQWs on silicon and sapphire is mainly attributed to the large difference in internal electric fields, which leads to the reduction in efficiency droop for Sample B. The internal electric field in MQWs on silicon substrate could be further reduced by the strain control of the buffer layers, leading to even more reduced efficiency droop.
5. Conclusions
In this work, InGaN/GaN MQW blue LEDs were fabricated on c-plane sapphire and silicon(111) substrates, and their efficiency droop characteristics were compared and analyzed. The efficiency droop of the LED on silicon was considerably lower than that of the LED on sapphire. The IQE of the measured LEDs were analyzed using a rate equation model with reduced effective active volume. It was found that the effective active volume of the MQW on silicon was ~1.45 times larger than that of the MQW on sapphire. The larger effective active volume in the MQW on silicon could be related to its lower polarization-induced internal electric field. Numerical simulations showed that the internal electric field could reduce the effective active volume significantly as a result of the reduced overlap of electron and hole distributions inside a QW and the inhomogeneous carrier distribution in the MQWs. It was demonstrated that the reduced effective QW width of a single QW and the reduced effective number of QWs in the MQW layers could explain the respective 15% and 30% increase in the effective active volume of the LED on silicon compared to that of the LED on sapphire. Consequently, the reduced efficiency droop of the LED on silicon could be attributed to its relatively larger effective active volume resulting from the lower internal electric field compared with the case of the LED on sapphire. Owing to its greatly reduced efficiency droop, the GaN-based LED grown on silicon substrates is expected to provide a great cost-effective solution for high-efficiency illumination applications.
Author Contributions
Conceptualization—H.-Y.R.; methodology—G.-H.R.; software—H.-Y.R.; formal analysis—C.O.; investigation—H.-Y.R., G.-H.R. and C.O.; writing—original draft preparation—H.-Y.R.; writing—review and editing—H.-Y.R.; supervision—H.-Y.R.; project administration—H.-Y.R.; funding acquisition—H.-Y.R.
Funding
This work was supported by the National Research Foundation (NRF) of Korea funded by the Ministry of Education (2016R1D1A1B03932092) and the Ministry of Science and ICT (2015M3A7B7045490, 2019R1A2C1010160).
Acknowledgments
The authors are grateful to K.S. Jeon at the LG Electronics Advanced Research Institute for the fabrication of the LED samples used in this work.
Conflicts of Interest
The authors declare no conflict of interest.
References
- Akasaki, I. Nobel lecture: Fascinated journeys into blue light. Rev. Mod. Phys. 2015, 87, 1119–1131. [Google Scholar] [CrossRef]
- Nakamura, S. Nobel lecture: Background story of the invention of efficient blue InGaN light emitting diodes. Rev. Mod. Phys. 2015, 87, 1139. [Google Scholar] [CrossRef]
- Pust, P.; Schmidt, P.J.; Schnick, W.A. Revolution in lighting. Nat. Mater. 2015, 14, 454–458. [Google Scholar] [CrossRef] [PubMed]
- Weisbuch, C. The efficiency challenge of nitride light-emitting diodes for lighting. Phys. Status Solidi A 2015, 212, 899–913. [Google Scholar] [CrossRef]
- Cho, J.; Park, J.H.; Kim, J.K.; Schubert, E.F. White light-emitting diodes: History, progress, and future. Laser Photonics Rev. 2017, 11, 1600147. [Google Scholar] [CrossRef]
- Zhao, Y.; Fu, H.; Wang, G.T.; Nakamura, S. Toward ultimate efficiency: progress and prospects on planar and 3D nanostructured nonpolar and semipolar InGaN light-emitting diodes. Adv. Opt. Photonics 2018, 10, 246–308. [Google Scholar] [CrossRef]
- Kim, J.Y.; Tak, Y.; Hong, H.G.; Chae, S.; Lee, J.W.; Choi, H.; Kim, J.K.; Min, B.; Park, Y.; Chung, U.I.; et al. Highly efficiency InGaN/GaN blue LEDs on large diameter Si(111) substrates comparable to those on sapphire. Proc. SPIE 2011, 8123, 81230A. [Google Scholar]
- Li, Z.Y.; Lee, C.Y.; Lin, D.W.; Lin, B.C.; Shen, K.C.; Chiu, C.H.; Tu, P.M.; Kuo, H.C.; Uen, W.Y.; Horng, R.H.; et al. High-efficiency and crack-free InGaN-based LEDs on a 6-inch Si(111) substrate with a composite buffer layer structure and quaternary superlattices electron-blocking layers. IEEE J. Quantum Electron. 2014, 50, 354–363. [Google Scholar]
- Zhang, L.; Tan, W.S.; Westwater, S.; Pujol, A.; Pinos, A.; Mezouari, S.; Stribley, K.; Whiteman, J.; Shannon, J.; Strickland, K. High brightness GaN-on-Si based blue LEDs grown on 150 mm Si substrates using thin buffer layer technology. J. Electron Dev. Soc. 2015, 3, 457–462. [Google Scholar] [CrossRef]
- Wang, W.; Lin, Y.; Li, Y.; Li, X.; Huang, L.; Zheng, Y.; Lin, Z.; Wang, H.; Li, G. High-efficiency vertical-structure GaN-based light-emitting diodes on Si substrates. J. Mater. Chem. C 2018, 6, 1642–1650. [Google Scholar] [CrossRef]
- Lin, T.; Zhou, Z.Y.; Huang, Y.M.; Yang, K.; Zhang, B.J.; Feng, Z.C. Strain-controlled recombination in InGaN/GaN multiple quantum wells on silicon substrates. Nanoscale Res. Lett. 2018, 13, 243. [Google Scholar] [CrossRef] [PubMed]
- Ryu, H.Y.; Jeon, K.S.; Kang, M.G.; Yuh, H.K.; Choi, Y.H.; Lee, J.S. A comparative study of efficiency droop and internal electric field for InGaN blue light-emitting diodes on silicon and sapphire substrates. Sci. Rep. 2017, 7, 44814. [Google Scholar] [CrossRef] [PubMed]
- Kim, M.H.; Schubert, M.F.; Dai, Q.; Kim, J.K.; Schubert, E.F.; Piprek, J.; Park, Y. Origin of efficiency droop in GaN-based light-emitting diodes. Appl. Phys. Lett. 2007, 91, 183507. [Google Scholar] [CrossRef]
- Rozhansky, I.V.; Zakheim, D.A. Analysis of processes limiting quantum efficiency of AlGaInN LEDs at high pumping. Phys. Status Solidi A 2007, 204, 227–230. [Google Scholar] [CrossRef]
- Piprek, J. Efficiency droop in nitride-based light-emitting diodes. Phys. Status Solidi A 2010, 207, 2217–2225. [Google Scholar] [CrossRef]
- Shim, J.H.; Kim, H.; Shin, D.S.; Ryu, H.Y. An explanation of efficiency droop in InGaN-based light emitting diodes: Saturated radiative recombination rate at randomly distributed In-rich active area. J. Korean Phys. Soc. 2011, 58, 503–508. [Google Scholar] [CrossRef]
- Ryu, H.Y.; Shin, D.S.; Shim, J.I. Analysis of efficiency droop in nitride light-emitting diodes by the reduced effective volume of InGaN active material. Appl. Phys. Lett. 2012, 100, 131109. [Google Scholar] [CrossRef]
- Li, H.; Li, P.; Kang, J.; Li, Z.; Zhang, Y.; Liang, M.; Li, Z.; Li, J.; Yi, Z.; Wang, G. Analysis model for efficiency droop of InGaN light-emitting diodes based on reduced effective volume of active region by carrier localization. Appl. Phys. Express 2013, 6, 092101. [Google Scholar] [CrossRef]
- Ryu, H.Y.; Ryu, G.H.; Choi, Y.H.; Ma, B. Modeling and simulation of efficiency droop in GaN-based blue light-emitting diodes incorporating the effect of reduced active volume of InGaN quantum wells. Curr. Appl. Phys. 2017, 17, 1298–1302. [Google Scholar] [CrossRef]
- Li, P.; Zhao, Y.; Yi, X.; Li, H. Effects of a reduced effective active region volume on wavelength-dependent efficiency droop of InGaN-based light-emitting diodes. Appl. Sci. 2018, 8, 2138. [Google Scholar] [CrossRef]
- Kaplar, R.J.; Kurtz, S.R.; Koleske, D.D.; Fischer, A.J. Electroreflectance studies of Stark shifts and polarization-induced electric fields in InGaN/GaN single quantum wells. J. Appl. Phys. 2004, 95, 4905–4913. [Google Scholar] [CrossRef]
- Shen, H.; Wraback, M.; Zhong, H.; Tyagi, A.; DenBaars, S.P.; Nakamura, S.; Speck, J.S. Determination of polarization field in a semipolar (1122) InGaN/GaN single quantum well using Franz-Keldysh oscillations in electroreflectance. Appl. Phys. Lett. 2009, 94, 241906. [Google Scholar] [CrossRef]
- Park, S.I.; Lee, J.I.; Jang, D.H.; Kim, H.S.; Shin, D.S.; Ryu, H.Y.; Shim, J.I. Measurement of internal electric field in GaN-based light-emitting diodes. IEEE J. Quantum Electron. 2012, 48, 500–506. [Google Scholar] [CrossRef]
- Jeon, K.S.; Sung, J.H.; Lee, M.W.; Song, H.Y.; Lee, E.A.; Kim, S.O.; Choi, H.J.; Shin, H.Y.; Park, W.H.; Jang, Y.I.; et al. Comparison of strain in GaN-based blue light-emitting diode grown on silicon(111) and sapphire substrates. J. Nanosci. Nanotechnol. 2015, 15, 5264–5266. [Google Scholar] [CrossRef] [PubMed]
- Ryu, H.Y.; Kim, H.S.; Shim, J.I. Rate equation analysis of efficiency droop in InGaN light-emitting diode. Appl. Phys. Lett. 2009, 95, 081114. [Google Scholar] [CrossRef]
- Dai, Q.; Shan, Q.; Wang, J.; Chhajed, S.; Cho, J.; Schubert, E.F.; Crawford, M.H.; Koleske, D.D.; Kim, M.H.; Park, Y.J. Carrier recombination mechanisms and efficiency droop in GaInN/GaN light-emitting diodes. Appl. Phys. Lett. 2010, 97, 133507. [Google Scholar] [CrossRef]
- Avrutin, V.; Hafiz, S.A.; Zhang, F.; Özgür, Ü.; Morkoc, H.; Matulionis, A. InGaN light-emitting diodes: Efficiency-limiting processes at high injection. J. Vac. Sci. Technol. A 2013, 31, 050809. [Google Scholar] [CrossRef]
- Kioupakis, E.; Yan, Q.; Steiauf, D.; Van de Walle, C.G. Temperature and carrier-density dependence of Auger and radiative recombination in nitride optoelectronic devices. New J. Phys. 2013, 15, 125006. [Google Scholar] [CrossRef]
- Wang, L.; Meng, X.; Song, J.H.; Kim, T.S.; Lim, S.Y.; Hao, Z.B.; Sun, C.Z.; Han, Y.J.; Xiong, B.; Wang, J.; et al. A method to obtain Auger recombination coefficient in an InGaN-based blue lgiht-emitting diode. Chin. Phys. Lett. 2017, 34, 017301. [Google Scholar] [CrossRef]
- Reklaitis, I.; Krencius, L.; Malinauskas, T.; Karpov, S.Y.; Lugauer, H.J.; Pietzonka, I.; Strassburg, M.; Vitta, P.; Tomasiunas, R. Time of carrier escape and recombination coefficients in InGaN quantum-well active regions of blue, cyan, and green light-emitting diodes. Semicond. Sci. Technol. 2019, 34, 015007. [Google Scholar] [CrossRef]
- Pham, Q.U.; Chen, J.C.; Nguyen, H.B. Three-dimensional numerical study on the efficiency droop in InGaN/GaN light-emitting diodes. IEEE Photonisc J. 2019, 11, 8200417. [Google Scholar] [CrossRef]
- APSYS by Crosslight Software, Burnaby, Canada. Available online: http://www.crosslight.com/products/apsys.shtml (accessed on 3 October 2019).
- David, A.; Grundmann, M.J.; Kaeding, J.F.; Gardner, N.F.; Mihopoulos, T.G.; Krames, M.R. Carrier distribution in (0001) InGaN/GaN multiple quantum well light-emitting diodes. Appl. Phys. Lett. 2008, 92, 053502. [Google Scholar] [CrossRef]
- Cheng, L.; Chen, H.; Wu, S. Improving hole injection and carrier distribution in InGaN light-emitting diodes by removing the electron blocking layer and including a unique last quantum barrier. J. Appl. Phys. 2015, 118, 083104. [Google Scholar] [CrossRef]
- Rouet-Leduc, B.; Barros, K.; Lookman, T.; Humphreys, C.J. Optimisation of GaN LEDs and the reduction of efficiency droop using active machine learning. Sci. Rep. 2016, 6, 24862. [Google Scholar] [CrossRef] [PubMed]
© 2019 by the authors. Licensee MDPI, Basel, Switzerland. This article is an open access article distributed under the terms and conditions of the Creative Commons Attribution (CC BY) license (http://creativecommons.org/licenses/by/4.0/).