Article

Optimization of River and Lake Monitoring Programs Using a Participative Approach and an Intelligent Decision-Support System

1
WaterShed Monitoring, 301-686 Grande Allée Est, Québec, QC G1R 2K5, Canada
2
DATALEA, 74 Avenue de Tivoli, Bat C. 33110 Le Bouscat, France
3
Department für Geographie, Fakultät für Geowissenschaften, Ludwig-Maximilians-University, Luisenstrasse 37, 80333 Munich, Germany
4
École supérieure d’aménagement du territoire et de développement régional, Pavillon Félix-Antoine-Savard, bureau 1628, 2325, rue des Bibliothèques, Université Laval–Québec, Québec, QC G1V 0A6, Canada
*
Author to whom correspondence should be addressed.
Appl. Sci. 2019, 9(19), 4157; https://doi.org/10.3390/app9194157
Submission received: 16 August 2019 / Revised: 14 September 2019 / Accepted: 26 September 2019 / Published: 3 October 2019
(This article belongs to the Section Environmental Sciences)

Abstract

:
We developed a holistic intelligent decision-support system (IDSS) to provide decision-support for all steps in planning, managing and optimizing water quality monitoring programs (WQMPs). The IDSS is connected to a previously developed database, EnkiTM. The IDSS integrates tacit and explicit knowledge on WQMPs to standardize decision making and to make decisions transparent and transferable. The optimization features of the IDSS were tested on a lake and a river WQMP from two case studies in Canada. We illustrate how the IDSS provides decision support to understanding the underlying rationale of the existing WQMPs, validating and storing data, selecting optimization procedures proposed in the literature, applying the optimization procedures and finalizing the optimization procedure. We demonstrated that the IDSS/EnkiTM is necessary to take and document decisions during all phases of a WQMP to obtain a clear idea of when and why changes are made and determine actionable tasks in the optimization process.

1. Introduction

Water quality monitoring programs (WQMP) are essential in order to provide decision-makers with the necessary information to implement best management practices, they are also essential to gain citizen and stakeholder support by disseminating the relevant information [1,2,3].
WQMPs can be defined as a long-term, spatially distributed, standardized surveillance, and quality assessment of all the activities surrounding water quality monitoring. WQMPs also need to be updated continuously in order to respond to new knowledge needs and adapt to new technologies, policies, constraints, and opportunities in human, technical, and financial resources [4].
When planning a WQMP, the following issues must be addressed: (1) setting realistic and representative monitoring objectives, (2) determining sampling sites, (3) choosing water quality parameters, (4) establishing sampling frequency and recurrence, (5) considering logistics, (6) assessing technical, financial and human resources, (7) identifying information diffusion channels, and (8) assessing how the information can be put to use (move on to action) [5,6,7,8]. When optimizing a WQMP, it is necessary to evaluate whether the existing WQMP (1) has covered all planning criteria, (2) if monitoring objectives have been met or have emerged, (3) if technical, financial and human resources have evolved, and been used adequately (4) whether changes in laboratories, laboratory methodologies, probes and field observations have occurred, etc. It is also of the utmost importance to verify whether the information produced within an existing WQMP has been properly channeled, put to use and prompted management action to protect water resources [7,8,9,10].
The planning, management, and optimization of a WQMP is a complex process involving many decisions that must be documented and supported through decision-support systems and adequate data management systems [6,7,8,11,12]. In addition, the planning and optimization of WQMPs should be based on precise monitoring and optimization objectives [8,13]. The literature stresses the fact that many WQMPs are based on imprecise and assumed monitoring objectives that fail to respond to representative or realistic knowledge needs. In addition, WQMPs are rarely optimized in hindsight to monitoring objectives that influenced the design of these networks, nor are WQMPs optimized according to clear-cut optimization objectives [6,14,15].
Many handbooks and guidelines exist to plan WQMPs and many optimization methods have been developed. However, they are not part of a holistic solution addressing every aspect of WQMP planning, management and optimization [8]. Therefore, it was suggested that a holistic decision support tool should be developed to account for all steps in planning, managing, and optimizing WQMPs [6,8]. The conceptual model of such an Intelligent Decision-Support System (IDSS) was developed and connected to a previously developed database EnkiTM [12].
The purpose of this paper is to test some of the features of the IDSS implemented and test decision-support workflows prior to implementation. More precisely, the optimization process proposed by the IDSS is tested herein using the data of two watershed case studies from the province of Quebec, Canada. The optimization process is based on a selection of optimization objectives elicited through a participative approach conducted on both case studies [16].
The IDSS was designed to propose existing optimization methods from the literature which correspond to different types of optimization objectives, such as evaluating the number of sampling sites, water quality parameters and sampling frequency [13,17,18,19]. The proposed IDSS is extending on existing procedures by considering the following elements before, during and after the application of these methods: understanding of the network design, generation of optimization objectives, selection of the appropriate optimization strategy, data validation and storing prior to statistical analysis, data treatment prior to statistical analysis, generation of results, selection of threshold criteria and post-validation of the results [6,8,20].

2. Methodology

The global workflow of the entire optimization process of a WQMP is illustrated in Figure 1: (1) Identify stakeholder concerns through a participative approach to elicit knowledge needs supported by a public participation geographical information system (PPGIS), (2) identify new monitoring and optimization objectives and validate the attainment of past monitoring objectives, (3) understand the rationale behind the existing WQMP, (4) integrate data from the existing WQMPs into the database connected to the IDSS, (5) interrogate the IDSS on optimization suggestions based on the input from the first three points, (6) propose optimized WQMPs and validate proposals with the decision-makers of the existing WQMPs. Stakeholders, as illustrated in this figure, are defined as citizens and representatives of organized stakeholders (e.g., industry, agriculture, ministries, municipalities, watershed organizations, associations, etc. that were identified through the stakeholder analysis) [16].
  • In this paper, we present the test of the IDSS and show how it contributes to understanding the initial WQMPs (Method Section 2.1),
  • Supplies decision support in data validation, data quality assessment and storage (Method Section 2.2),
  • Proposes optimization procedures (Method Section 2),
  • Contributes to the application of the optimization procedures (Method Section 2.4),
  • Provides decision support to finalize the optimization procedure (Method Section 2.5),
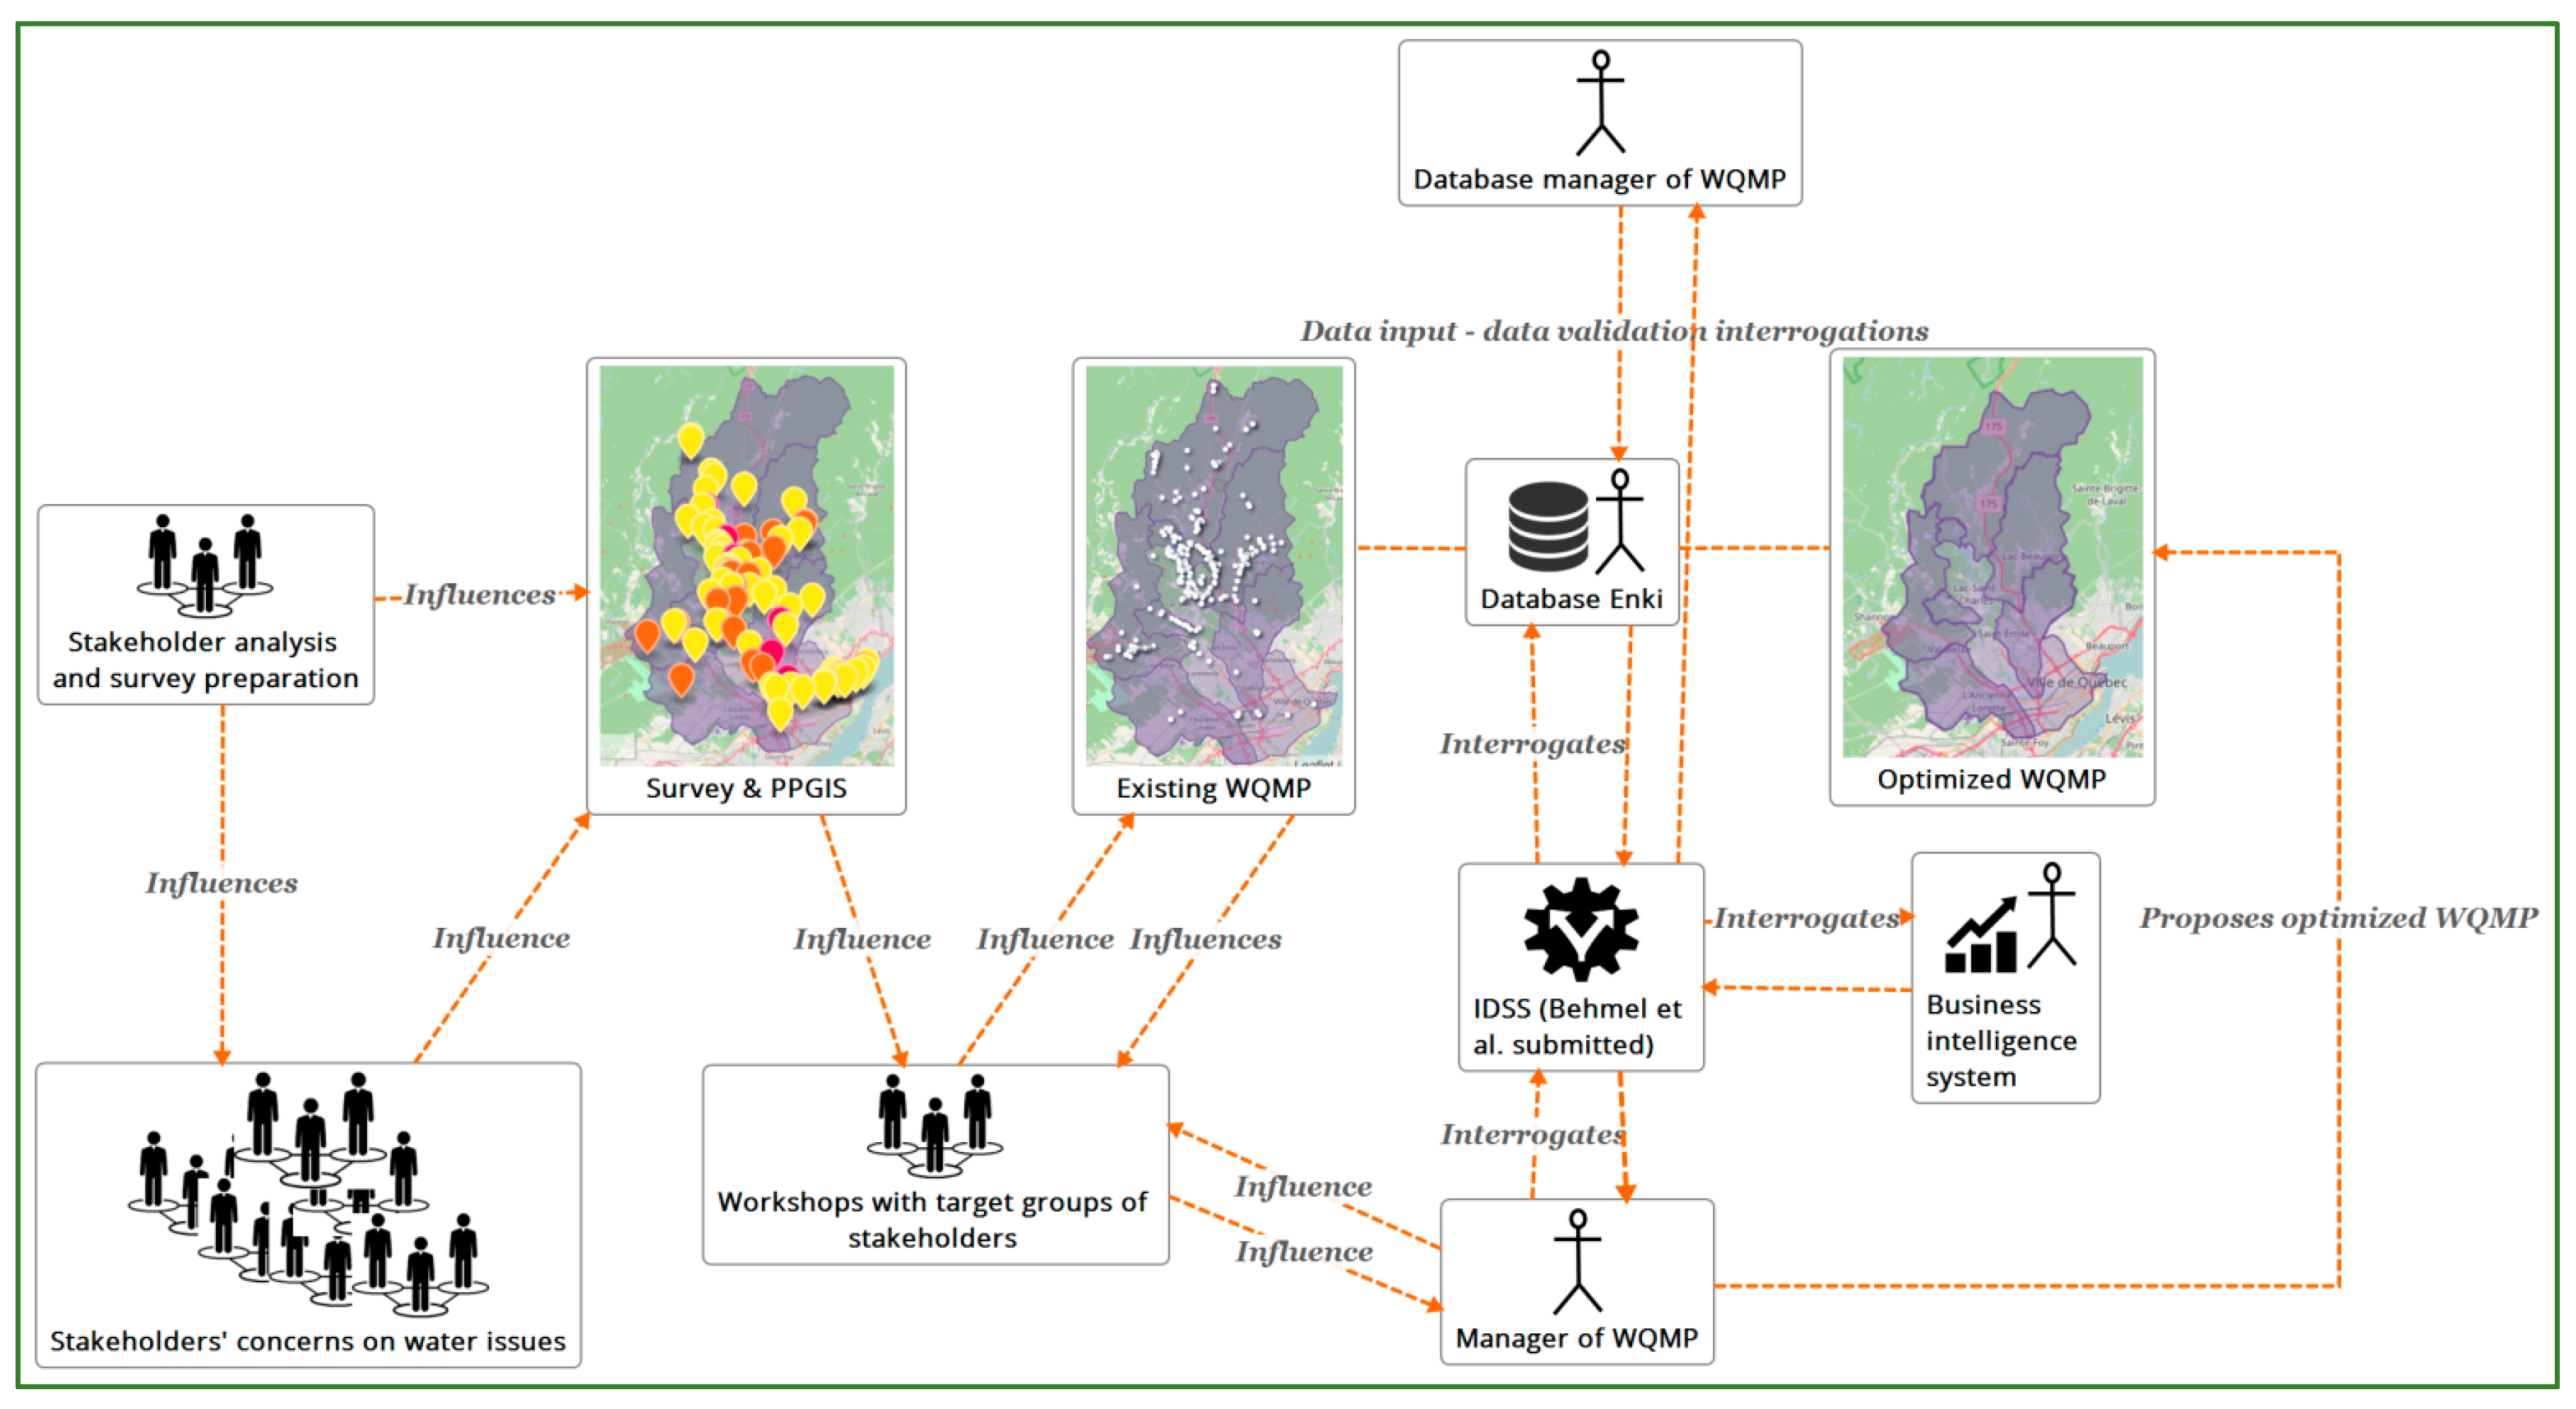
  • Is instrumental in the redesign of the WQMPs (Results and discussion Section 3).
The IDSS was tested with two watersheds in the province of Quebec, Canada.
The optimization objectives were specific to each watershed. The first to be tested was Lac Saint-Charles, a lake WQMP (size of the watershed: 198 km2 – hereafter W1). This lake is the main drinking water reservoir of the city of Québec where an extensive cyanobacteria monitoring program was implemented in 2011 to obtain a spatio-temporal portrait of the cyanobacteria community in the lake [21]. This WQMP is operated by the Association pour la protection de l’environnement du lac Saint-Charles et des Marais du Nord (APEL) and financed by the city of Québec. Given the cost of the analysis of the cyanobacteria species of nearly 300 samples per year, the main optimization objective here was to evaluate whether a reduction in sampling frequency, sampling points and the number of samples per sampling station for cyanobacteria (up to three at different water depths) would result in a loss of information. The general characteristics of the W1 WQMP are presented in Figure 2.
The second watershed was the watershed of the river, Rivière du Nord (hereafter W2), north-east of Montreal. In this watershed (size of the watershed: 2222 km2), a river monitoring program was implemented in 2009 to assess water quality to protect public health and follow nutrient concentrations and erosion [22]. This WQMP is operated by the watershed organization of the Rivière du Nord river (Abrinord) and financed by several municipalities within the territory. Given the vast territory, financial limitations and new monitoring objectives, the optimization objective was to evaluate whether a reduction in the number of sampling sites would be possible. In addition, the objective was to find out whether sufficient samples had been taken in wet weather conditions and whether the sampling frequency was sufficient to respond to the initial monitoring objectives. The objective of capturing wet weather conditions is to capture water quality impairment due to runoff from non-point pollution sources [23]. The general characteristics of the W2 WQMP are presented in Figure 3.

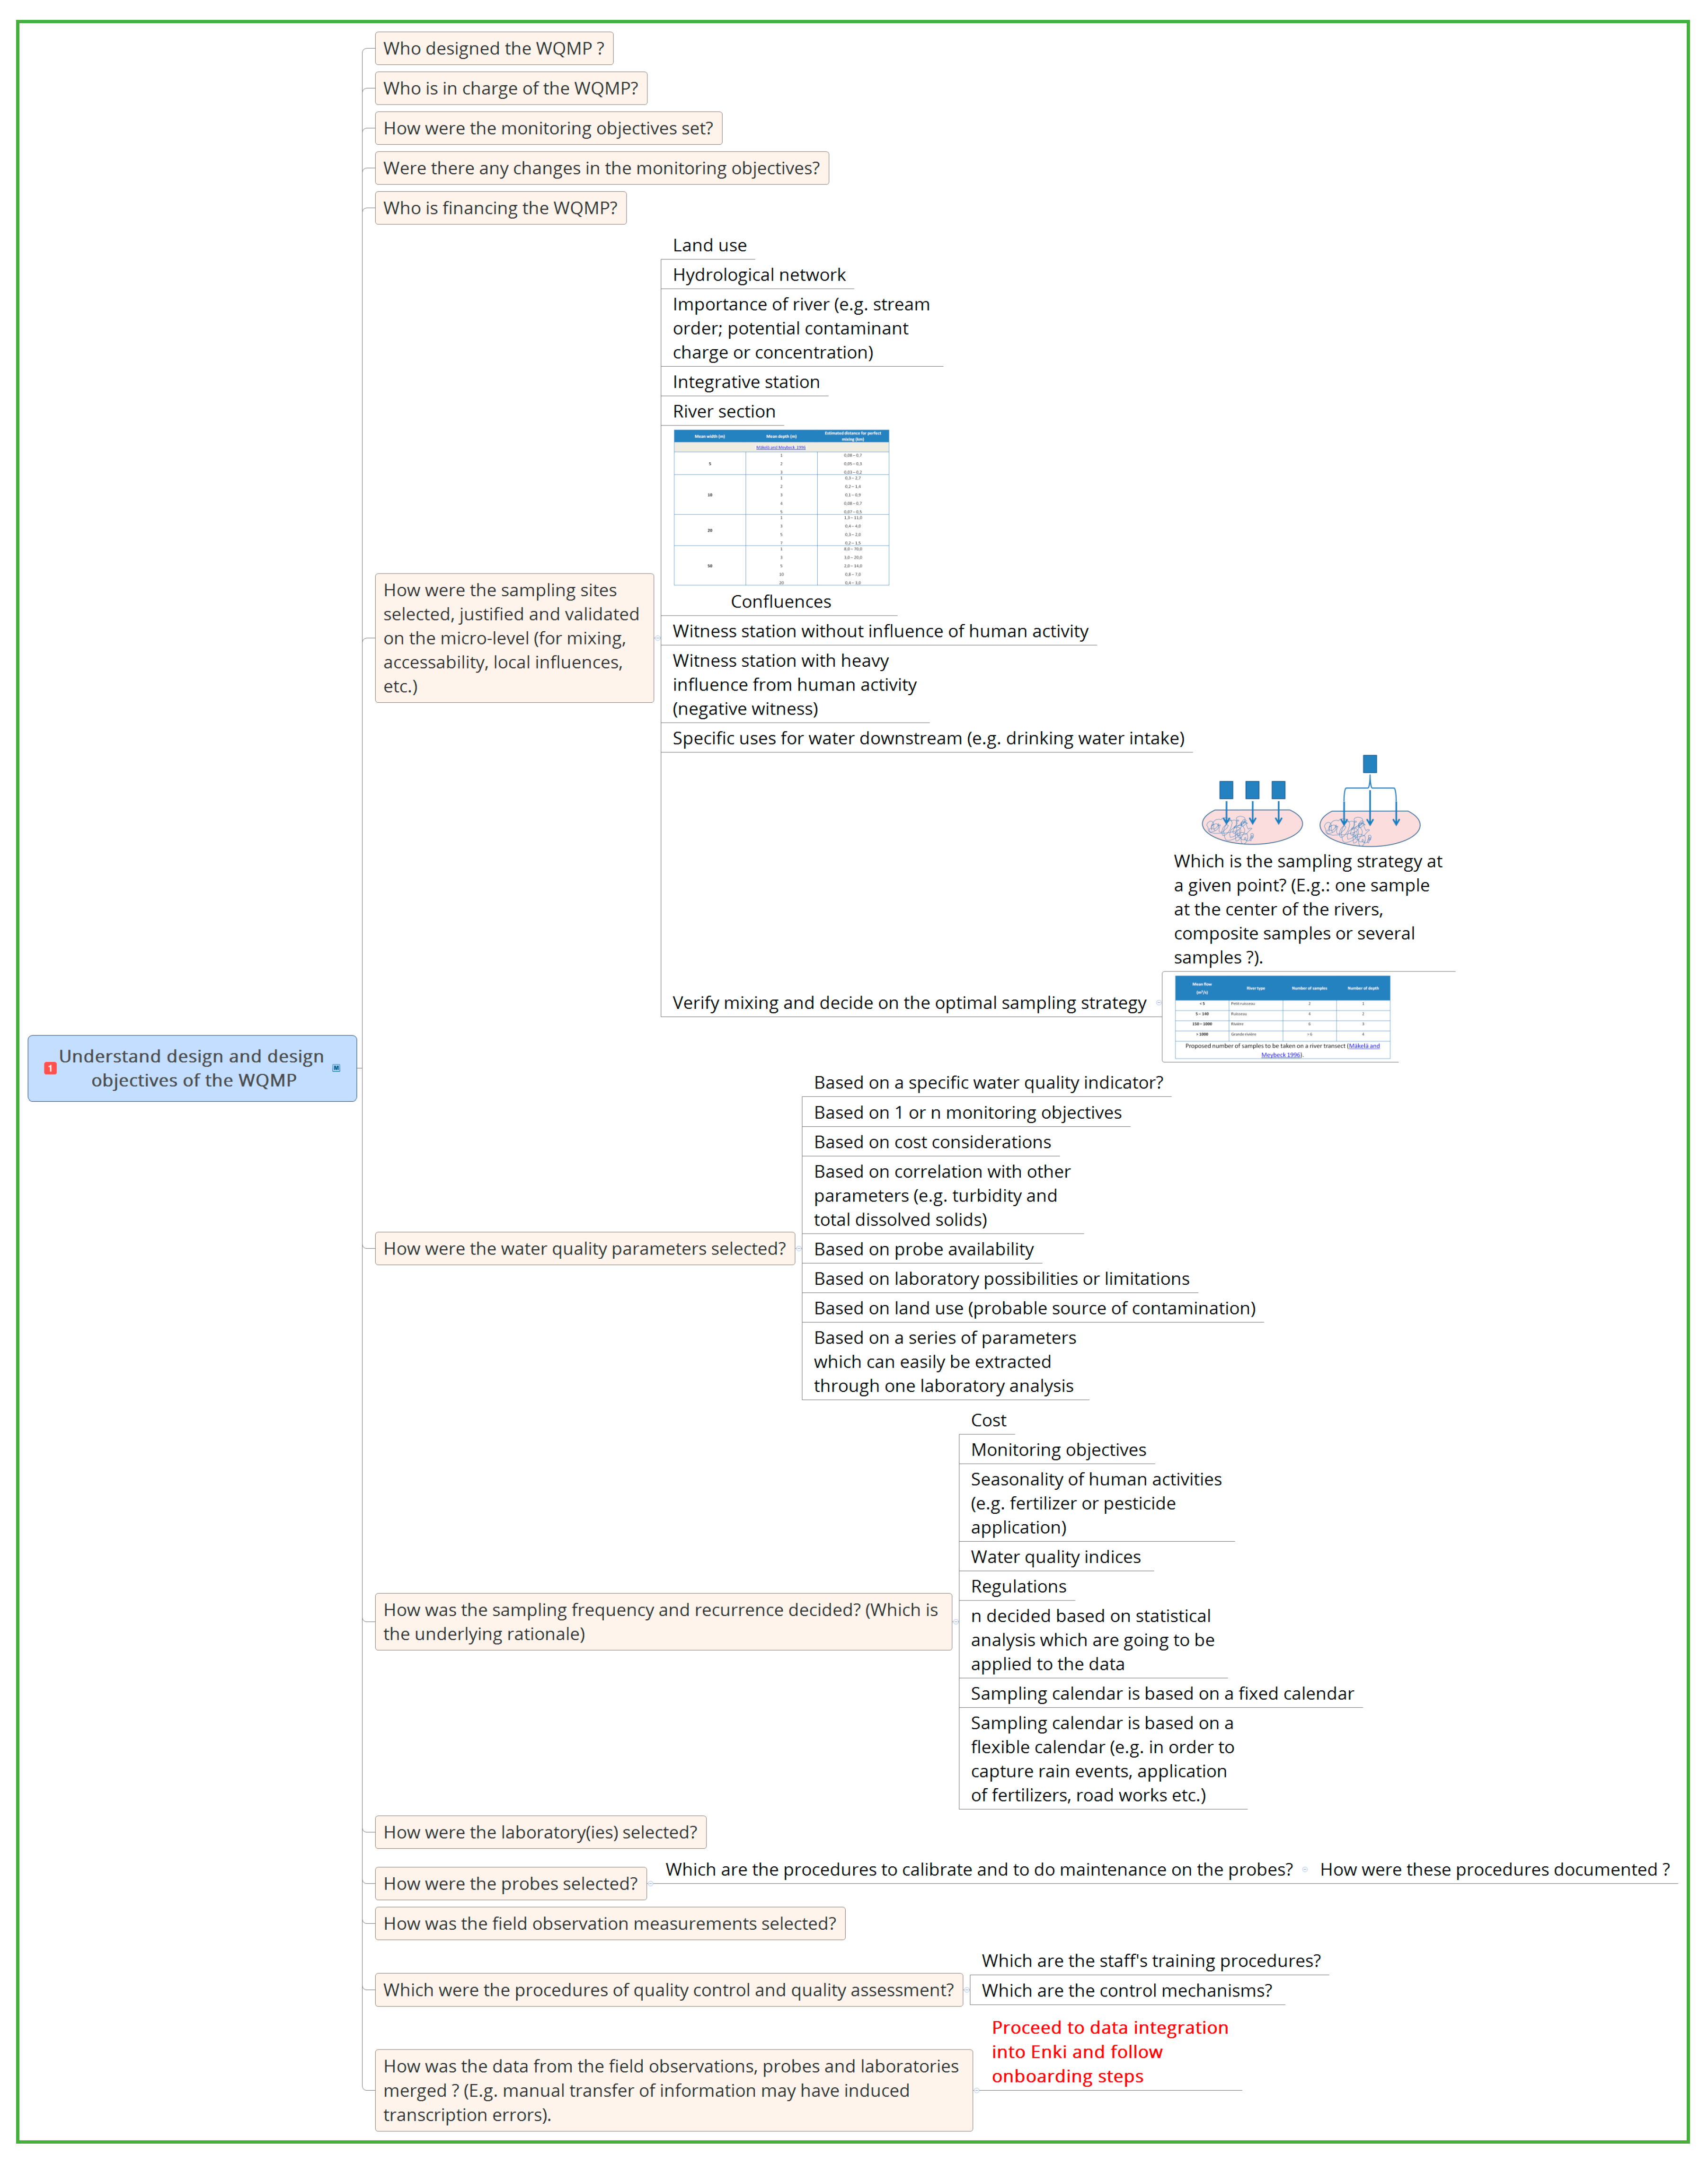
2.1. Understanding the Initial WQMPs and Data Validation and Integration

Figure 4 illustrates the questions raised by the IDSS in order to understand and evaluate the existing WQMP. These questions include queries on the initial incentives and stakeholders that led to the WQMP and the underlying objectives. Further questions focused on the rationale behind the choice of sampling sites and water quality parameters, sampling frequency, laboratories, probes, etc. All the answers to these questions were documented in the system. Understanding the initial WQMP is closely linked to the data validation and integration procedure. Figure 5 provides an illustration of the dashboard of the W1 WQMP, as well as the features that may be consulted to understand the WQMP and the available data sets.
The procedures to understand the rationale of the initial WQMPs, as well as the data validation and integration process were tested on the lake data from W1 and on the river data from W2. Also, the continuous updating of the data was tested on users from both APEL and Abrinord. The data validation and integration processes, based on six steps, are illustrated and described in Figure 6.
All data for the W1 WQMP were batch imported from the EnkiTM prototype, an ACCESS database, built and tested previously [12]. Data included information from sampling contexts, laboratories, and probes from 2011 to 2015. Data from 2016 were integrated directly into EnkiTM during the testing phase. For the cyanobacteria monitoring program, 15 sampling sites were created and some 2000 sampling contexts and more than 100,000 probe and laboratory records were entered.
Data from the W2 WQMP were stored in an Excel file with several sheets created in 2009 and continuously adapted and updated. This Excel file combined information on the sampling sites, field observations and the results of the laboratory analysis. However, not all information needed to complete the onboarding process to EnkiTM was available in these files to complete step 1 (system setting) (Figure 6). For instance, the sampling site justifications had to be retrieved from old paperwork related to the W2 WQMP. Also, the results from the laboratories had been transferred manually into the Excel files. Several incongruities were detected when comparing the original files from the laboratories with the Excel files serving as data storage for the WQMP.
In addition, some of the changes in laboratories and analysis methods were not documented in these files. Therefore, we opted to integrate all sampling contexts manually by retrieving the missing information from different source files, such as probe data results and precipitation regimes. Laboratory data was then batch imported from the original Excel files of the laboratories. The origin of the data was attributed to the respective laboratories. All in all, 66 sampling stations and more than 2500 sampling contexts were created. Approximately 10,500 probe and laboratory records were batch imported and connected to the sampling contexts and sampling stations.

2.2. Selection of Optimization Methods

In order to be able to propose optimization procedures, it is necessary to understand the available methods, their analysis and their degree of difficulty. We strived to do so for several optimization methods in a previous literature review [8]. Based on new monitoring and optimization objectives, it was then possible to select an appropriate optimization method [16].
The optimization objective of the W1 WQMP was to Verify whether reducing the number of sampling stations (and points in depth) and sampling frequency have an impact on the spatio-temporal portrait (loss of information) of the cyanobacteria species (Figure 2). For this optimization objective, we chose to apply the method proposed by [24] which consists of visualizing species (in this case cyanobacteria) distribution through factorial correspondence analysis and then comparing a series of years (in this case 2011 to 2016) to be able to decide whether the sampling strategy will serve to obtain a spatio-temporal distribution and whether it is possible to reduce the sampling frequency and the number of sampling sites.
For the W2 WQMPs of the case studies, we chose to apply the optimization approaches proposed by Beveridge et al. [13] and Levine et al. [19] (Figure 3). Beveridge et al. (2012) propose a combination of multivariate analysis / principal component analysis (NMDS/PCA) and Kriging and Moran’s index to quantify information redundancy for neighboring sampling sites in a lake or river station network in order to reduce the number of sampling sites. We chose this method to respond to the first optimization objective of the W2 WQMP: Verify whether a reduction of the number of sampling sites was possible based on criteria such as information redundancy between sampling stations. Levine et al. (2014) propose a general linear regression model to assess the increase in uncertainty for reduced sampling frequency and evaluate statistical confidence in trend detection. We applied this model to the W2 WQMP to respond to the optimization objective: Verify whether sampling frequency was sufficient and whether a different type of sampling frequency should be adopted. We also applied the Kruskal-Wallis test to the data of W2 to verify whether the fecal coliform (FC), total phosphorous (TP) and total suspended solid (TSS) concentrations were different depending on the observed precipitation classes of W2 [25]. The objective was to verify whether sufficient data were collected in wet weather conditions, as this information would have an incidence on changing from a fixed sampling calendar as is presently the case in W2, to a flexible sampling calendar in order to obtain more data during wet weather conditions. The objective of sampling in wet weather conditions was to obtain water quality data following run-off. For the W2 watershed, only two hydrological stations are available and river flow is not measured during water quality sampling. Lack of river flow data for W2 was identified as an issue which must be addressed in the future. Therefore, the only means of obtaining some information on the impact of run-off on water quality is the analysis of precipitation data. Here, the analysis used the information of semi-qualitative precipitation classes based on field observation and data from weather stations, when available. The thresholds and the precipitation classes were developed through discussions with the City of Quebec and APEL and were also used by Abrinord [26]. The approximate threshold for a wet weather event was considered 10 mm for each class. These classes were: 0 - no rain for 48 h 1- rainfall the same day, 2- rainfall 0–24 h prior to sampling, 3- rainfall 24–48 h prior to sampling, 4- rainfall 0–48 h prior to sampling. This information was also entered in the sampling contexts of EnkiTM.
It has to be noted that the definitions of wet weather differ in the literature and are adapted to specific monitoring objectives, types of data analysis, land use characteristics and physical features of a given watershed. For instance, non-point source monitoring aims at monitoring effects of land use on water quality in a variety of weather conditions and point-source monitoring may aim at monitoring the retention capacity of a sewer system. The runoff in urbanized areas is greater than in forested areas. The effect on water quality of a given amount of rain will thus be more immediate and the criteria should be adapted accordingly. The same applies to differences in slope. The wet-weather conditions can be defined through time spans and precipitation (in mm). In some cases, intensity and geographical distribution are also part of the definition [26,27]. In other cases, wet and dry weather conditions are derived from observed baseflow concentrations and land cover (runoff coefficient) [28].

2.3. Application of Optimization Procedures

In order to apply the optimization procedures, it was first necessary to retrieve the data through a selection and extraction process. This selection and extraction process was implemented and tested for the data of both case studies. This step allows the user (statistician) to understand the available data series, their origins, and field observation contexts, such as precipitation classes and other types of observations which may also explain outliers (Figure 7).

2.4. Decision Support During the Optimization Procedures

The IDSS provides decision support for questions related to the data used for the optimization. The essence of these questions is illustrated in Figure 8. The purpose of these questions is to support the person in charge of the statistical analysis and validate whether any kind of change in the WQMP has had an effect on data series, data integrity, and comparability of data. This also includes understanding outliers through the integration of field observations in the data series, thus contributing to decisions of necessary outlier elimination for some types of analysis. It also includes decisions to be made on reconstructing missing data.
For W1, the optimization method which was applied can be consulted in Legendre and Gallagher (2001). For W2, the optimization method can be consulted in Beveridge et al. (2012) and in Appendix A.

2.5. Decision Support to Complete the Optimization Procedure

The output from the statistical analysis provides a series of suggestions in line with the optimization objectives to optimize the WQMPs. Indeed, several authors have underlined the importance of bringing expert opinion into this step [13,29,30]. We thus propose that the WQMP managers be supported in this final step through questions which are integrated into the IDSS and which are based on expert knowledge [16]. The aim is to ensure consistency in the final decision-making and documentation of these decisions.
For each of the sampling sites suggested for scrutiny (removal, retention or stations considered as neutral) by the application of the statistical methods, the IDSS provides an additional series of questions to support the final decision to keep or remove a station. The same applies to suggestions on sampling frequency, adding or reducing water quality parameters, etc. A selection of questions from the decision-support trees for the final optimization of a river WQMP is listed below. If the question cannot be answered immediately, the system transforms it to an actionable task (Note that this is a non-exhaustive list and the IF-THEN rules are not all shown).
A selection of questions for lakes:
  • IF more than one station is visited in a lake, THEN verify the justification of the selection of each site in order to understand the rationale for each site (e.g., deepest sector of a lake; close to a major inflow; in a section of a lake with recurrent cyanobacteria blooms) [31].
  • For each station, verify the employed sampling strategy. These decisions can greatly affect the results: e.g., decisions taken on the profile (probe data every 0,5 m, 1 m, etc.), decisions taken on sampling depth for laboratory parameters (chlorophyll a, total phosphorous, nitrogen compounds, cyanobacteria etc), decisions taken for the type of sampling method: e.g., horizontal bottle at a given depth, tube samplers for an integrative sample of the first n meters, etc.
  • Validate whether the sampling strategy responds to the objectives and whether adding new parameters is in line with the existing sampling strategy and objectives.
  • Verify whether a river WQMP is in place in order to observe changes in the watershed which may translate to the lake.
A selection of questions for rivers:
  • Based on the results of the analysis provided for each station which suggest either the retention, removal or no specific action for a station, verify the following: IF a sampling site is suggested for removal, THEN verify the type of sampling site and the sampling site justification.
  • IF the sampling site is an integrative station, THEN keep the sampling station
    An integrative station is a station which is downstream from a subwatershed and represents the globality of the subwatershed.
  • IF the sampling site is a section of a river, THEN verify whether a particular goal is pursued and justified for the station
    A station of a section represents the water quality between two sampling sites and should be selected according to specific goals and pollution sources, and must be justified).
  • IF the sampling site justification is a witness station, THEN verify if the sampling site still qualifies
    A witness station is supposed to represent the natural water quality of a subwatershed, or, if it is not possible to have a witness station for every subwatershed, there should be a witness station for every sector representing the geology of the sectors of the WQMP. Therefore, it is necessary to verify whether sufficient witness stations are available to be representative of every type of natural background in the territory subject to the WQMP.
  • IF a specific goal is pursued, THEN verify whether the station is (1) still representative, (2) whether upstream and downstream stations contribute to achieving this goal, and, add, if necessary additional stations, (3) verify whether the station is still representative on the micro-level (mixing, accessibility, (new) local influences), whether water quality can be altered (improved – e.g., a waterfall – or degraded – e.g., a sewer overflow).
  • Verify whether the water quality parameters taken at the station are contributive to attaining the goal (e.g., evaluate the influence of agriculture land use should include monitoring nitrogen-based compounds).
  • Verify whether sufficient data were taken during wet weather conditions and, if not, adapt sampling calendar to a more flexible calendar.
  • Verify whether new (additional) goals can be pursued at existing stations.
  • Verify whether the sampling site justification is consistent with the stations’ location and whether there must be another station implemented to be able to respond to the justification (e.g., if one wants to find out whether there is an influence of the inflow of a river at a station, there must be some information available on that river, and there must be a station upstream from this river inflow (triangle strategy).
  • IF the sampling site justification is: upstream from a wastewater treatment plant (municipal or industrial), THEN there should be a station downstream from the treatment plant.

3. Results and Discussion

In the first step, the challenge was to understand the initial WQMPs and to integrate the data into the database EnkiTM connected to the IDSS.
The fact that the data were already entered in the prototype of EnkiTM facilitated the process of integrating the data from W1. However, the purpose of the questions was to understand the rationale behind the selection of the lake sampling sites, the decisions taken on the sampling strategy at each site, as well as understand the sampling objectives which contributed greatly to documenting the rationale and making it transferable to WQMP managers and organizations that would like to increase the value of the data for other studies. This process also contributed to documenting the limitations of some sampling sites, such as shoreline sampling sites. This information is also crucial to optimize the network, as some of the deficits of the sampling site distribution might already be known and can be justified.
The data integration for W2 was more of a challenge, as the data had to be validated and completed from various sources. The choice of the sampling sites, their specific justification, especially for river sections, was not well documented at the outset and the information was retrieved from old paperwork. Also, changes in sampling frequency and problems in the data sets were a challenge for both the optimization of the data management and the application of the optimization approach. However, the onboarding (settings) steps and the retroactive integration of field observations, specifications on laboratories, sampling site justifications, etc. greatly contributed to obtaining a holistic view of the WQMP, as well as the specific rationale of decisions taken regarding the W2 WQMP. Data and metadata could now be efficiently consulted, visualized and retrieved. This contributed greatly to the choice of optimization methods: not only must they be based on specific optimization objectives (elicited by a participative approach), but also on the available data sets.
The data integration steps showed that the data management question is not always clearly addressed at the outset of a WQMP. This may be due to the fact that challenges related to data management are underestimated and are only addressed when the data needs to be analyzed. In addition, for lack of resources, solutions, and knowledge on data management questions, data management is not always addressed adequately. For the W1 watershed, this question had been addressed at the outset which led to a data management strategy which was adapted to the data management needs of a WQMP. W2 watershed managers have adopted the same strategy as W1 after this experience.

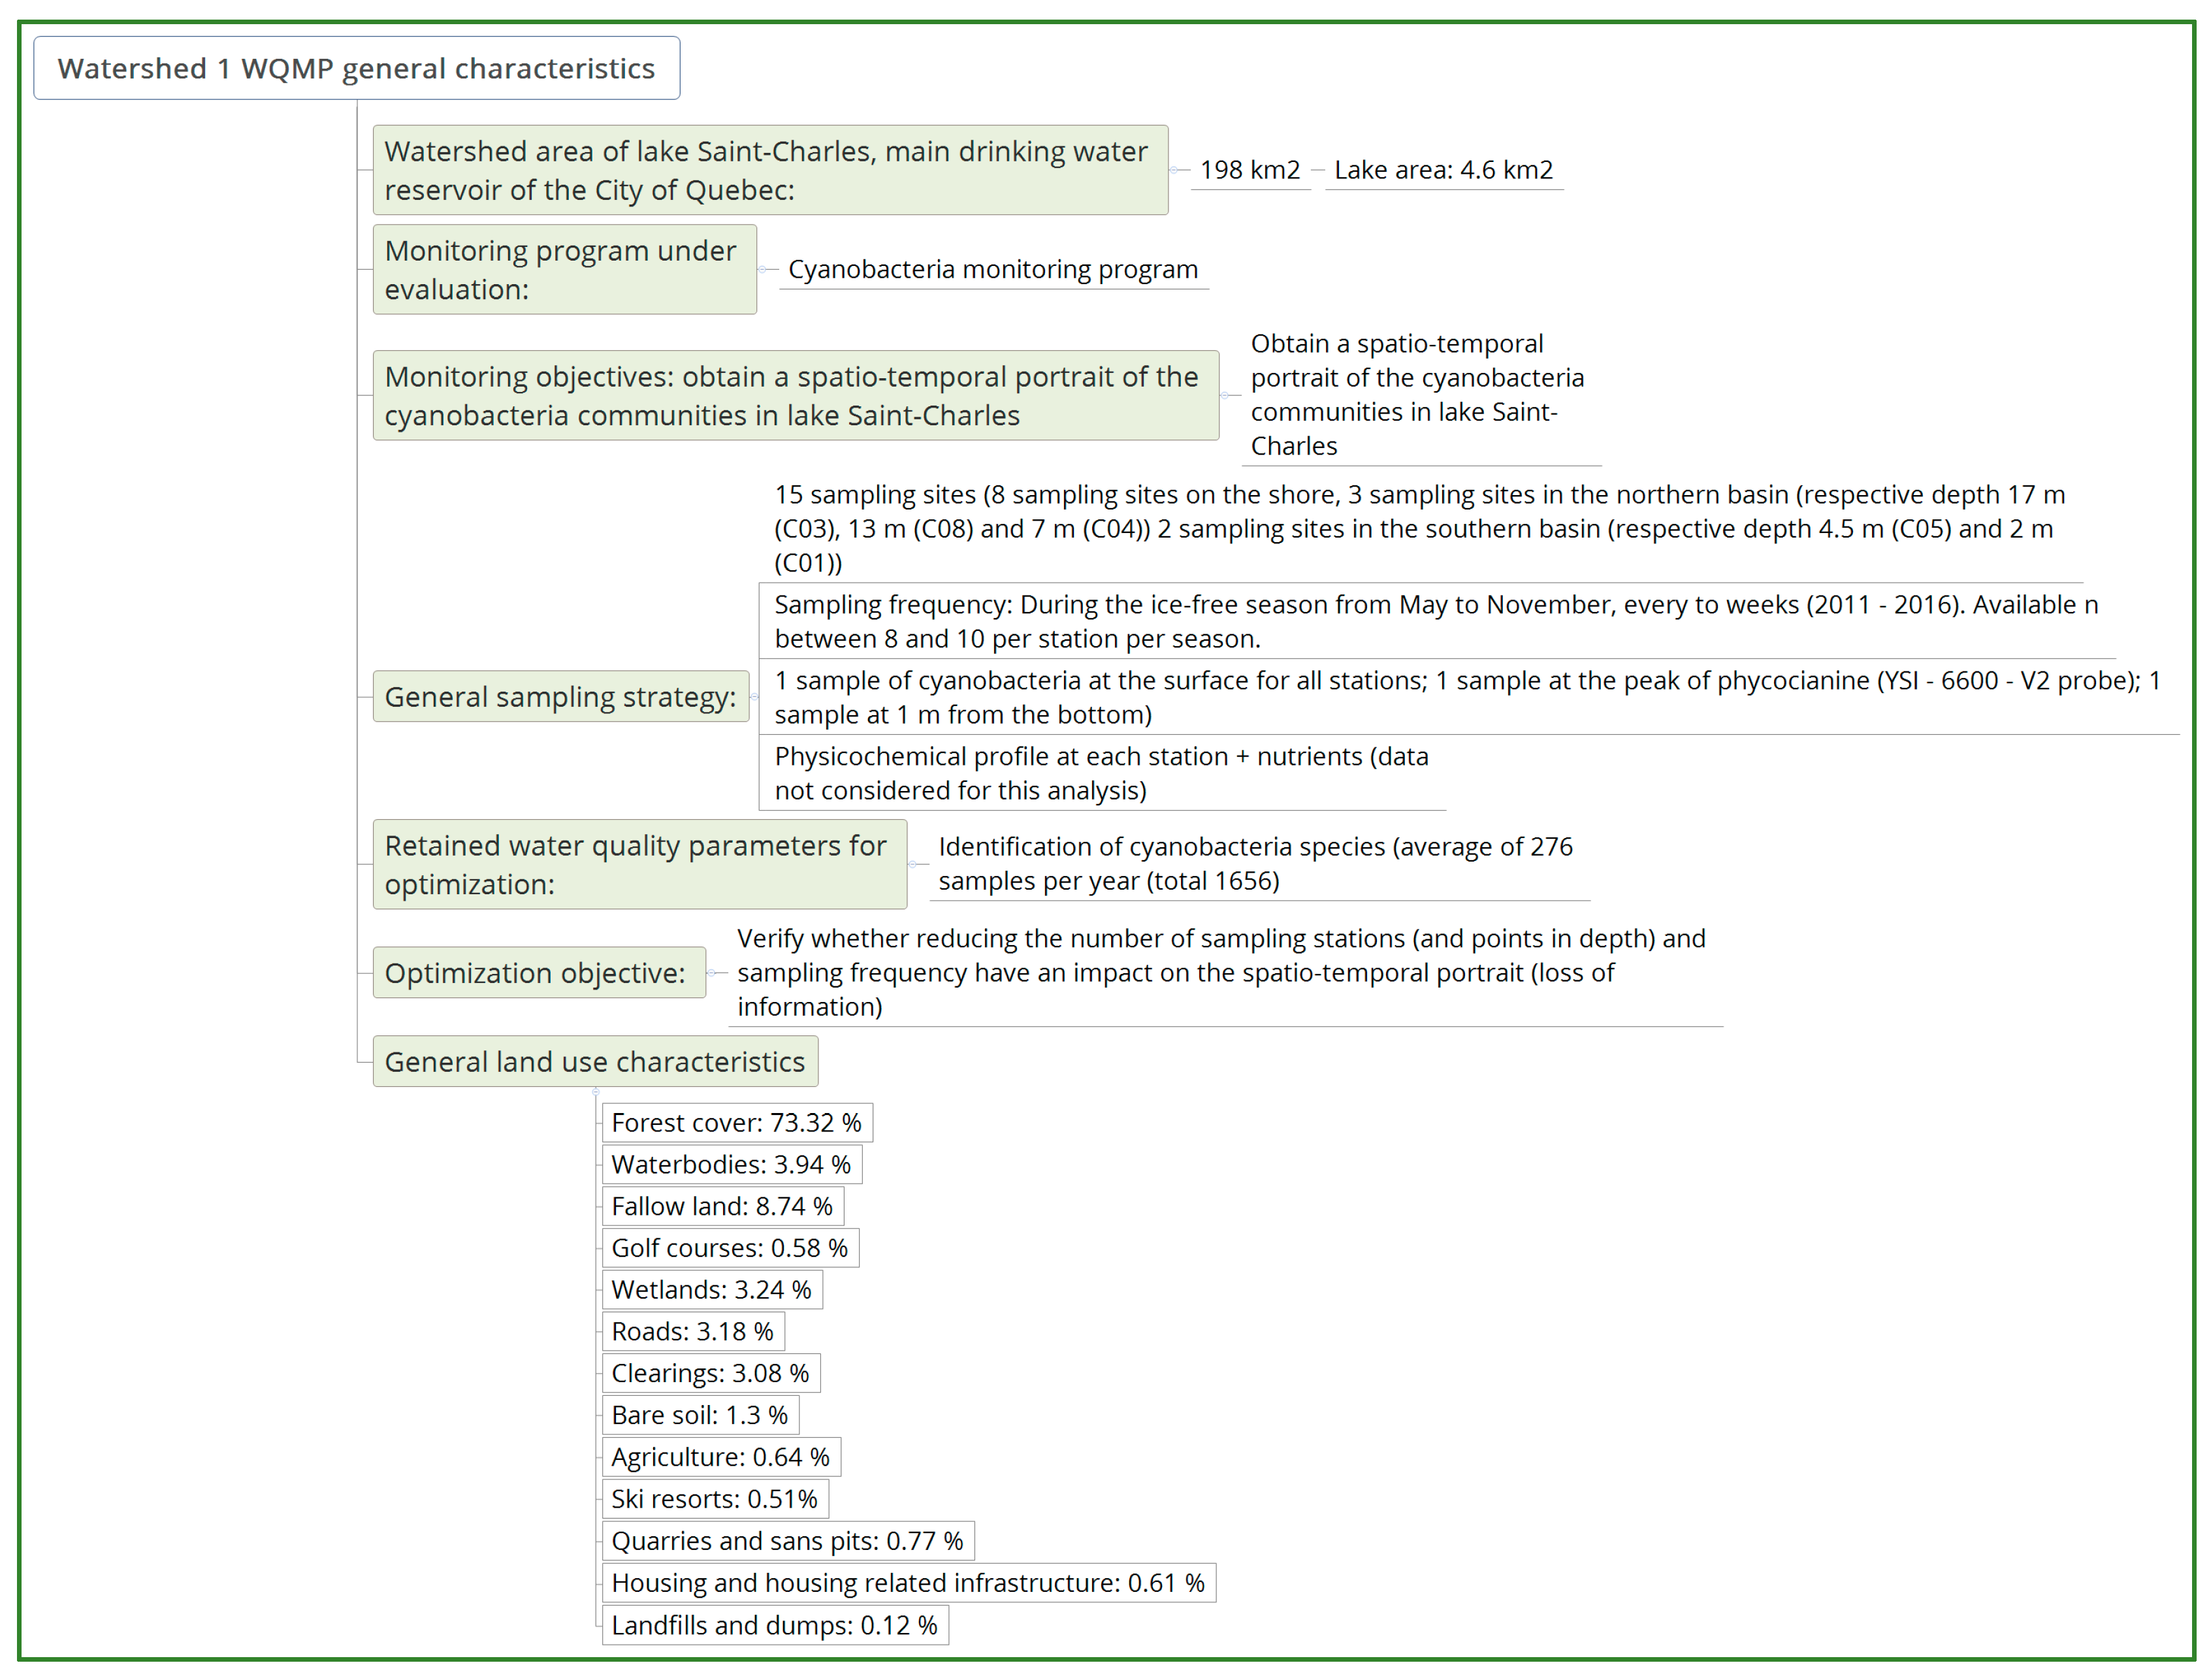
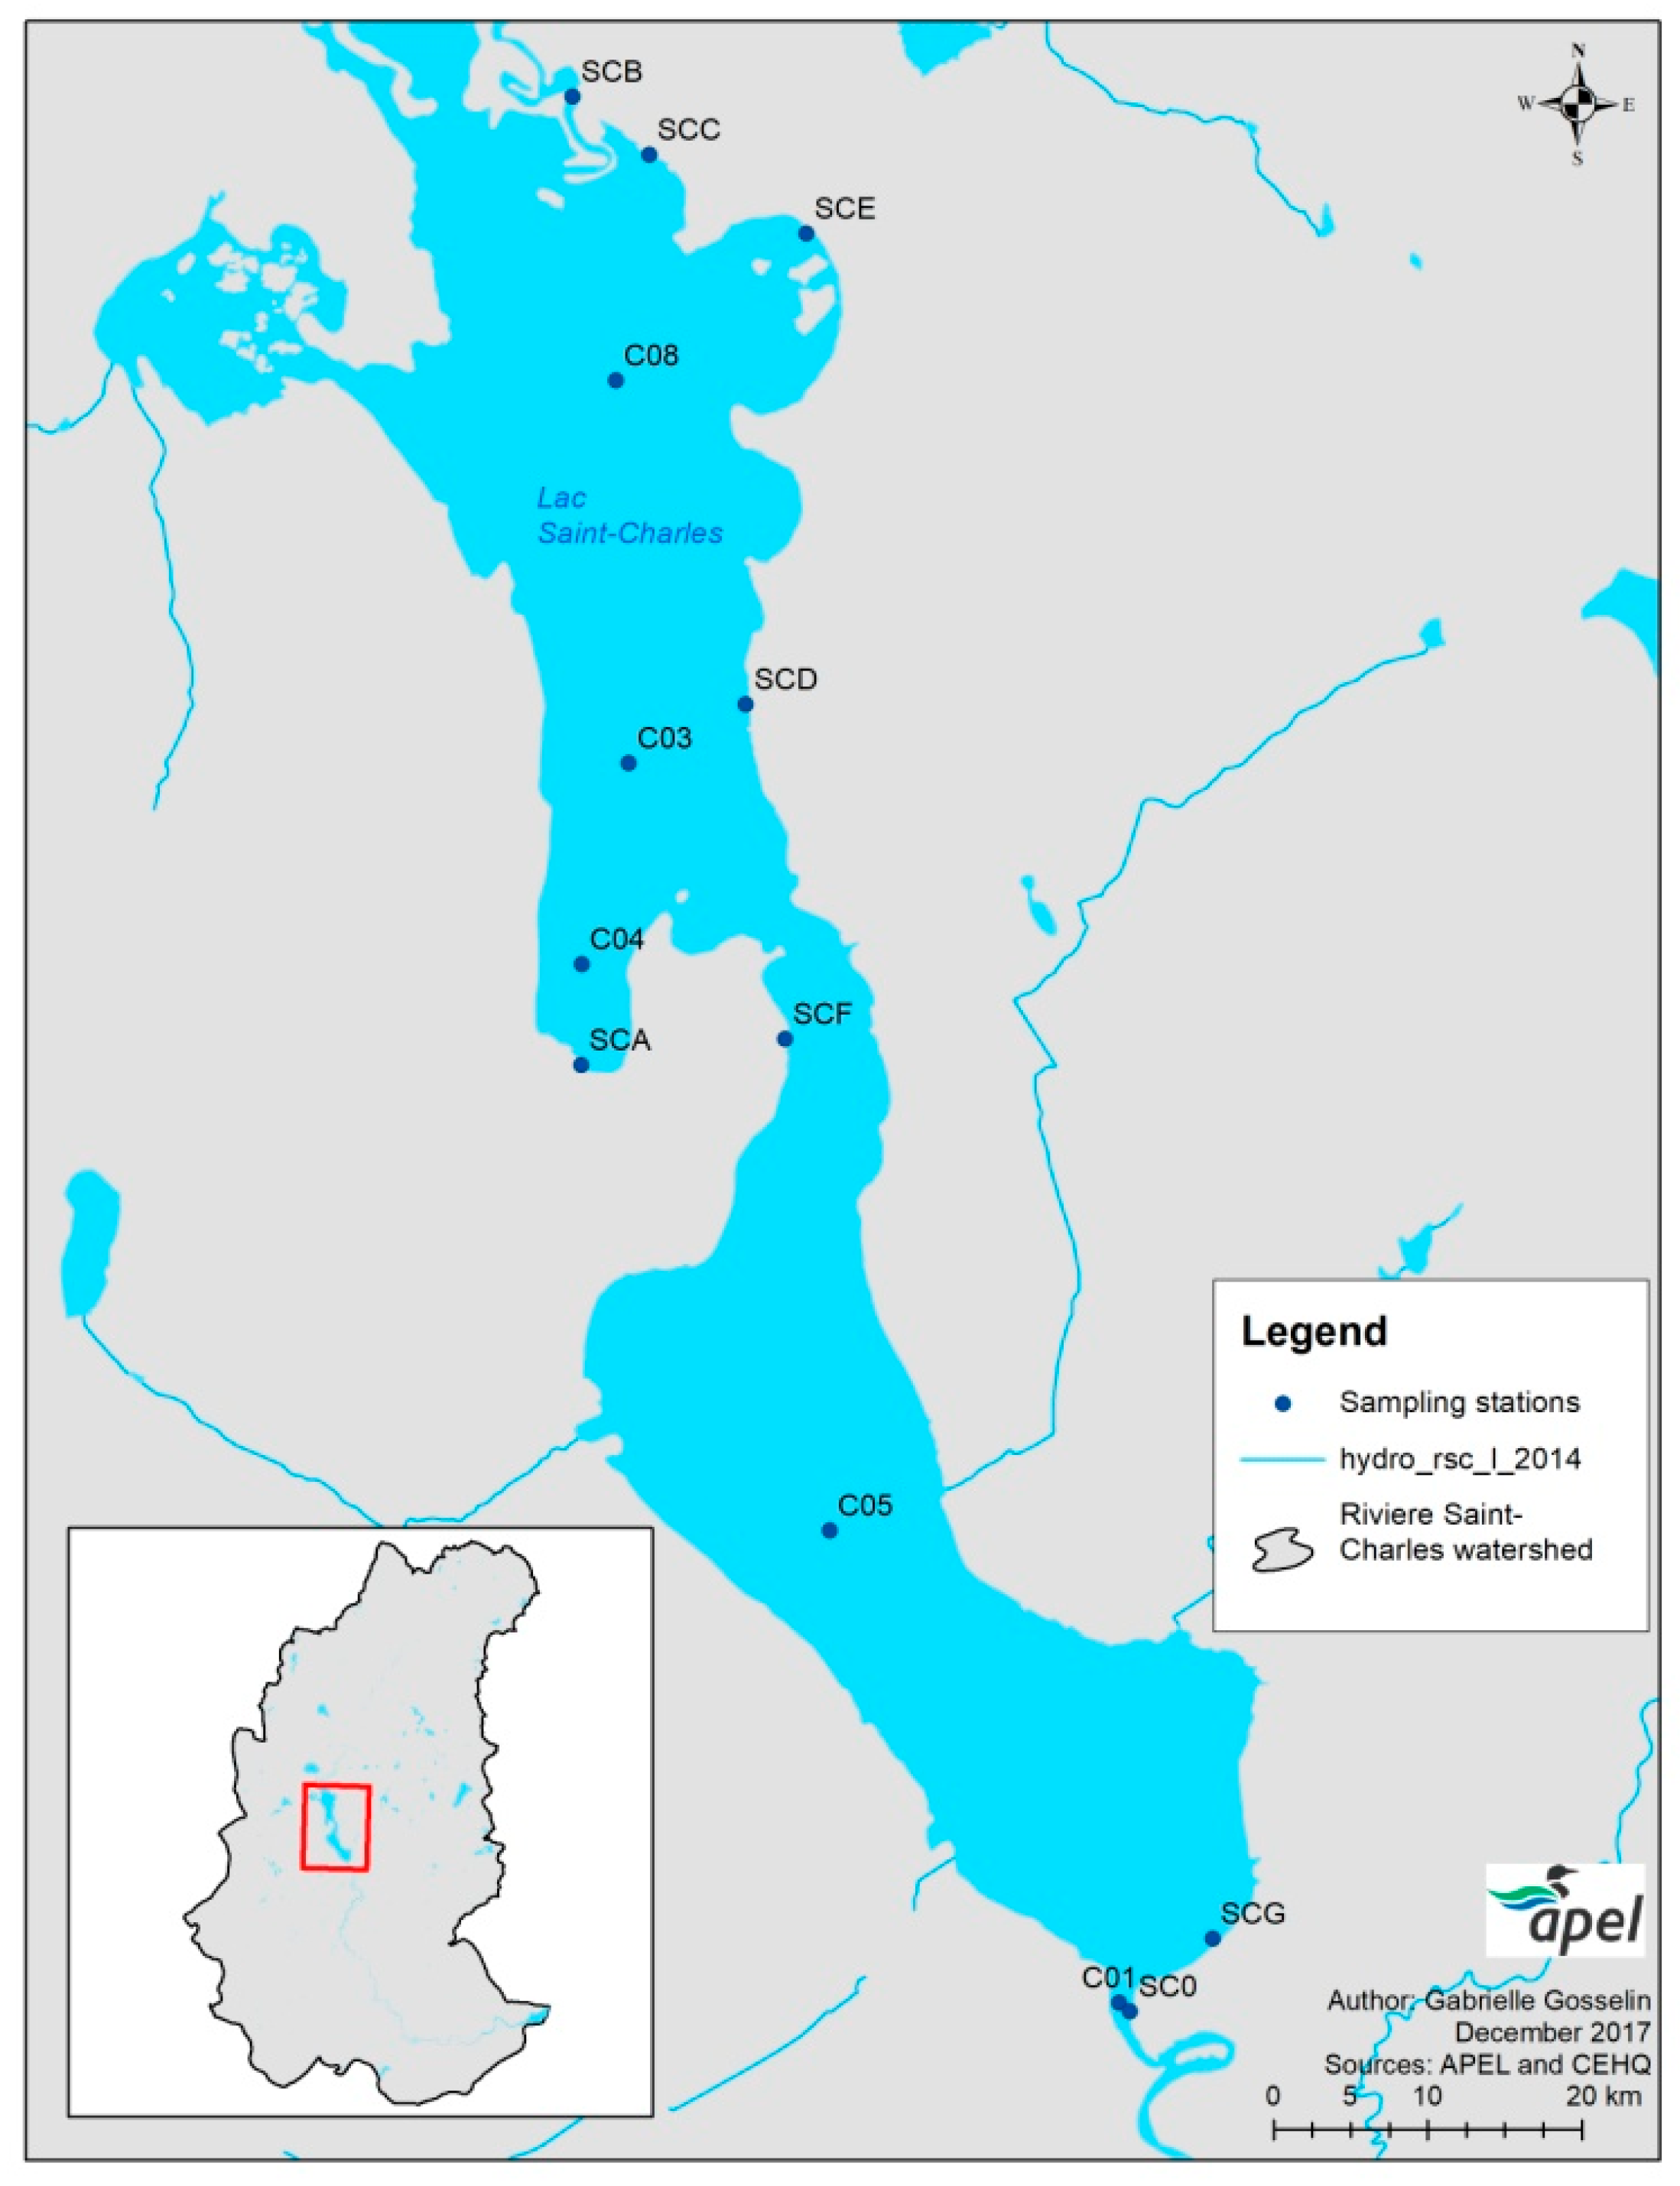
3.1. Optimization of the W1 WQMP – Results and Discussion

The step to understand the rationale of the WQMP contributed greatly to providing a list of actionable tasks for the optimization of the W1 WQMP. The results from the statistical analysis for the optimization objective: evaluate whether a reduction in sampling frequency, sampling points and number of samples per sampling station (up to three at different depths) which would lead to a loss of information also contributed to the list of actionable tasks. As mentioned in Figure 2, one objective of this lake WQMP was to obtain a spatio-temporal portrait of cyanobacteria, that assesses the cyanobacteria community at different sites and depth throughout the lake and at different times during the ice-free period. The objective was also to find out whether there were any interannual differences. However, the first and foremost objective was to obtain information on the evolution of the eutrophication of the lake. Therefore, at every station (C03, C08, C05, C04, C01 shown in Figure 9) visited at two-week intervals (total of 10 outings every year) from the ice-free season (spring mixing) to fall mixing, a profile of physicochemical and biological parameters was taken at every 0.5 m with a YSI 6600 V2 probe (pH, specific conductivity, temperature, dissolved oxygen, phycocyanin, chlorophyll a and turbidity). In addition, water samples for laboratory analysis of total phosphorous (TP) nitrogen compounds and chloride were also taken at a depth of 1 m, in the meta-limnion and at 1 m from the bottom with a horizontal bottle (when depth permits). These stations were selected in a study conducted prior to the WQMP, the aim at this time was to continue with the same stations considered representative of the heterogenic zones of the lake. The objective of monitoring cyanobacteria was added afterward. The objective was not only to know the distribution of cyanobacteria in the lake but also to determine the locations onshore where they could be observed and sampled for the spatio-temporal portrait. The selection of these stations was first based on an equal spatial distribution around the lake but was then very much influenced by accessibility and permissions to access the lake (SCx in Figure 9). The sampling strategy for cyanobacteria was one sample at the surface (all stations), at the peak of the phycocyanin readings (lake stations) and at 1 m from the bottom (depth permitting – C0x). The sampling was done every two weeks with the other sampling campaign.
The results of the analysis proposed by Legendre and Gallagher (2001), showed that there is a relatively consistent factorial structure demonstrating that the distribution of the 29 cyanobacteria species is relatively constant throughout the year and between years The results also show that there is a relatively consistent spatial distribution. For instance, Planktothrix sp. prefers the cold and deep hypolimnion of C08 and C03 (temperature ranging between 6–8 °C between 10 and 16 m). Species such as Anabaena sp. Radiocystis sp., Anabaena sp., Microcystis sp., Aphanothece sp., and Aphanocapsa sp consistently prefer the epilimnion at all stations, including the shore stations (surface and peak of phycocyanin generally situated in the epilimnion) and Planktolynbia sp. occupies the 4 m zone at station C05, as well as the hypolimnion at 12 m at C08. There is no difference between stations C01 and SC0, as they are very close to each other.
The conclusions of this analysis are that either station C01 or SCO could be abandoned and that the sampling frequency (every two weeks) could be significantly reduced. However, before taking a final decision, there are several actionable tasks to be followed which are summarized in Table 1 for the W1 WQMP.
The WQMP revealed that it is possible to obtain a consistent spatio-temporal portrait of the cyanobacteria community with the proposed sampling strategy and sampling frequency and recurrence. In addition, sufficient data were collected to attribute the species to the trophic state of the lake. It is also possible to eliminate one station where generally two samples were taken (C01), for a total of 20 samples per year. In addition, it was shown that the sampling could be reduced to a four-week interval. However, the recommendations are to:
  • Ensure that changes in the water quality of the tributaries (in particular road salts) and the ensuing impact on Lac Saint-Charles are detected in order to reinstate the present cyanobacteria program and to observe changes which they may announce.
  • Verify whether other objectives followed within this WQMP are not compromised by these decisions.

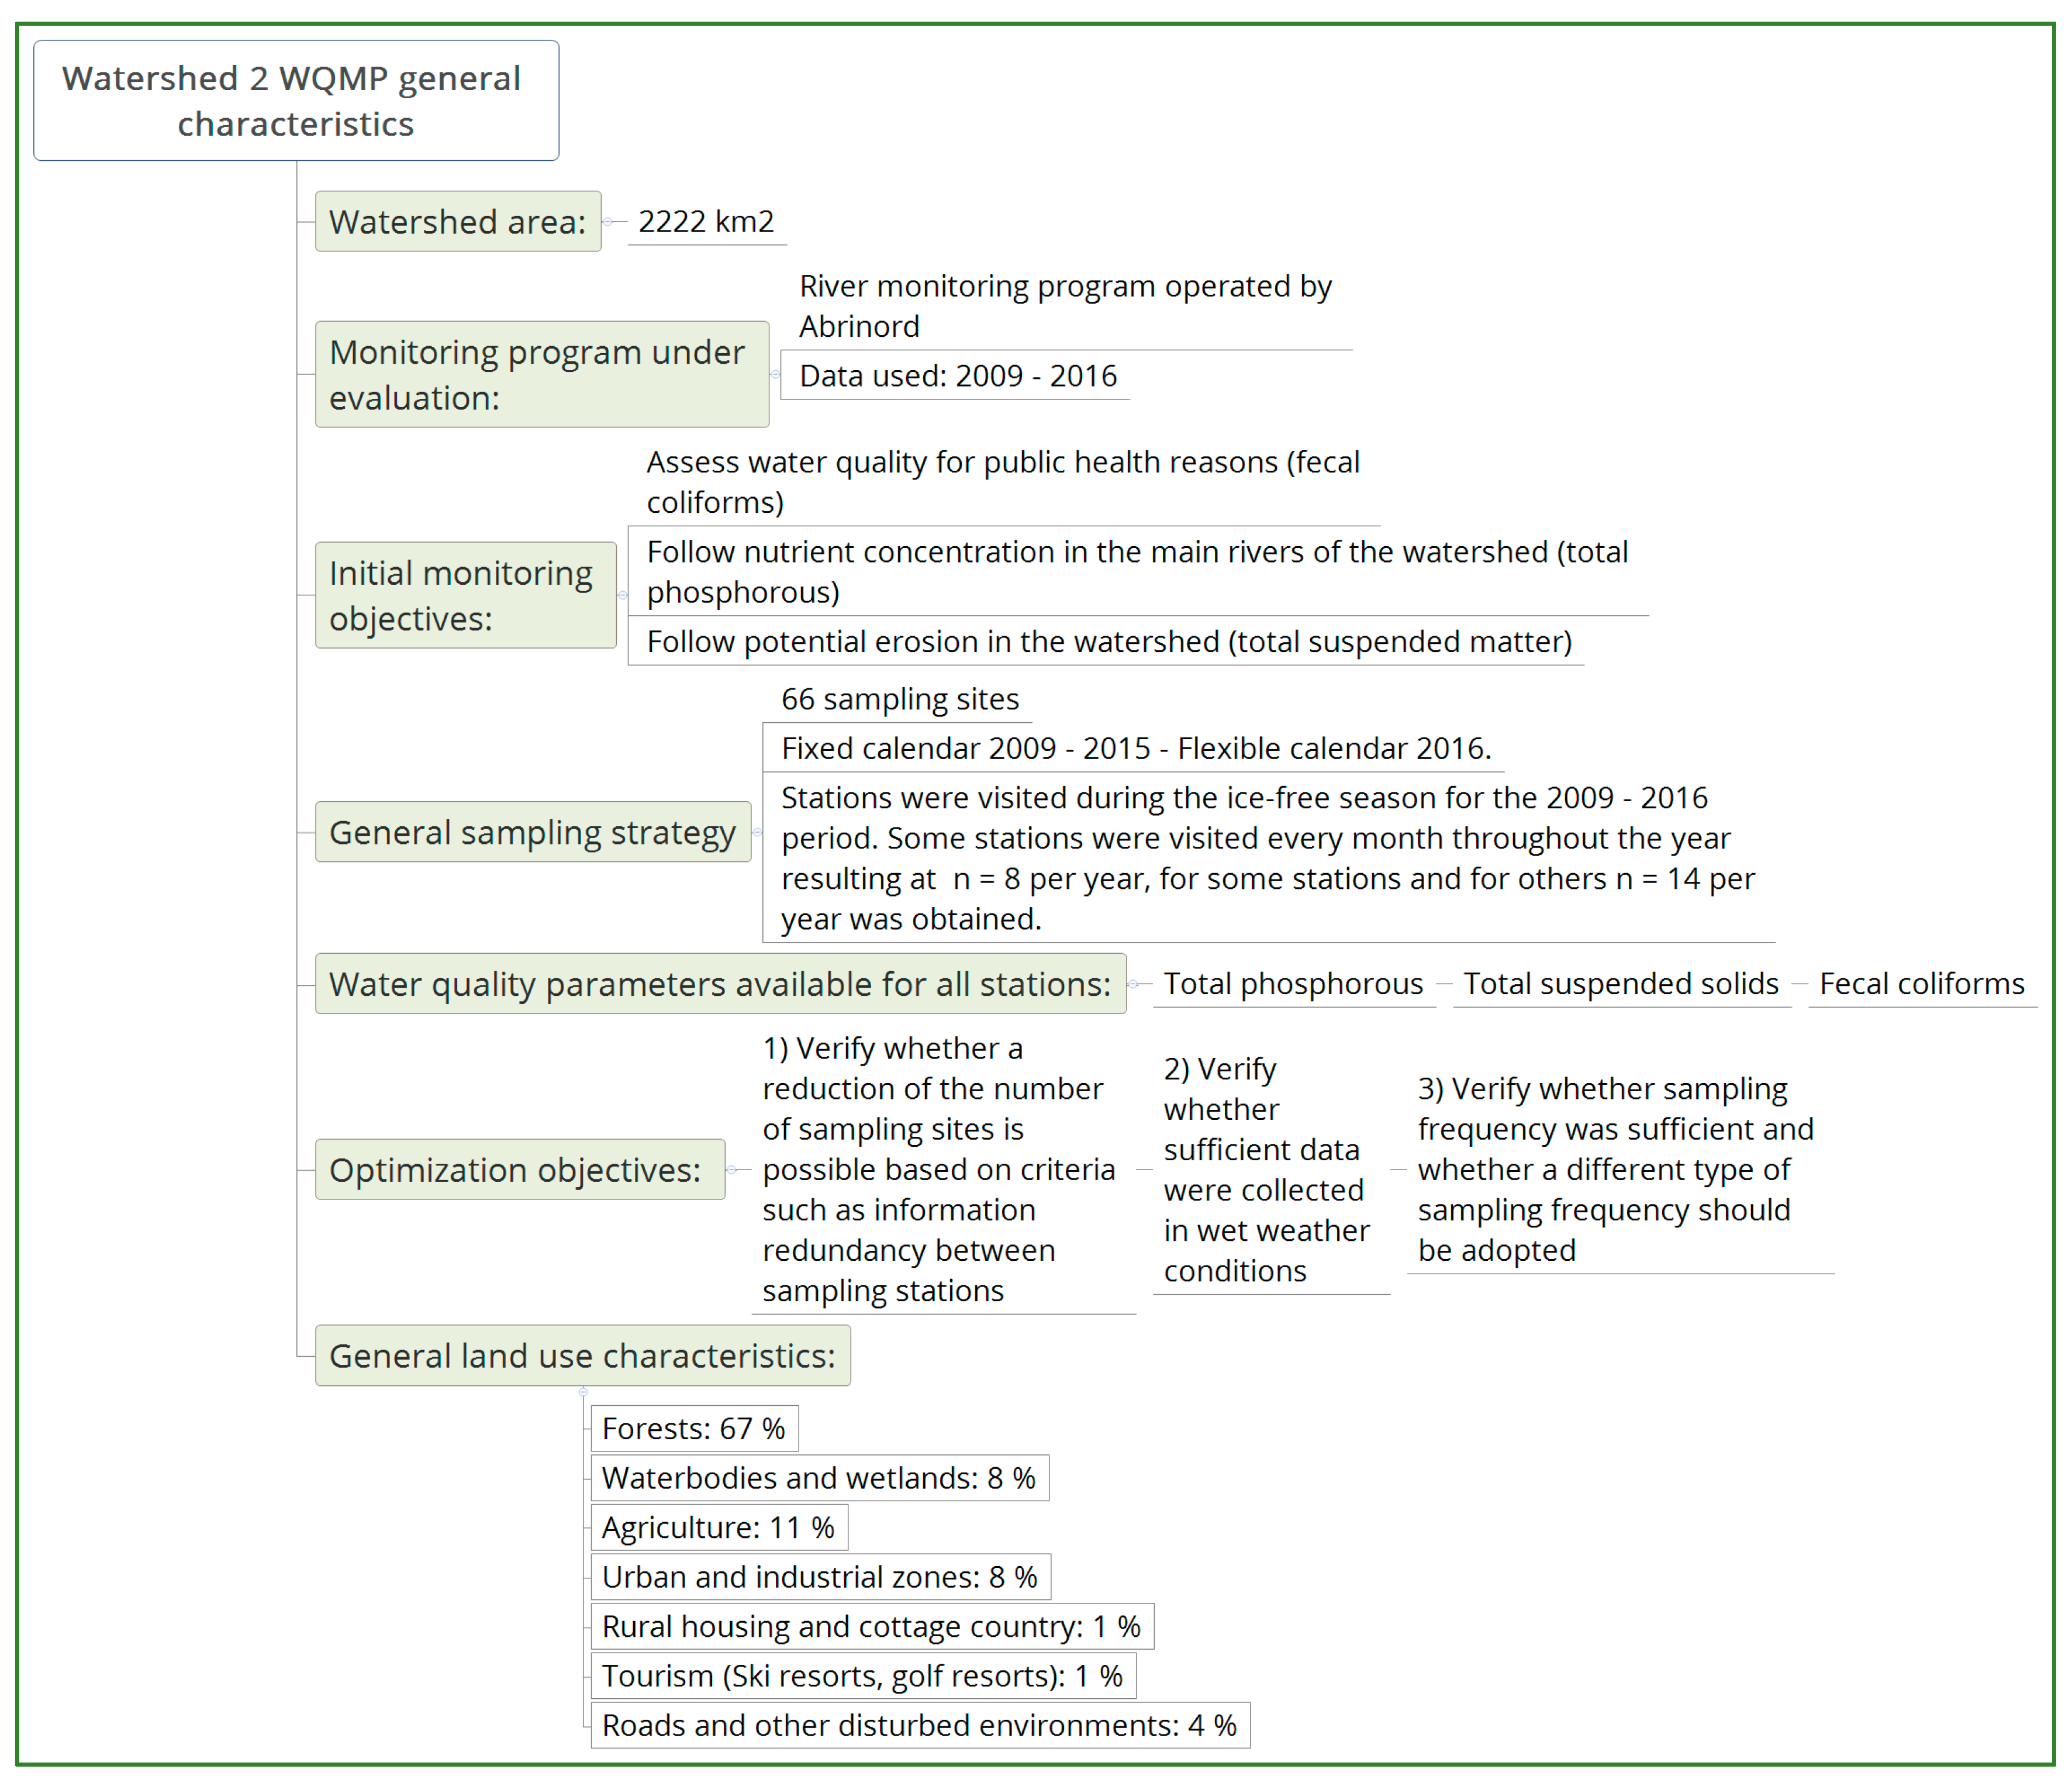
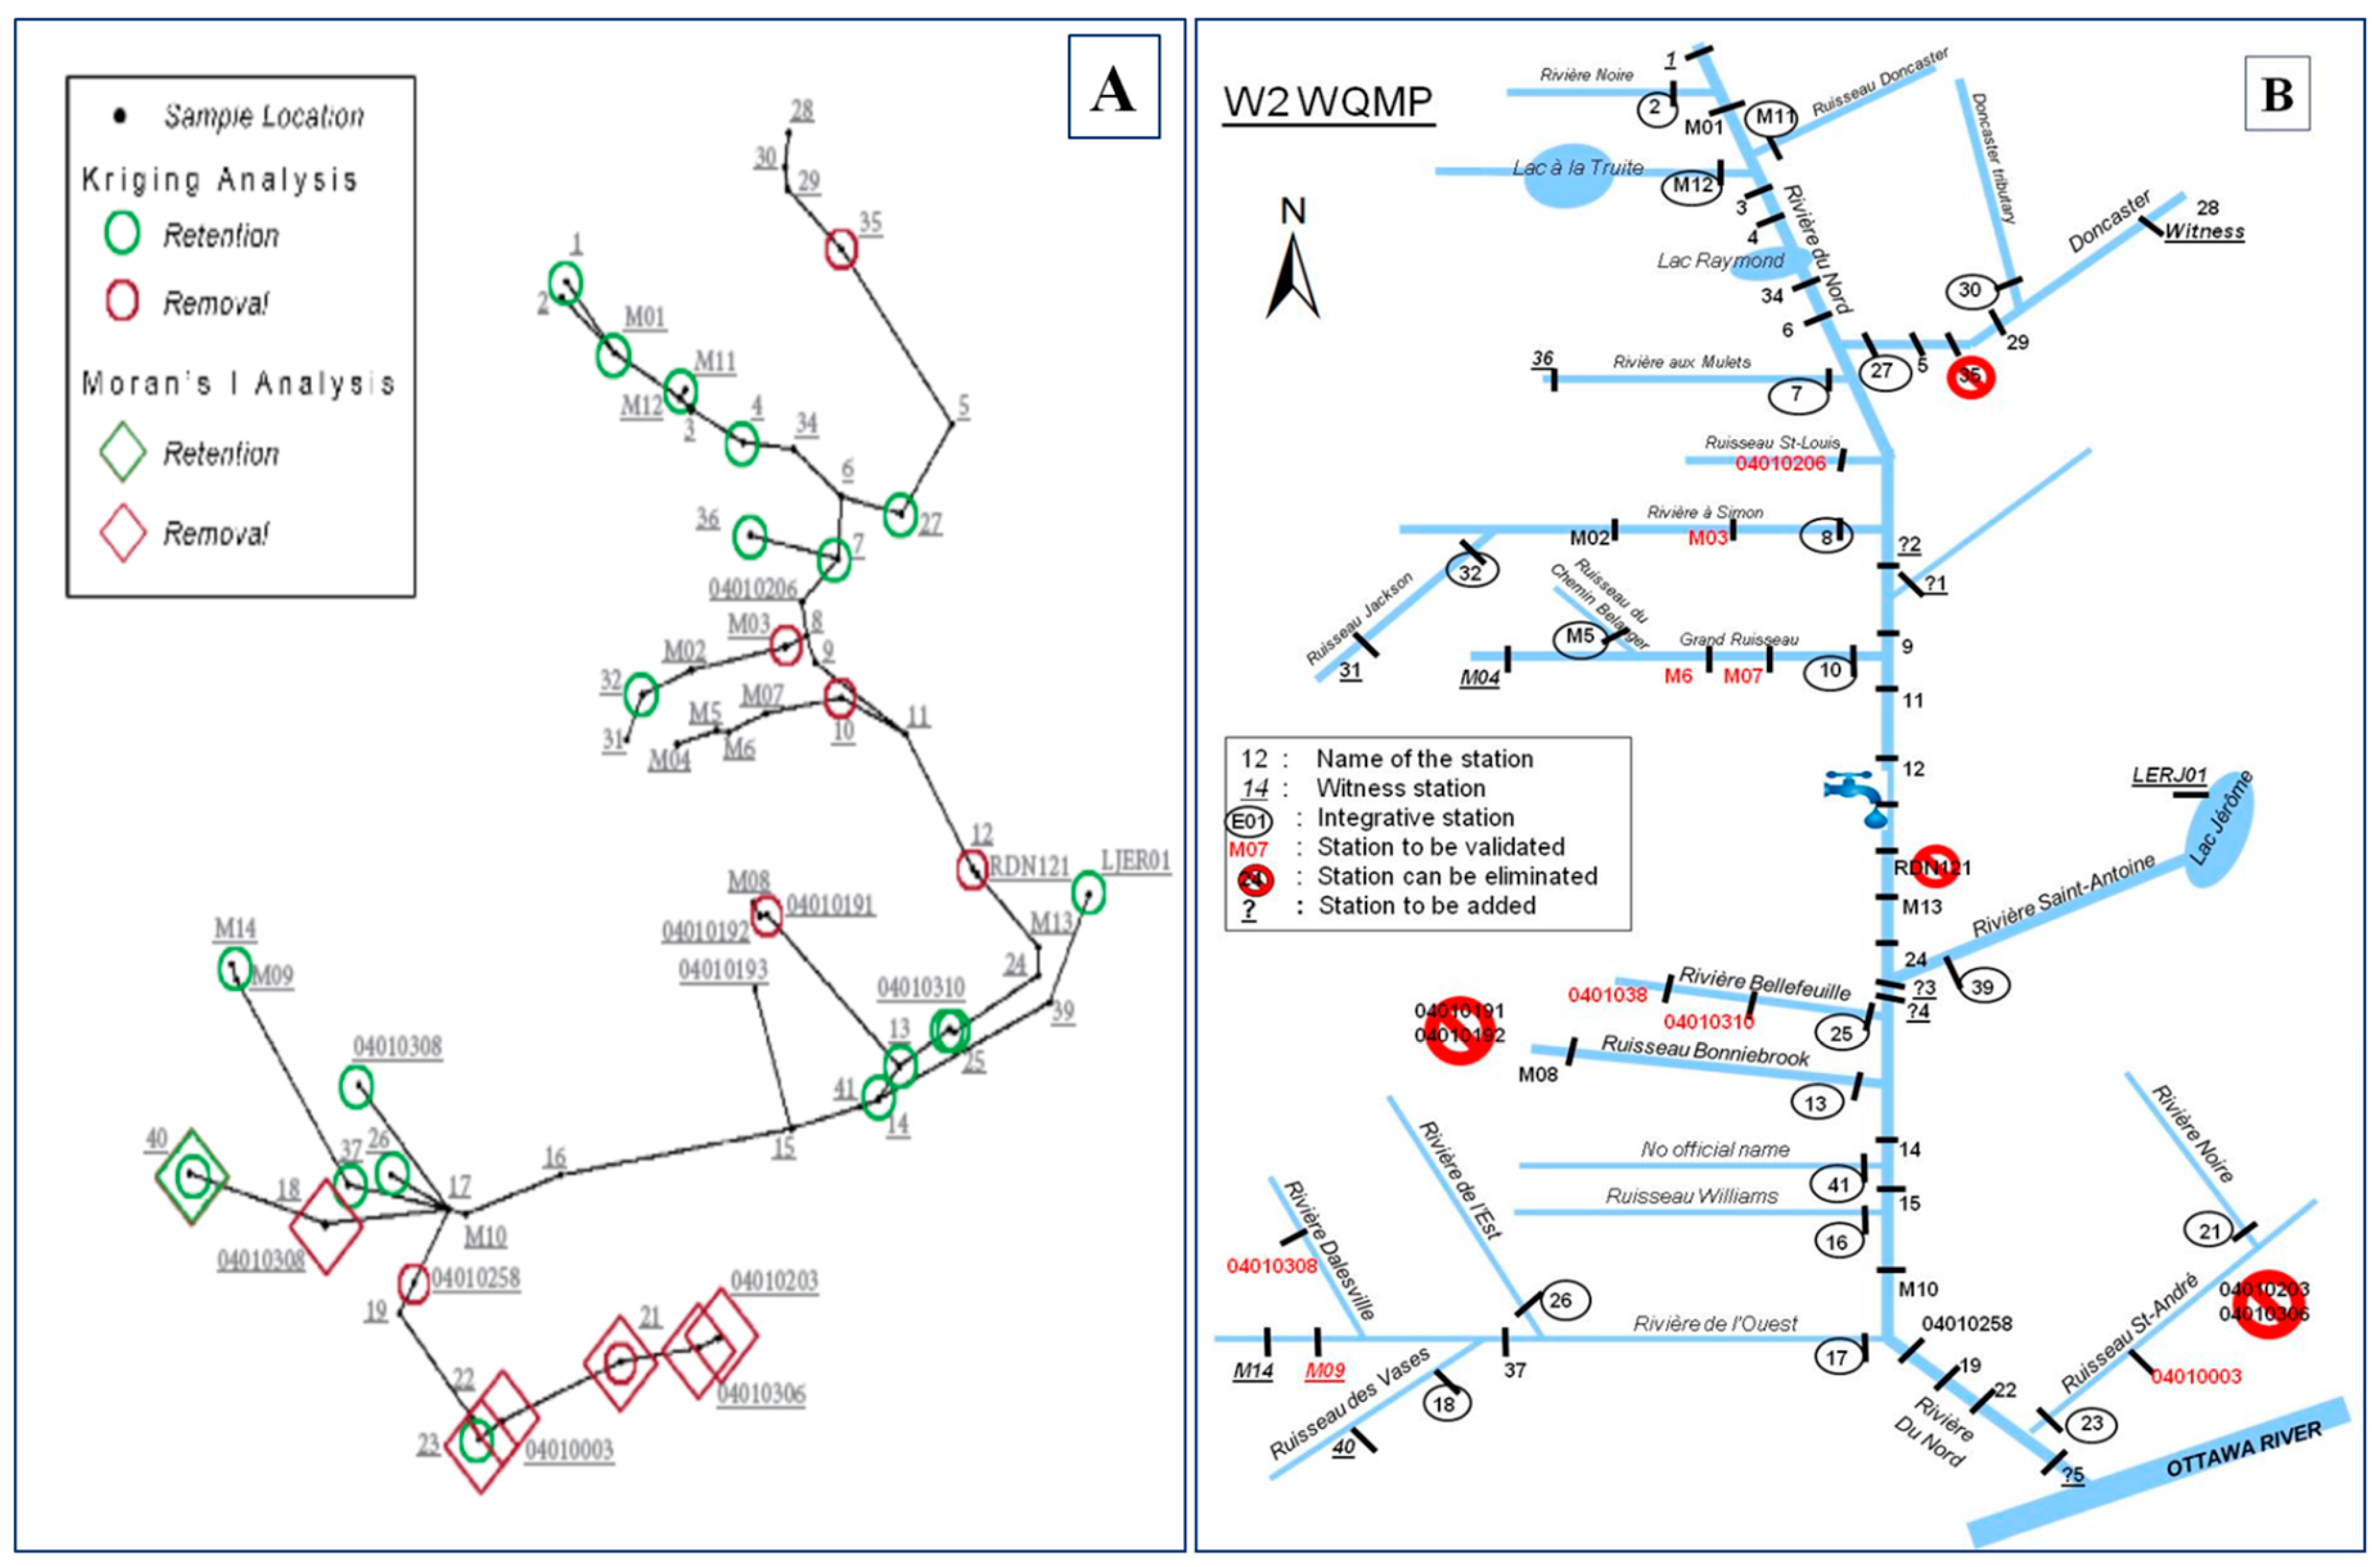
3.2. Optimization of the W2 WQMP - Results and Discussion

After the data validation and integration process, it was much easier to gain an overview of the W2 WQMP datasets and make choices concerning the optimization processes. For this WQMP, from 2328 sample contexts (sampling outings) taken on 66 stations, a maximum of 14 water quality parameters could be observed and field observations would include precipitation classes and ambient temperature. However, only for TSS, TP, FC and precipitation classes were sufficiently consistent data sets available for all these stations. The proportions of non-available data (NA) were only 6.4% (TSS), 7.2% (FC), and 18.4% (TP) respectively. The missing information on precipitation classes which could not be retraced represented 12.8%. Following validation with the WQMP managers, the optimization was conducted on these parameters and on all stations. The missing data were reconstructed with the package MissMDA with Software R—for further information consult Josse et al. [32] and Josse and Husson [33]. The optimizations procedures proposed by Beveridge et al. (2012) and Levine et al. (2014) were then applied to these data sets.
For the W2 WQMP, the results on the optimization question, verify whether a reduction of the number of sampling sites is possible based on criteria such as redundancy of information between sampling sites, are illustrated in Figure 10A. Figure 10B illustrates the sampling site network after having applied the first series of questions, as discussed in Section 2.5. The results of this step suggest that four of the seven stations proposed for removal by the Kriging analysis could indeed be removed: stations 35, RDN121, 04010191, and 0401010192. For stations 21 and RDN121, information between the upstream and downstream stations was sufficient to obtain a picture on water quality, making these section stations unnecessary. Stations 04010191, and 0401010192 are tributaries to a lake and do not contribute any information to the river sampling site network. Other stations proposed for removal, such as M03 and 10, should be maintained as they are integrative stations. Station 04010258 should also be maintained as it is an important river section according to the justification provided (water quality downstream from the City of Lachute). Stations suggested by Moran’s analysis, 04010308 and 04010003 require further validation prior to removal. Stations such as 21 and 23 should be kept, as they are integrative stations. Stations 04010203 and 04010306 can effectively be removed as no justification is available. As for the stations to be suggested for conservation by both analysis types, some should indeed be kept, but some more actionable tasks for a final decision are necessary (Table 2).
A total of five stations were suggested for a definitive removal. However, at least four stations (?1, ?2, ?3 and ?4) should be added. Their location can be consulted in Figure 10B. Station ?1 should be located on a tributary that drains an area where a ski resort and a golf course are located. Given the fact that sampling site 9 serves to verify these impacts, the outflow of this tributary should be known. Station ?2 should be added to determine water quality from Rivière du Nord upstream from this tributary. Station ?3 would be a station to be added to obtain information on the influence of Rivière Saint-Antoine. Ideally, there should be a station downstream of the Rivière Saint-Antoine inflow (upstream from the wastewater treatment plant of the city of Saint-Jérôme) and downstream of the wastewater treatment plant (station ?4). A final station (?5) could be added, but accessibility and mixing are an issue. This station would be downstream of the Ruisseau St-André inflow, in order to obtain an integrative station for the Rivière du Nord river (station ?5).
Table 1 provides a summary of the actionable tasks still necessary for final decision making regarding the W2 WQMP. For instance, the verification of whether sufficient data is available during rain events (already considered an optimization objective). This also applies to the actionable task: Verify whether the sampling frequency was sufficient and whether a different type of sampling frequency should be adopted. Several other tasks are proposed, such as verifying whether the stations are representative of the goals pursued and whether mixing is assured. Some of the tasks must be applied to all stations, others are specific to n stations. Table 2 is a summary of a detailed dashboard table of actionable tasks to be provided by the IDSS.
The IDSS will provide further decision support for the actionable tasks. In the case of the two actionable tasks already identified as optimization objectives, the IDSS proposes analysis methods provided in the literature.
In order to answer the question as to whether sufficient data was available during rain events, it was necessary to verify under which rain event modality a difference in concentrations of the retained water quality parameters FC, PT and TSS could be detected. The results presented in Table 2 show that there is no difference between the concentrations of FC, PT, and TSS between the rain modalities 1- rainfall the same day and 2- rainfall 0-24 h prior to sampling. It may be assumed that the peak concentrations for each of these three water quality parameters are attained in rain event modality 3 (rainfall 24-48 h prior to sampling). The difference detected between modalities 2 and 3, as well as 3 and 4 supports this hypothesis. Therefore, rain events can be considered as defined in modality 3.
The number of samples necessary to capture such a rain event can be estimated through a Power test. This test provides an estimation of the number of n required in order to be able to observe a difference between rain event modalities (if there is one), with a defined threshold and a defined probability. The decision on the standard deviation, the probability and the time period for which the WQMP manager wishes to obtain the information on detecting effects of rain events must be supported by the IDSS. For instance, the decision on the standard deviation could be based on water quality classes for each observed parameter. An example would be fecal coliforms. The water quality classes provided by the Ministry of the Environment of Quebec have six classes for this parameter: ≤200 UFC/100 mL (good), 200–1000 UFC/100 mL (satisfactory), 1001–2000 UFC/100 mL (doubtful), 2001–3500 UFC/100 mL (bad), >3500 UFC/100 mL (very bad) [34]. Therefore, a standard deviation, which one would want to observe, is one where classes are changed. This is not an easy decision to make and could be considered as a biased decision, thus undermining the credibility of the WQMP. A suggested compromise would be to obtain an equal amount of samples for each modality of rain event for which differences were detected. This would result in the IDSS suggesting, as is the case here, to aim for 50% of modalities 0, 1, 2, and 4 and 50% of modality 3.
The second actionable task (Table 3): Verify whether the sampling frequency was sufficient and whether a different type of sampling frequency should be adopted, leads to the application of a general linear regression with standard error test [4] for each variable at seven stations over the entire sampling period (2009–2016).
The results show that for all these stations and for all three water quality parameters, the sampling frequency (8 to 14 per year) should not be reduced. Stations 22 and 23 are visited more frequently than stations 1, 12, 17, and 21. An equal sampling frequency of all stations should be considered if the objective is to obtain a global picture.
The recommendations for the W2 WQMP are:
  • Maintain the global WQMP of W2 according to the recommendations presented in Figure 10B,
  • Collect samples in 50% of rain events (modality 3),
  • Obtain at least 10 samples for each of these stations per year,
  • Respond to the actionable tasks in Table 2, with the priority of adding an integrative (and affordable) parameter such as specific conductivity to respond to the knowledge needs on road salts and other contaminations and identify other parameters that can be financed (the WQMP can still be pursued while these tasks are completed),
  • Consider adding rotating WQMPs for the subwatersheds (more stations, more water quality parameters and a higher sampling frequency.
Through two different types of analysis (Kriging and Moran) proposed in the literature [5,6] to evaluate a river station network, it was possible to suggest stations to be retained or removed for the W2 WQMP. The IDSS was then solicited to submit the suggested stations to another series of questions on the sampling stations, such as sampling site justification, specific monitoring objectives for these sites, etc. Submitting the results of this analysis to further decision resulted in a final set of decisions to make, without consulting the manager of the WQMP.
Actually, the Kriging and Moran analysis requires quite some level of expertise in statistical analysis [7]. When an expert in statistics is not available, the watershed manager who uses the IDSS could skip the analysis and be guided through a series of questions on the IDSS and still make a valid decision, even if not as well documented as the one made available through the process of using statistics.
The IDSS was based on expert input on the type of questions and decisions which have to be made during the planning, management, and optimization of a WQMP. Regardless of the guideline, handbook or method based on geographical information systems, statistical analysis methods, etc. used, there is still a need for expert input. In order to standardize and capture the expert input, the type of expert input required for these decisions was integrated into the IDSS. The optimization of the two case-study WQMPs showed that expert input was required and that it was also possible to use the IDSS instead of this expert input, as it is not always certain that the knowledge on these issues could be adequately transferred within the organization or to these organizations. The advantage of using the IDSS is that there are some standardization and documentation possible for this expert input. As the system was designed to evolve, it is possible to add additional questions and decision problems to the system. The field of WQMPs is evolving rapidly and decisions must be made on new types of water quality analysis strategies (e.g., continuous monitoring devices and their challenges of positioning the apparatus, cleaning the data, etc.).

4. Conclusions

A major issue in WQMPs is ensuring that decisions related to planning, management, and optimization follow some standard procedure and that decision making is guided by a set of questions that lead to a certain standardization or at least render the decision steps transparent to the people working for the WQMP. In this paper, we have strived to demonstrate how an IDSS connected to a database (EnkiTM) can significantly contribute to the challenge of optimizing WQMPs. We were able to show this for several steps of the optimization process:
  • Understanding the initial WQMPs
    The questions asked by the IDSS are crucial to understanding the rationale of the WQMPs. Having a firm set of questions and documented answers contributes to transferring the information on the WQMP within an organization and communicating the information to the public, partners, and decision-makers.
  • Decision support in data validation and integration (storage) process (quality assessment and storage)
    The optimization of a WQMP is based on the data of the existing WQMP and the underlying decisions which led to the WQMP, as well as considerations such as possible changes that have occurred over time in the WQMP. All this information needs to be documented with the appropriate metadata for convenient retrieval when optimizing a WQMP.
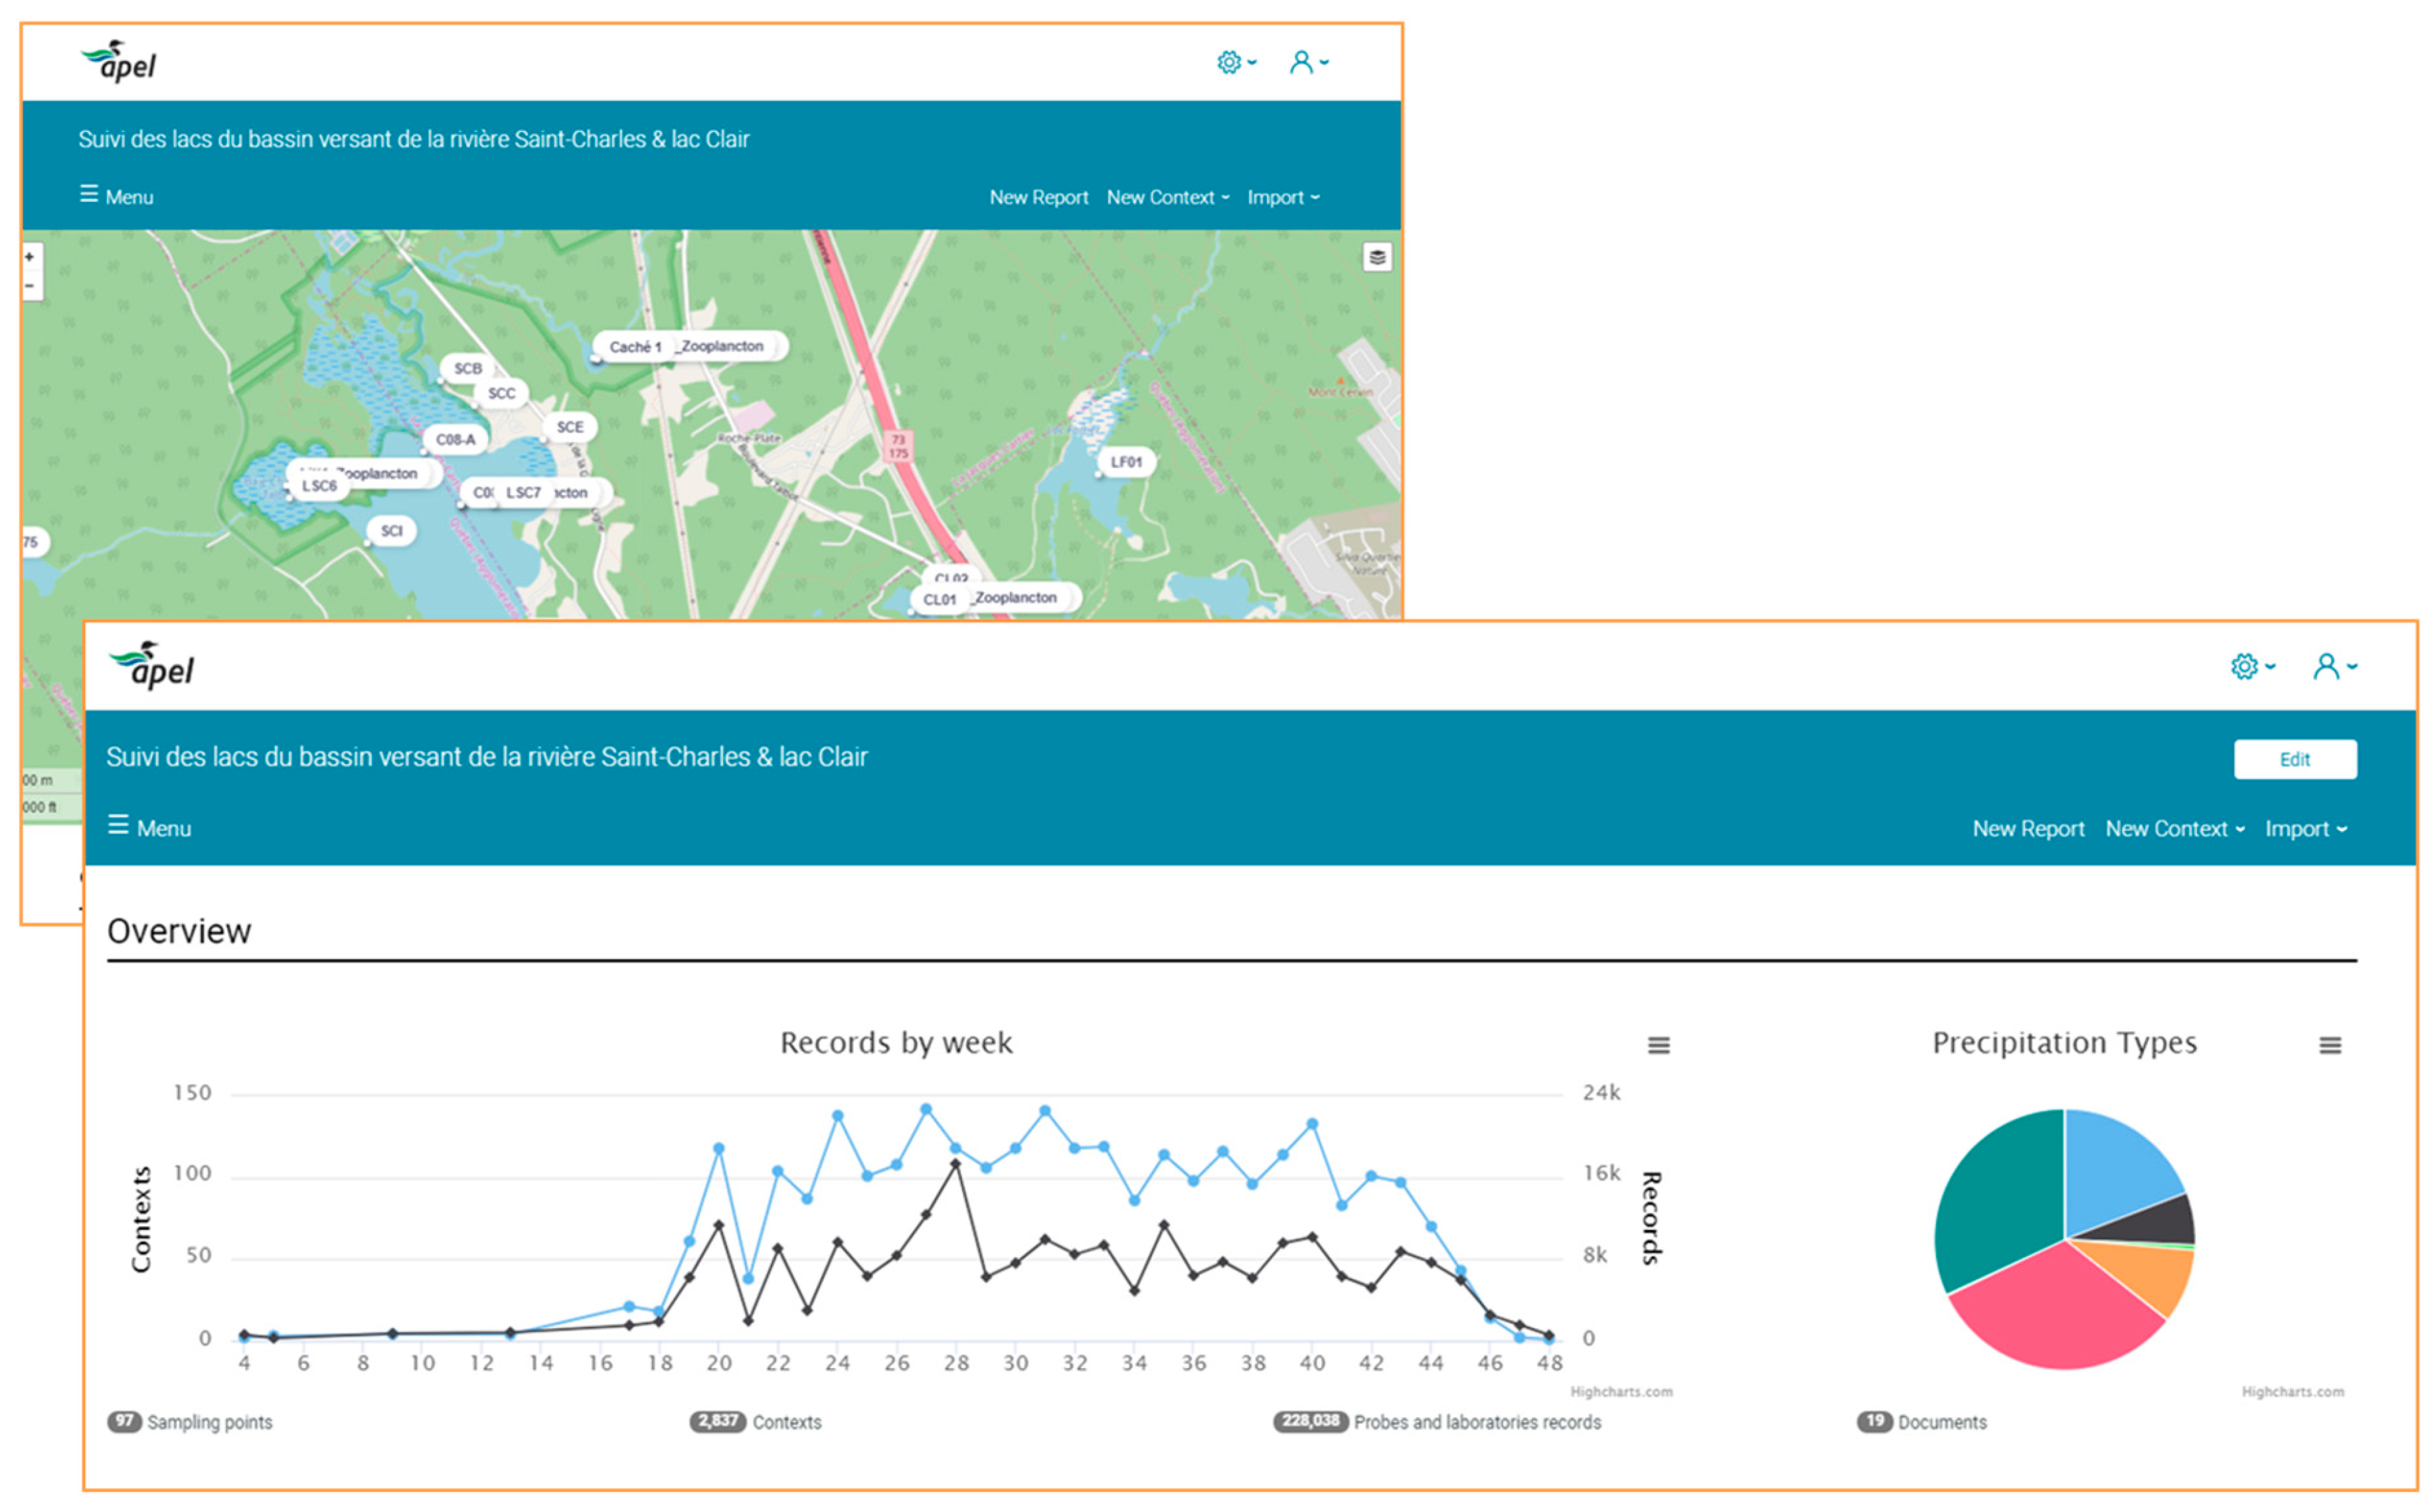
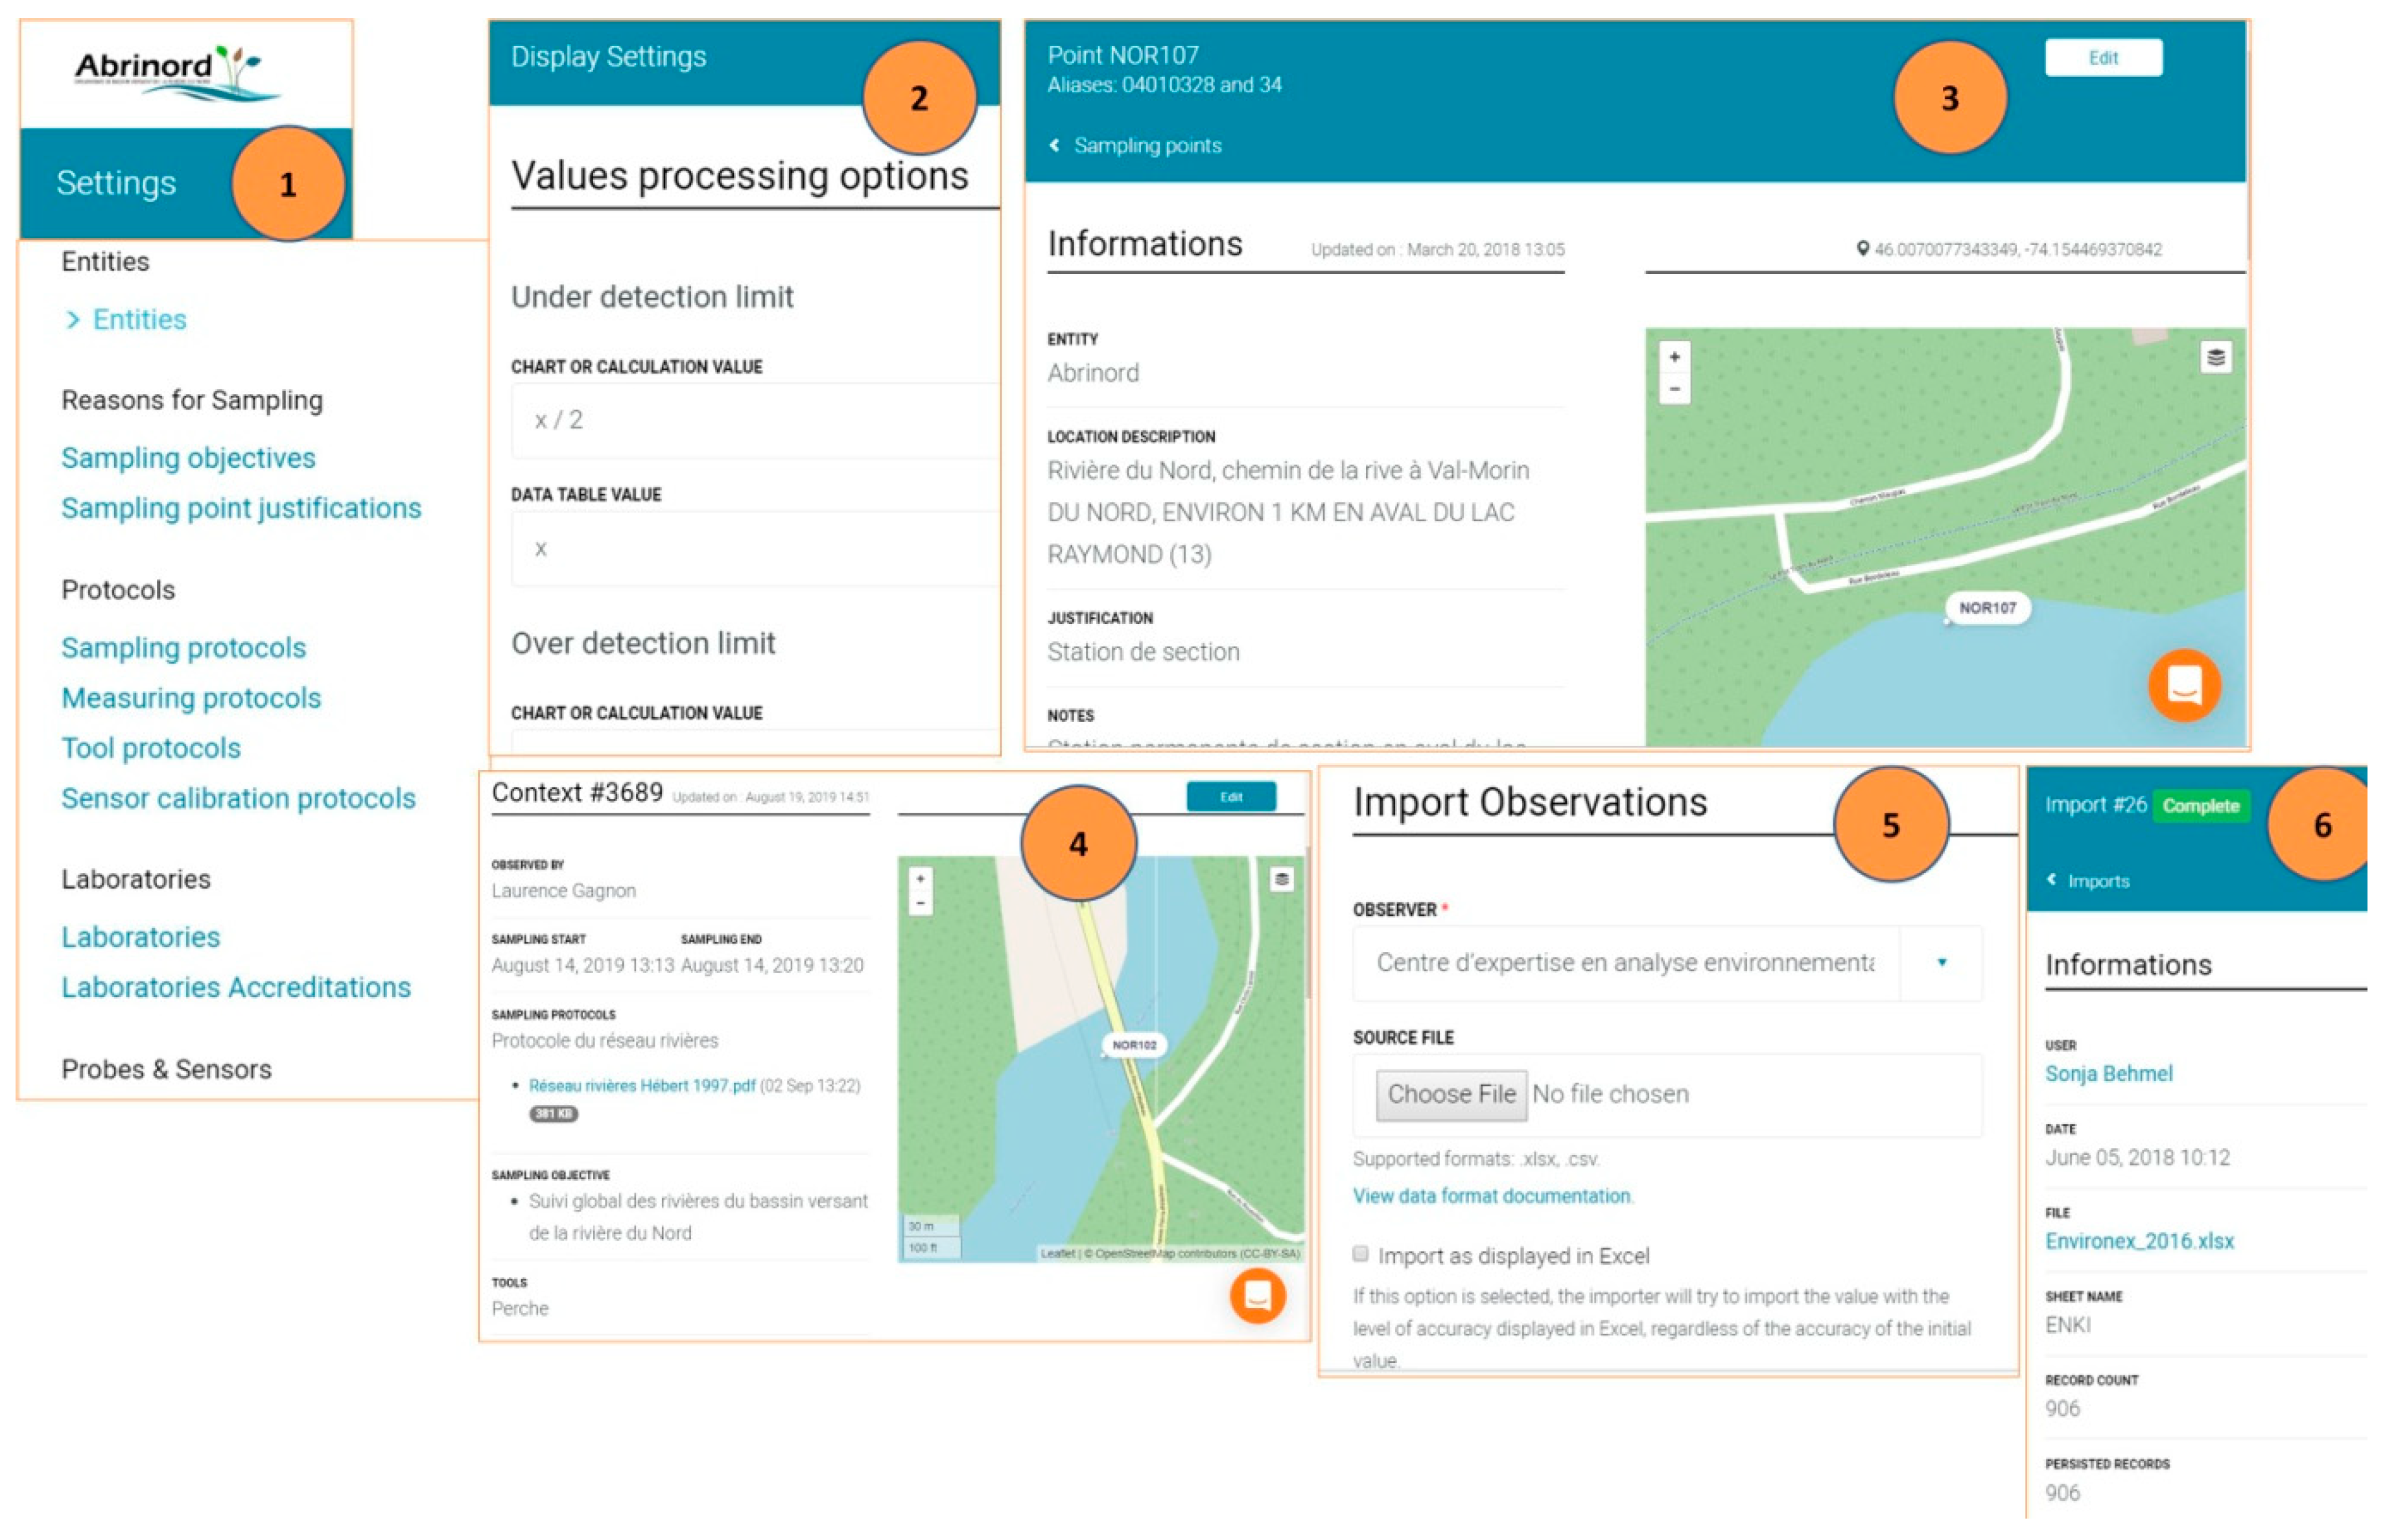
    The integration process of all the existing data of the case studies into the database Enki™ connected to the IDSS was key to understanding, documenting and relating information on sampling sites, sampling contexts, measured parameters, and geographical information. The integration process also showed where changes in the WQMP were made, and why. In several cases, some of these changes can affect the continuity in the available data series and the conclusions to be drawn from the data sets. On the other hand, it was very difficult to retrieve the information on why these changes were made since the staff in charge were not always available. Therefore, there is a need for a system to be able to support and document these decisions.
  • Selecting optimization procedures proposed in the literature
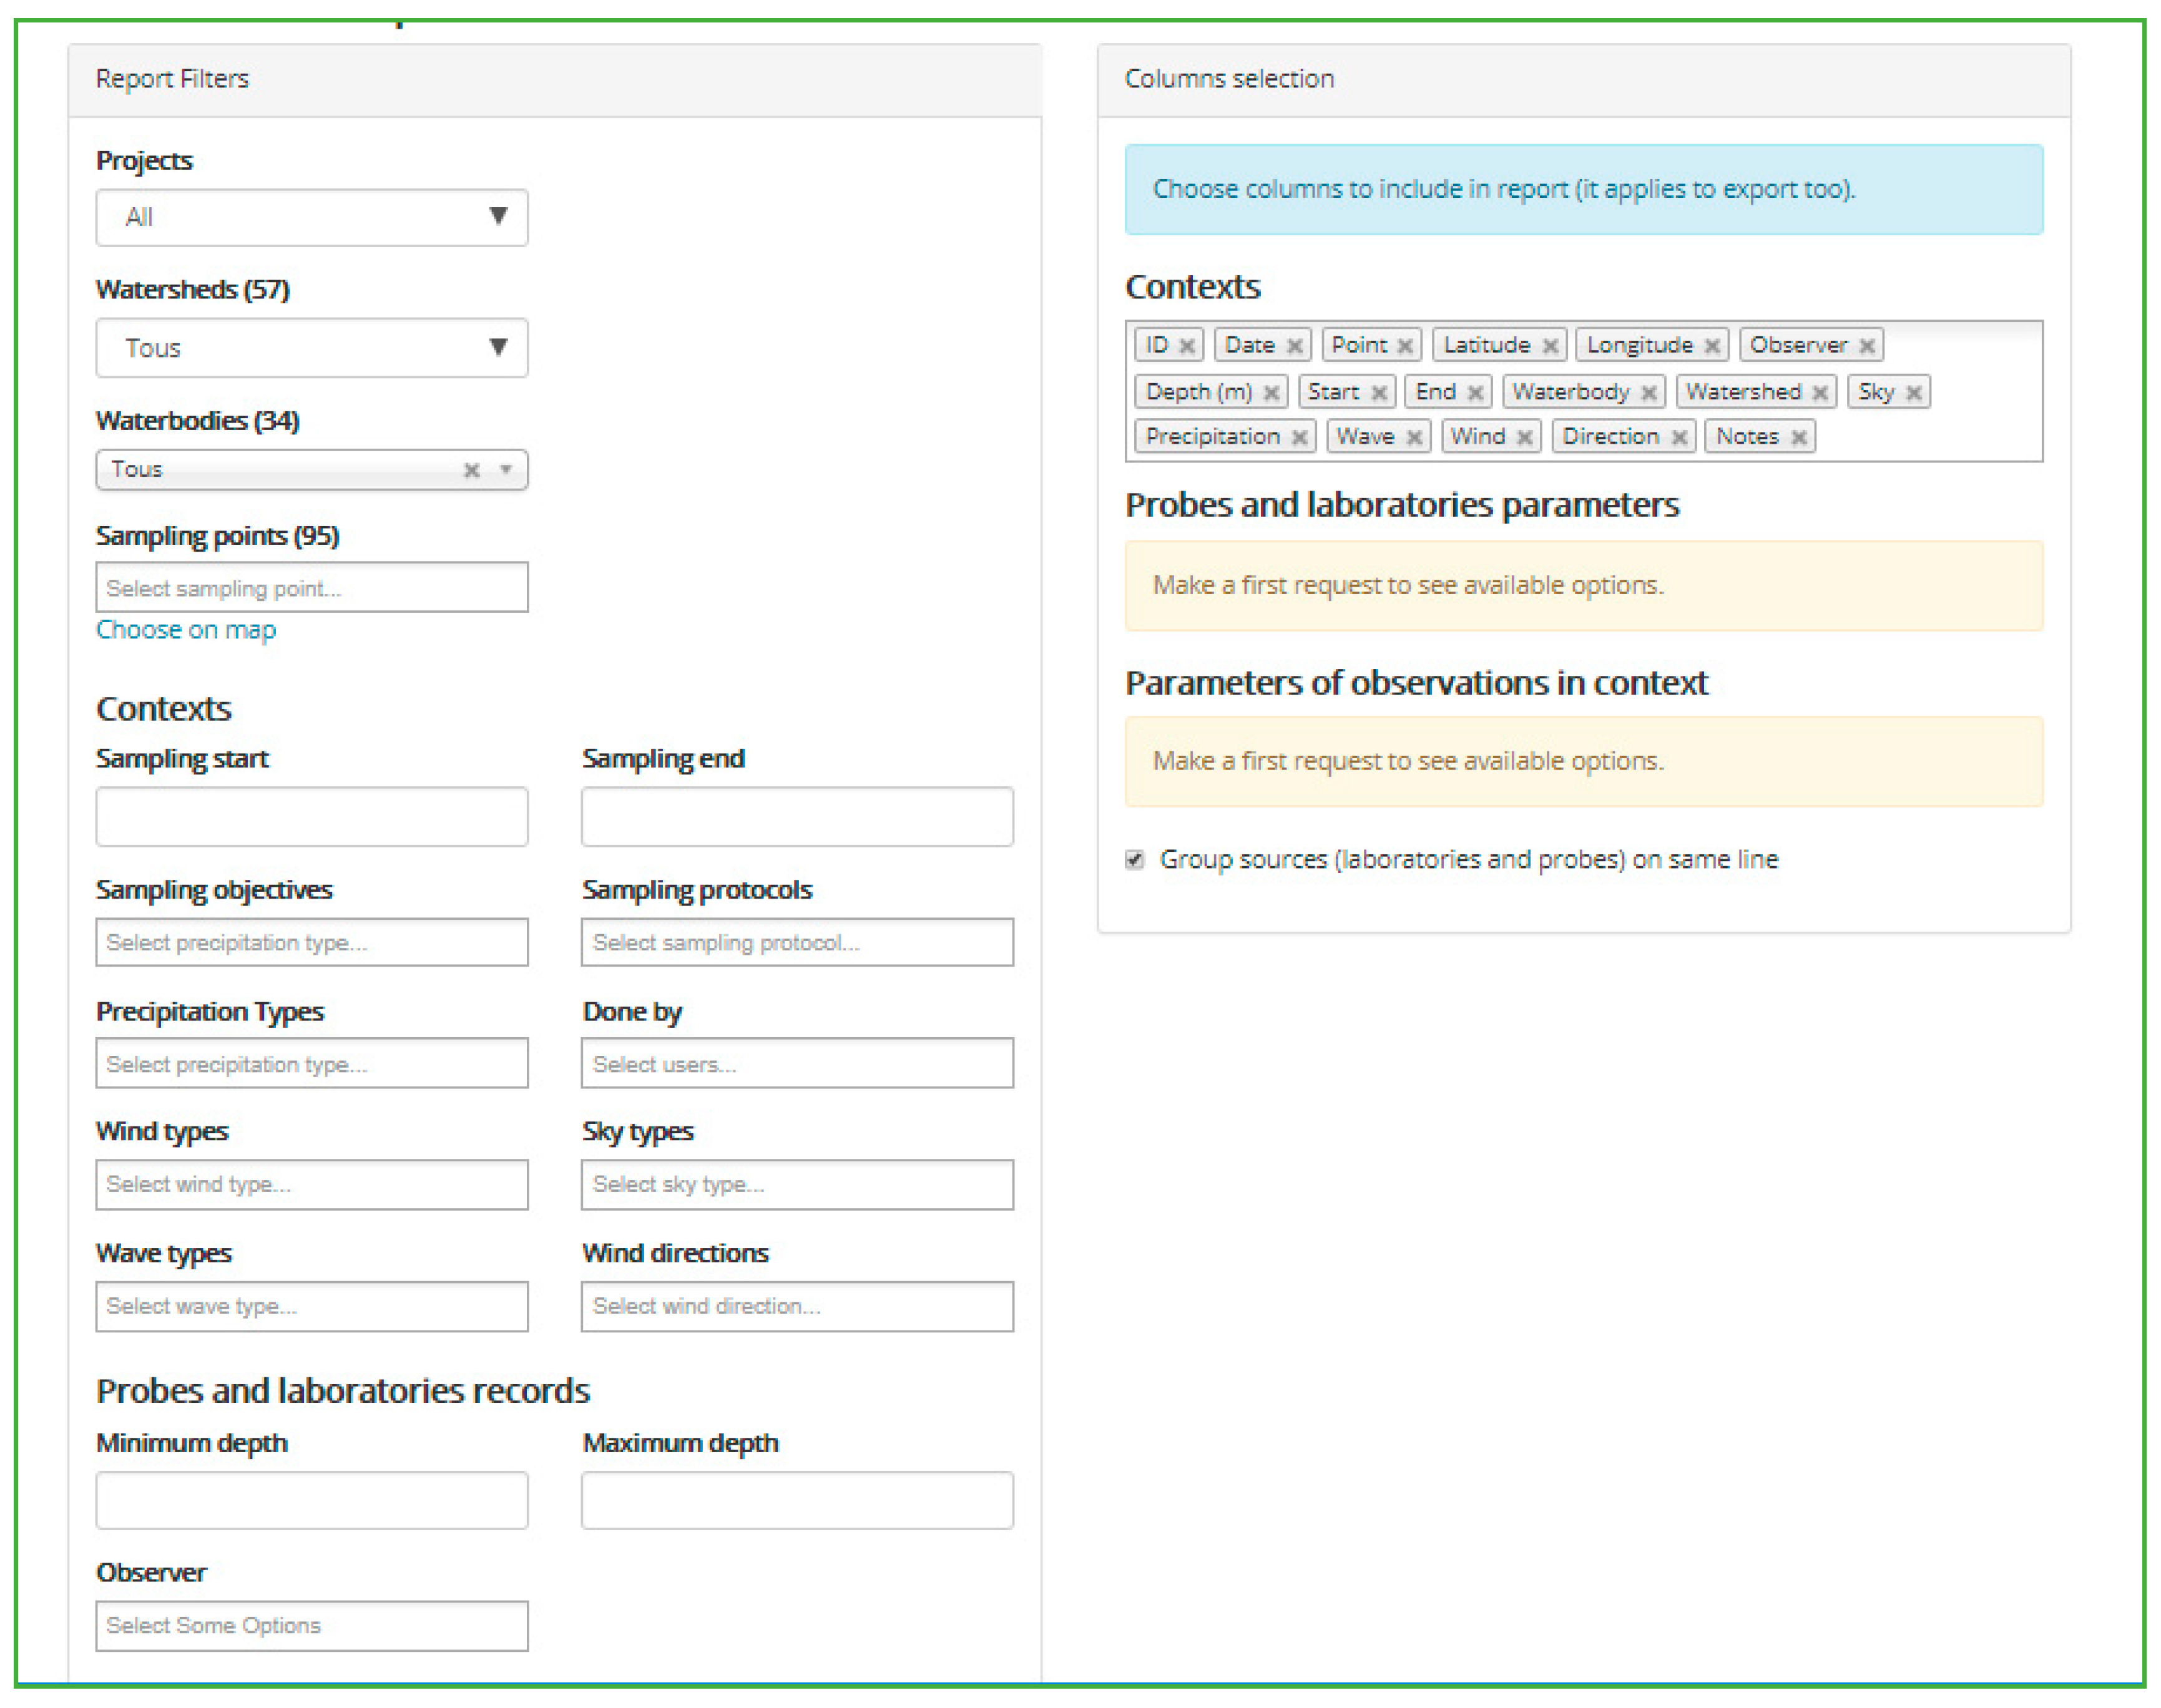
    The IDSS proposes specific optimization procedures (methods) proposed in the literature that correspond to specific optimization objectives. The IDSS was constructed to propose these methods for specific optimization objectives and provide support in applying the optimization procedures.
  • Contribution to applying the optimization procedures
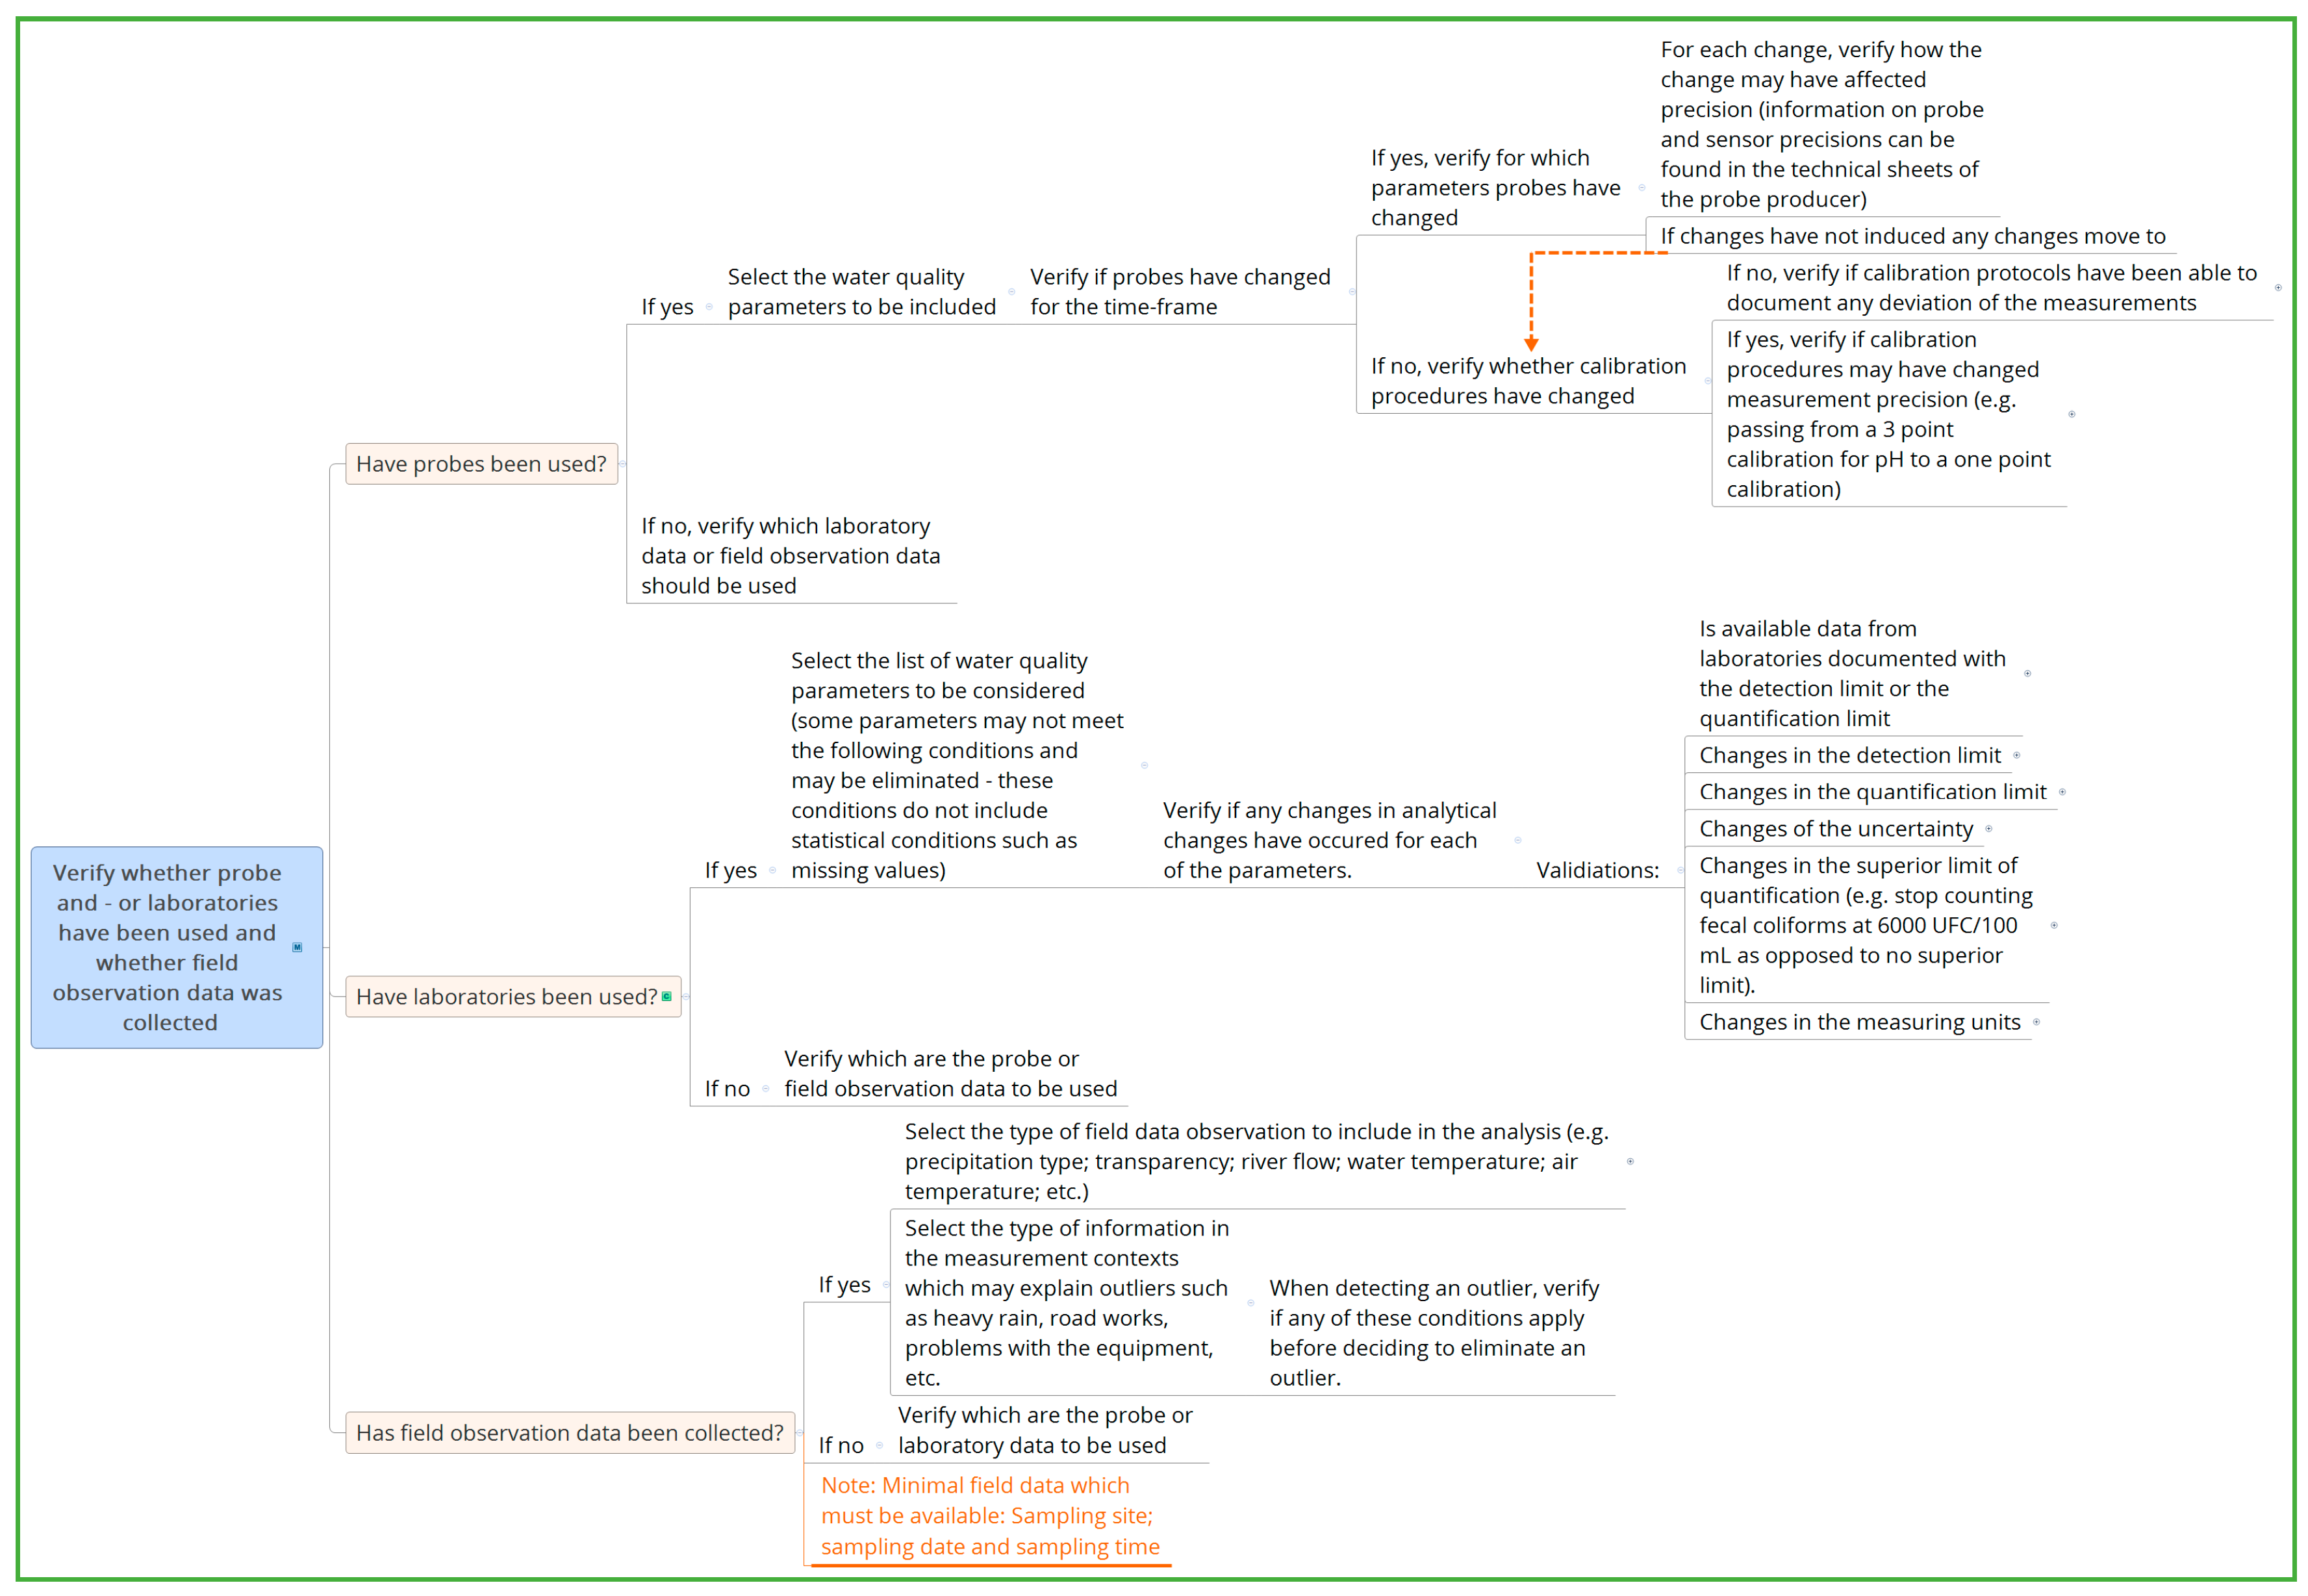
    In the course of the application procedures, specific questions arise concerning the data sets. The IDSS connected to the database is able to provide a quick answer to these questions, such as variation in laboratories and data precision, changes in field protocols, changes in data series for a specific sampling site.
  • Decision support (replacing experts) to finalize the optimization procedure
    This step provides very crucial additional decision support. Indeed, in all optimization methods proposed in the literature, expert input is necessary to take final decisions regarding sampling. The IDSS was designed for this task and can be used, whether or not a statistical optimization method has been used. However, it was shown that the results of an optimization method provide a very good starting point for these questions and support the justification of the choices made.
  • Data-driven decision support to redesign WQMPs
    We were able to show that the database EnkiTM, the onboarding process and the decision support provided by the IDSS were instrumental in redesigning the WQMPs of our two case studies. A solid data and metadata management system are crucial to the IDSS, and cannot be separated without losing efficiency and accuracy in the process.
To conclude, in this study we demonstrated that every WQMP needs a solid database for data management and decision making. In addition, an IDSS is necessary to take and document any type of decision during the planning, management, and optimization phases in order to gain a clear idea of when and why changes are made and obtain actionable tasks in the optimization process that are documented and monitored by dashboards.
Several of the features of the IDSS were already implemented, and others can now be implemented since the decision-support trees were tested through the case studies. The next steps are to continue the implementation to respond to the other optimization objectives set through the participative approach [8].

Author Contributions

Conceptualization, S.B.; Methodology, S.B.; Software, S.B.; Validation, S.B., M.D., M.R. and R.L.; Formal Analysis (Statistics), M.D.; Investigation, S.B.; Resources, M.R.; Data Curation, S.B. and M.D. Writing-Original Draft Preparation, S.B.; Writing-Review & Editing, S.B., M.R., R.L.; Visualization, S.B.; Supervision, M.R. and R.L.; Project Administration, M.R.; Funding Acquisition, M.R.

Funding

This research was funded by Natural Sciences and Engineering Research Council of Canada (NSERC) through the Research Chair in Drinking water of Université Laval.

Acknowledgments

We would also like to thank APEL (Associaton pour la protection de l’environnement du lac Saint-Charles et des Marais du Nord) and (Abrinord) Organisme du bassin versant de la rivière du Nord for their implication in developing and testing the IDSS.

Conflicts of Interest

The authors declare no conflict of interest.

Abbreviations

AbrinordOrganisme de bassin versant de la rivière du Nord
APELAssociation pour la protection de l’environnement du lac Saint-Charles et des Marais du Nord
FCFecal coliforms
IDSSIntelligent decision support system
IWMIntegrated watershed management
TSSTotal suspended solids
TPTotal phosphorous
PPGISPublic participation geographical information system
W1Watershed 1 = Watershed of the Saint-Charles river
W2Watershed 2 = Watershed of the rivière du Nord
WQMPWater quality monitoring program

Appendix A

  • Use of Beveridge’s et al. [13] methods to optimize the W2 WQMP: non-metric multi-dimensional scaling (NMDS), principal component analysis (PCA), Kriging, Moran’s Index and leave – one – out cross-validation.
First two multivariate analysis were applied: NMDS: add to the coordinate of each sampling station the distance to the outflow of the watershed and a PCA to associate to each station one or two factorials created from the concentrations of respectively PT, CF, and TSS for the complete data series (2009–2016). The amount of data (n) and the relation between the variables confirm the prerequisite of PCA, that of multi-normality and the linearity of the relations. Outliers are a source for distortion of these tests and were removed. Considering the missing values for PT, CF and TSS we chose not to reduce the data series, but we chose to select reconstruction of the missing data with the package MissMDA with R—for further information consult [26,27].
Second, we proposed several Kriging models ([30] with the objective to identify the sampling stations which are contributing the most to predict the spatial model of the watershed and the distribution of these stations. The quality of the models was judged on the comparisons of the standard error of the residues, the values of the adjusted R2, the significance of the model and the criteria of Akaike (Akaike information criterion—an estimator of relative quality of statistical models). We tested six models, and for each one and we chose to retain the following model:
Model   M 6 : L o g [ F C ] = L o g [ T S S ] × L o g [ T P ] × D i s t
where FC = Average Fecal coliform concentration, TSS = Average Total suspended solids concentrations, TP = Average Total phosphorous concentrations and Dist = distance in linear kilometers between each sampling station and the outflow of the watershed (W2).
For each model, we used the spatial distribution of the residues of the leave-one-out cross-validation to visualize the increase in the variance of the residues of the model when they are removed. These stations are then considered as important, as their removal harms the model. On the other hand, stations for which the retrieval does not harm the model (cause little or no variance) are considered as those for which the information is redundant and which are suggested for removal [8].
Finally, we also calculated for each pair of stations the Moran Index and the associated Z score. After several tests, we retained the method called Minimum Spanning Tree, which proposes a structure were the sum of the distances between stations is minimal. Some relations were modified in order to obtain a representative relationship between the stations and the hydrographic network. The Z scores based on the Moran Index calculated on this structure provides an indicator of the redundancy of information between two or more neighboring stations. For each station, a score Z ≤ −1,96 translates to a strong dissimilarity between a station and its neighbouring stations. A score of Z ≥ 1,96 indicates a strong redundancy of the values of one station and its neighbouring stations [29].
For the optimization objective, verify whether sampling frequency was sufficient, we used the general linear regression for each of the variables for the entire sampling period (2009–2016) for the seven stations listed in Table 1 (method tested by [16]). In order to obtain a sampling effort of 50 %, we created two subsets of data for each station by choosing one date out of two from the original data set. To obtain a sampling effort of 33.33%, we chose one date out of three from the original data sets to obtain three data sets. The subsets were modelized and presented as linear regressions lines superposed on the model including all the available data. We used the ratio between the standard error of the model integrating all data and the standard error of the model integrating only a subset of the data (e.g., 50% set one, 50% set 2, 33.33% set 1, 33.33% set 2, and 33.33% set 3) as an indicator of the influence of subsampling on the dispersion quality of the model.

References

  1. Gerlak, A.; Lautze, J.; Giordano, M. Water resources data and information exchange in transboundary water treaties. Int. Environ. Agreem. Politics Law Econ. 2011, 11, 179–199. [Google Scholar] [CrossRef]
  2. Timmerman, J. The need for participatory processes and its implications for water management information. Reg. Environ. Chang. 2005, 5, 162–163. [Google Scholar] [CrossRef]
  3. Timmerman, J.; Langaas, S. Water information: what is it good for? The use of information in transboundary water management. Reg. Environ. Chang. 2005, 5, 177–187. [Google Scholar] [CrossRef]
  4. Fölster, J.; Johnson, R.; Futter, M.; Wilander, A. The Swedish monitoring of surface waters: 50 years of adaptive monitoring. AMBIO 2014, 43, 3–18. [Google Scholar] [CrossRef] [PubMed] [Green Version]
  5. Government of Western Australia. Water Quality Program Design: A Guideline to the Development of Surface Water Quality Programs; Department of Water, Government of Western Australia: Perth, Western Australia, 2009; p. 35.
  6. Strobl, R.O.; Robillard, P.D. Network design for water quality monitoring of surface freshwaters: A review. J. Environ. Manag. 2008, 87, 639–648. [Google Scholar] [CrossRef] [PubMed]
  7. Ward, R.C.; Loftis, J.C.; McBride, G.B. Design of Water Quality Monitoring Systems; Van Nostrand Reinhold: New York, NY, USA, 1990. [Google Scholar]
  8. Behmel, S.; Damour, M.; Ludwig, R.; Rodriguez, M.J. Water quality monitoring strategies—A review and future perspectives. Sci. Total Environ. 2016, 571, 1312–1329. [Google Scholar] [CrossRef] [PubMed]
  9. Harmancioglu, N.B.; Fistikoglu, O.; Ozkul, S.D.; Singh, V.; Alpaslan, M.N. Water Quality Monitoring Network Design; Kluwer Academic Publisher: Dordrecht, The Netherlands, 1999; p. 290. [Google Scholar]
  10. Clark, J.M.; Schaeffer, B.A.; Darling, J.A.; Urquhart, E.A.; Johnston, J.M.; Ignatius, A.R.; Myer, M.H.; Loftin, K.A.; Werdell, P.J.; Stumpf, R.P. Satellite monitoring of cyanobacterial harmful algal bloom frequency in recreational waters and drinking water sources. Ecol. Indic. 2017, 80, 84–95. [Google Scholar] [CrossRef] [PubMed]
  11. Tennakoon, S.B.; Ramsay, I.; Marsh, N.; Connor, R.O. The Integrated Monitoring and Assessement System (IMAS): A Decision Support System for Water Quality Monitoring and Assessement Programs. In Proceedings of the 19th International Congress on Modelling and Simulation, Perth, Australia, 12–16 December 2011; pp. 3532–3538. [Google Scholar]
  12. Behmel, S. Proposition d’un Programme de Suivi de la Qualité de l’eau à L’échelle du Bassin Versant de la Rivière Saint-Charles. 2010. Available online: http://www.apel-maraisdunord.org/apel/assets/Simon-Magnan-Essai-Maitrise.pdf (accessed on 28 September 2019).
  13. Beveridge, D.; St-Hilaire, A.; Ouarda, T.B.M.J.; Khalil, B.; Conly, F.M.; Wassenaar, L.I.; Ritson-Bennett, E. A geostatistical approach to optimize water quality monitoring networks in large lakes: Application to Lake Winnipeg. J. Great Lakes Res. 2012, 38, 174–182. [Google Scholar] [CrossRef]
  14. Wilkinson, J.; Souter, N.; Fairweather, P. Best Practice Framwork for the Monitoring and Evaluation of Water-Dependent Ecosystems 1: Framework; Department of Water, Land and Biodiversity Conservation: Adelaide, Australia, 2007.
  15. Water Quality Monitoring: A Practical Guide to the Design and Implementation of Freshwater Quality Studies and Monitoring Programmes; Bartram, J.; Ballance, R. (Eds.) Taylor and Francis: London, UK; New York, NY, USA, 1996. [Google Scholar]
  16. Behmel, S.; Damour, M.; Ludwig, R.; Rodriguez, M. Participative approach to elicit water quality monitoring needs from stakeholder groups—An application of integrated watershed management. J. Environ. Manag. 2018, 15, 540–554. [Google Scholar] [CrossRef] [PubMed]
  17. Khalil, B.; Ouarda, T.B.M.J.; St-Hilaire, A.; Chebana, F. A statistical approach for the rationalization of water quality indicators in surface water quality monitoring networks. J. Hydrol. 2010, 386, 173–185. [Google Scholar] [CrossRef]
  18. Ouyang, Y. Evaluation of river water quality monitoring stations by principal component analysis. Water Res. 2005, 39, 2621–2635. [Google Scholar] [CrossRef] [PubMed]
  19. Levine, C.R.; Yanai, R.D.; Lampman, G.G.; Burns, D.A.; Driscoll, C.T.; Lawrence, G.B.; Lynch, J.A.; Schoch, N. Evaluating the efficiency of environmental monitoring programs. Ecol. Indic. 2014, 39, 94–101. [Google Scholar] [CrossRef] [Green Version]
  20. Olsen, R.L.; Chappell, R.W.; Loftis, J.C. Water quality sample collection, data treatment and results presentation for principal components analysis—Literature review and Illinois River watershed case study. Water Res. 2012, 46, 3110–3122. [Google Scholar] [CrossRef] [PubMed]
  21. APEL. Diagnose du lac Saint-Charles 2012—Rapport Final; Association Pour la Protection de L’environnement du lac Saint-Charles et des Marais du Nord: Québec, QC, Canada, 2014; p. 519. [Google Scholar]
  22. Abrinord. Diagnostic de la Zone de Gestion Intégrée de l’eau d’Abrinord, Version Préliminaire; Organisme de Bassin Versant de la Rivière du Nord: Saint-Jerôme, QC, Canada, 2012; p. 139. [Google Scholar]
  23. USEPA. Guidelines for Preparation of the Comprehensive State Water Quality Assessments (305b Reports) and Electronic Updates; USEPA: Washington, DC, USA, 2001.
  24. Legendre, P.; Gallagher, E. Ecologically meaningful transformations for ordination of species data. Oecologia 2001, 129, 271–280. [Google Scholar] [CrossRef] [PubMed]
  25. Kruskal, W.H.; Wallis, W.A. Use of Ranks in One-Criterion Variance Analysis. J. Am. Stat. Assoc. 1952, 47, 583–621. [Google Scholar] [CrossRef]
  26. APEL. Suivi des Rivières du Bassin Versant de la Rivière Saint-Charles—Campagne 2013; Association Pour la Protection de L’environnement du lac Saint-Charles et des Marais du Nord: Québec, QC, Canada, 2014; p. 150. [Google Scholar]
  27. ALCOSAN. ALCOSAN Wet Weather Plan—Receiving Waters Characterization; Allegheny County Sanitary Authority: Pittsburgh, PA, USA, 2012; p. 20. [Google Scholar]
  28. Stantec Consulting Ltd.; Aquafor Beech Limited. Dry and Wet Weather Modelling of Water Quality Under Alternative Land Use Scenarios in the Duffins and Carruthers Creek Watersheds: A Simple Spreadsheet Approach; The Toronto and Region Conservation Authority: Toronto, ON, Canada, 2003; p. 28. [Google Scholar]
  29. Pinto, U.; Maheshwari, B. River health assessment in pen-urban landscapes: An application of multivariate analysis to identify the key variables. Water Res. 2011, 45, 3915–3924. [Google Scholar] [CrossRef] [PubMed]
  30. Khalil, B.; Ouarda, T.B.M.J. Statistical approaches used to assess and redesign surface water-quality-monitoring networks. J. Environ. Monit. 2009, 11, 1915–1929. [Google Scholar] [CrossRef] [PubMed]
  31. Thomas, R.; Meybeck, M.; Beim, A. Lakes. In Water Quality Assessments—A Guide to the Use of Biota, Sediments and Water in Environmental Monitoring, 2nd ed.; Chapman, D., Ed.; E & FN Spon: London, UK, 1996. [Google Scholar]
  32. Josse, J.; Chavent, M.; Liquet, B.; Husson, F. Handling Missing Values with Regularized Iterative Multiple Correspondence Analysis. J. Classif. 2012, 29, 91–116. [Google Scholar] [CrossRef] [Green Version]
  33. Josse, J.; Husson, F. missMDA: A Package for Handling Missing Values in Multivariate Data Analysis. J. Stat. Softw. 2016, 70. [Google Scholar] [CrossRef]
  34. Hébert, S. Développement d’un Indice de la Qualité Bactériologique et Physico-Chimique de l’eau pour les Rivières du Québec, Québec; Ministère de l’Environnement et de la Faune: Québec, QC, Canada, 1997; Volume envirodoq no EN/970102, pp. 20–24.
Figure 1. Global workflow of the optimization process of WQMPs. The purpose of the participative approach is to assess the attainment of past monitoring objectives and yield new monitoring objectives and optimization objectives. The results will influence the questions that the WQMP manager asks the IDSS to help the WQMP manager redesign the WQMP.
Applsci 09 04157 g001
Figure 2. Outline of the Lac Saint-Charles WQMP (W1) and the optimization objective tested in this paper [21].
Applsci 09 04157 g002
Figure 3. Outline of the Rivière du Nord WQMP (W2) and the three optimization objectives retained for this paper [1].
Applsci 09 04157 g003
Figure 4. Questions to be asked (and integrated) into the system in order to understand the design of a WQMP.
Applsci 09 04157 g004
Figure 5. Illustration of the dashboard of the W1 WQMP, as well as the features that may be consulted to understand the WQMP and the available data sets.
Applsci 09 04157 g005
Figure 6. Onboarding the data of a WQMP: Step 1: Setting (e.g., sampling objectives; sampling site justification; protocols; tools; probes; probe calibration protocols; laboratories; laboratory specificities; field observations; parameters and measuring units. Step 2: Importing shapefiles of watersheds and water bodies, metadata on shapefiles; waterbody descriptions (e.g., bathymetry, length, fetch, volume, perimeter, etc.). Step 3: Creating sampling sites (e.g., geographical location, justification, waterbody (from drop-down lists created during steps 1 and 2. Step 4: Entering measurement contexts – fieldwork (e.g., field personnel, time frame spent in the field, sampling protocols, sampling tools; probes and laboratories used, field measurements are taken (e.g., transparency), field observations (e.g., rainfall and wind), etc.). Step 5: Importing data from Excel and CSV files from probes and laboratories automatically connected to the contexts. Step 6: Validating import reports and corrections if necessary.
Applsci 09 04157 g006
Figure 7. Illustration of the available filters for data extraction. It is possible to make 1 or n selections to visualize data series or to export selection to EXCEL or CSV files.
Applsci 09 04157 g007
Figure 8. Extraction of the decision-support questions on available data series to validate (and understand) integrity, comparability, and outliers.
Applsci 09 04157 g008
Figure 9. Distribution of sampling stations on Lac Saint-Charles (lake). Maximum depth at each station: C03: 17 m, C08: 13 m, C04: 7.5 m, C05: 5 m, and C01: 2 m). Reproduced with permission from [21], APEL, 2019.
Applsci 09 04157 g009
Figure 10. (A): illustrates the W2 sampling site network, the sampling site network, and the sampling stations suggested for retention or removal following the Kriging and Moran analysis. Stations without any specifications are considered as neutral, as neither their retention nor their removal will have an effect on the model. (B): Suggested sampling site network after the first series of validations (Section 2.5).
Applsci 09 04157 g010
Table 1. Summary of the actionable tasks to take final decisions for the optimization of the W1 WQMP.
Actionable TasksVerifications that Must be Made Prior to the Final Decision
Verify whether changes in physicochemical parameters and other observations made in the river WQMP of this watershed can have an effect on the structure of the cyanobacteria community of Lake Saint-Charles
  • The watershed of Lac Saint-Charles is exposed to multiple stressors. Data from the river WQMP show that specific conductivity is raising constantly in the main inflows of Lac Saint-Charles (APEL 2015; APEL 2016). Therefore, changes in the cyanobacteria community may occur rapidly and be an indicator of these changes. Further analysis is necessary to identify whether these changes can also be documented in Lac Saint-Charles before drastically reducing the sampling frequency.
  • IF there are no changes, the six years of intensive cyanobacteria monitoring can be taken as a reference, and the sampling frequency can be reduced (e.g., every 4 weeks).
  • IF changes in the lake occur, the sampling frequency can be increased again.
Verify sampling strategy
  • Statistical analyses of links between the surface water communities and the epilimnion community may be challenging when TP and nitrogen compounds are not taken at the same depth. For economic reasons, the depth in lake stations for this analysis is at 1 m. IF the analysis for modeling cyanobacteria including these parameters is projected, then the sampling strategy should include these parameters at the same depth were the cyanobacteria are being sampled.
Verify which station can be retrieved between C01 and SC0
  • Since no difference was observed between those two stations, select the station which requires less effort to be sampled. Since SC0 is accessible from the shore, this station should be kept and C01 eliminated.
Verify whether changes in the cyanobacteria monitoring affect other monitoring objectives
  • During the process of understanding the rationale of the WQMP in the W1 watershed, many other monitoring objectives were identified for this lake. For any drastic change in the current strategy, the incidence on the other objectives must be evaluated. These objectives can be retrieved from the database, and the IDSS proposes the validation questions accordingly.
Table 2. Summary of the actionable tasks to take final decisions to optimize the W2 WQMP.
Actionable TasksStations Submitted to the Tasks (IDSS would Lead to a Specific Series of Options to Comply with These Tasks)
Verify whether sufficient data is available during rain eventsAll stations
Verify whether sampling frequency was sufficient and whether a different type of sampling frequency should be adoptedIdeally all stations, however, the analysis is time-consuming, therefore the following stations are suggested as being representative for different sections of W2:
1 – Witness station of the Rivière du Nord watershed.
12 – Station representing water quality upstream from the drinking water treatment plant of Saint-Jerôme.
14 – Station with the longest history.
22 – Station the furthest downstream on Rivière du Nord (close to an integrative station of the entire watershed).
23 – Integrative station of a watershed with mostly agricultural activities (representative of the downstream portion of W2).
17 – Integrative station of a watershed with mostly recreational activities (representative of the upstream portion of W2)
Verify mixing and representativity
  • LJER01 – sampling site is situated on a lakeshore. The site could be placed at the outflow of the lake – the goal of this site is to document the impact of downstream construction.
  • 12 – the goal of the sampling site is to document water quality upstream of the drinking water intake of Saint-Jérôme. A waterfall between this station and the intake probably contributes to oxygenation. Data from the raw water intake could be integrated into the WQMP.
  • All other stations on Rivière du Nord, due to the width of the river. Verify whether the precise sampling site represents the water quality of the entire river section (e.g., through validating mixing at different flow regimes with the help of a probe (representative parameters are specific conductivity, pH and temperature on several spots on the river section - if they are similar or identical mixing is provided. If not, another sampling site or strategy may be considered (e.g., composite sampling or taking several samples).
Verify whether additional water quality parameters should be taken according to the sampling site justification and new monitoring objectives
  • All stations.
  • Stations M03 and 04010258 – can be removed unless more water quality parameters are monitored, such as specific conductivity (all stations) and road salts (on specific sections due to cost). These stations are downstream from Highway 15.
Verify whether additional stations should be added (or removed) (other than those presented in Figure 10B)
  • Add a station upstream from station 16, Ruisseau Williams.
  • Verify whether other streams in the watershed are still orphans, such as the one represented by station ?1.
  • Add a station upstream from M08 (witness station for the watershed).
  • Station M09 was a witness station but was replaced by M14 due to urban development upstream. Verify whether M09 can be kept as a section station to document the impact of this development.
Table 3. Summary of the results of the Kruskall-Wallis test for the three water quality parameters.
Water Quality ParameterRain Event ModalitiesNumber (n) of Samples for Each ModalityConclusions of the Kruskall – Wallis Test
Fecal coliform0 - no rain for 48 h915Differences were detected between all rain event modalities, except for differences between modality 0 and 1 and 2 and 4.
1- rainfall the same day199
2- rainfall 0–24 h prior to sampling429
3- rainfall 24–48 h prior to sampling126
4- rainfall 0–48 h prior to sampling295
Total phosphorus0 - no rain for 48 h918Differences were detected between all rain event modalities except between modalities 0 and 1, 1 and 4, 2 and 4.
1- rainfall the same day204
2- rainfall 0–24 h prior to sampling421
3- rainfall 24–48 h prior to sampling122
4- rainfall 0–48 h prior to sampling301
Total suspended solids0 - no rain for 48 h840Differences were detected between all rain event modalities, except for differences between modality 0 and 1 and 2 and 4.
1- rainfall the same day188
2- rainfall 0–24 h prior to sampling426
3- rainfall 24–48 h prior to sampling129
4- rainfall 0–48 h prior to sampling284

