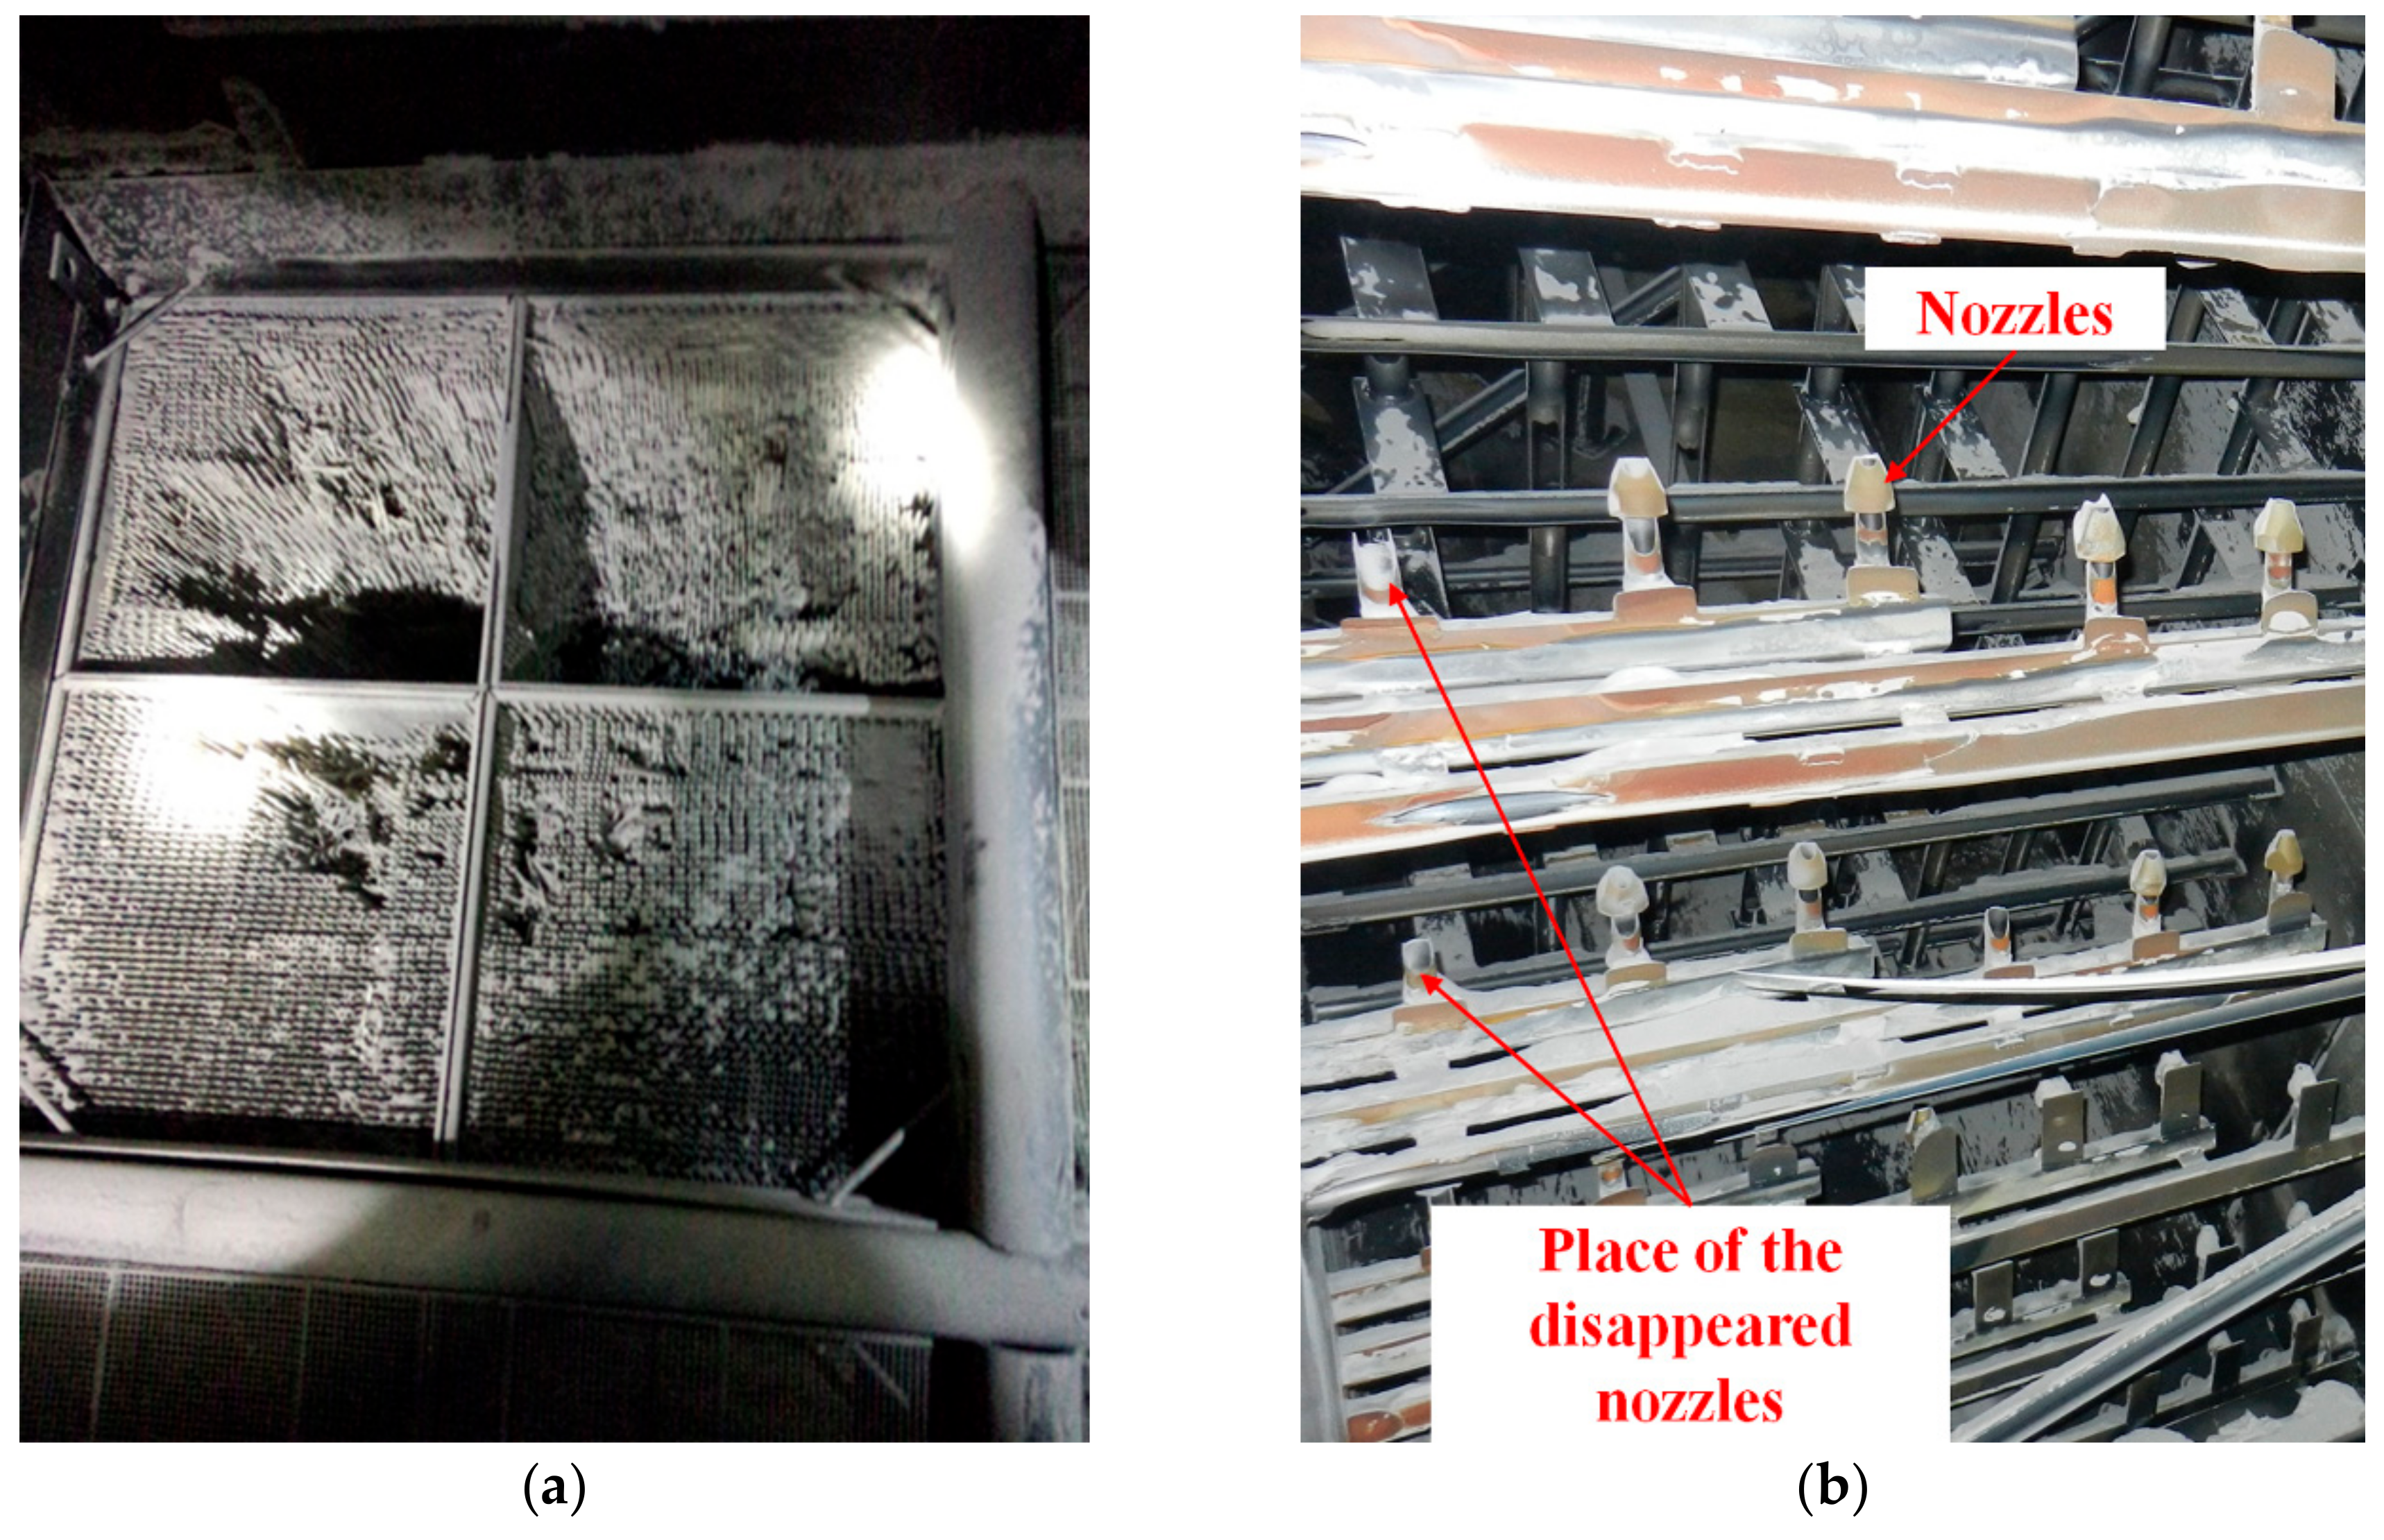
Figure 1.
The damage caused by ash particles: (a) the breakage of the catalyst layer for a 660 MW coal-fired power plant, (b) the erosion of the ammonia injection grid (AIG) and the support structure.
Figure 1.
The damage caused by ash particles: (a) the breakage of the catalyst layer for a 660 MW coal-fired power plant, (b) the erosion of the ammonia injection grid (AIG) and the support structure.
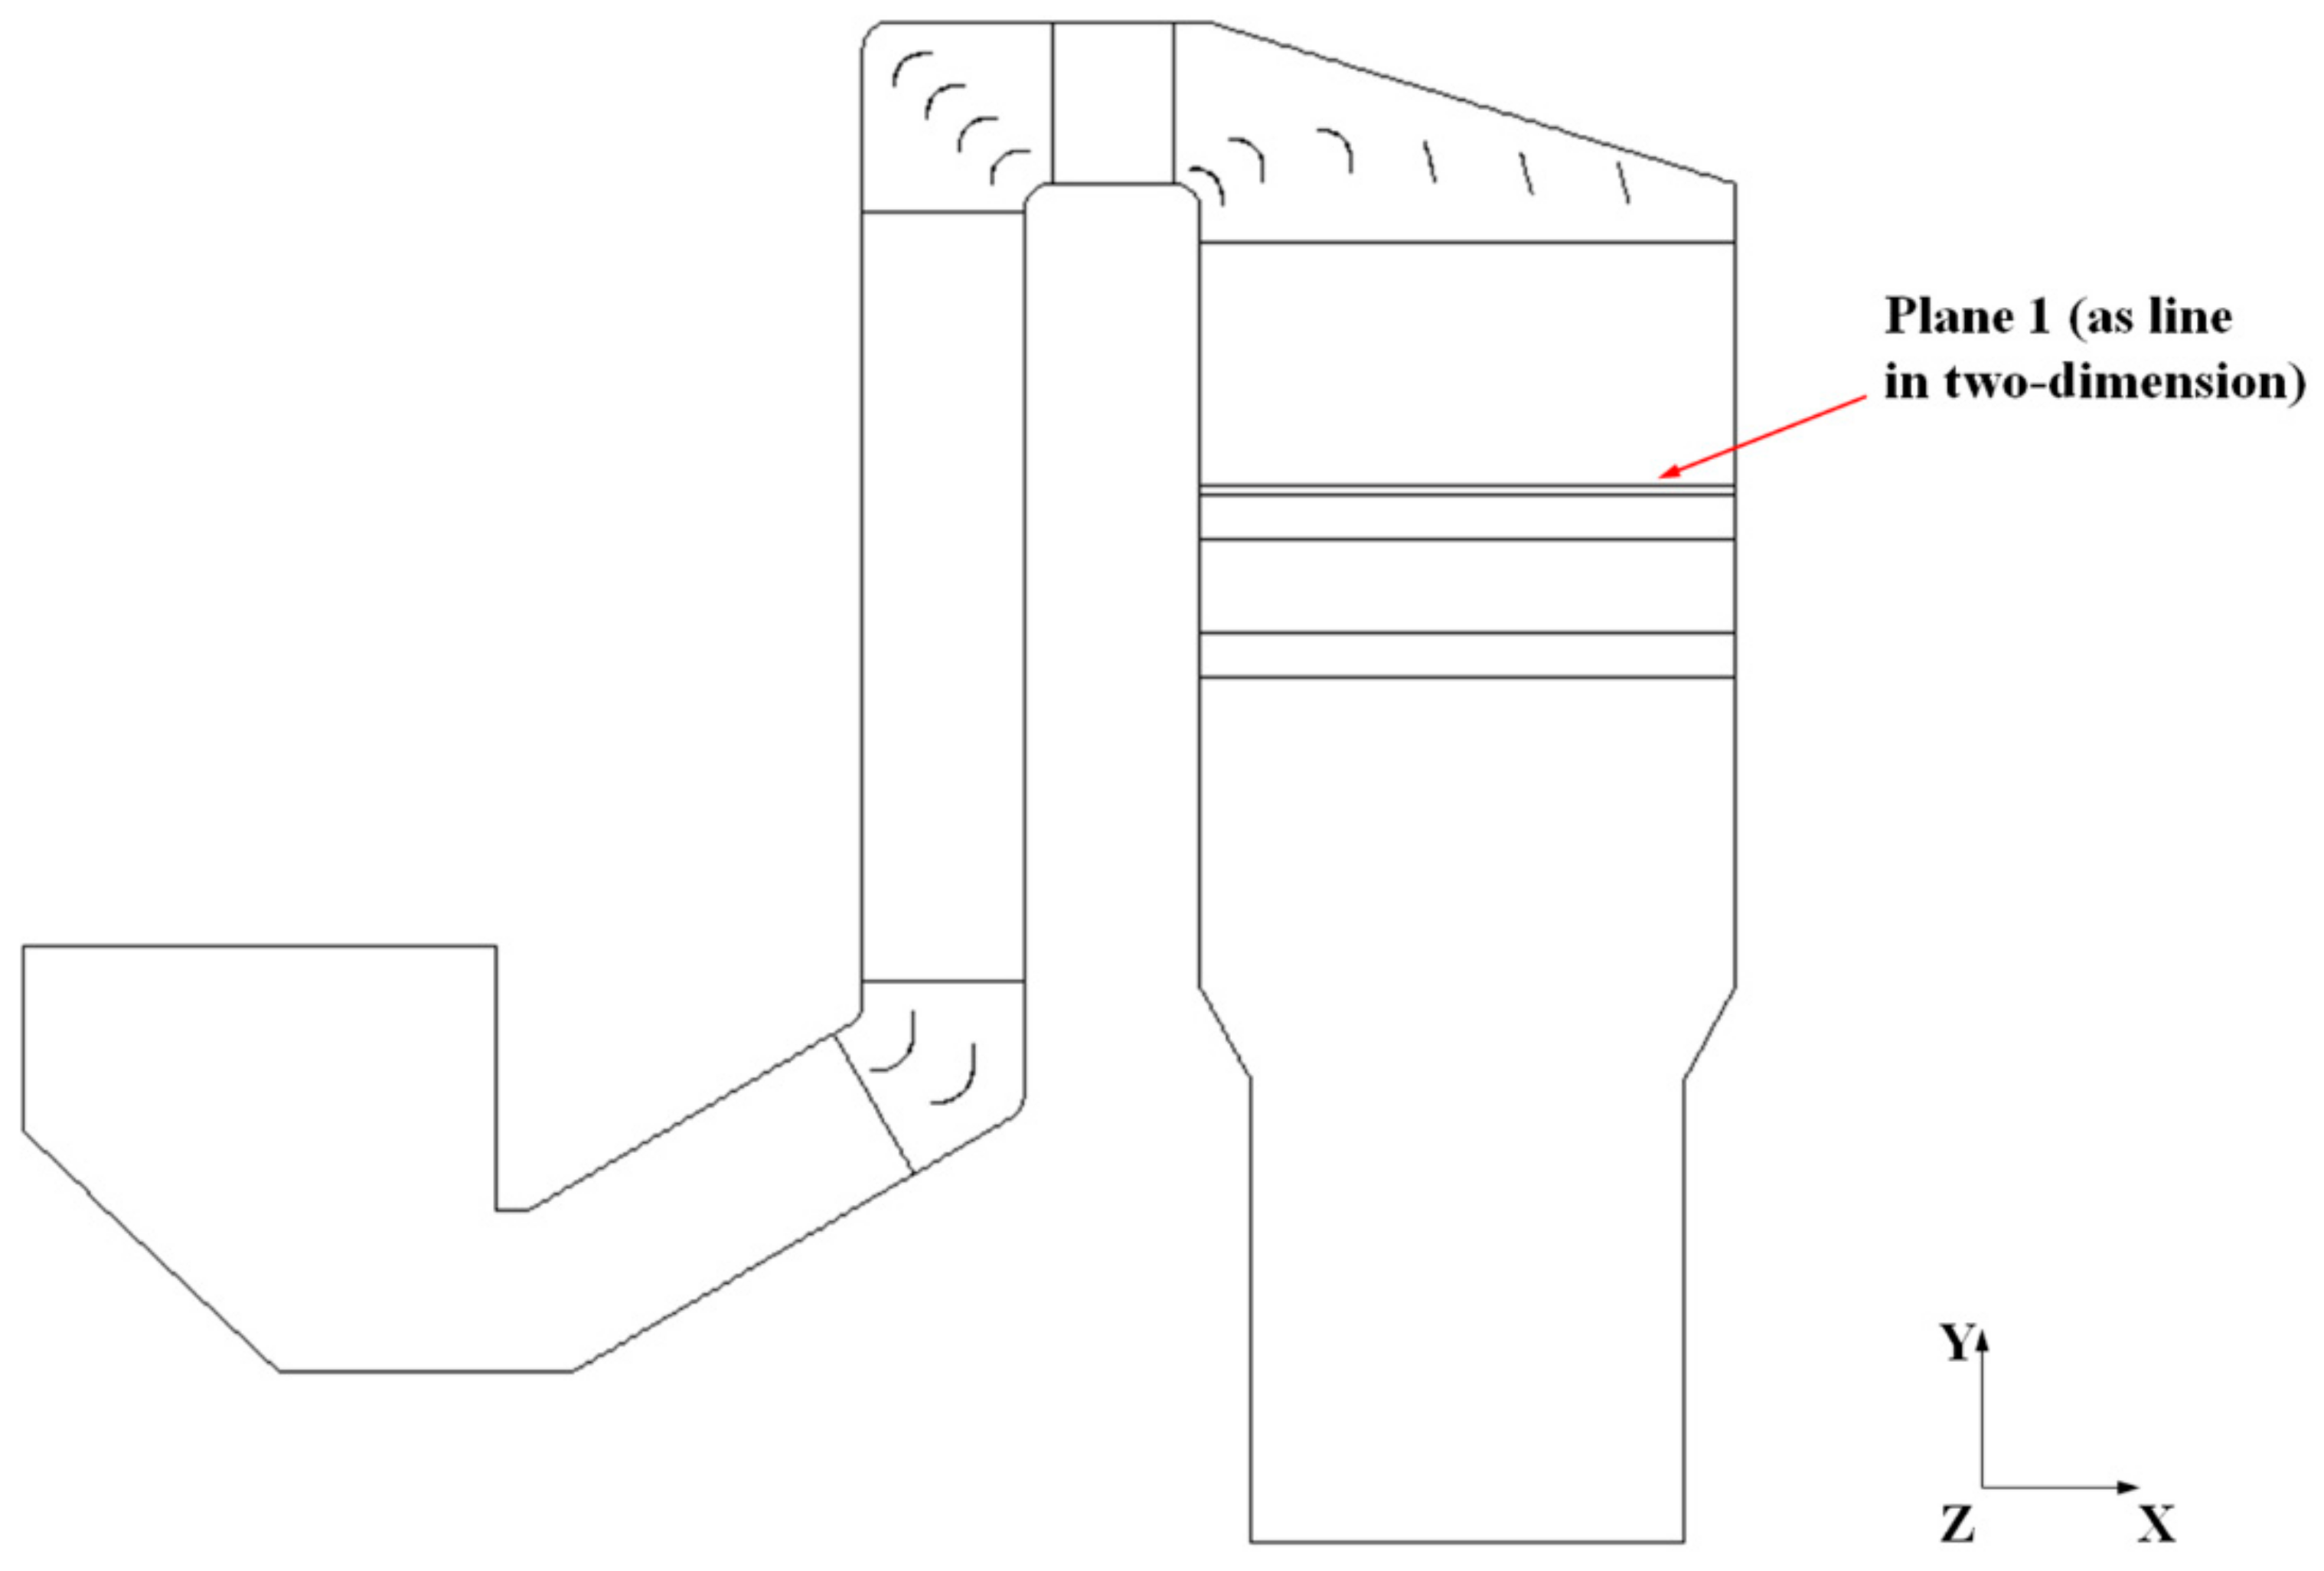
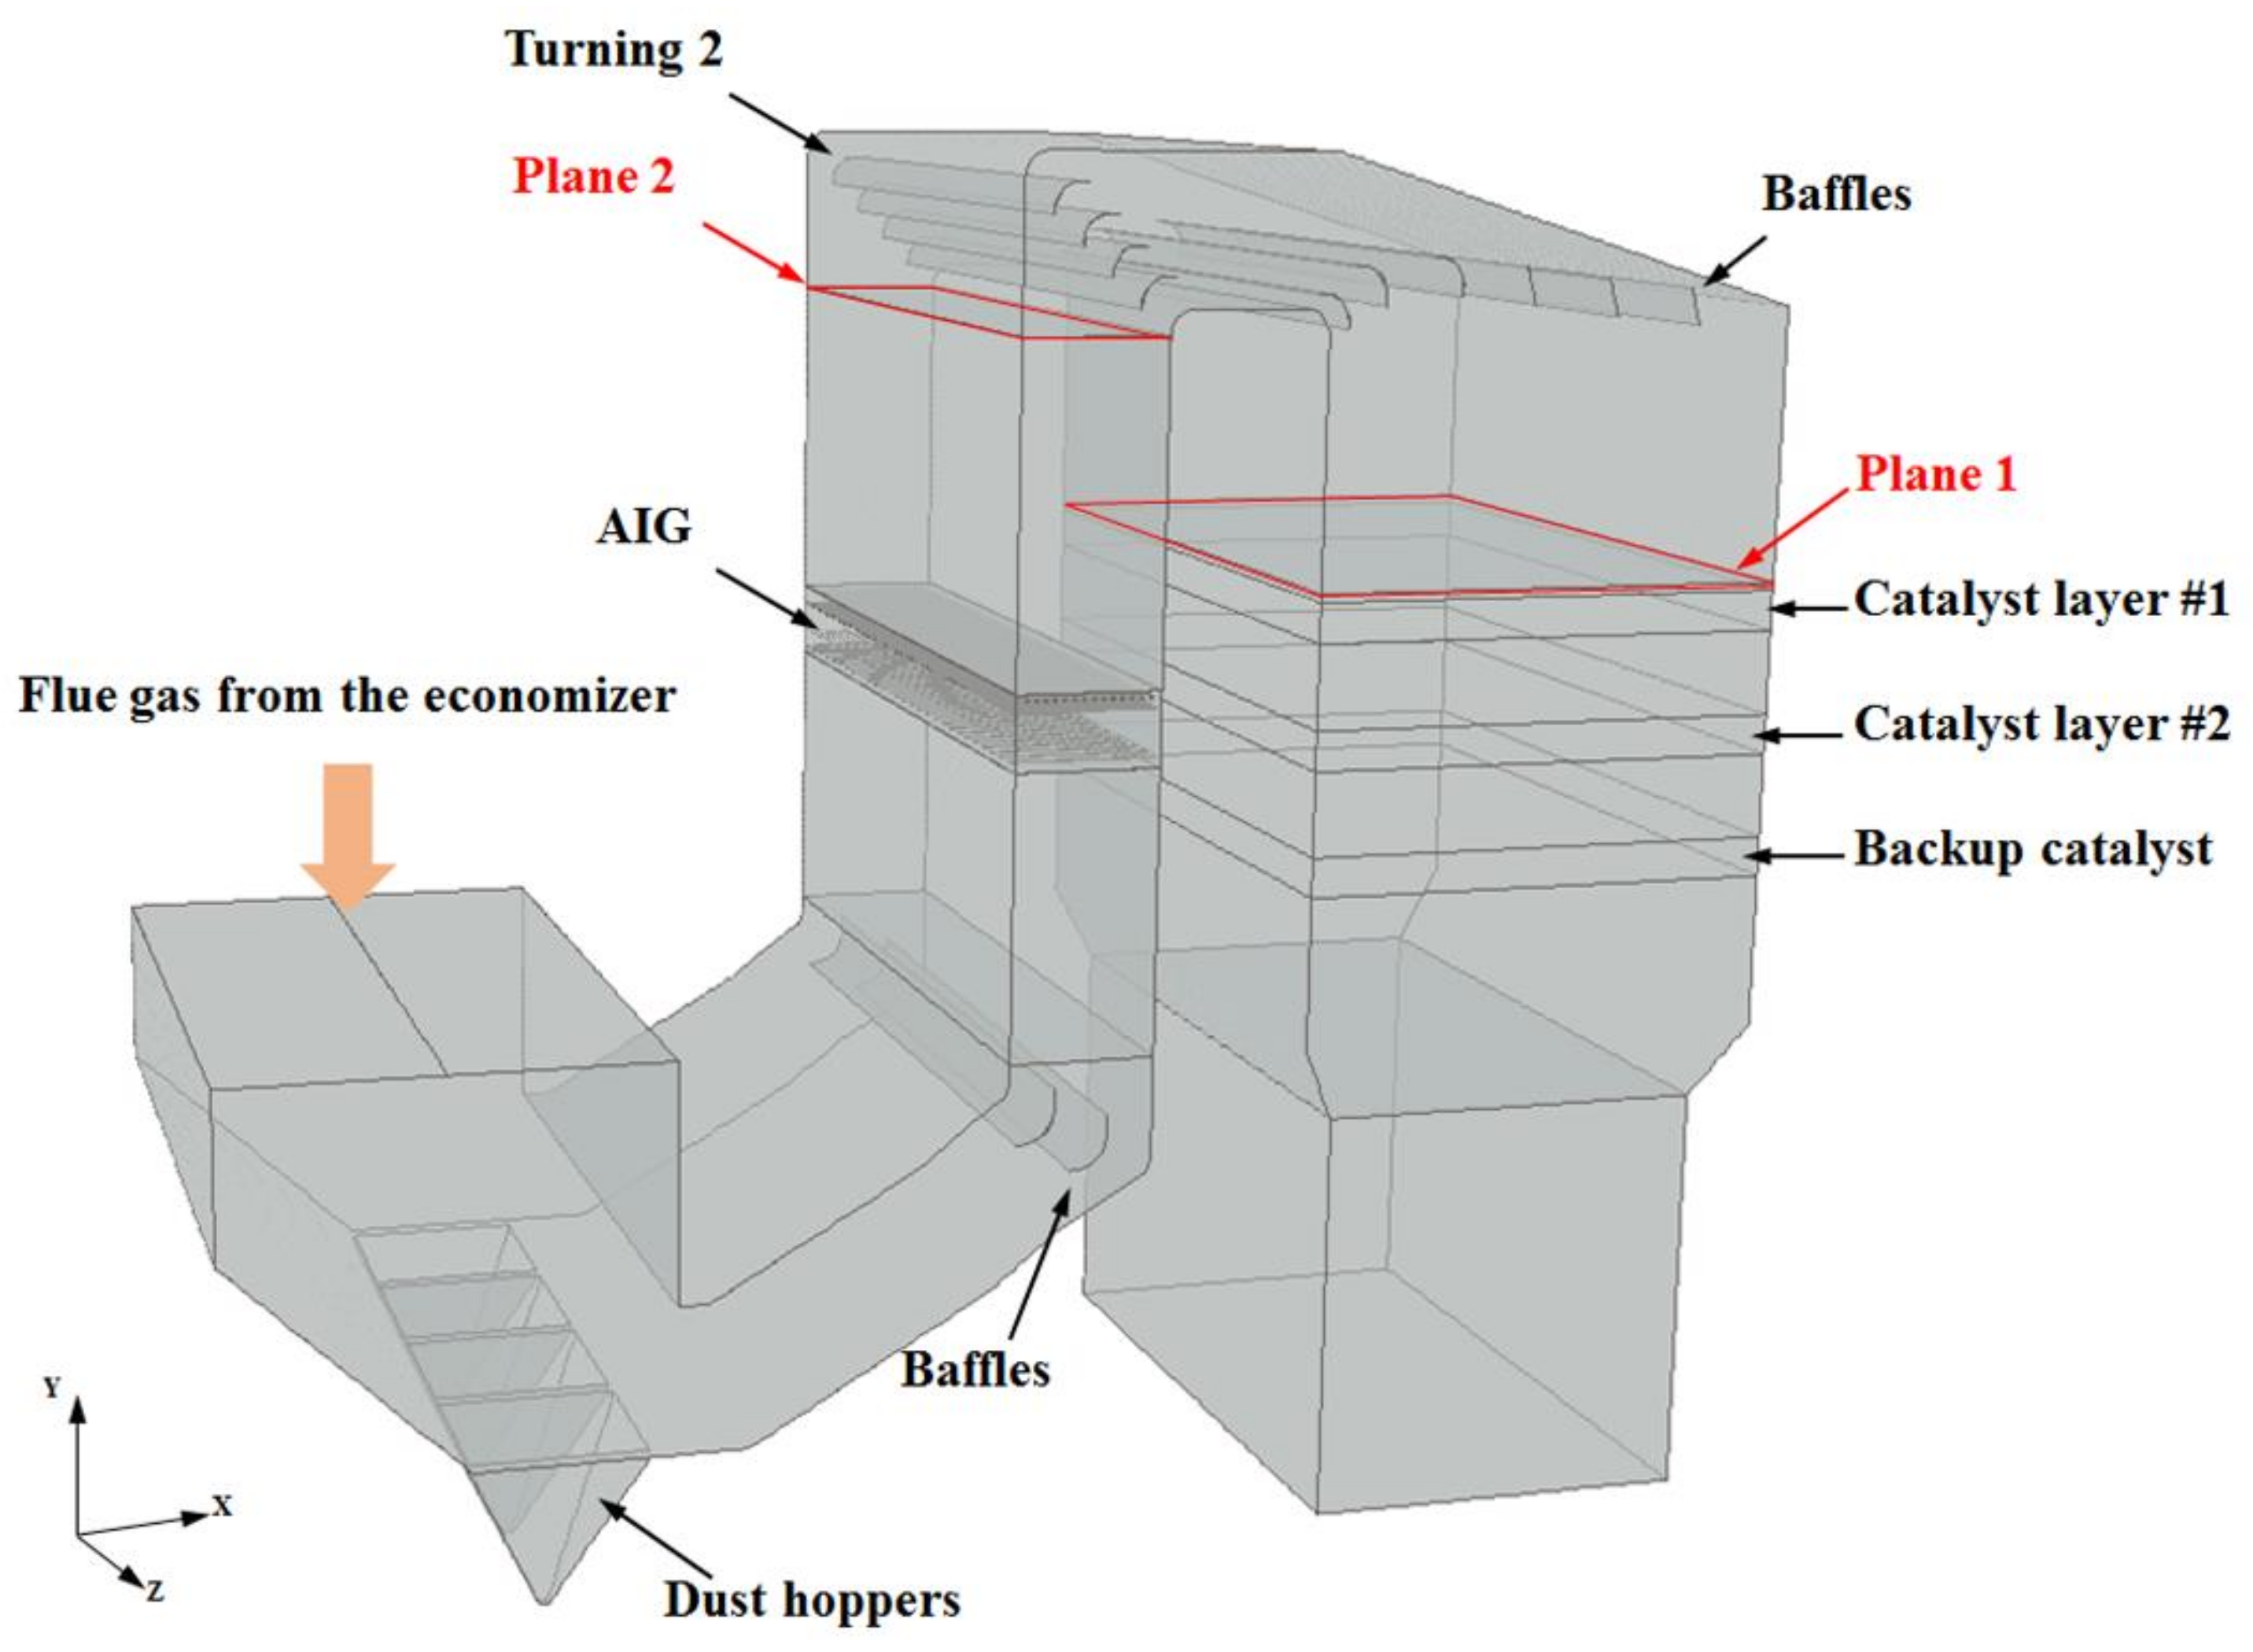
Figure 2.
The schematic geometry of the SCR-deNOx facility for a 1000 MW coal-fired power plant.
Figure 2.
The schematic geometry of the SCR-deNOx facility for a 1000 MW coal-fired power plant.
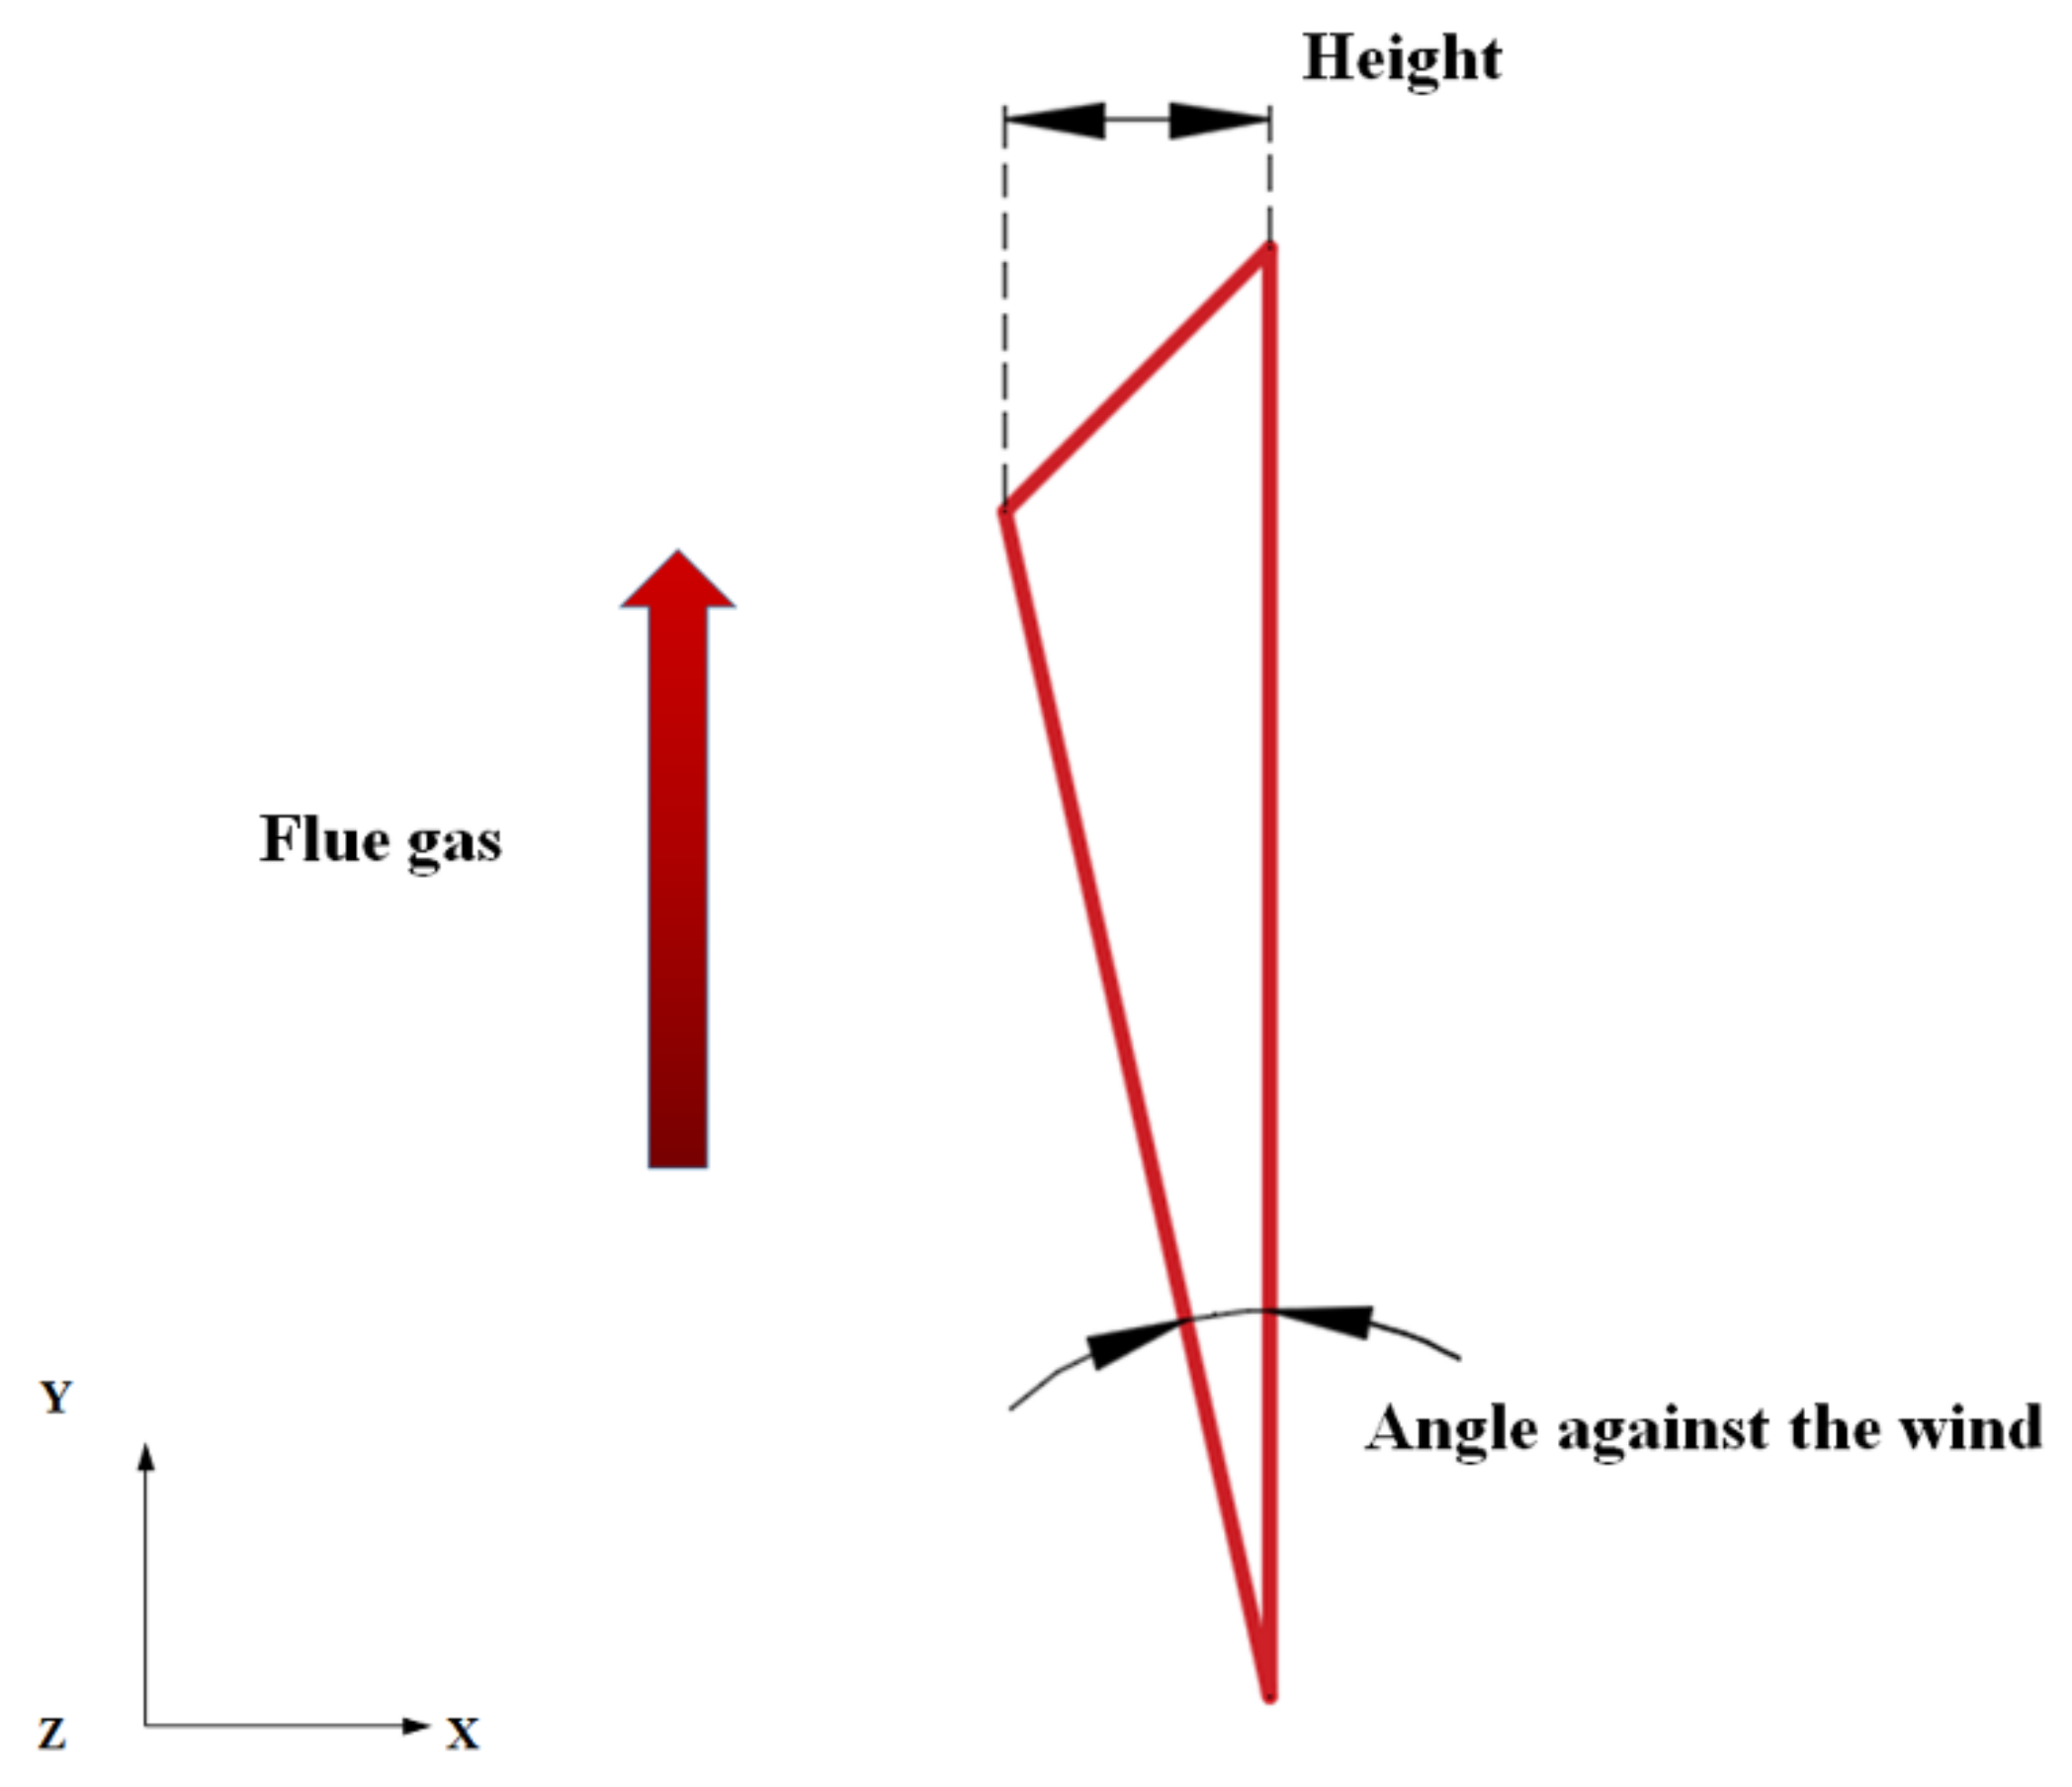
Figure 3.
The schematic view of the triangular deflector (Z-positive).
Figure 3.
The schematic view of the triangular deflector (Z-positive).
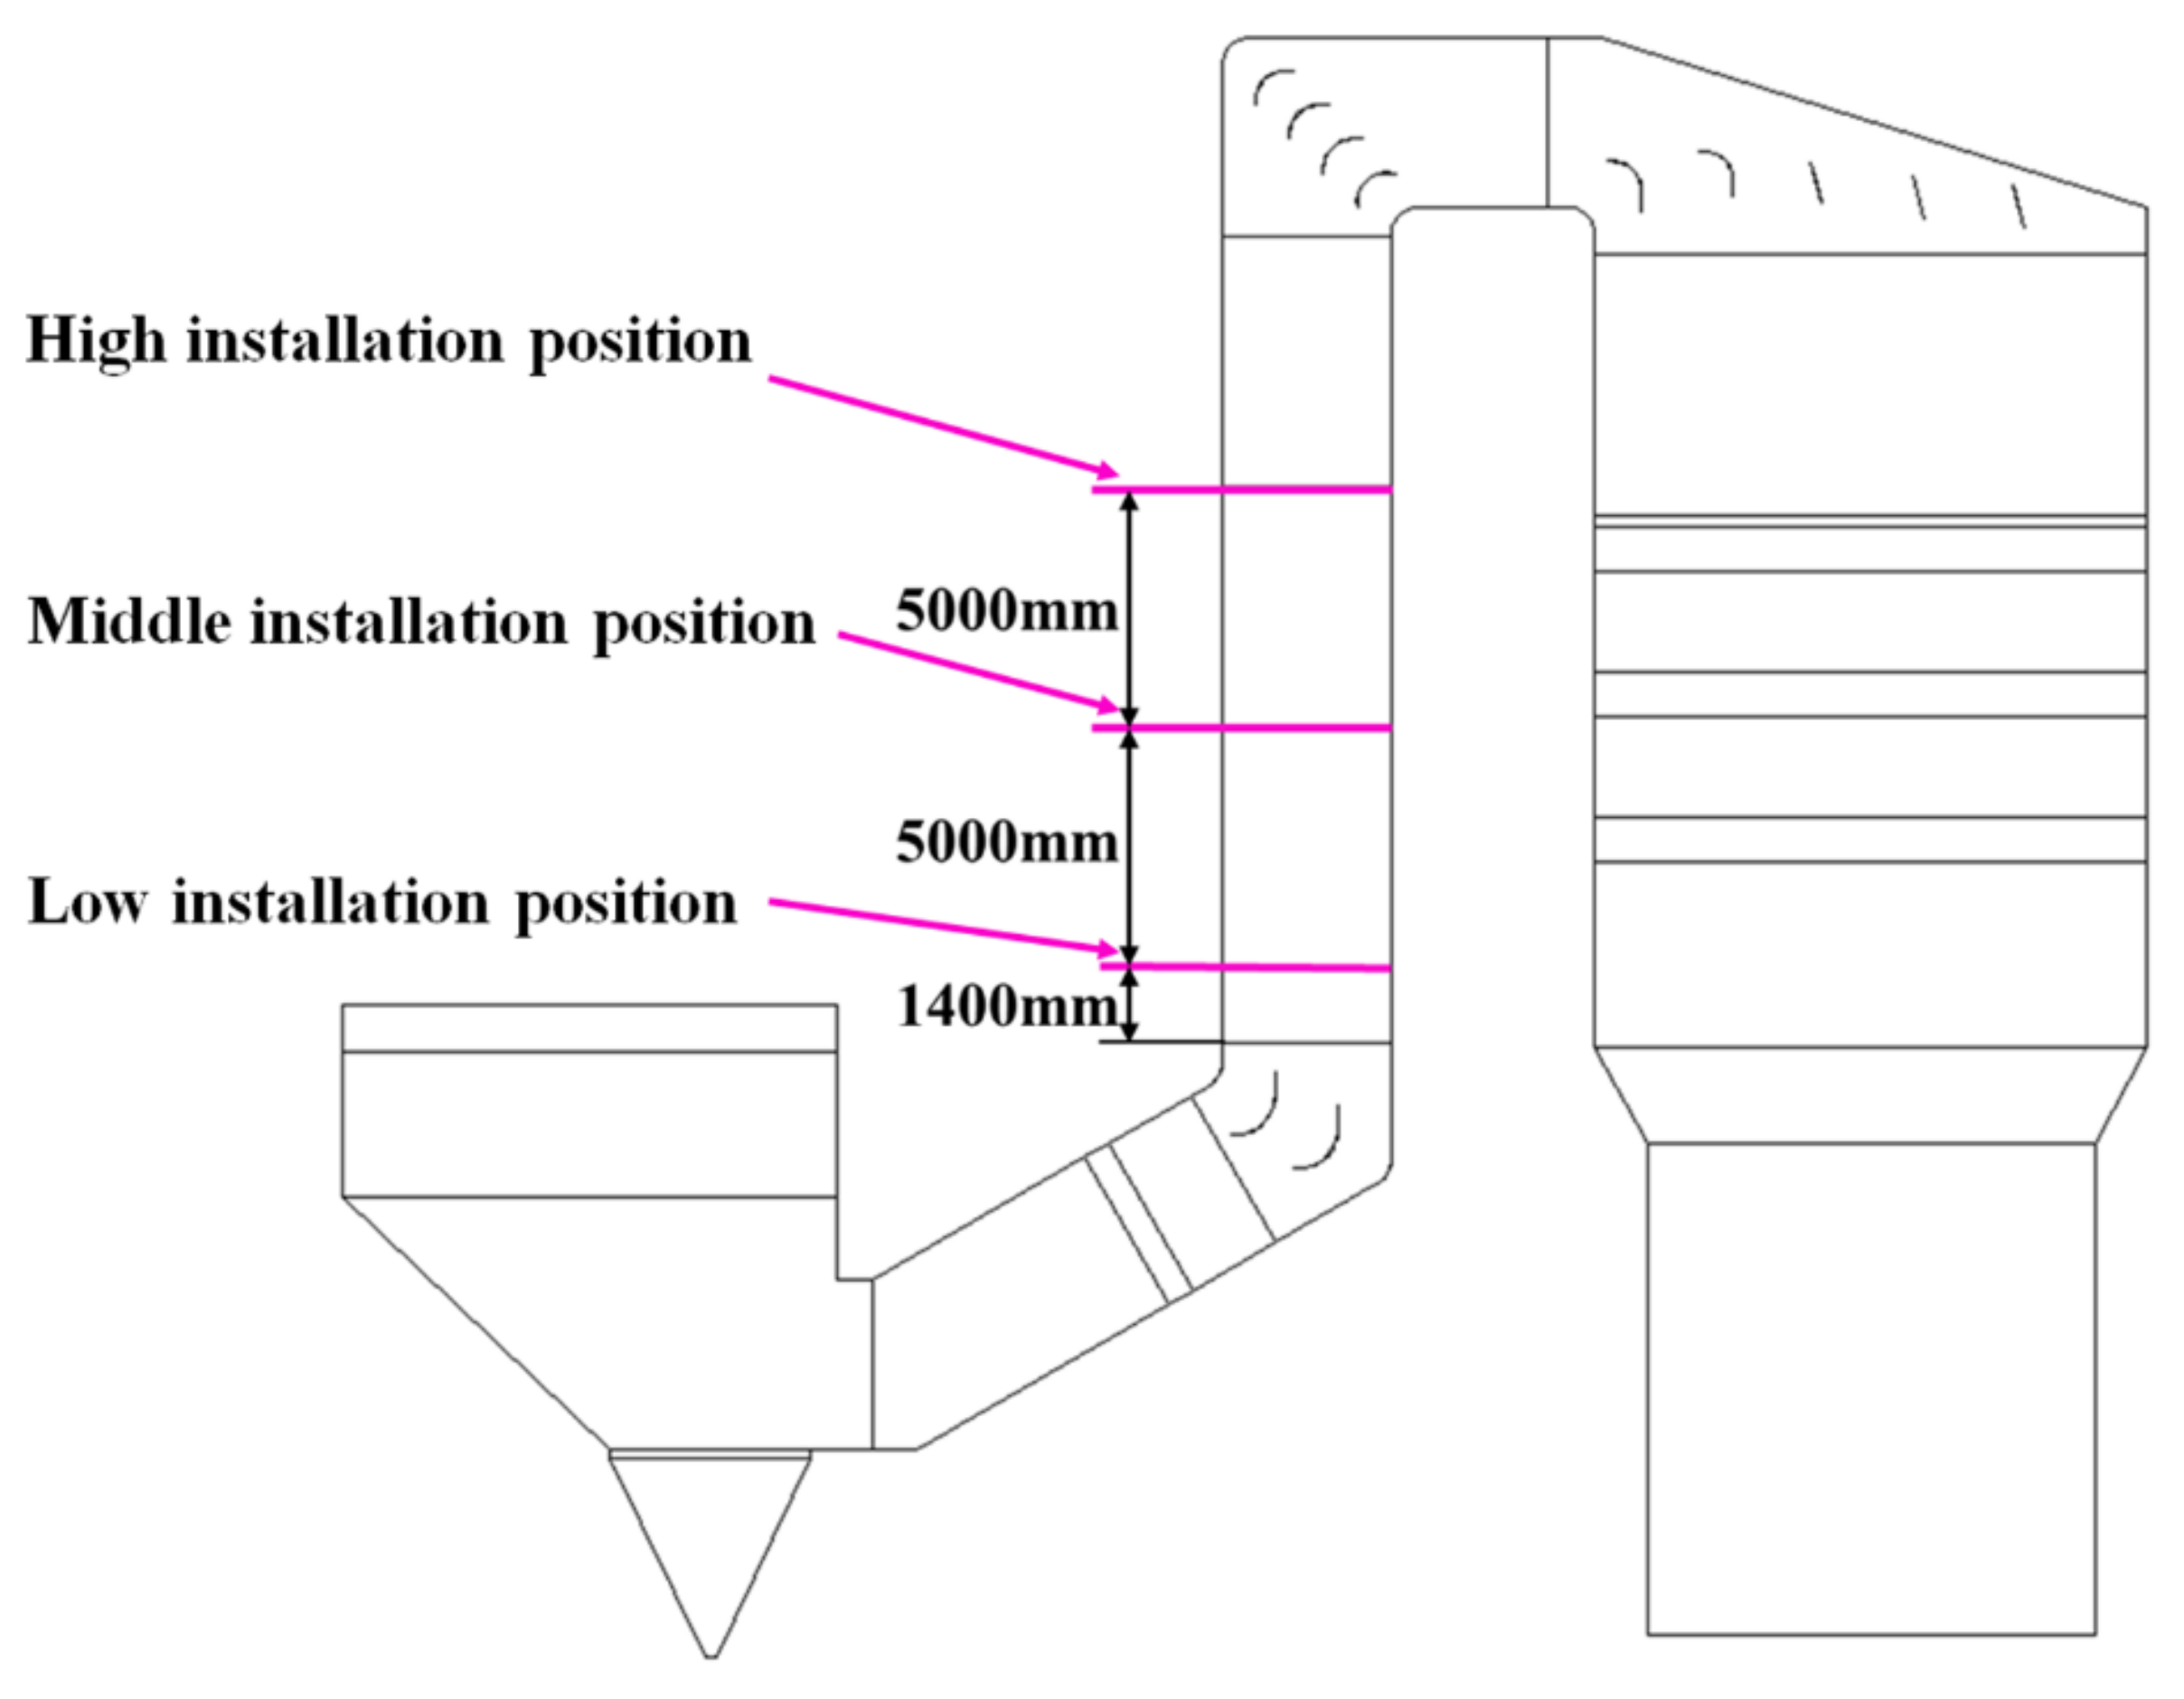
Figure 4.
Three different installing positions for the triangular deflector (Z-positive).
Figure 4.
Three different installing positions for the triangular deflector (Z-positive).
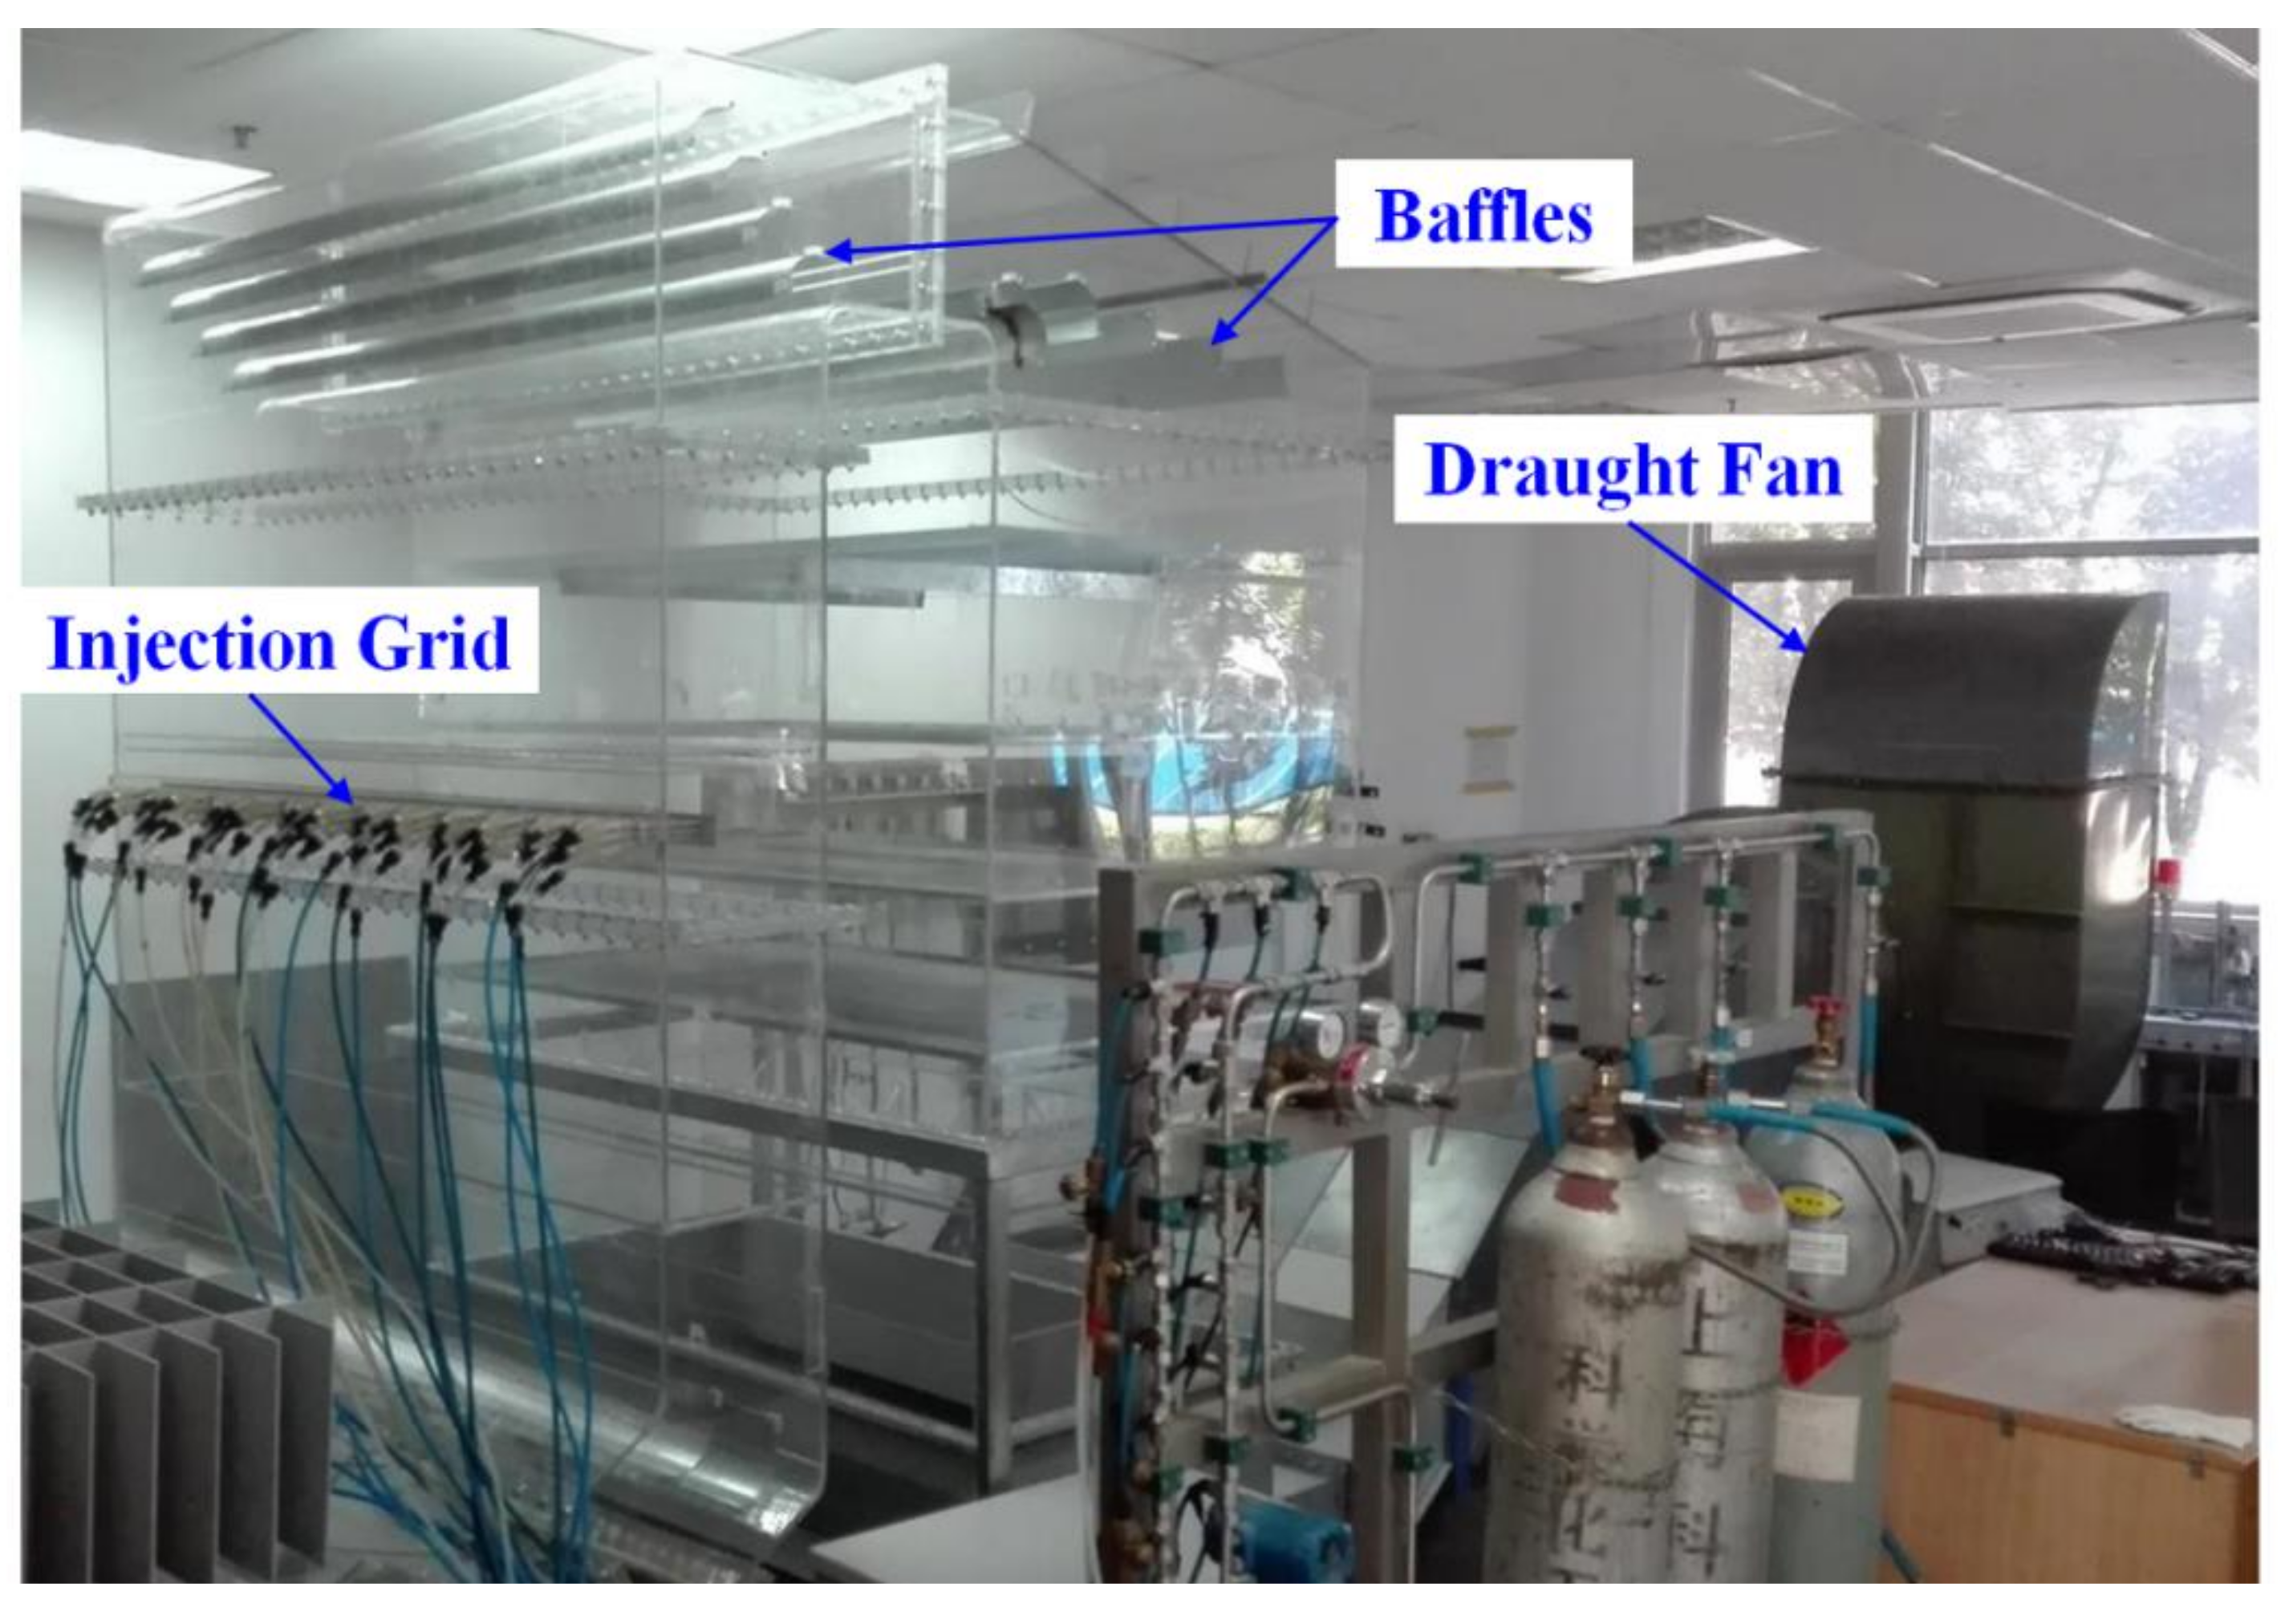
Figure 5.
The platform of flow model test (FMT) experiments.
Figure 5.
The platform of flow model test (FMT) experiments.
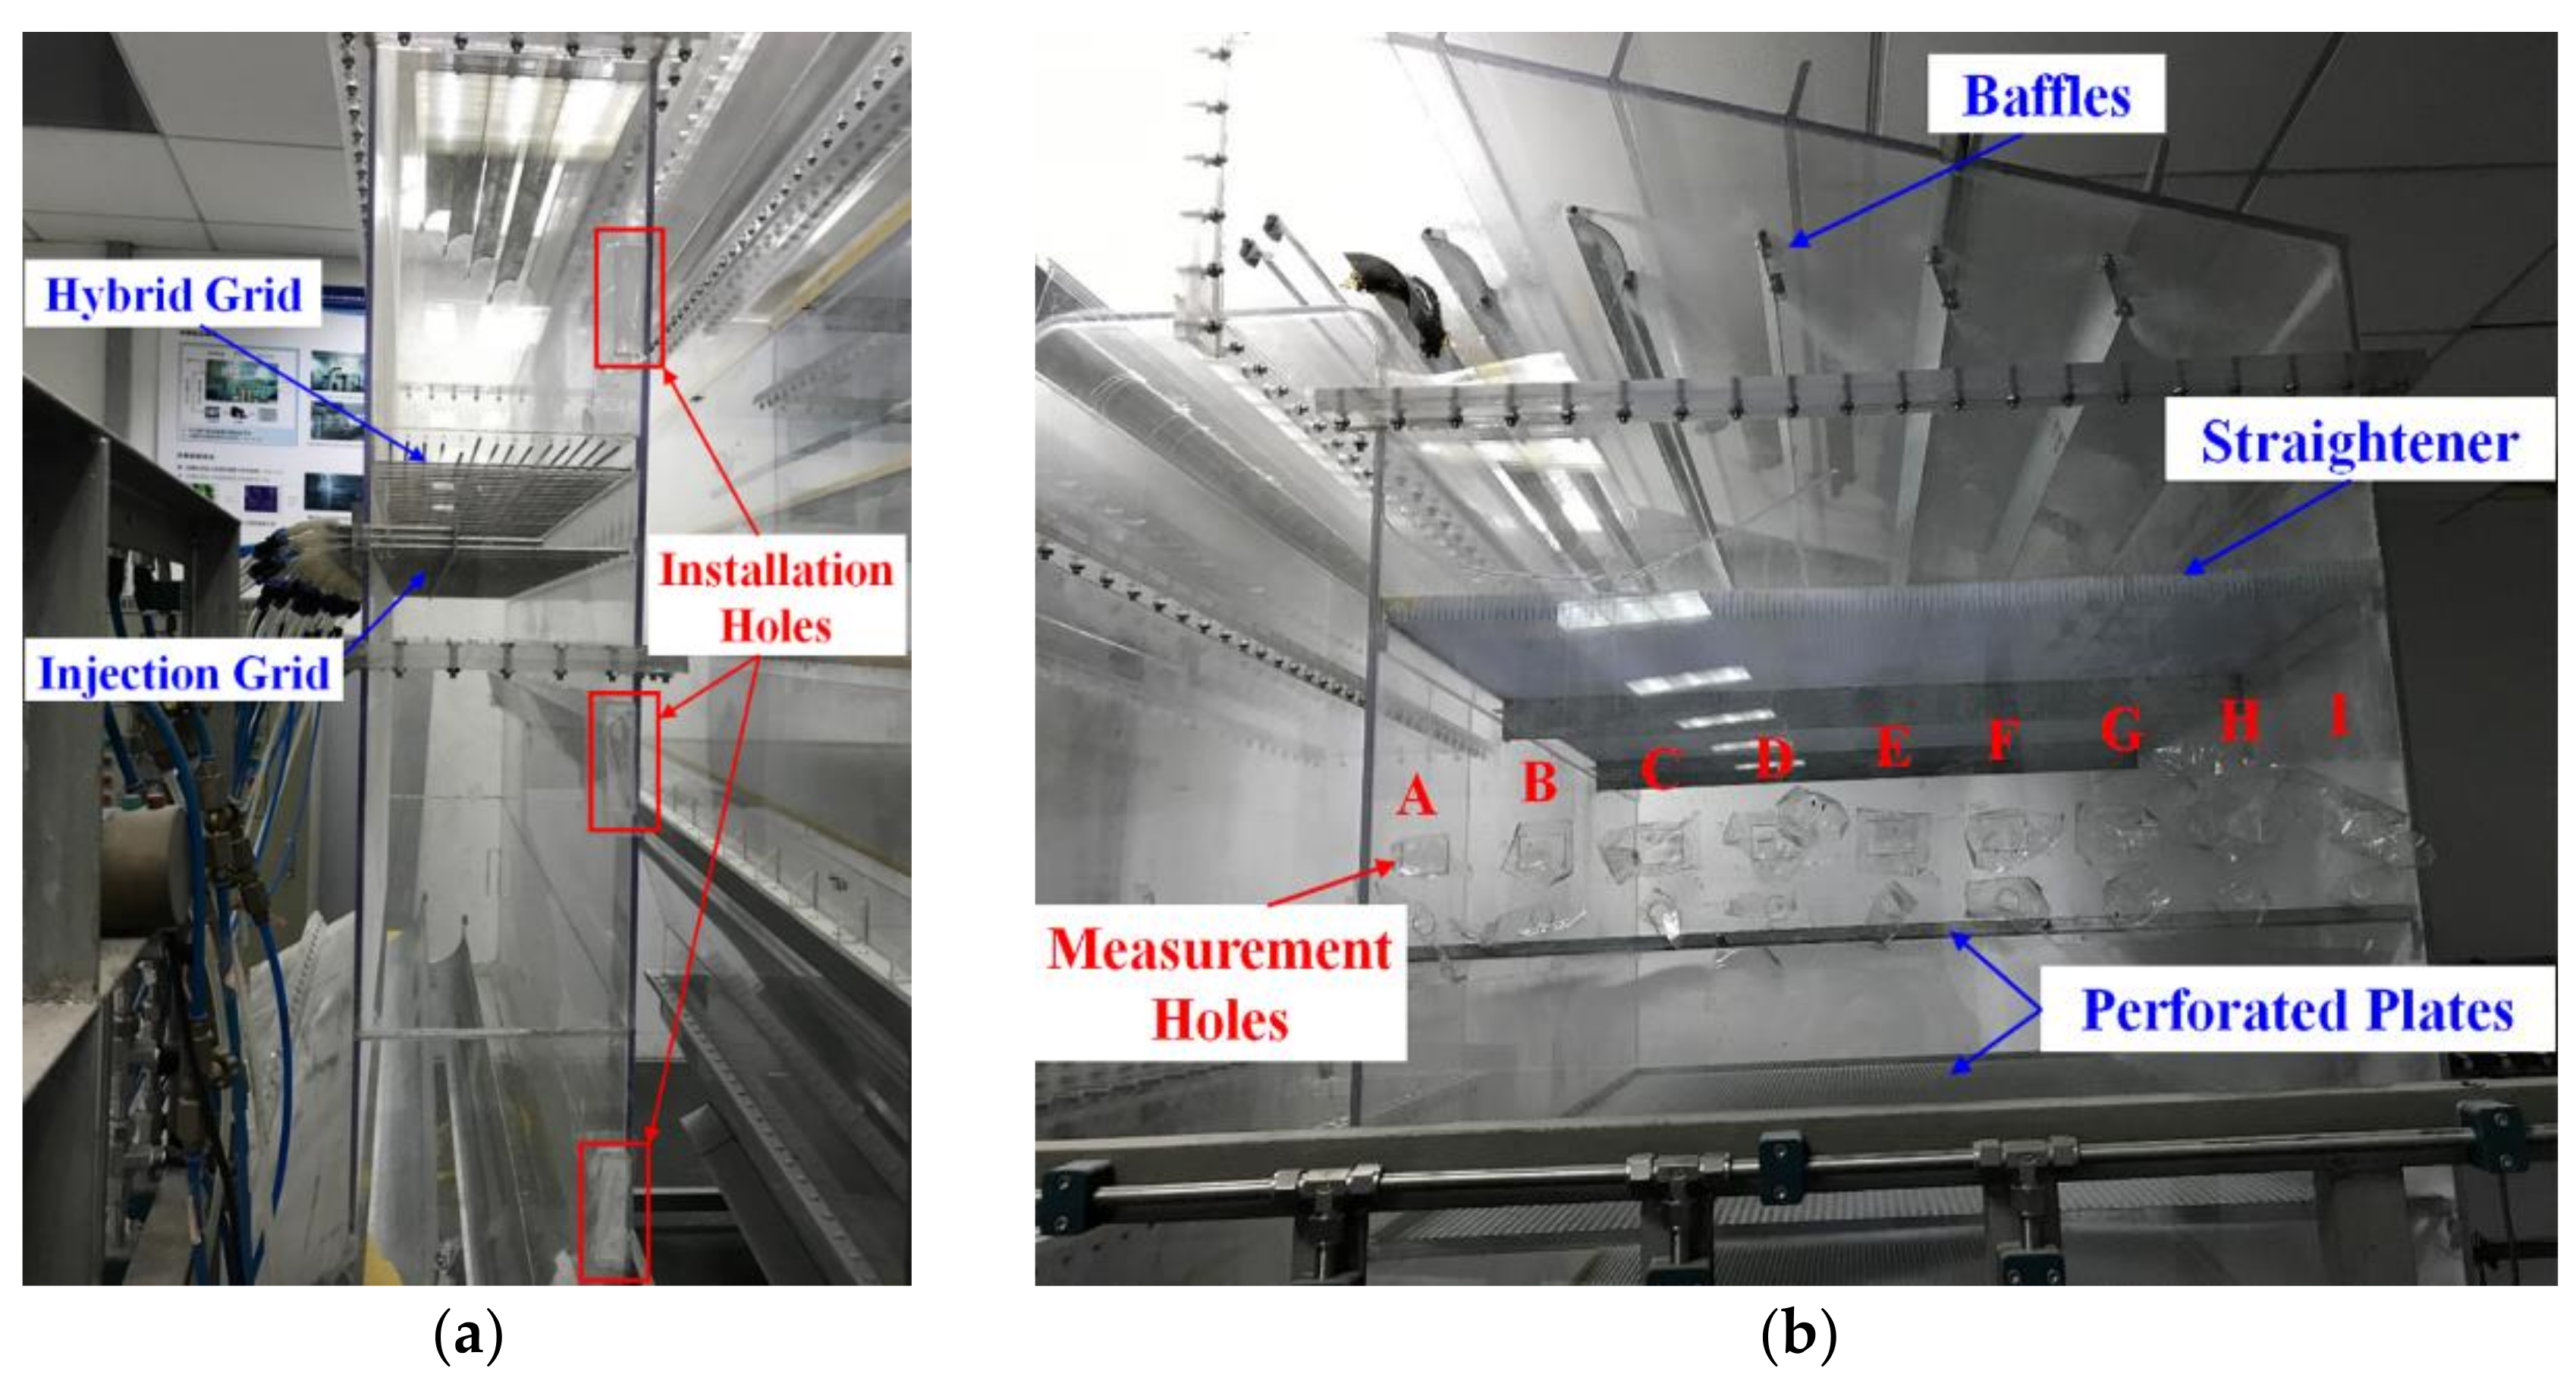
Figure 6.
The small holes processed on the Plexiglas: (a) holes for setting the deflector, (b) holes for measurement (labelled as A-I).
Figure 6.
The small holes processed on the Plexiglas: (a) holes for setting the deflector, (b) holes for measurement (labelled as A-I).
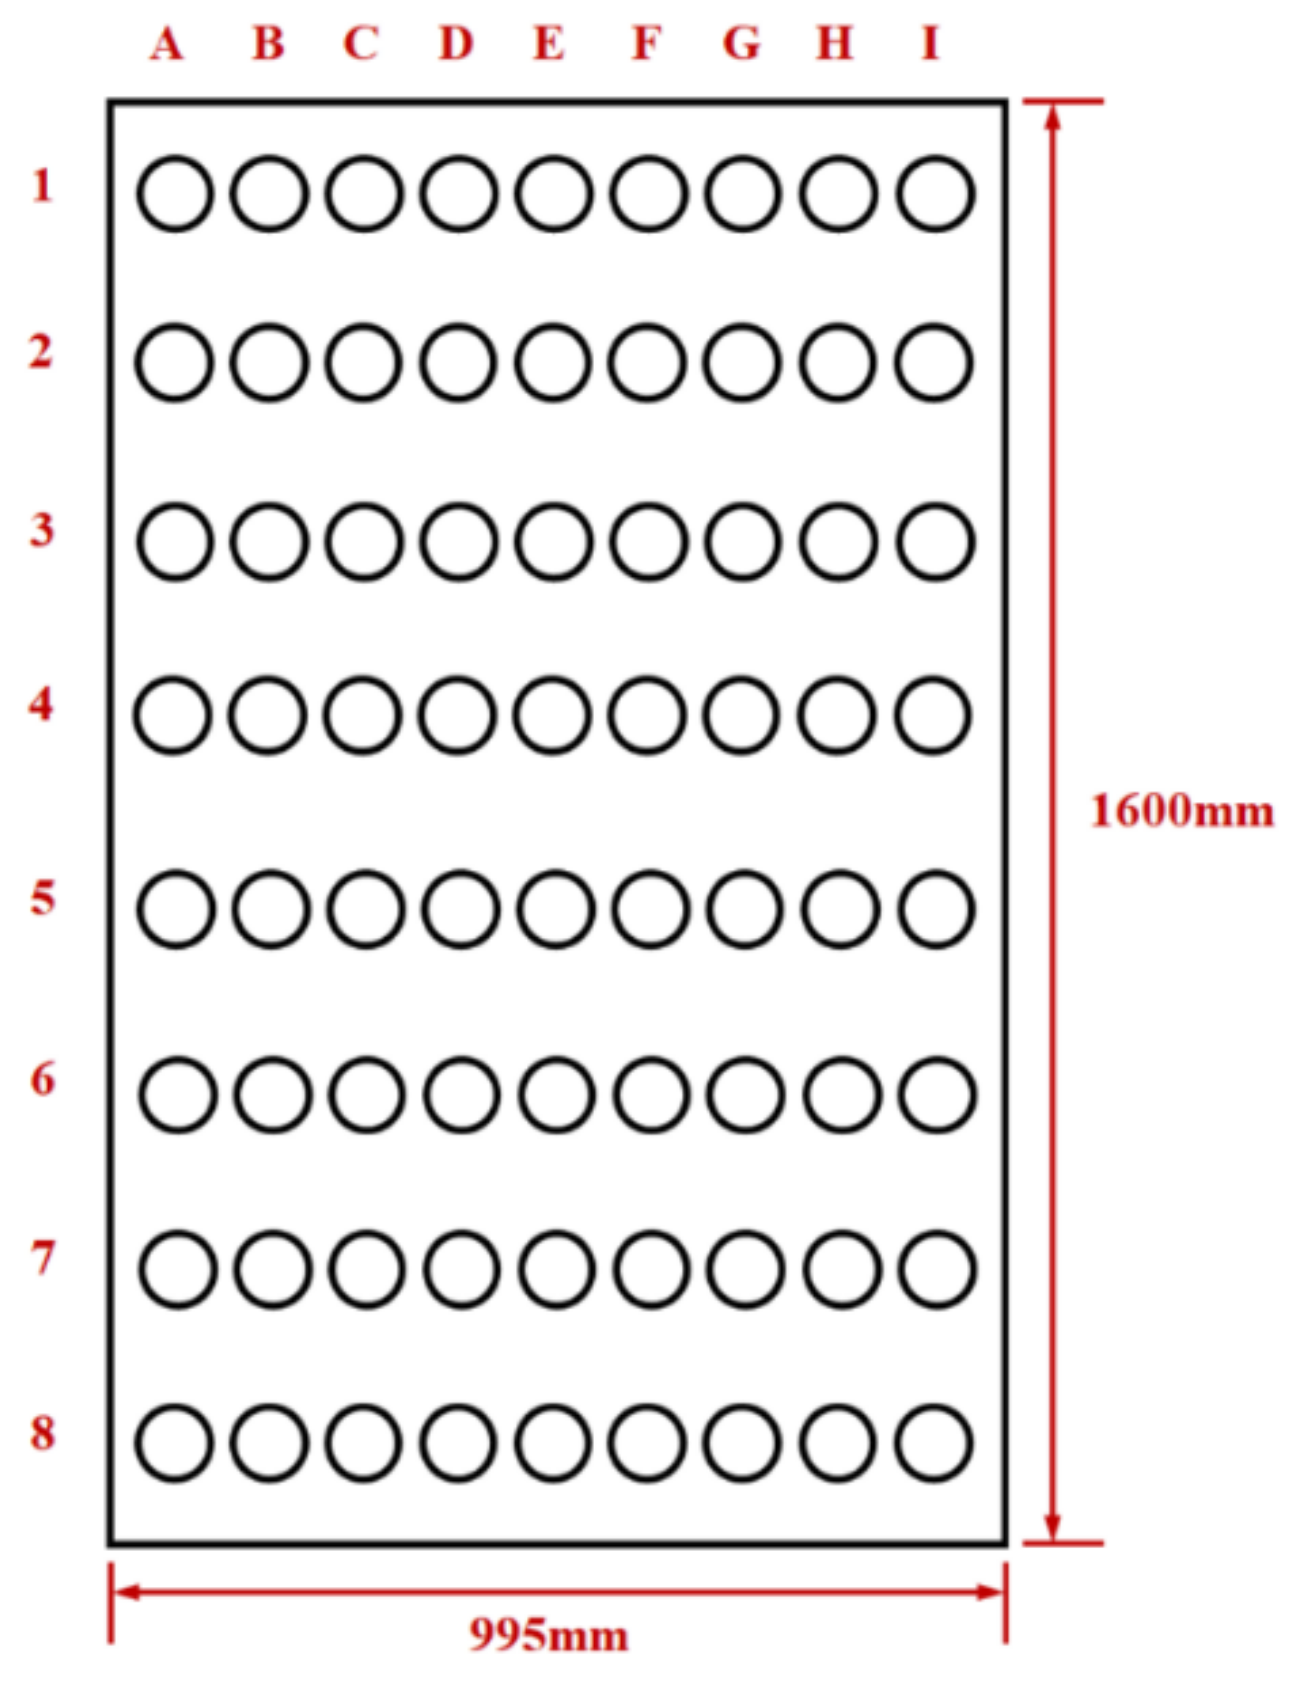
Figure 7.
The sketch map of the detection spots over the perforated plate.
Figure 7.
The sketch map of the detection spots over the perforated plate.
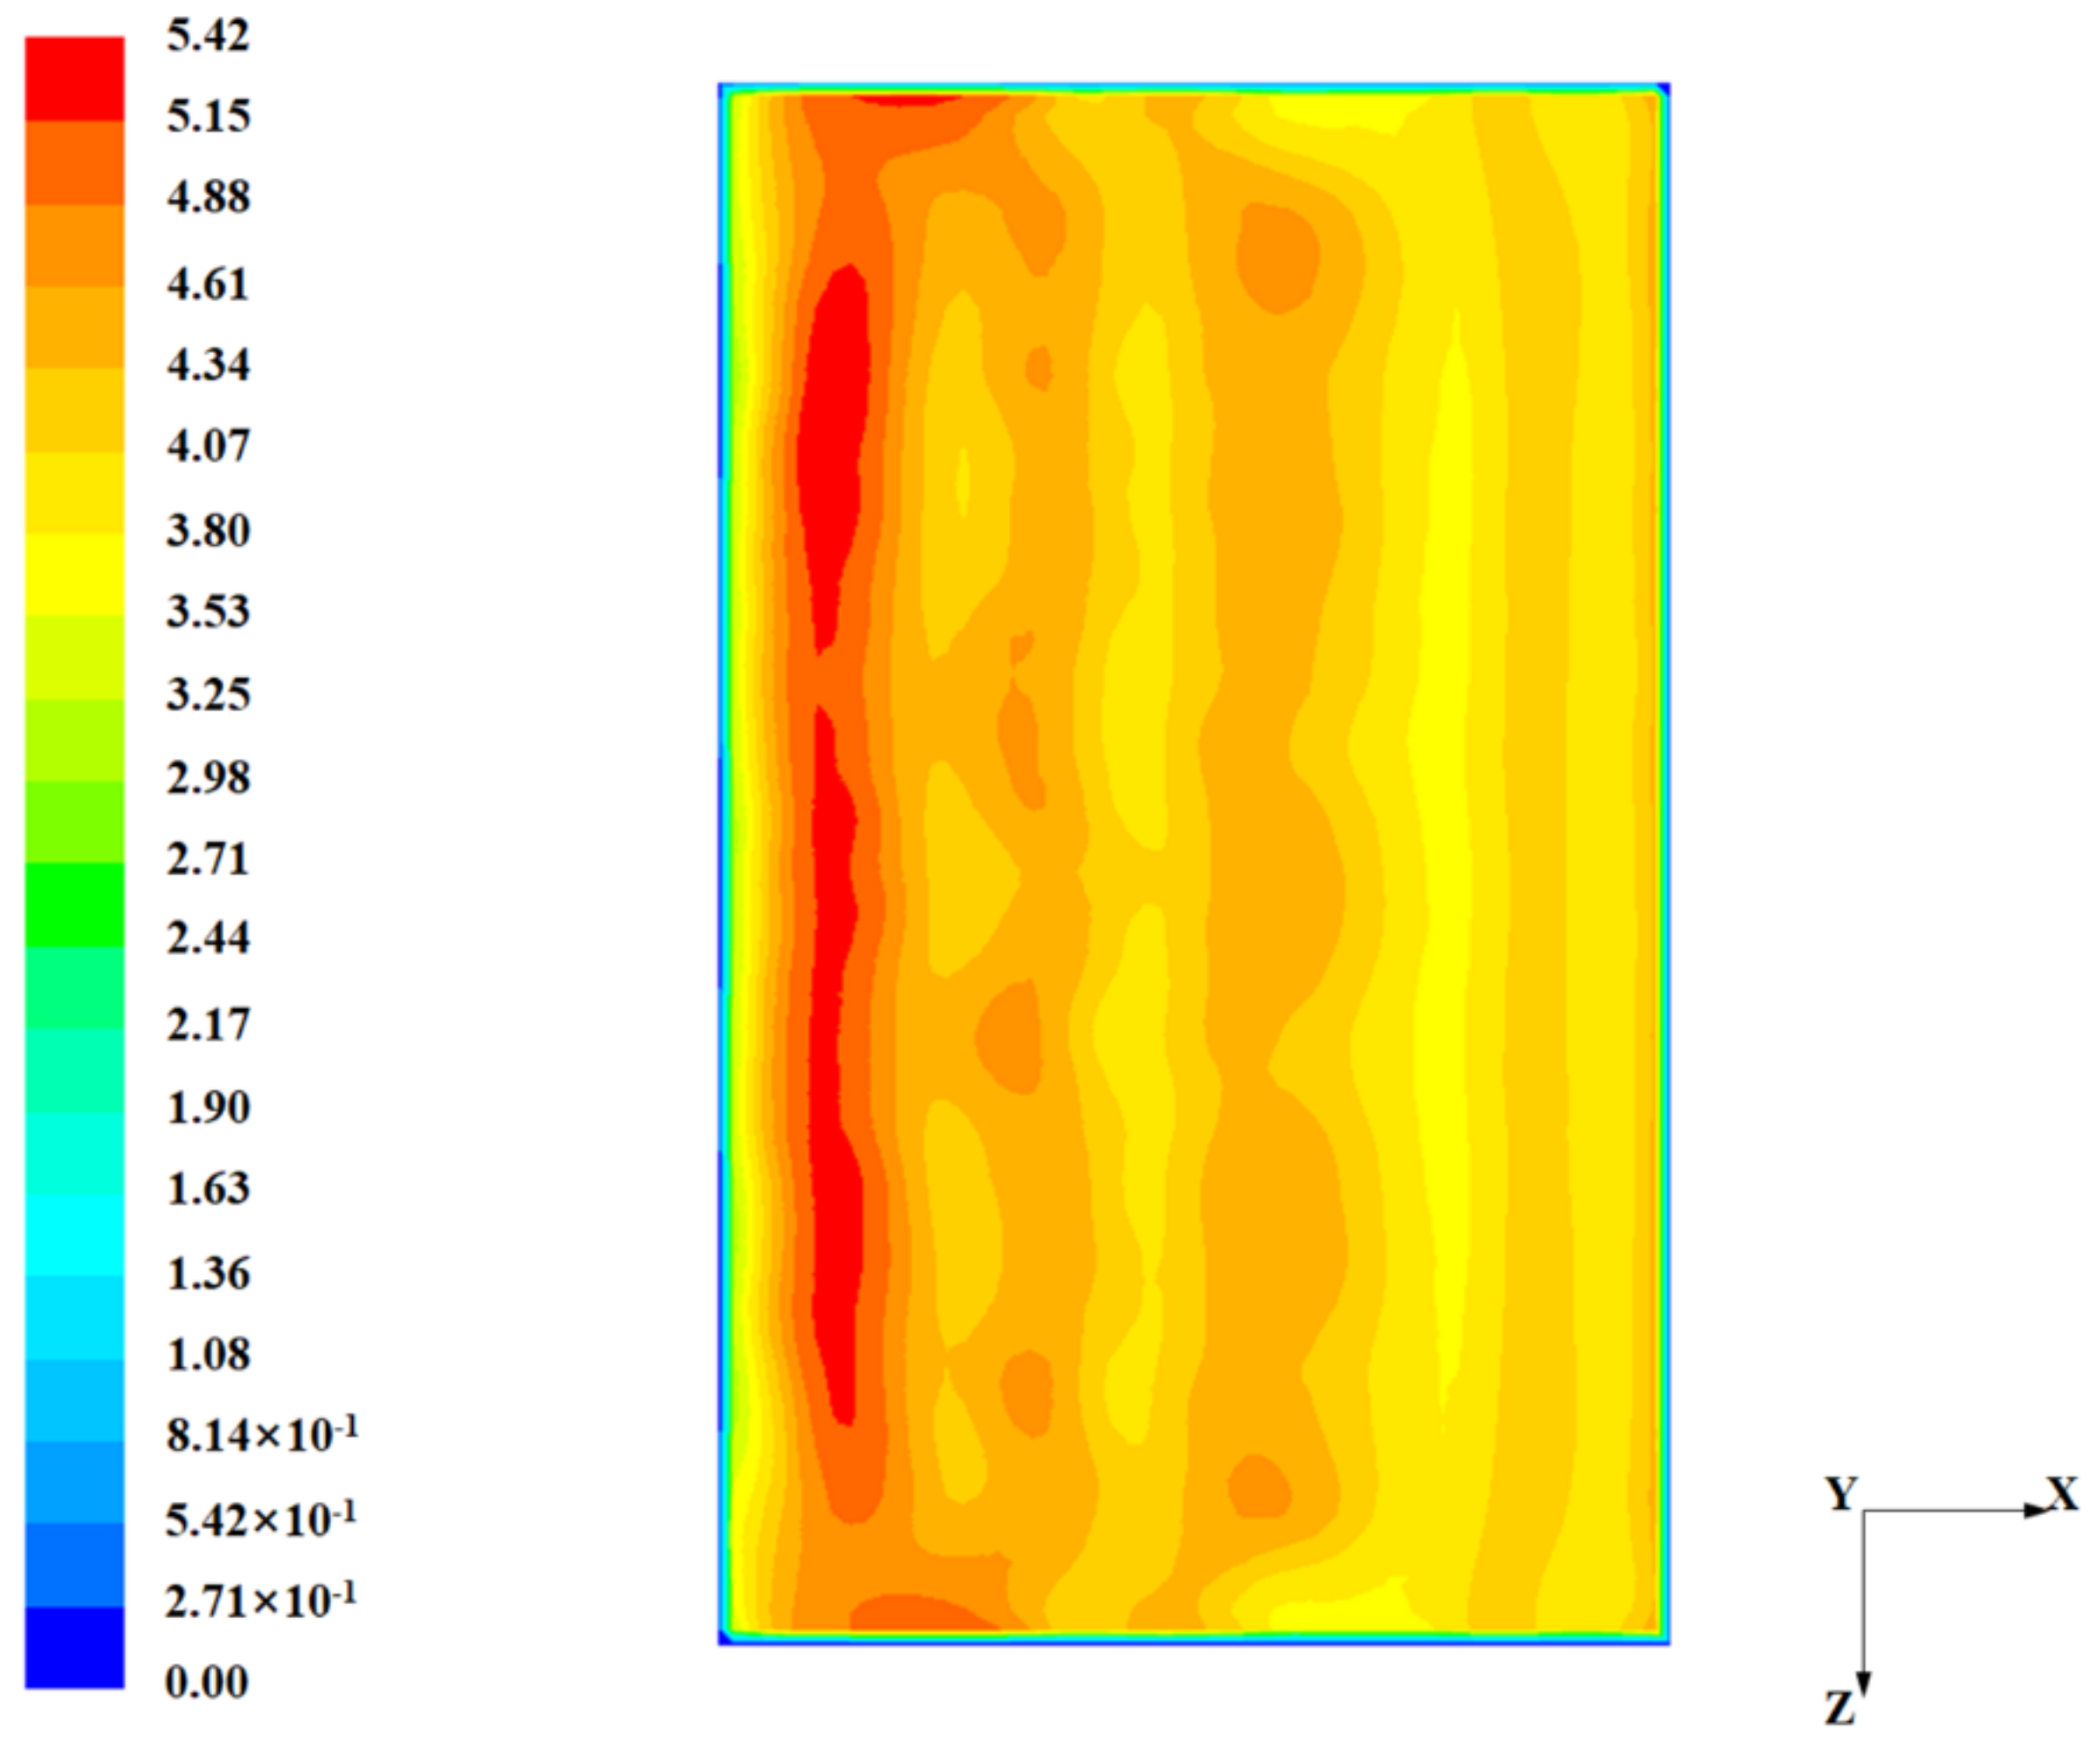
Figure 8.
Contours of gas velocity at plane 1 with no deflector (unit: m/s).
Figure 8.
Contours of gas velocity at plane 1 with no deflector (unit: m/s).
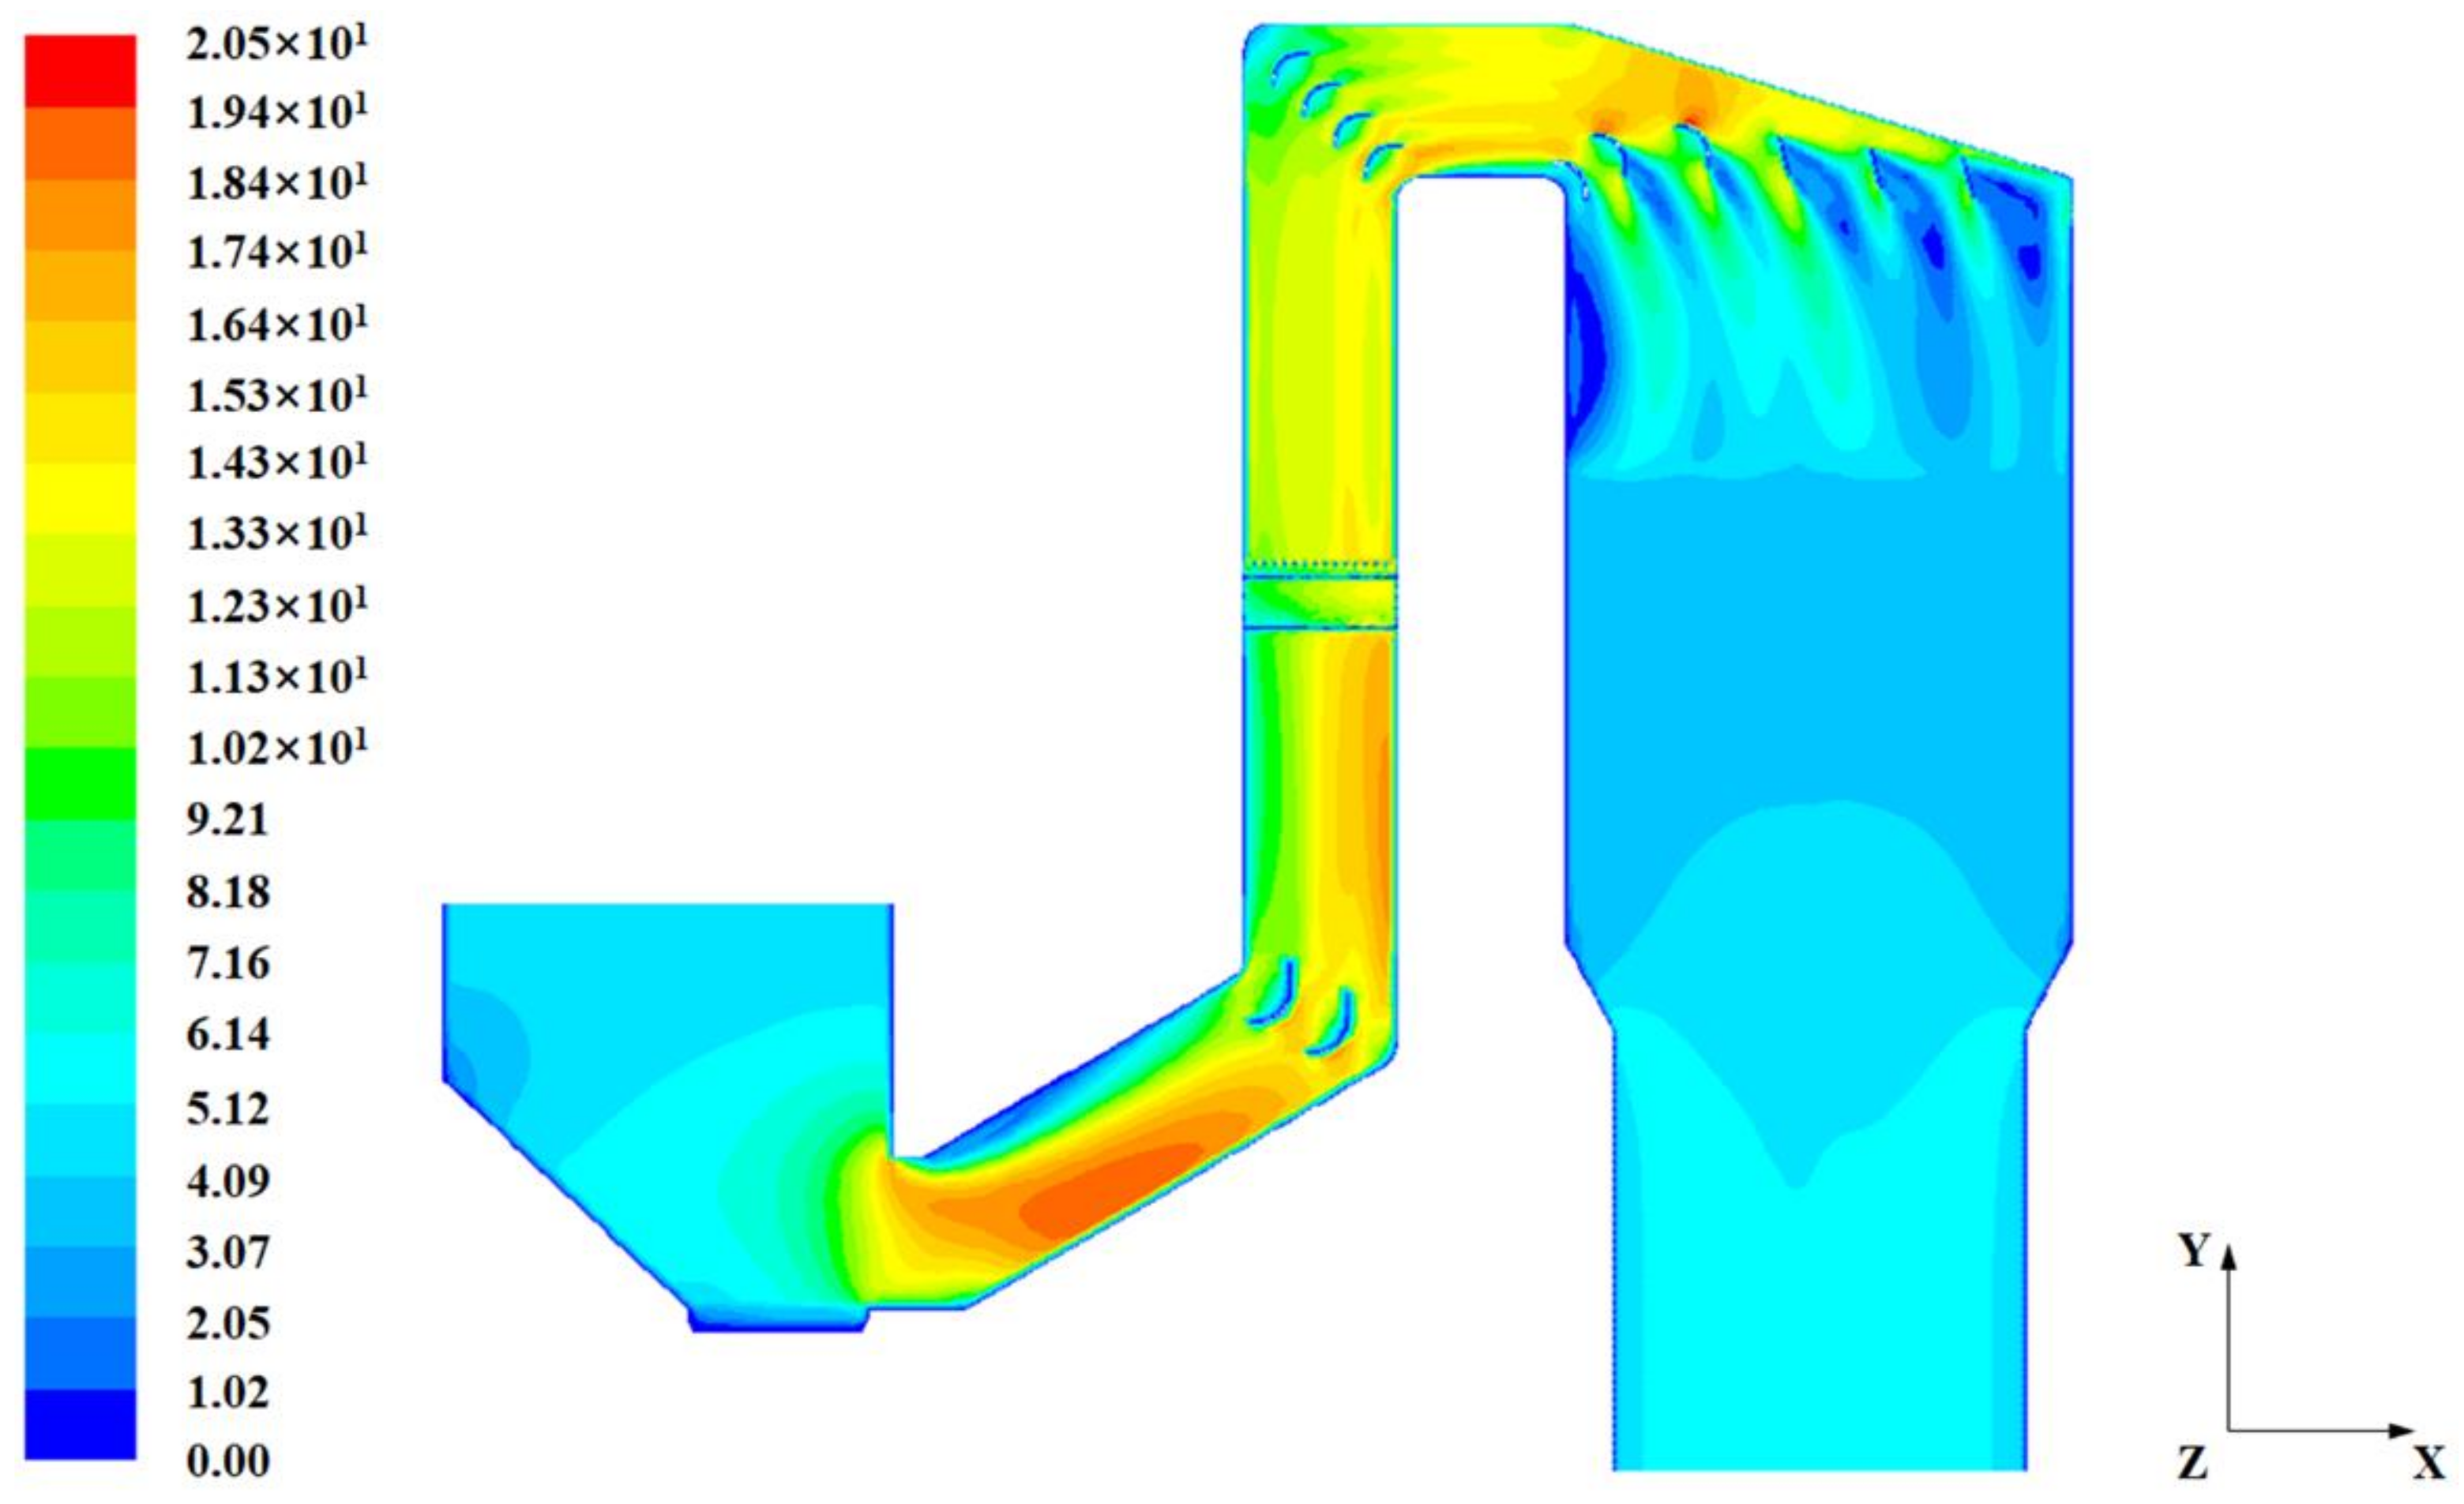
Figure 9.
Contours of gas velocity at the central section (unit: m/s).
Figure 9.
Contours of gas velocity at the central section (unit: m/s).
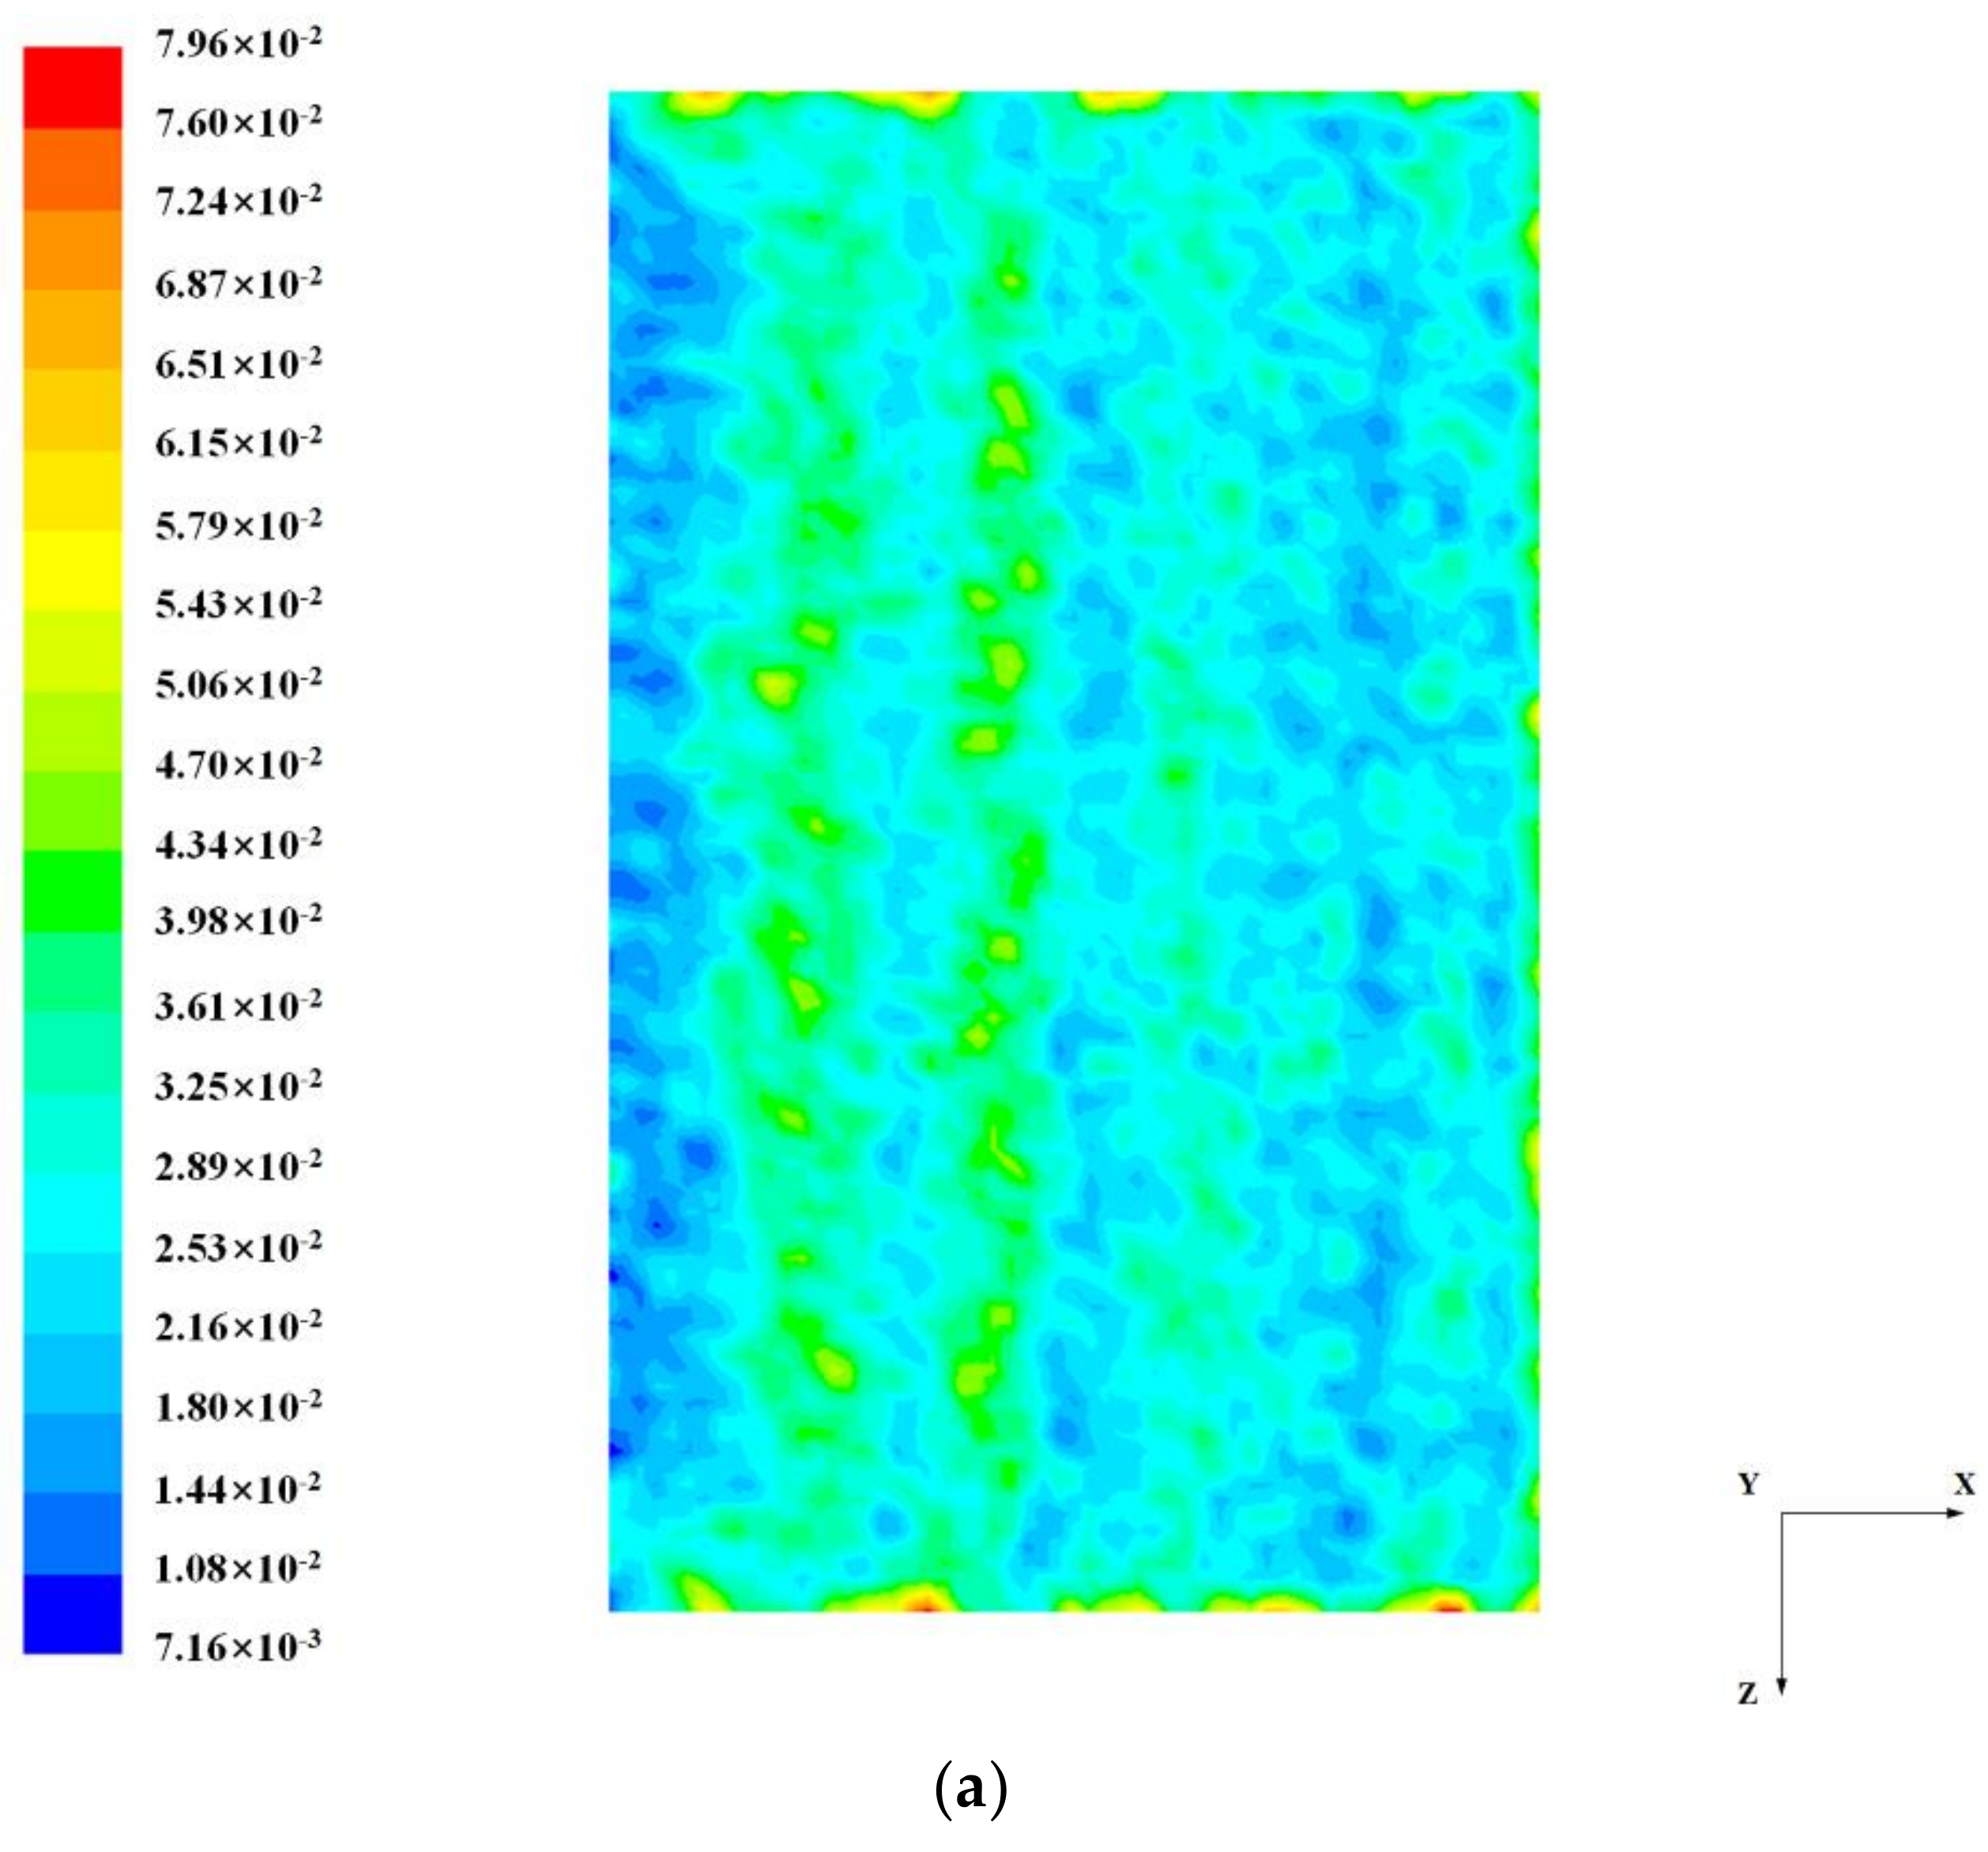
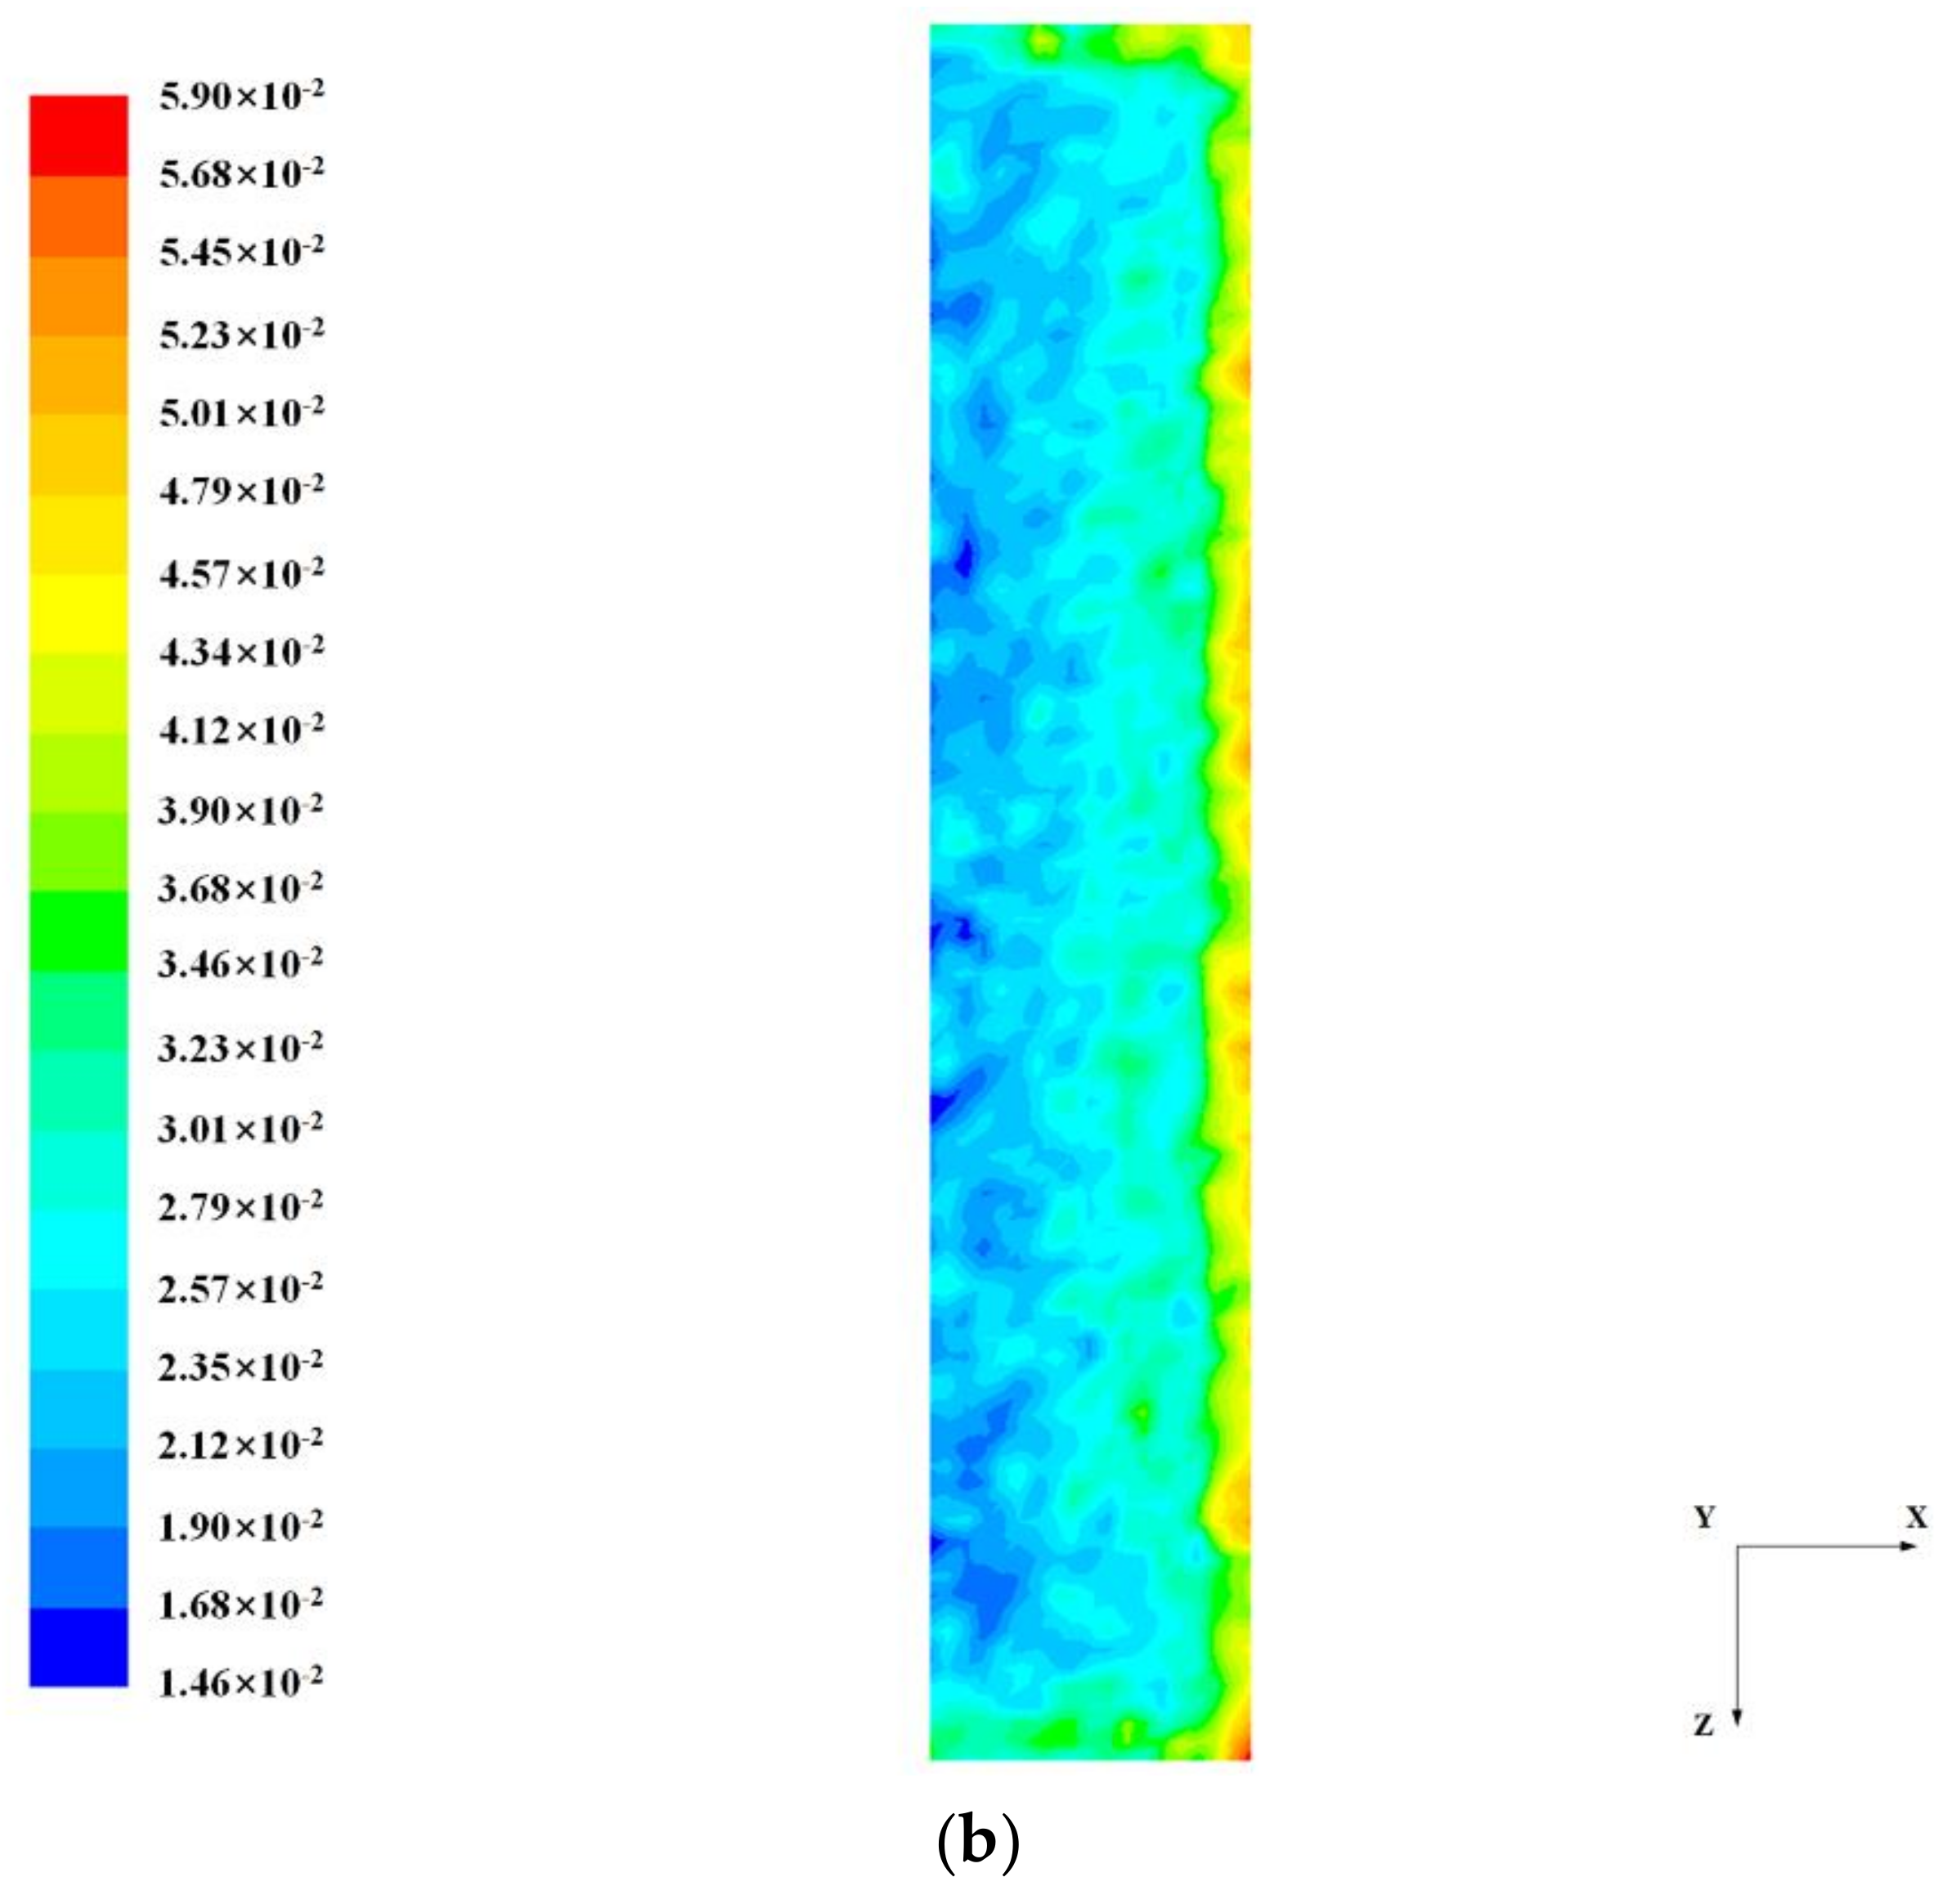
Figure 10.
Contours of particle concentration: (a) plane 1, (b) plane 2 (unit: g/m3).
Figure 10.
Contours of particle concentration: (a) plane 1, (b) plane 2 (unit: g/m3).
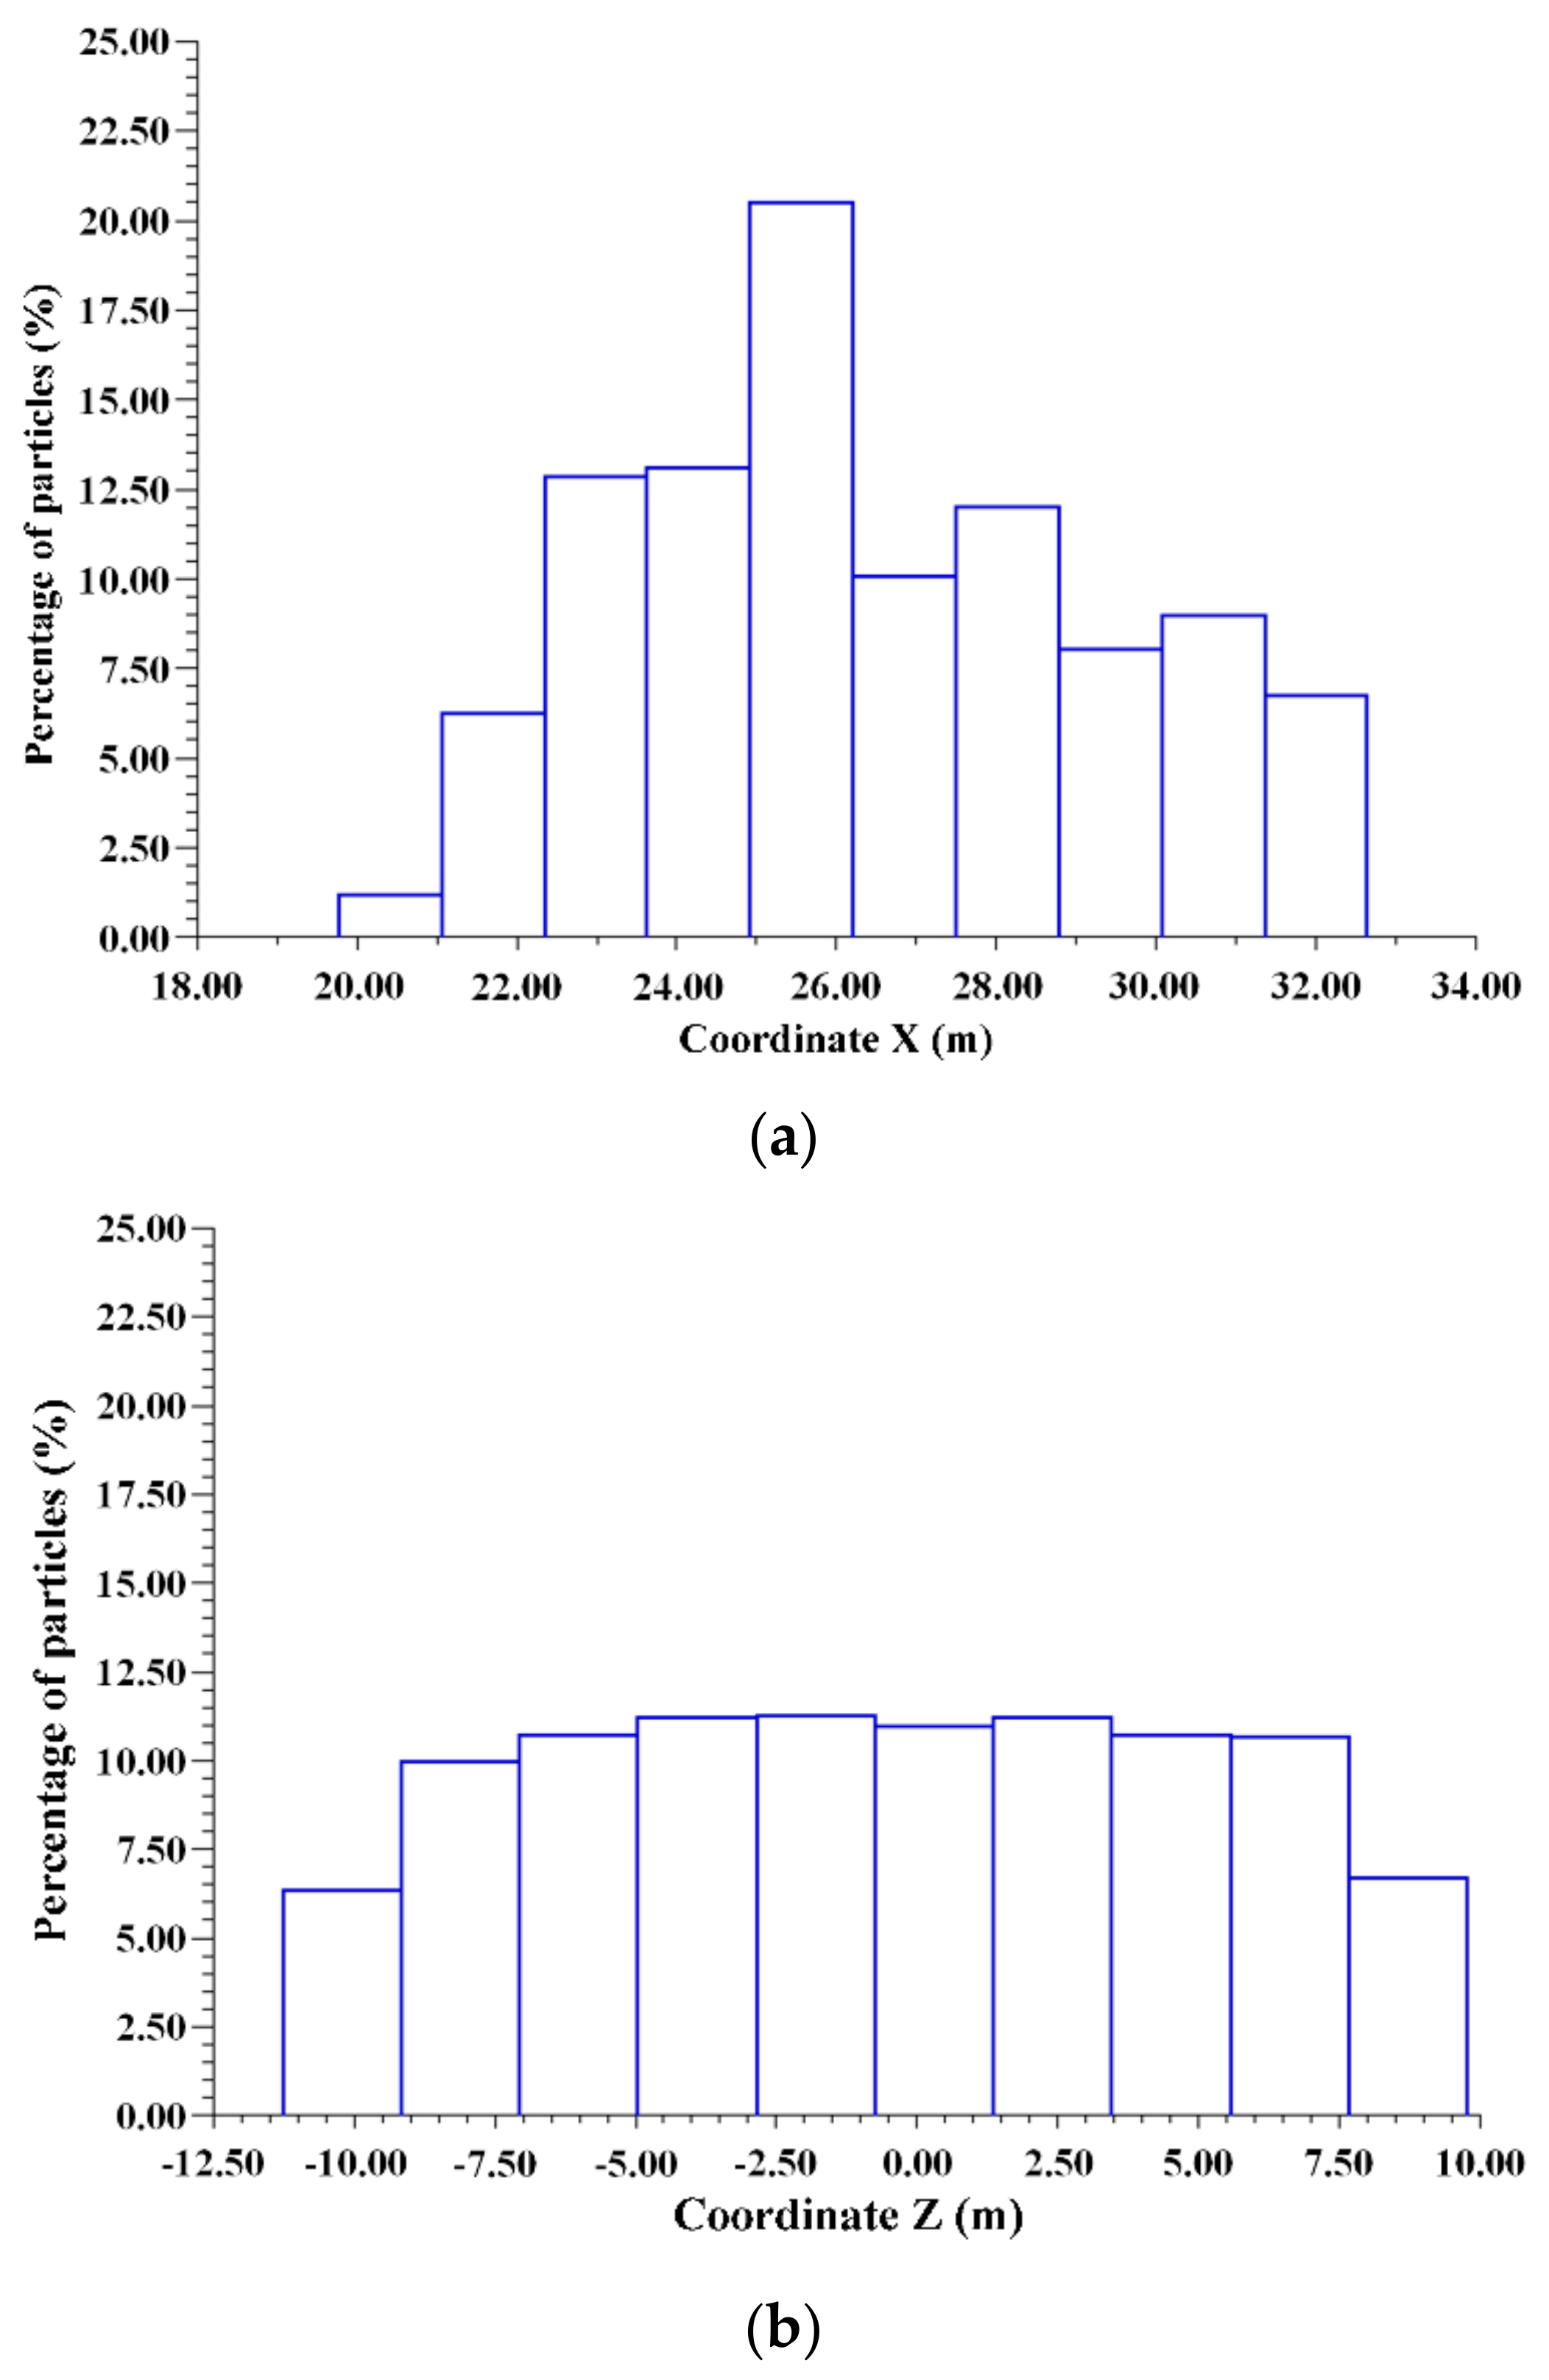
Figure 11.
Histogram graphs of particle distributions at plane 1: (a) along the X-direction, (b) along the Z-direction.
Figure 11.
Histogram graphs of particle distributions at plane 1: (a) along the X-direction, (b) along the Z-direction.
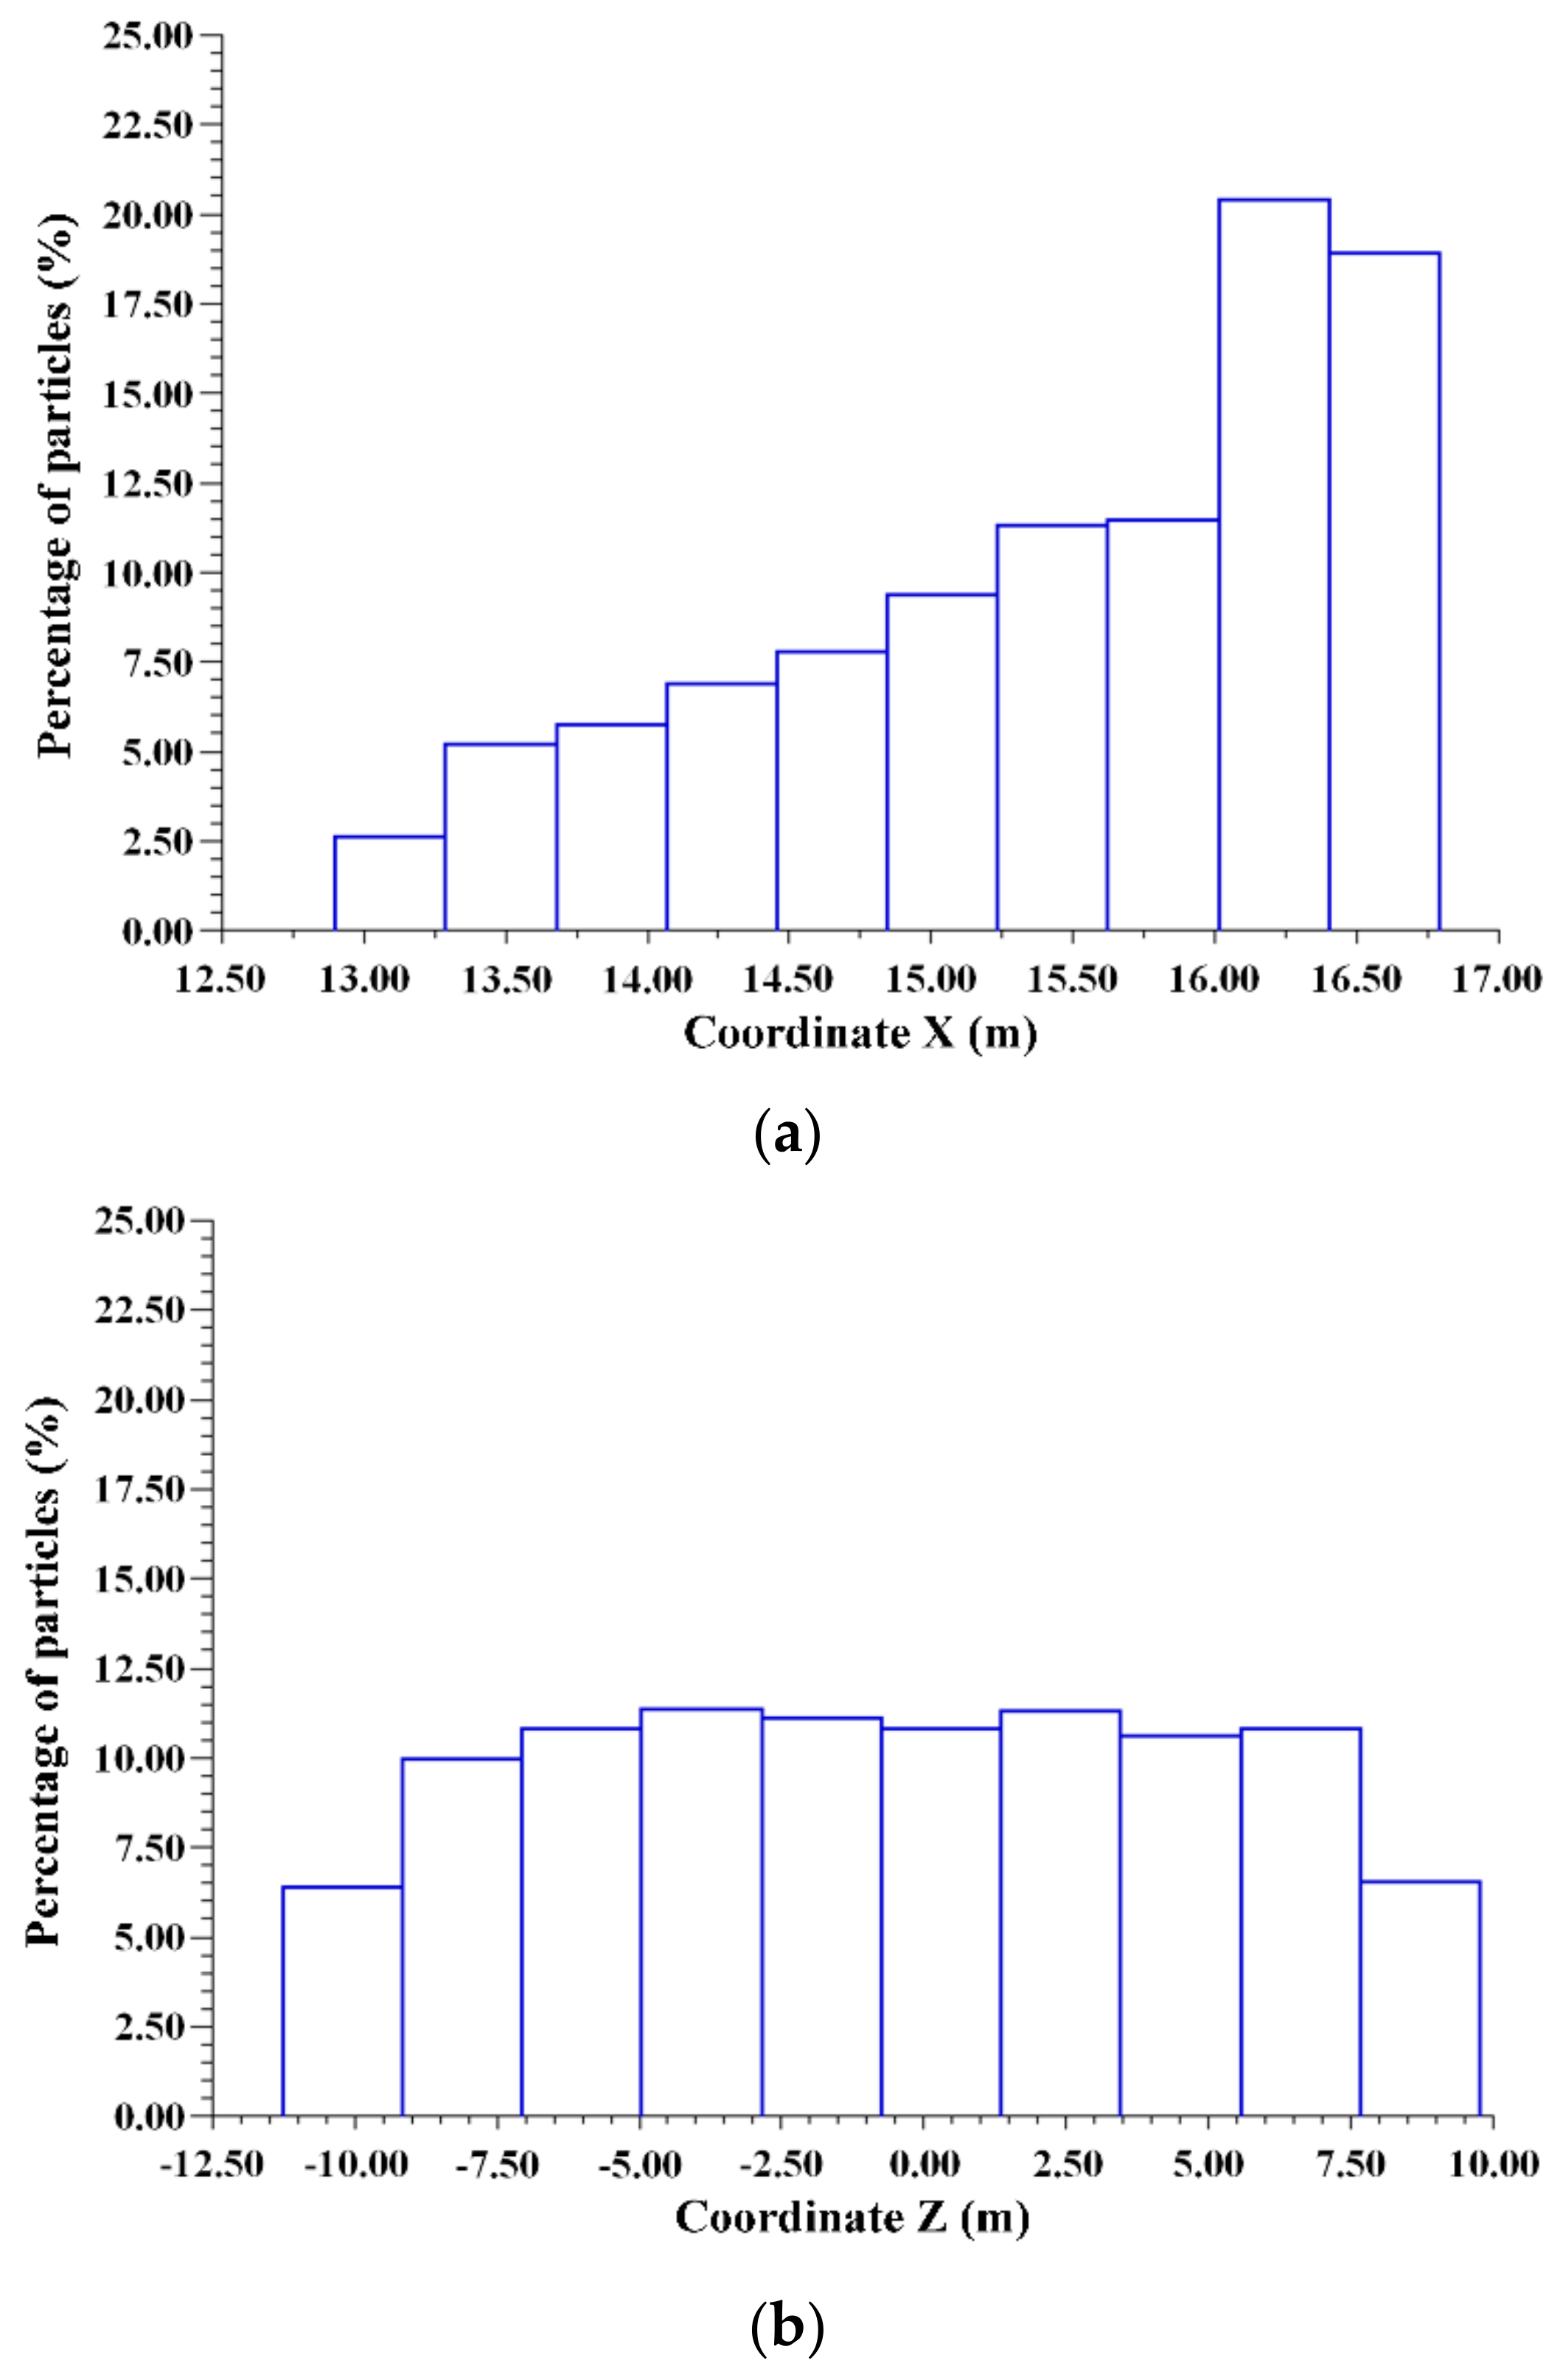
Figure 12.
Histogram graphs of particle distributions at plane 2: (a) along the X-direction, (b) along the Z-direction.
Figure 12.
Histogram graphs of particle distributions at plane 2: (a) along the X-direction, (b) along the Z-direction.
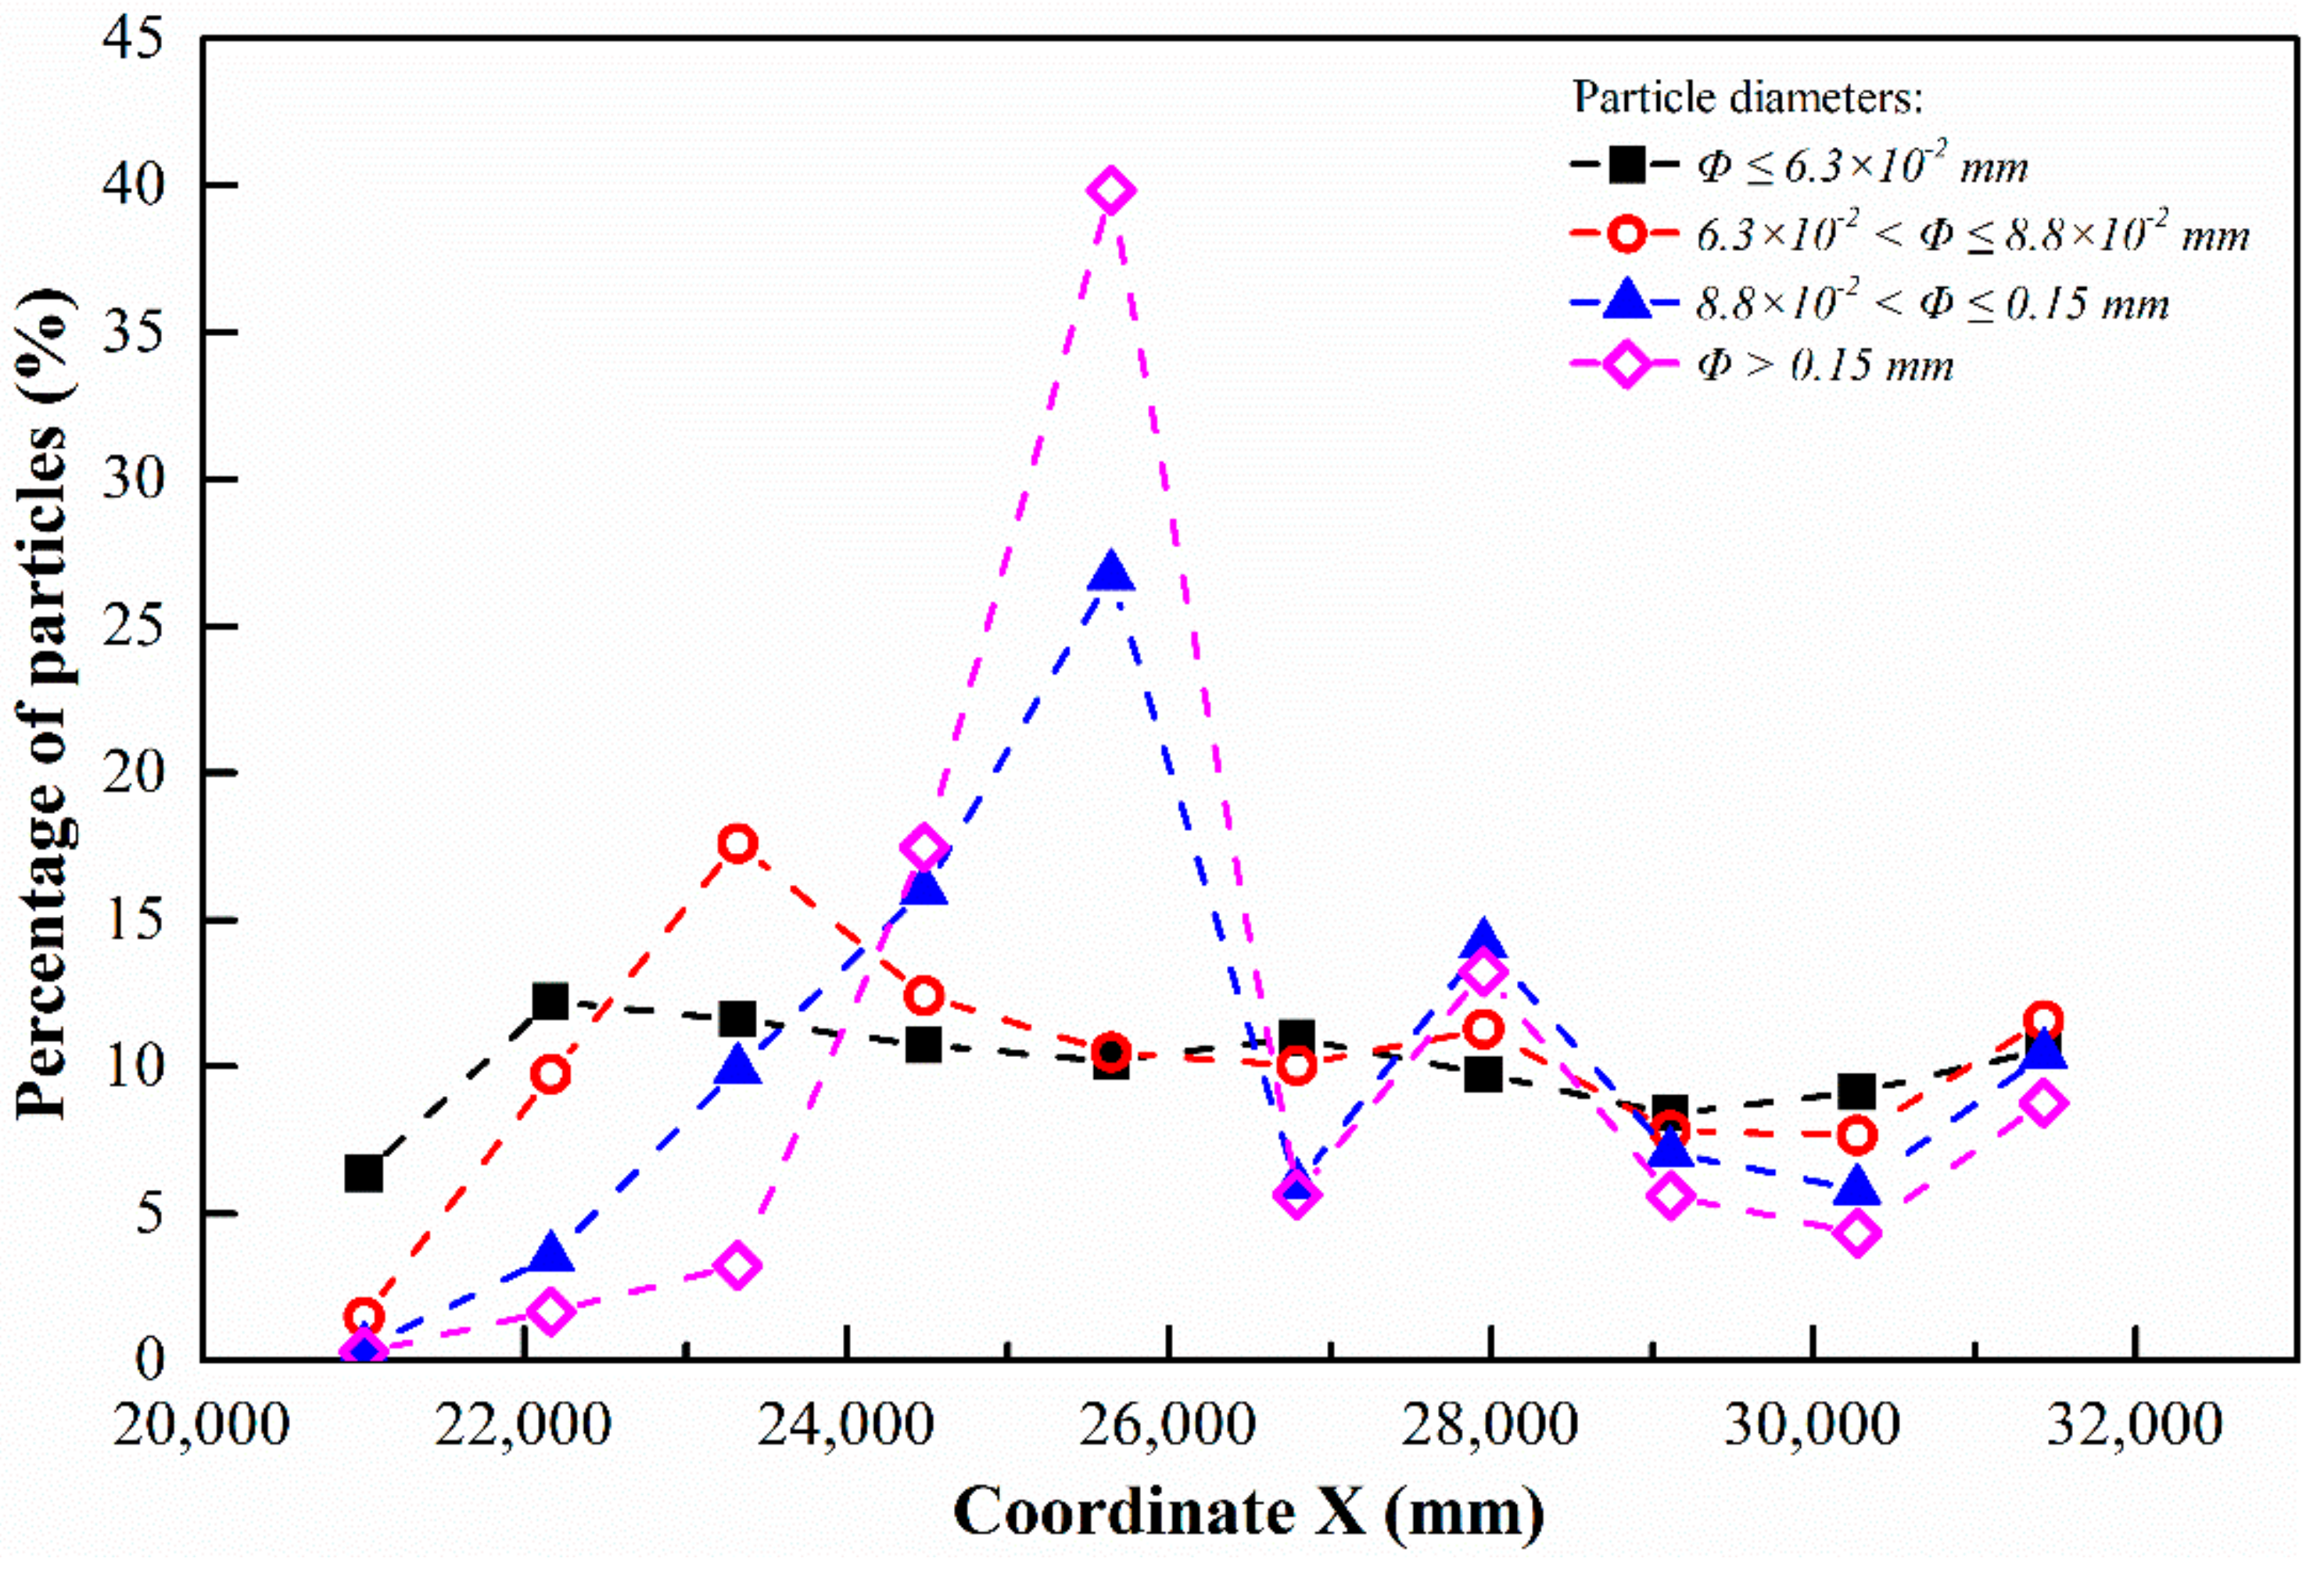
Figure 13.
The distributions of the four classes of particles at plane 1 with no deflector installed.
Figure 13.
The distributions of the four classes of particles at plane 1 with no deflector installed.
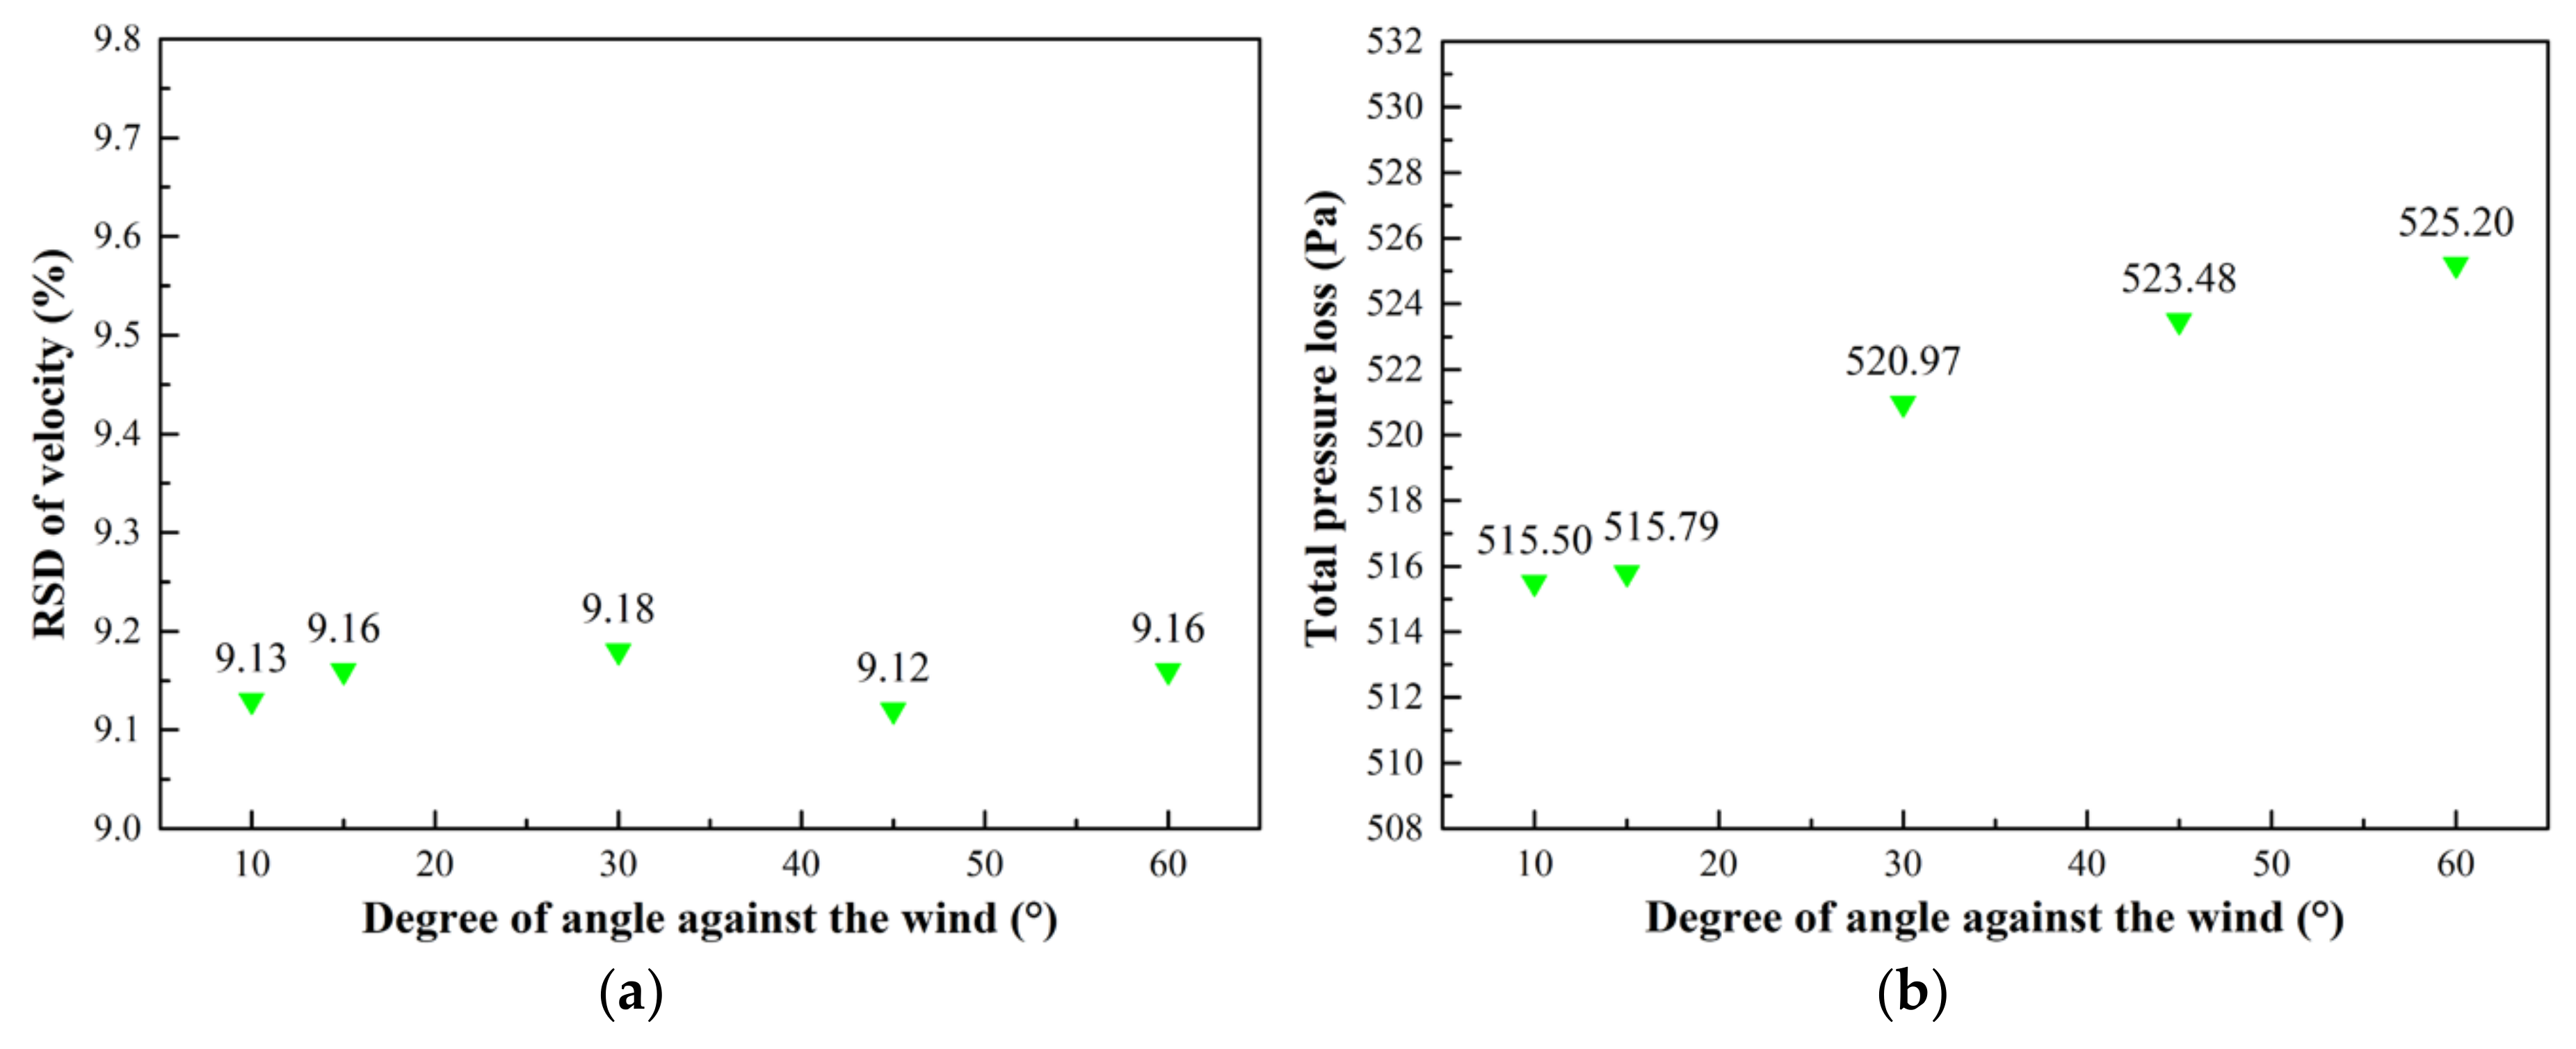
Figure 14.
Statistical indices for deflectors with different angles against the wind: (a) the relative standard deviation (RSDs) of velocity, (b) the total pressure loss.
Figure 14.
Statistical indices for deflectors with different angles against the wind: (a) the relative standard deviation (RSDs) of velocity, (b) the total pressure loss.
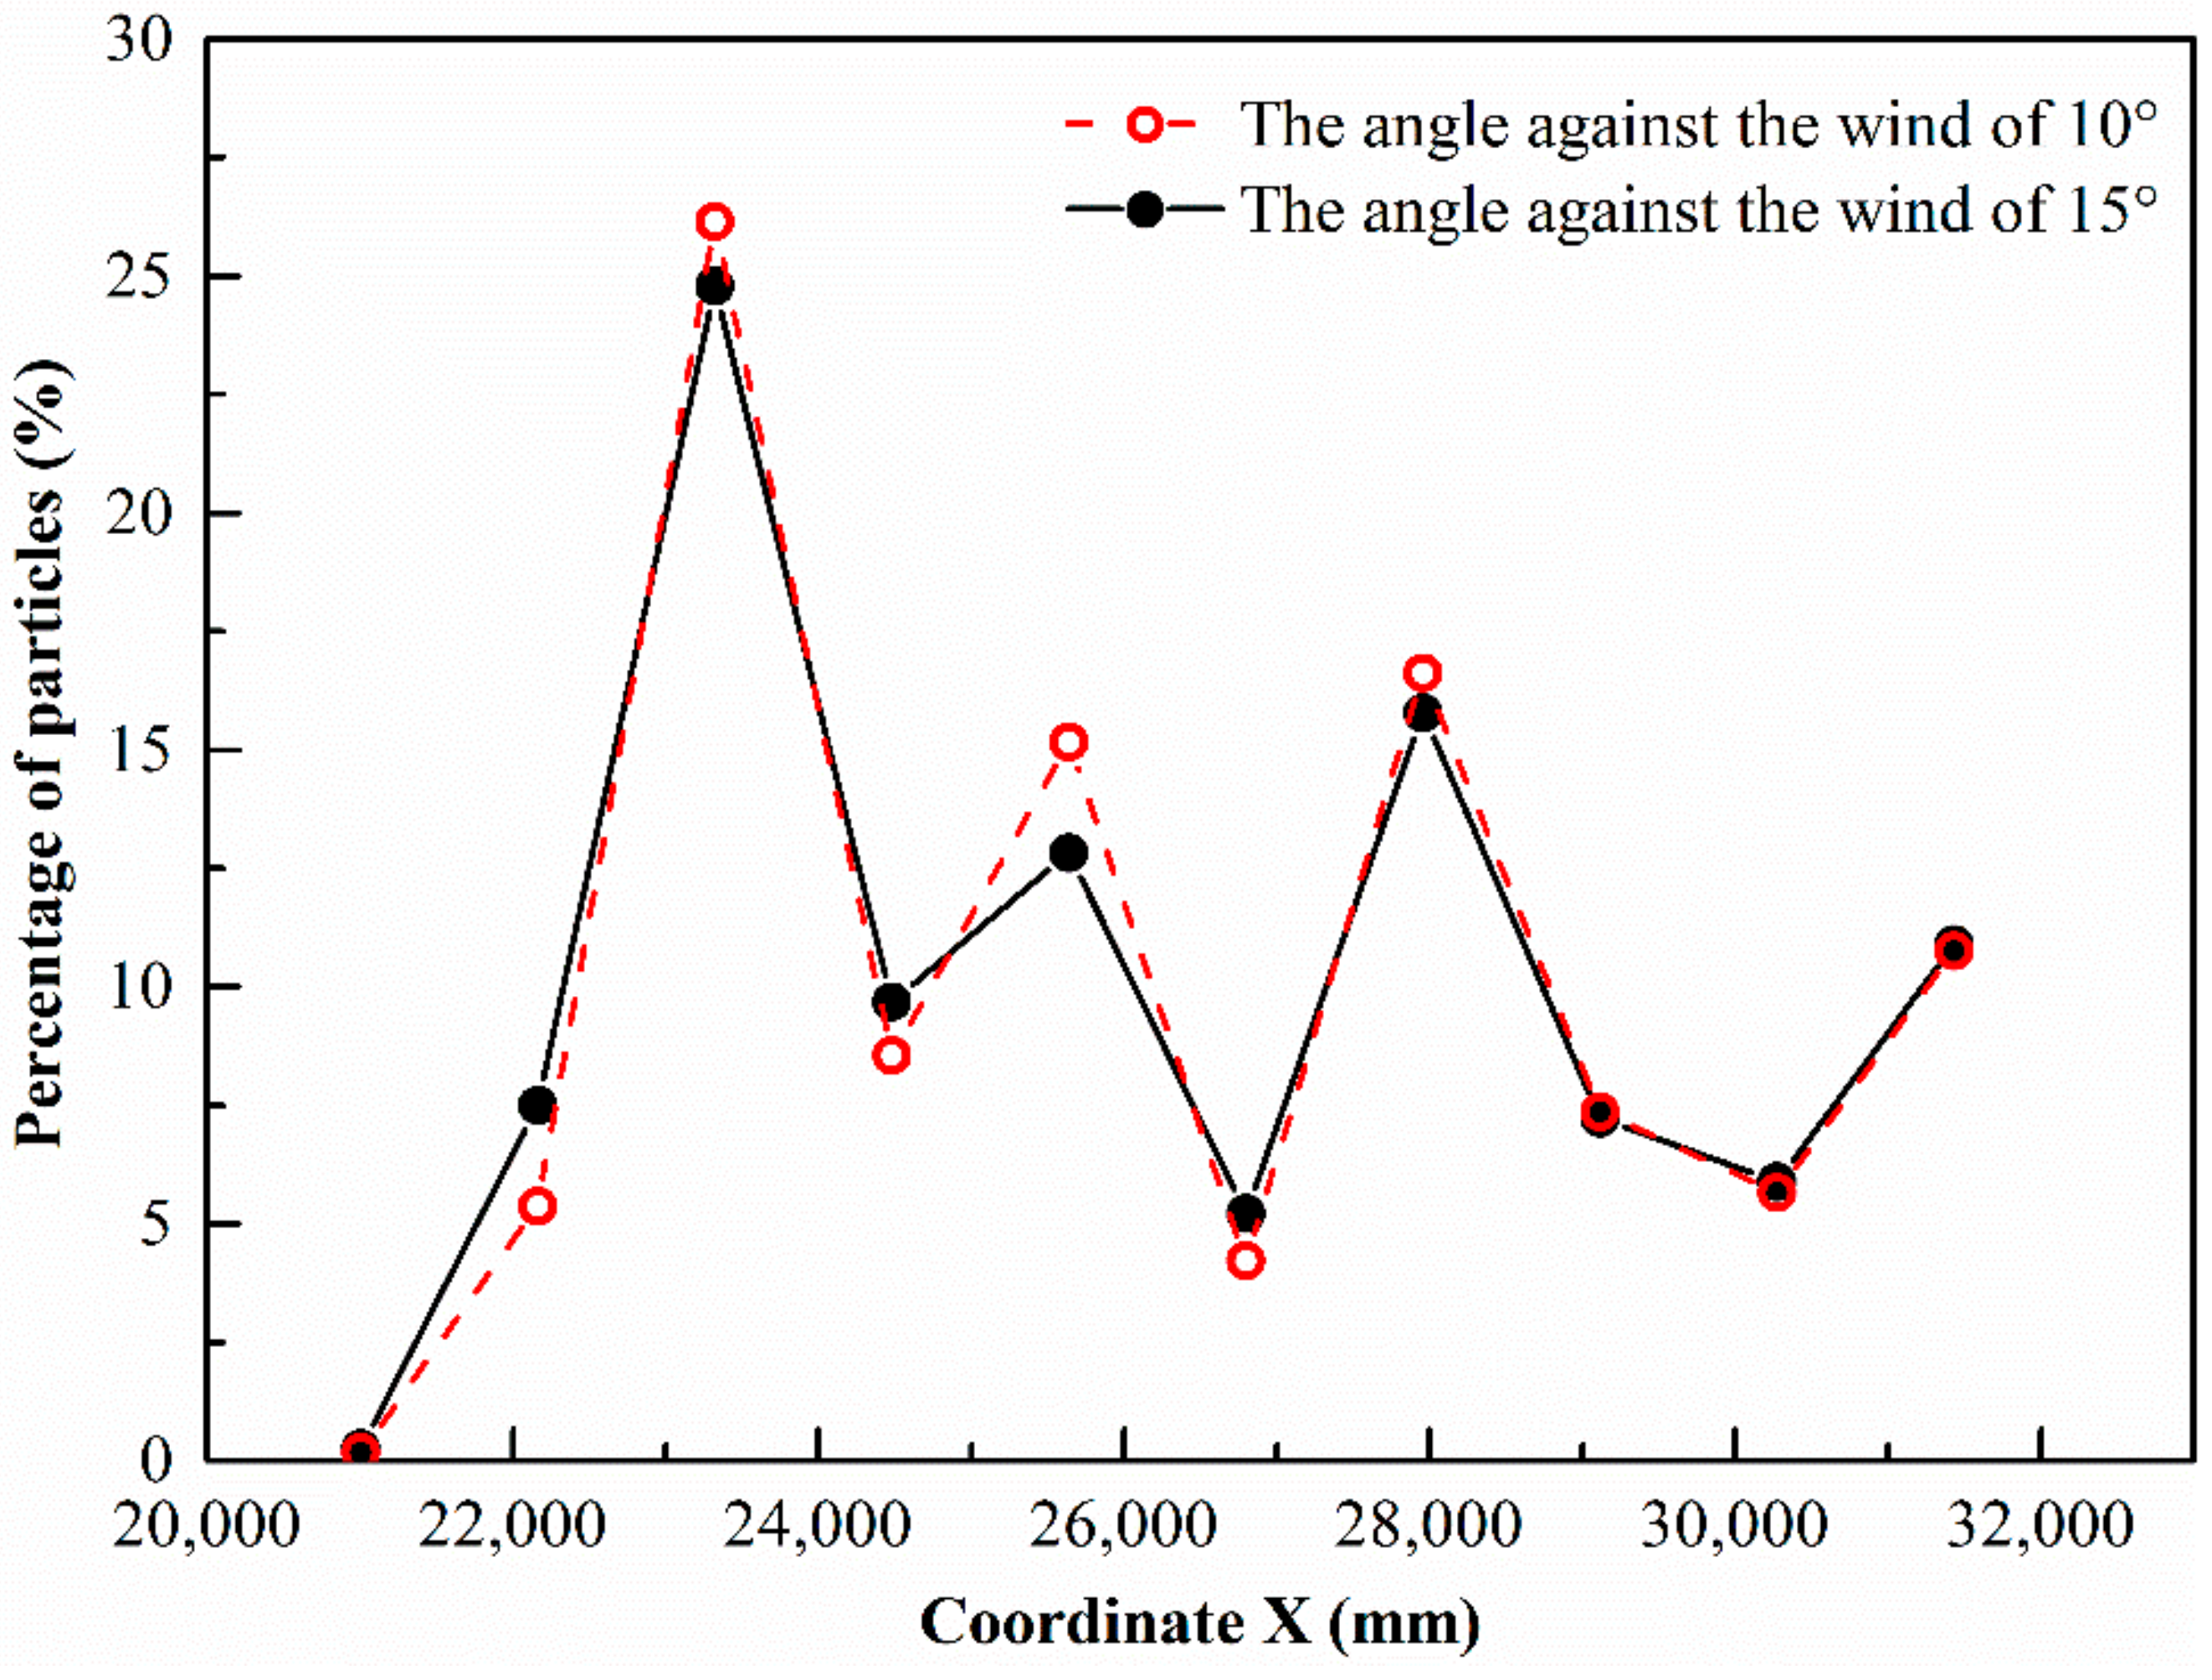
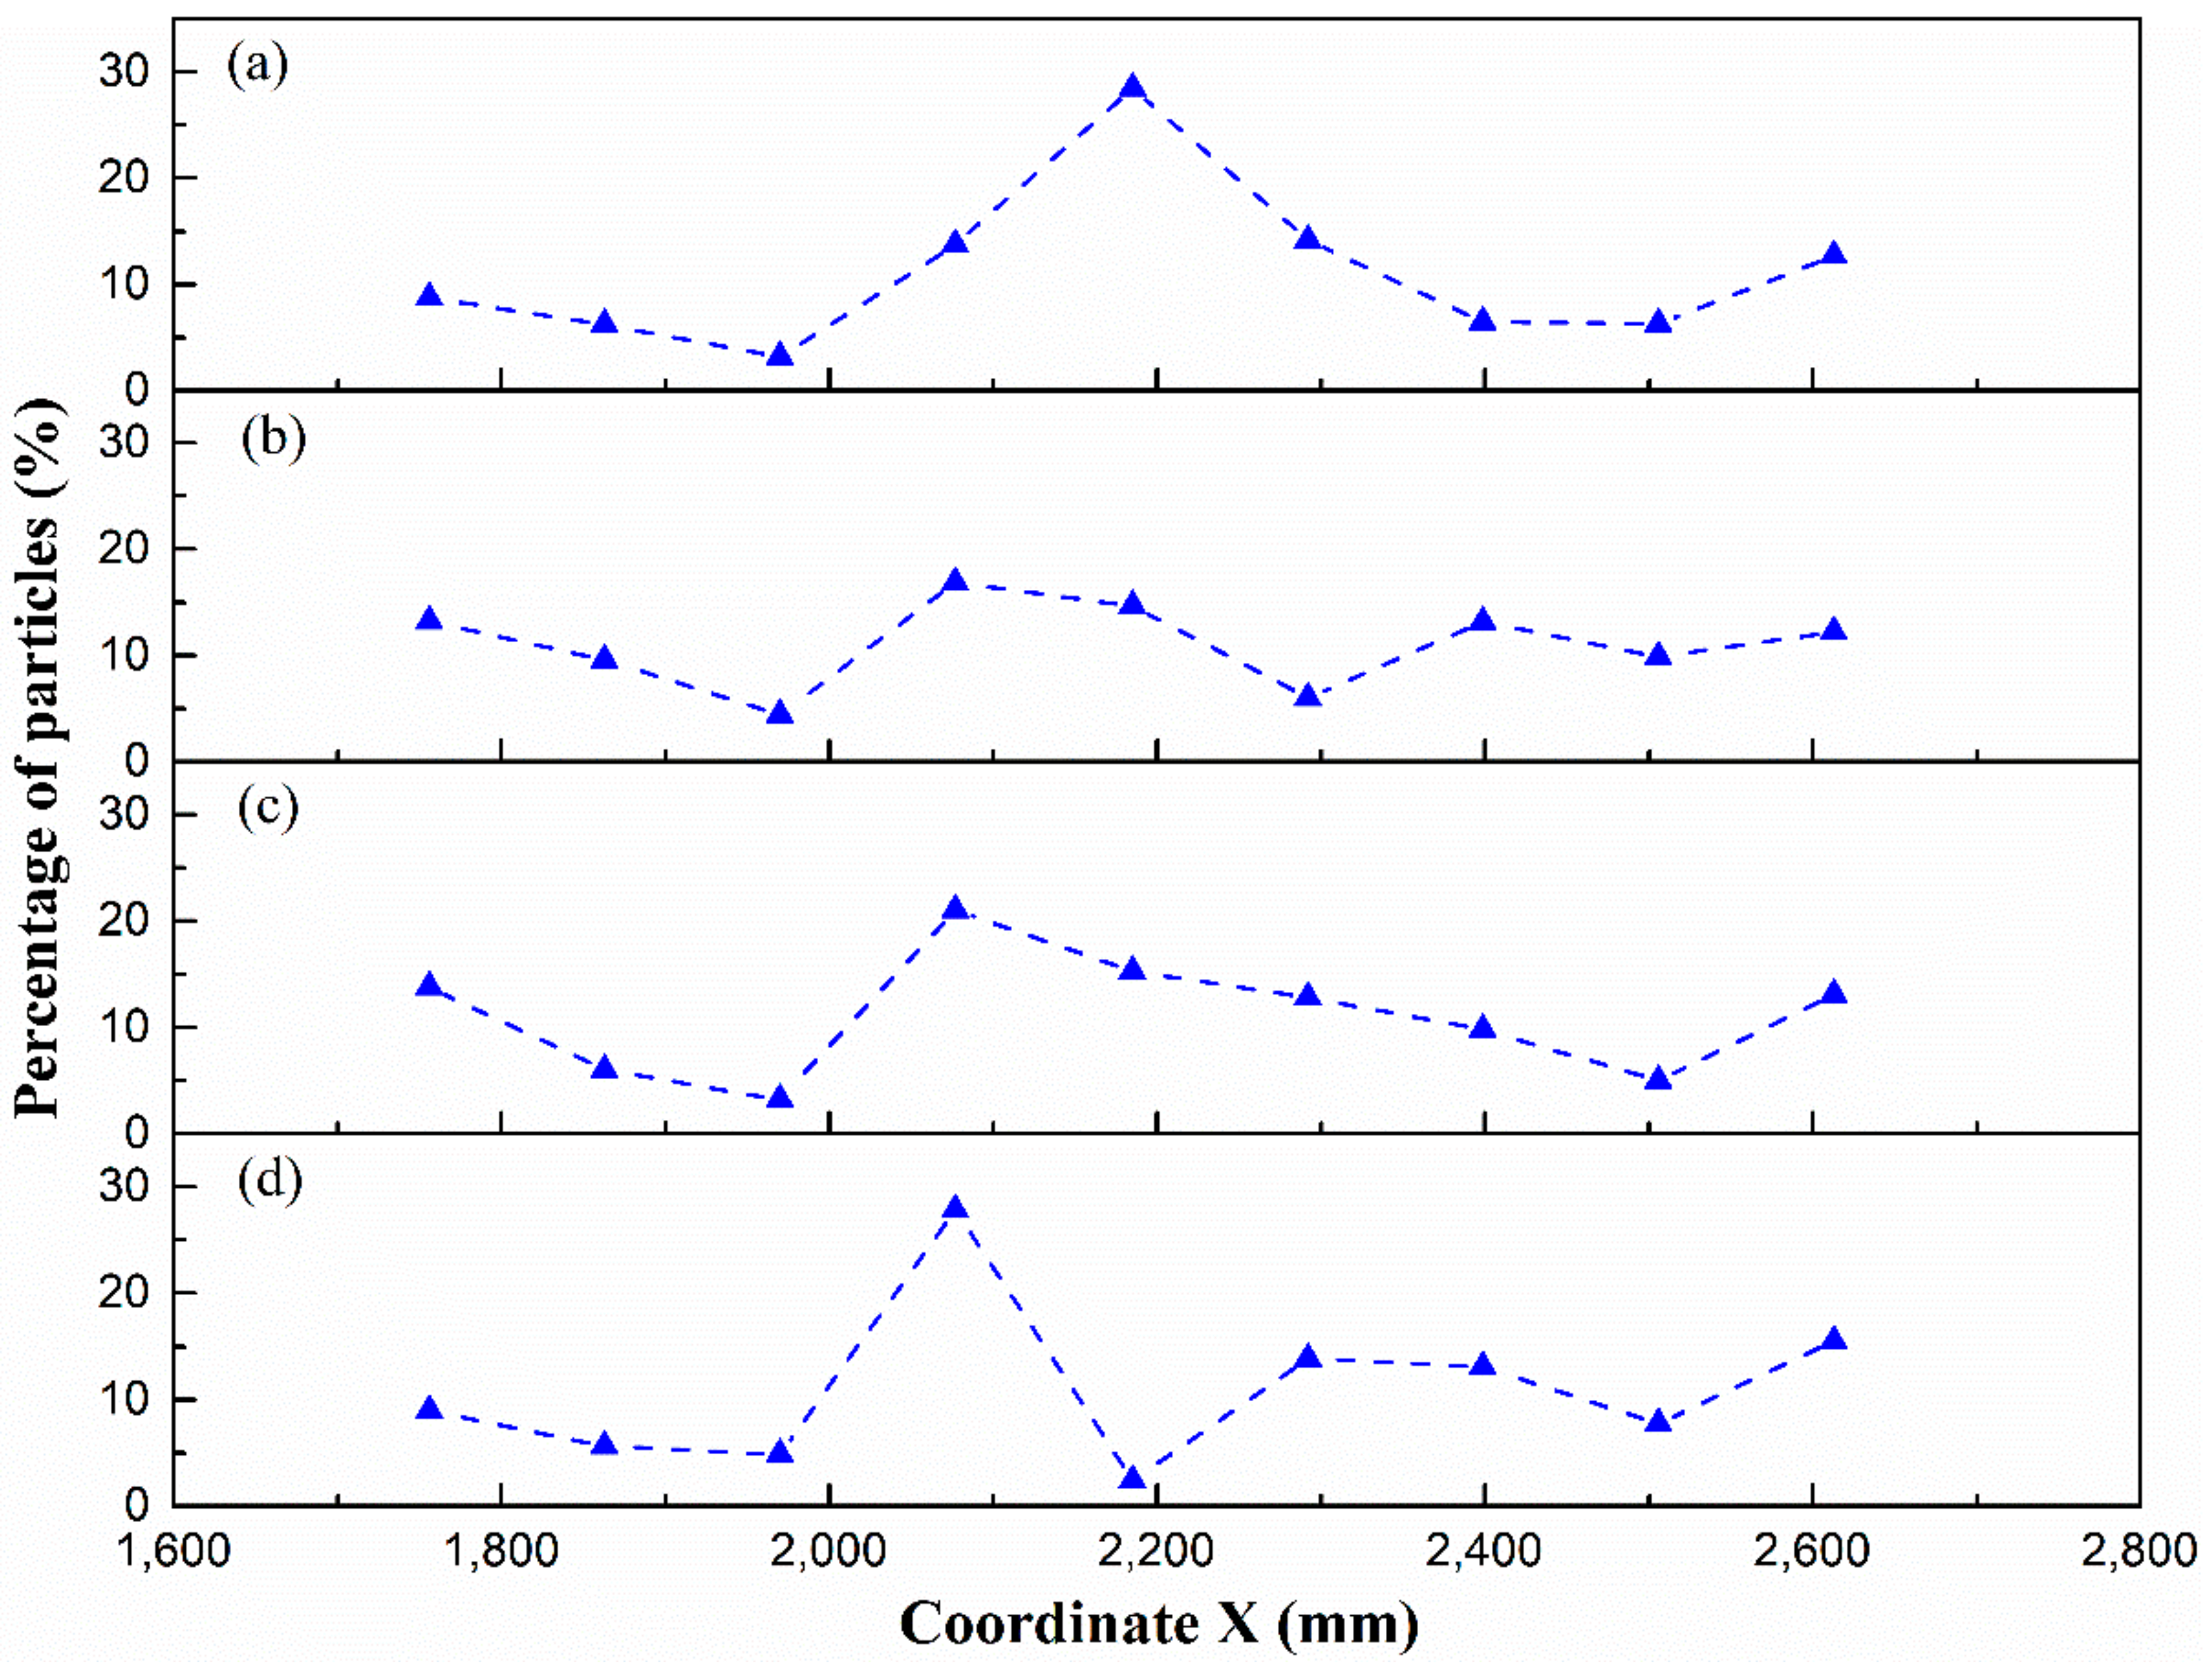
Figure 15.
The distributions of the particles larger than 8.8 × 10⁻² mm for the deflectors of different angles.
Figure 15.
The distributions of the particles larger than 8.8 × 10⁻² mm for the deflectors of different angles.
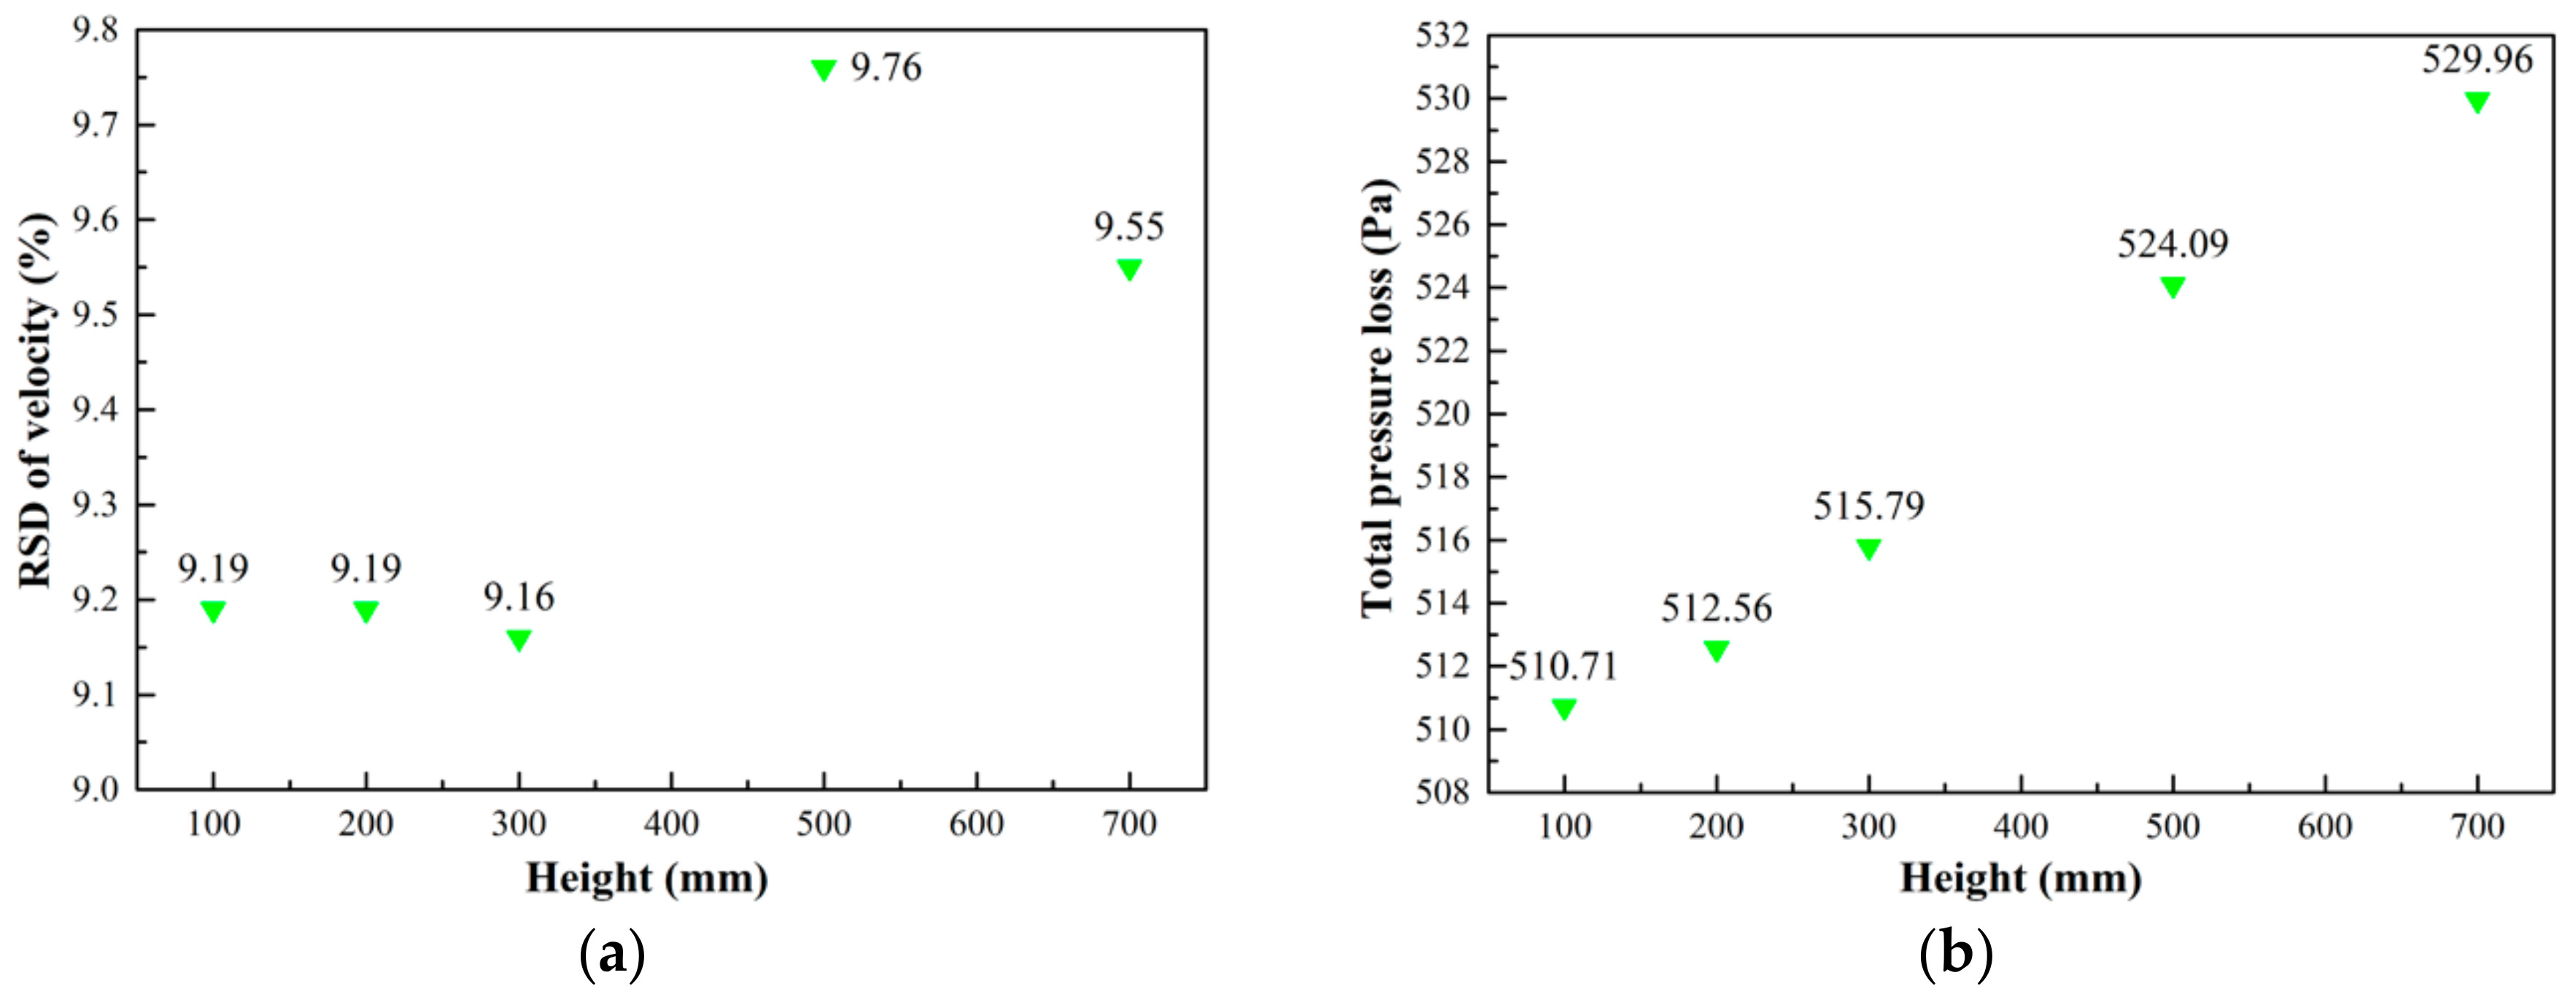
Figure 16.
Statistical indices for deflectors with different heights: (a) the RSDs of velocity, (b) the total pressure loss.
Figure 16.
Statistical indices for deflectors with different heights: (a) the RSDs of velocity, (b) the total pressure loss.
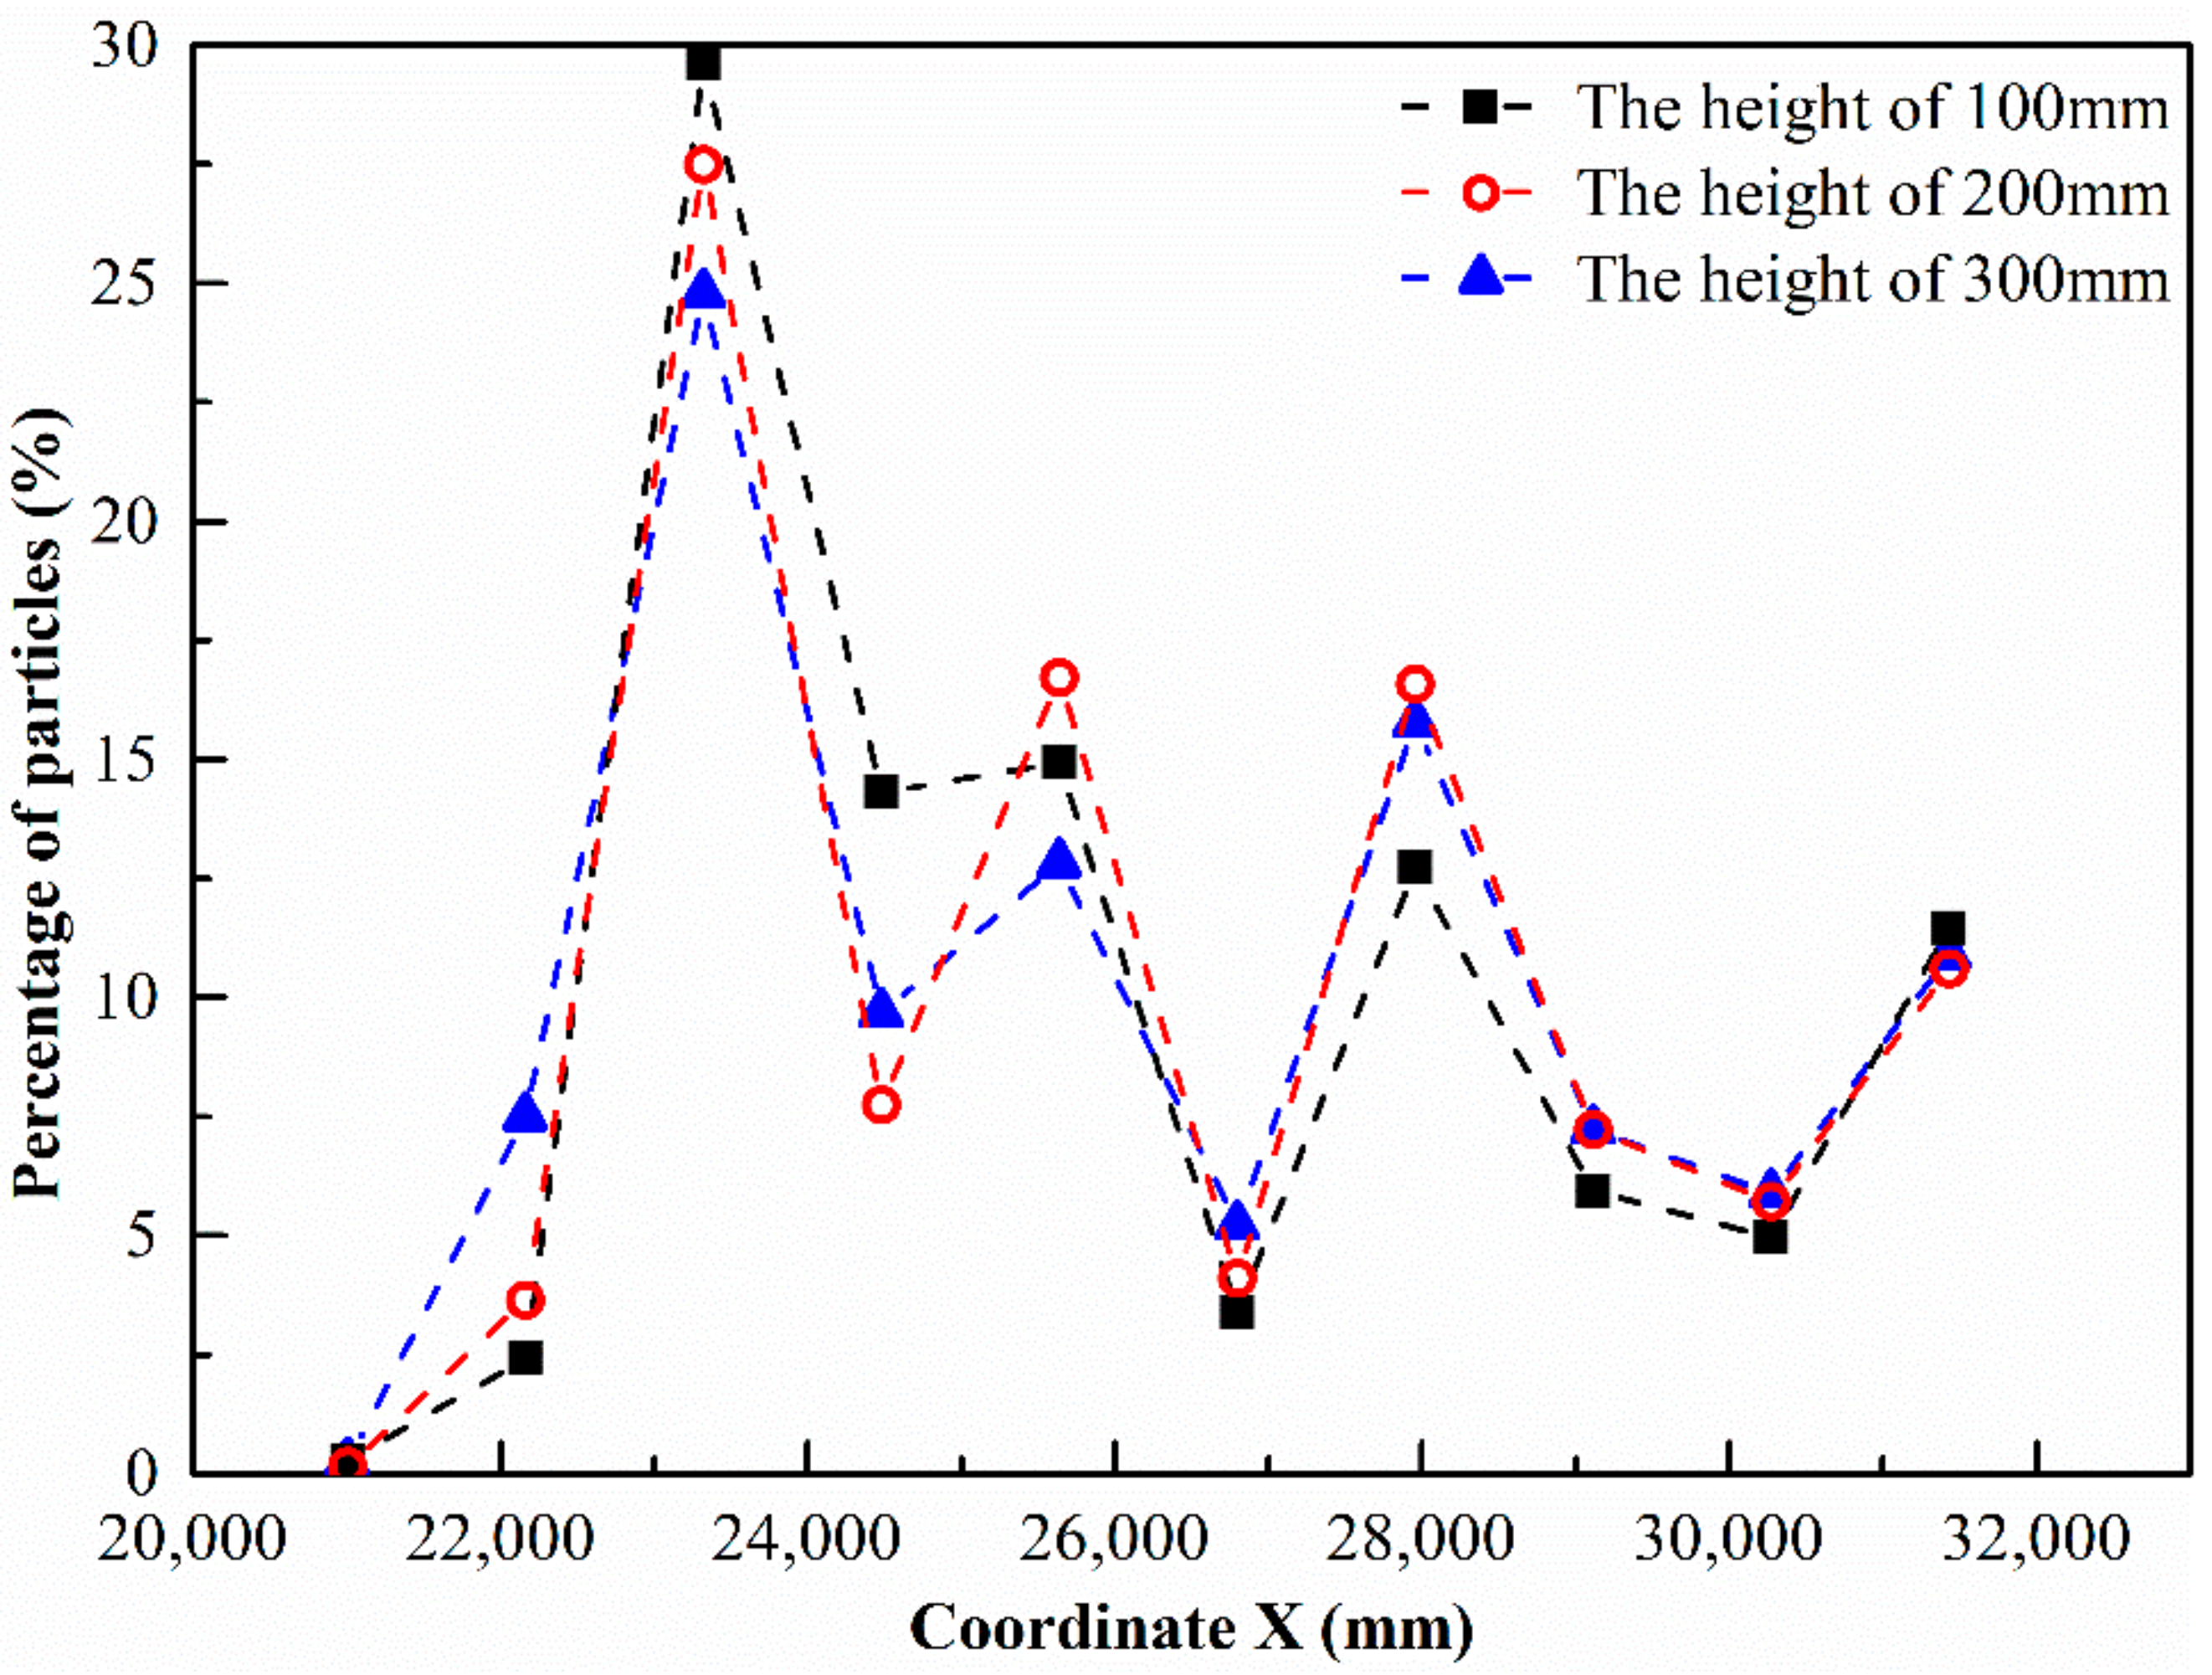
Figure 17.
The distributions of the particles larger than 8.8 × 10⁻² mm for the deflectors of different heights.
Figure 17.
The distributions of the particles larger than 8.8 × 10⁻² mm for the deflectors of different heights.
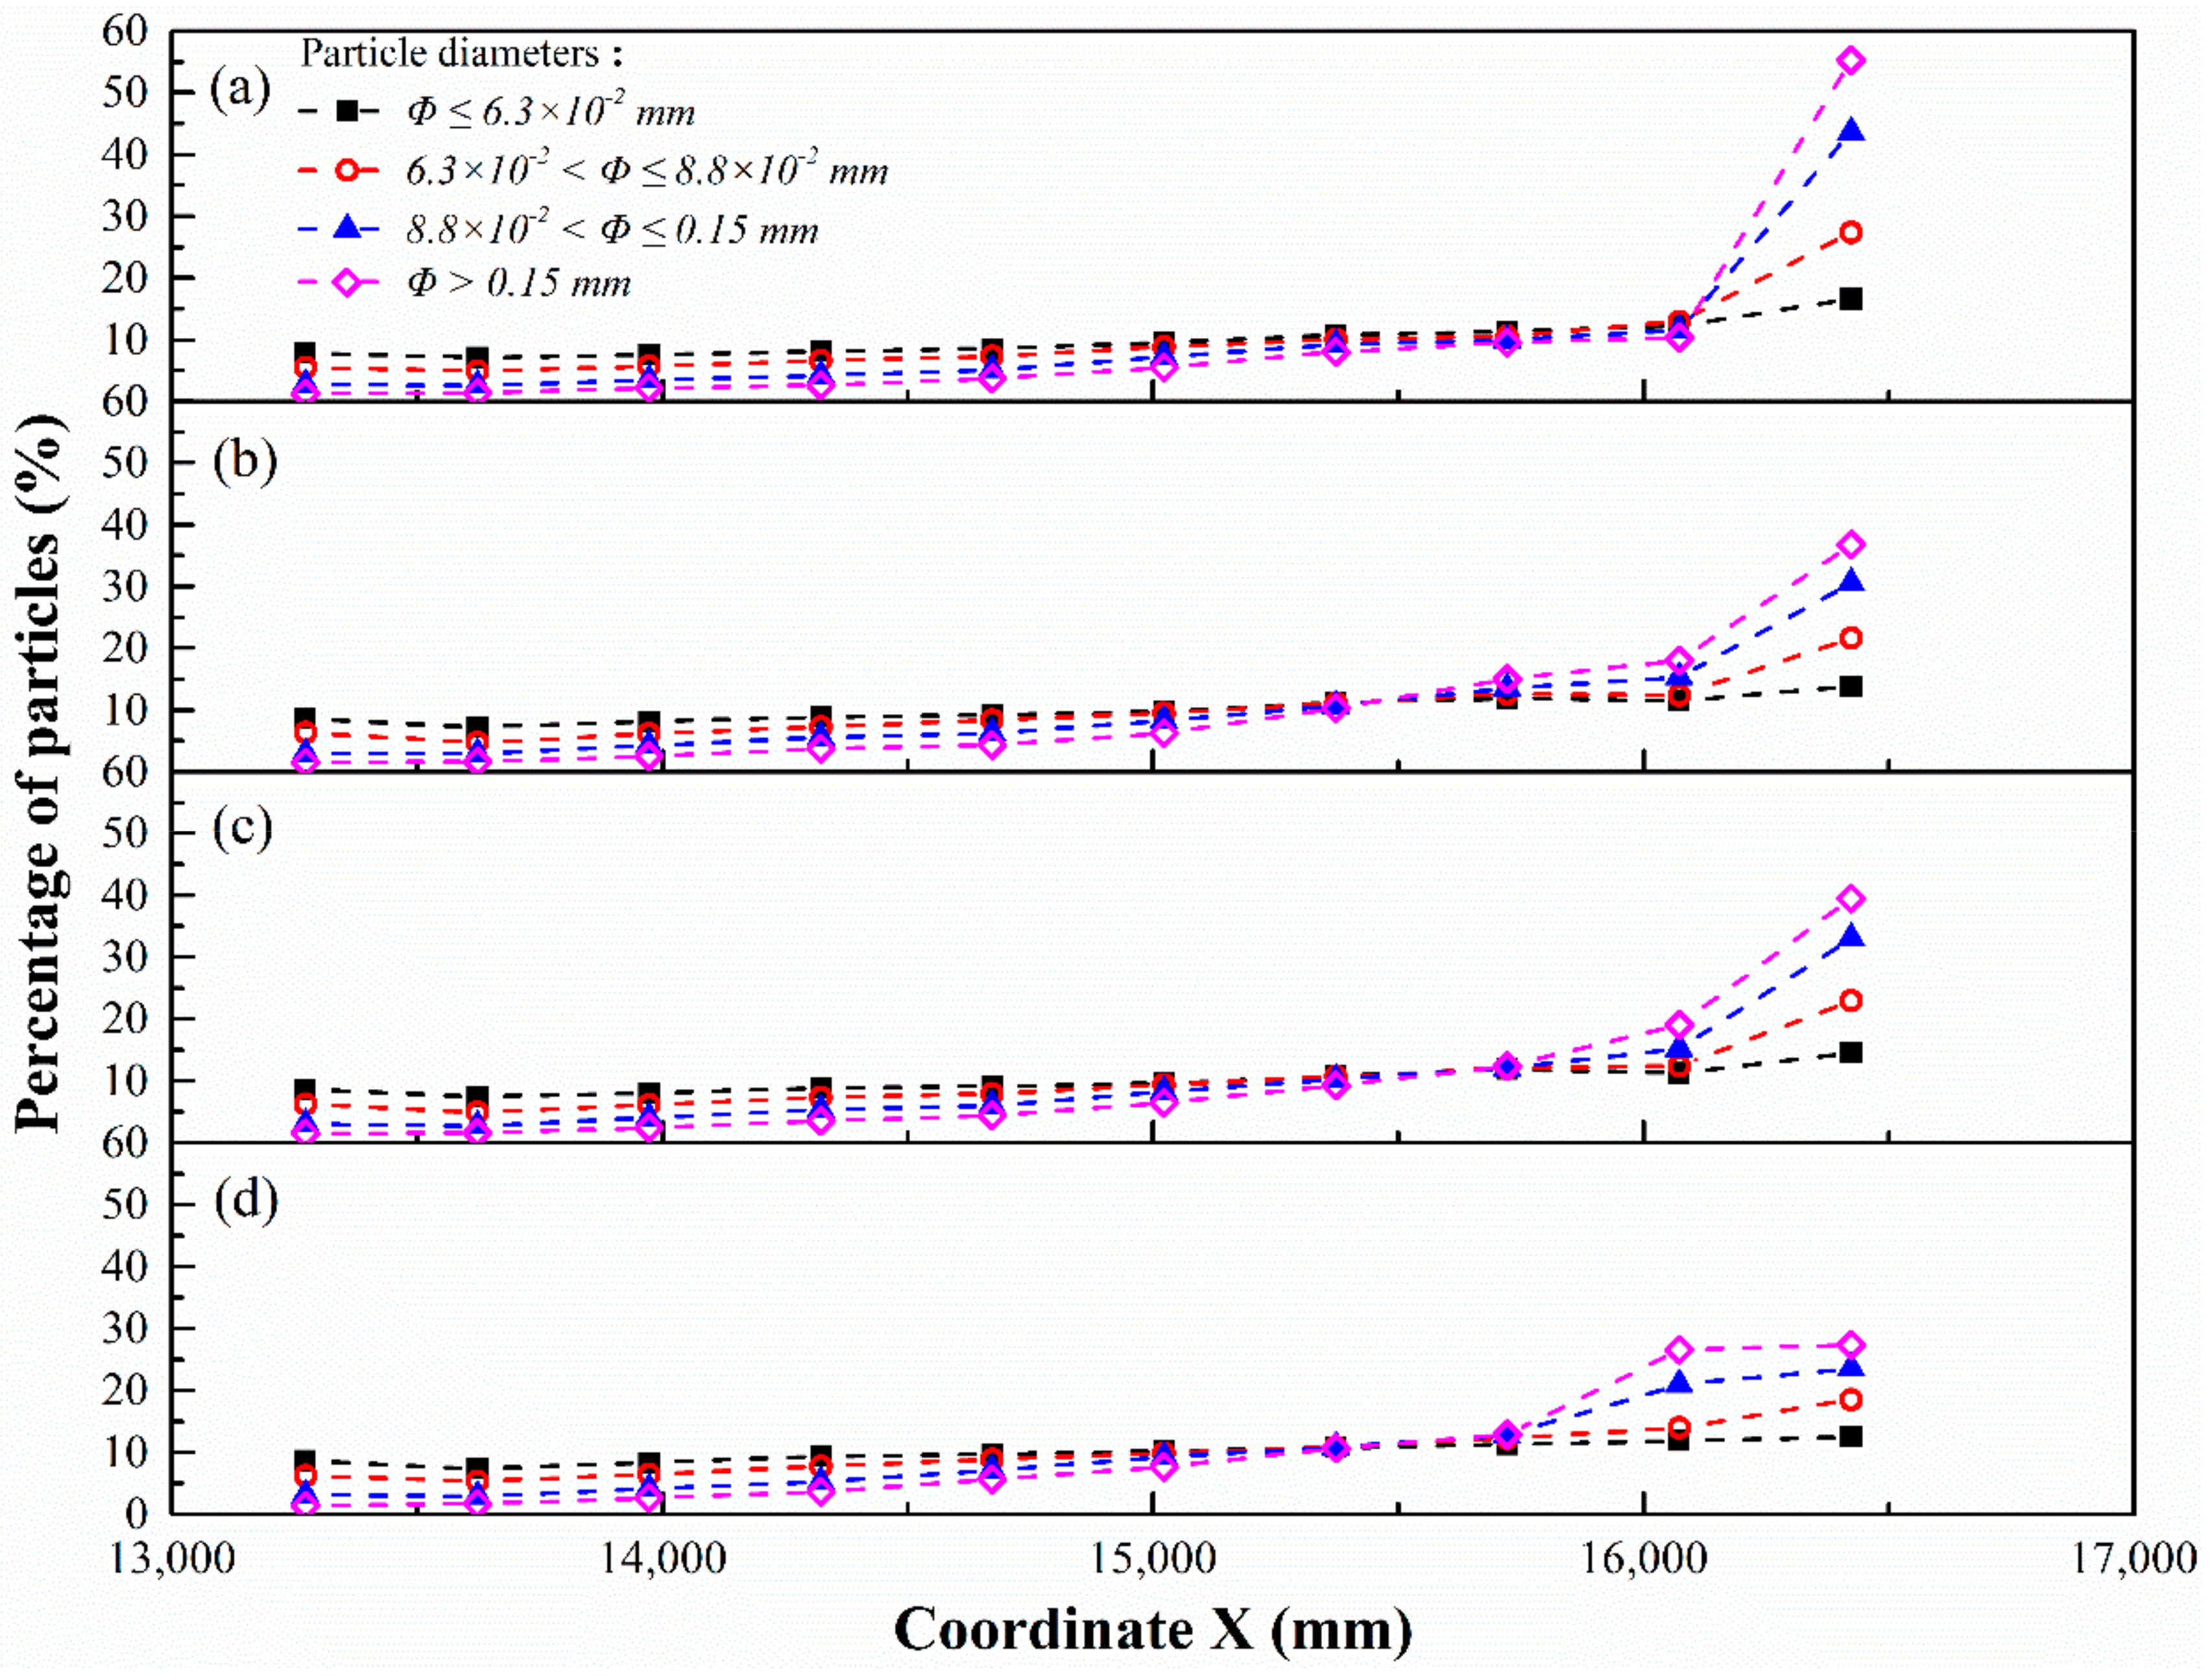
Figure 18.
The distributions of the four classes of particles at plane 1 with different installing positions of the triangular deflector: (a) no deflector installed, (b) the low deflector installation, (c) the middle deflector installation, and (d) the high deflector installation.
Figure 18.
The distributions of the four classes of particles at plane 1 with different installing positions of the triangular deflector: (a) no deflector installed, (b) the low deflector installation, (c) the middle deflector installation, and (d) the high deflector installation.
Figure 19.
The distributions of the four classes of particles at plane 2 with different installing positions of the triangular deflector: (a) no deflector installed, (b) the low deflector installation, (c) the middle deflector installation, and (d) the high deflector installation.
Figure 19.
The distributions of the four classes of particles at plane 2 with different installing positions of the triangular deflector: (a) no deflector installed, (b) the low deflector installation, (c) the middle deflector installation, and (d) the high deflector installation.
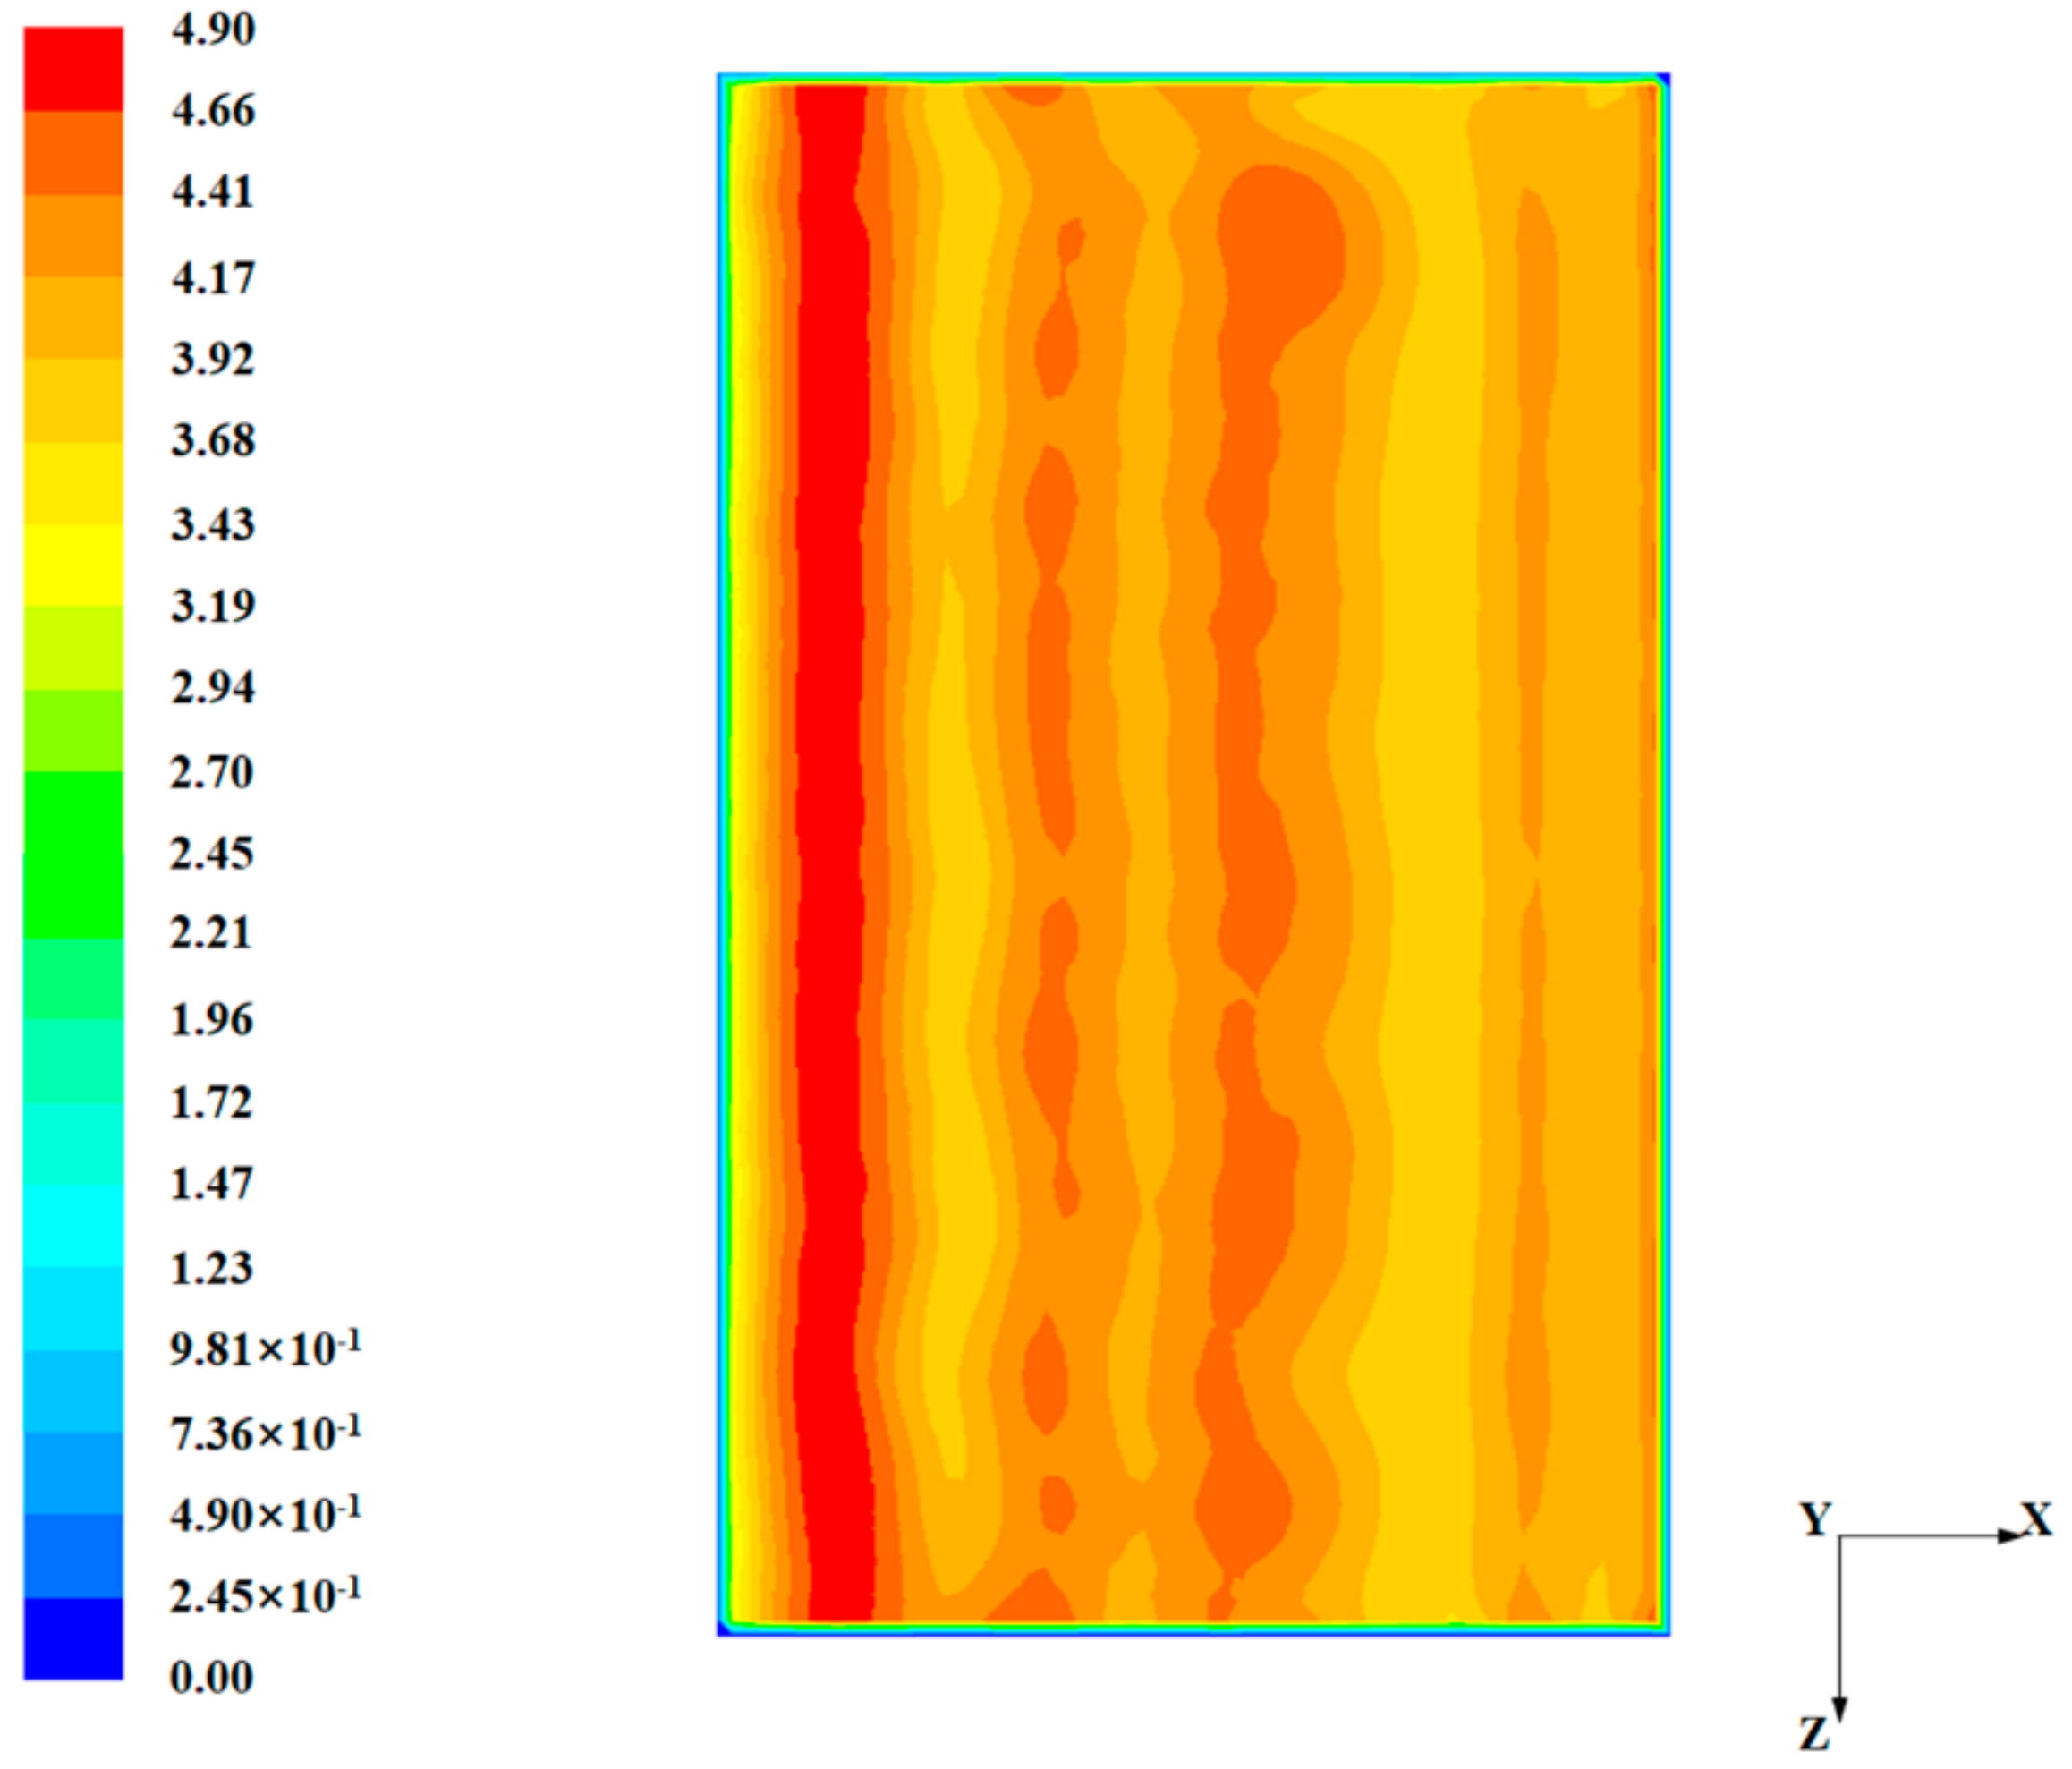
Figure 20.
Contours of gas velocity at plane 1 with the low deflector installation (unit: m/s).
Figure 20.
Contours of gas velocity at plane 1 with the low deflector installation (unit: m/s).
Figure 21.
The distributions of crushed millet over the perforated plate with different installing positions of the triangular deflector: (a) no deflector installed, (b) the low deflector installation, (c) the middle deflector installation, and (d) the high deflector installation.
Figure 21.
The distributions of crushed millet over the perforated plate with different installing positions of the triangular deflector: (a) no deflector installed, (b) the low deflector installation, (c) the middle deflector installation, and (d) the high deflector installation.
Table 1.
The characteristics of the ash particles collected from the SCR-deNOx facility.
Table 1.
The characteristics of the ash particles collected from the SCR-deNOx facility.
| Density | Particle Diameter Φ | Mass Fraction |
|---|
| 1.0 g/cm3 | >0.15 mm | 10.97% |
| 8.8 × 10⁻² mm < Φ ≤ 0.15 mm | 8.07% |
| 6.3 × 10⁻² mm < Φ ≤ 8.8 × 10⁻² mm | 2.92% |
| ≤6.3 × 10⁻² mm | 78.04% |
Table 2.
The RSDs of distributions for small-sized, medium-sized, large-sized and extra-large-sized particles at plane 1 with different installing positions of the triangular deflector.
Table 2.
The RSDs of distributions for small-sized, medium-sized, large-sized and extra-large-sized particles at plane 1 with different installing positions of the triangular deflector.
| Case | Small-Sized Particles | Medium-Sized Particles | Large-Sized Particles | Extra-Large-Sized Particles |
|---|
| No deflector installed | 16.97% | 40.94% | 75.25% | 117.29% |
| Low deflector installation | 17.39% | 43.60% | 61.73% | 66.12% |
| Middle deflector installation | 17.05% | 48.59% | 68.96% | 67.38% |
| High deflector installation | 13.73% | 44.76% | 76.67% | 78.98% |
Table 3.
The maximum percentages of small-sized, medium-sized, large-sized and extra-large-sized particles at plane 1 with different installing positions of the triangular deflector.
Table 3.
The maximum percentages of small-sized, medium-sized, large-sized and extra-large-sized particles at plane 1 with different installing positions of the triangular deflector.
| Case | Small-Sized Particles | Medium-Sized Particles | Large-Sized Particles | Extra-Large-Sized Particles |
|---|
| No deflector installed | 12.21% | 17.58% | 26.73% | 39.84% |
| Low deflector installation | 12.72% | 18.45% | 21.70% | 20.59% |
| Middle deflector installation | 13.12% | 19.69% | 25.28% | 23.31% |
| High deflector installation | 12.72% | 18.18% | 28.02% | 25.24% |
Table 4.
The RSDs of distributions for small-sized, medium-sized, large-sized and extra-large-sized particles at plane 2 with different installing positions of the triangular deflector.
Table 4.
The RSDs of distributions for small-sized, medium-sized, large-sized and extra-large-sized particles at plane 2 with different installing positions of the triangular deflector.
| Case | Small-Sized Particles | Medium-Sized Particles | Large-Sized Particles | Extra-Large-Sized Particles |
|---|
| No deflector installed | 29.04% | 66.36% | 122.05% | 162.57% |
| Low deflector installation | 20.08% | 48.87% | 83.92% | 109.99% |
| Middle deflector installation | 21.08% | 52.24% | 90.58% | 117.44% |
| High deflector installation | 16.30% | 40.84% | 72.65% | 97.06% |
Table 5.
The maximum percentages of small-sized, medium-sized, large-sized and extra-large-sized particles at plane 2 with different installing positions of the triangular deflector.
Table 5.
The maximum percentages of small-sized, medium-sized, large-sized and extra-large-sized particles at plane 2 with different installing positions of the triangular deflector.
| Case | Small-Sized Particles | Medium-Sized Particles | Large-Sized Particles | Extra-Large-Sized Particles |
|---|
| No deflector installed | 16.65% | 27.41% | 43.55% | 55.28% |
| Low deflector installation | 13.82% | 21.61% | 30.53% | 36.78% |
| Middle deflector installation | 14.46% | 22.98% | 33.01% | 39.46% |
| High deflector installation | 12.45% | 18.53% | 23.53% | 27.38% |
Table 6.
Measured weights of the crushed millet in the FMT (unit: g).
Table 6.
Measured weights of the crushed millet in the FMT (unit: g).
| Case | Position of the Detection Holes |
|---|
| A | B | C | D | E | F | G | H | I |
|---|
| No deflector installed | 8.1939 | 6.2764 | 3.6915 | 16.0562 | 33.2517 | 16.5015 | 7.5442 | 7.3632 | 14.7715 |
| Low deflector installation | 6.3363 | 6.7788 | 3.1165 | 11.9148 | 10.3647 | 4.2281 | 9.2913 | 6.9905 | 8.6209 |
| Middle deflector installation | 5.1246 | 4.3803 | 2.3775 | 15.3987 | 11.1882 | 9.4037 | 7.1723 | 3.6794 | 9.6139 |
| High deflector installation | 8.2276 | 5.7866 | 5.0182 | 28.6073 | 2.4682 | 14.2543 | 13.4807 | 7.9573 | 15.9467 |
Table 7.
The RSDs and the maximum percentages of the crushed millet’s weight over the perforated plate with different installing positions of the triangular deflector.
Table 7.
The RSDs and the maximum percentages of the crushed millet’s weight over the perforated plate with different installing positions of the triangular deflector.
| Case | RSD | Maximum Percentage |
|---|
| No deflector installed | 68.12% | 28.51% |
| Low deflector installation | 36.36% | 16.87% |
| Middle deflector installation | 50.94% | 21.00% |
| High deflector installation | 69.10% | 27.84% |
Table 8.
Measured values of air velocity for the FMT with the low deflector installation (unit: m/s).
Table 8.
Measured values of air velocity for the FMT with the low deflector installation (unit: m/s).
| Detection Spot | A | B | C | D | E | F | G | H | I |
|---|
| 1 | 2.22 | 2.75 | 2.29 | 1.95 | 2.31 | 2.09 | 2.08 | 2.15 | 2.15 |
| 2 | 2.60 | 2.74 | 2.30 | 1.99 | 2.15 | 2.13 | 2.10 | 2.67 | 2.31 |
| 3 | 2.34 | 2.92 | 2.26 | 2.10 | 2.22 | 2.23 | 2.06 | 2.26 | 2.18 |
| 4 | 2.23 | 2.62 | 2.31 | 2.15 | 2.43 | 2.32 | 2.12 | 2.26 | 2.37 |
| 5 | 2.55 | 2.65 | 2.19 | 2.14 | 2.37 | 2.38 | 2.15 | 2.24 | 2.36 |
| 6 | 2.52 | 2.81 | 2.15 | 2.27 | 2.56 | 2.50 | 2.23 | 2.60 | 2.30 |
| 7 | 2.79 | 2.68 | 2.11 | 2.16 | 2.49 | 2.42 | 2.29 | 2.34 | 2.34 |
| 8 | 2.44 | 2.48 | 2.03 | 2.14 | 2.48 | 2.21 | 2.21 | 2.54 | 2.25 |


