Article

Rapid Classification of Wheat Grain Varieties Using Hyperspectral Imaging and Chemometrics

1
College of Biosystems Engineering and Food Science, Zhejiang University, 866 Yuhangtang Road, Hangzhou 310058, China
2
Key Laboratory of Spectroscopy Sensing, Ministry of Agriculture and Rural Affairs, Zhejiang University, Hangzhou 310058, China
*
Author to whom correspondence should be addressed.
Appl. Sci. 2019, 9(19), 4119; https://doi.org/10.3390/app9194119
Submission received: 20 August 2019 / Revised: 18 September 2019 / Accepted: 23 September 2019 / Published: 2 October 2019
(This article belongs to the Special Issue Application of Hyperspectral Imaging for Nondestructive Measurement)

Abstract

:
The classification of wheat grain varieties is of great value because its high purity is the yield and quality guarantee. In this study, hyperspectral imaging combined with the chemometric methods was applied to explore and implement the varieties classification of wheat seeds. The hyperspectral images of all the samples covering 874–1734 nm bands were collected. Exploratory analysis was first carried out while using principal component analysis (PCA) and linear discrimination analysis (LDA). Spectral preprocessing methods including standard normal variate (SNV), multiplicative scatter correction (MSC), and wavelet transform (WT) were introduced, and their effects on discriminant models were studied to eliminate the interference of instrumental and environmental factors. PCA loading, successive projections algorithm (SPA), and random frog (RF) were applied to extract feature wavelengths for redundancy elimination owing to the possibility of existing redundant spectral information. Classification models were developed based on full wavelengths and feature wavelengths using LDA, support vector machine (SVM), and extreme learning machine (ELM). This optimal model was finally utilized to generate visualization map to observe the classification performance intuitively. When comparing with other models, ELM based on full wavelengths achieved the best accuracy up to 91.3%. The overall results suggested that hyperspectral imaging was a potential tool for the rapid and accurate identification of wheat varieties, which could be conducted in large-scale seeds classification and quality detection in modern seed industry.

1. Introduction

As staple food of thousands of millions of people, wheat (Triticum aestivum L.)’s production amounted to 772 million tonnes totally each year [1], while its supply was just 179.26 g per day per capita [2] in the world. With social economy and people’s living standard growing, there are more demanding requirements for wheat grain’s quality and yield. Wheat seeds with high quality play an essential role in the improvement of wheat’ yield, in which one of the most significant factors is the varieties purity of wheat seeds. Low purity seeds will lead to huge economic loss in terms of breeding, planting, and commodity’s quality for farmers and consumers. With the continual circulation of the large-scale seeds in modern seed industry, it is likely to result in an accidental mixing between different varieties of wheat seeds during transportation, storage, and production, which will inevitably decrease wheat quality and yield. Therefore, it is considerable to develop a rapid approach to identify and classify different varieties of wheat seeds.
Traditional method relying on manual inspection and requiring enormous professional knowledge is subjective and time-consuming. In recent years, machine vision technology has emerged as an automatic and subjective method for identifying seed varieties. For example, Fayyaz et al. identified three varieties of rice seeds by extracting morphological and textural features of samples while using machine vision technology [3]. Manickavasagan et al. classified eight wheat classes by extracting textural features employing a machine vision system with a monochrome camera [4]. However, machine vision technology could not achieve satisfactory results when the external characteristics such as appearance, morphology and texture of different varieties of seeds were little difference. Hence, the internal information could be considered to differentiate them, owing to the difference in the internal contents and components of different varieties of seeds [5,6]. Imaging and spectroscopic technology exactly reflect the internal characteristics of samples by their optical properties, which compensate for the shortcomings of machine vision technology. Integrating the two technologies in one system, hyperspectral imaging (HSI) could simultaneously obtain spectral and spatial information and be applied to distinguish wheat varieties [7,8]. HSI with the aid of chemometrics has been widely applied in various fields because of the advantage of nondestructive and rapid detection [9,10]. For grain seeds, Zheng et al. classified single rice seed while using hyperspectral imaging combined with convolutional neural network and compared k-nearest neighbors (KNN) with support vector machine (SVM) models [11]. Huang et al. distinguished 17 maize varieties using hyperspectral imaging combined with feature transformation methods integrating the least squares SVM model [12]. For wheat seeds, the classification using HSI mainly concerns the identification of mycotoxin contamination and foreign materials. Du et al. recognized mildew-contaminated wheat samples under six deoxynivalenol (DON) content levels based on hyperspectral imaging combined with chemometric methods and established several discriminant analysis [13]. Lankapalli et al. differentiated seven foreign material types, six dockage types, and two excreta types from Canada Western Red Spring while using near-infrared (NIR) hyperspectral imaging and testified the classification practicable [14]. Senthilkumar et al. discriminated five ochratoxin A (OTA) concentration levels in stored wheat using NIR hyperspectral imaging and developed linear, quadratic and Mahalanobis statistical discriminant models to fulfill the classification [15]. However, as we all know, rarely is the research of differentiating wheat varieties themselves using hyperspectral imaging encountered.
Previous studies have shown that HSI is a powerful tool for detecting the quality of grains, but it commonly contains much noise due to the influence of system, environment, and other factors [16,17]. These noises will seriously affect the accuracy and robustness of modeling, so it is necessary to choose appropriate methods to reduce and even eliminate its effects. In addition, hyperspectral data is a hypercube consisting of hundreds of wavebands and it contains lots of redundant information and collinear variables. Extracting part of wavelengths with fingerprint feature is a common method to reduce redundant information. This also contributes to simplify discrimination model and promote the detection performance.
Therefore, the leading goal of this paper is to explore and accomplish varieties classification of wheat seeds while using HSI technology. The specific objective is: (1) to evaluate the distinguishability of wheat varieties qualitatively; (2) to develop discriminant models based on full wavelengths and feature wavelengths; (3) to analyze and compare the effects of different preprocessing and feature extraction methods on discriminant models; and, (4) to visualize the classification results combined with image processing technology.

2. Materials and Methods

2.1. Sample Preparation of Wheat Seeds

Five varieties of wheat seeds, including Annong1124, Longpingmai6, Shannong102, Weilong169, and Zhenmai9, were friendly provided by Anhui Longping High-Tech Seed Industry Co., Ltd. in Hefei, Anhui province, China. They were harvested in 2018, packed in kraft bags, and then sent to the laboratory. After removing the shrivelled and damaged individuals, a total of 33,494 wheat seeds were obtained. There were 7388 seeds for Annong1124, 6240 seeds for Longpingmai6, 6394 seeds for Shannong102, 6326 seeds for Weilong169, and 7146 seeds for Zhenmai9, respectively. Wheat varieties were marked by corresponding number of 1, 2, 3, 4, and 5 for convenient recording according to the above-mentioned rank.

2.2. Hyperspectral Imaging System

The hyperspectral imaging system was applied to acquire hyperspectral images of wheat seeds in a dark environment through line-scanning way. Based on these references [14,15,16,17], the appropriate near-infrared spectral range of 874–1734 nm for measurements was determined in this experiment. Through each single scanning, HSI can obtain spectral information of a batch of samples that covers hundreds of successive wavebands. In this study, 256 wavebands of 320 pixels could be acquired. Moreover, the whole system reaches 5 nm spectral resolution. Five major components constitute the whole HSI system: an imaging spectrograph (ImSpector N17E; Spectral Imaging Ltd., Oulu, Finland), a high-performance CCD camera (C8484-05; Hamamatsu, Hamamatsu City, Japan) with a camera lens (OLES22; Specim, Spectral Imaging Ltd., Oulu, Finland), an illumination unit that consists of two 150W tungsten halogen lamps (Fiber-Lite DC950 Illuminator; Dolan Jenner Industries Inc., Boxborough, MA, USA) to ensure sufficient light, a mobile platform controlled by a stepper motor (Isuzu Optics Corp., Taiwan, China) to convey the samples, a matched computer equipped with the image acquisition software (Xenics N17E, Isuzu Optics Corp., Taiwan, China).

2.3. Hyperspectral Image Acquisition and Correction

Some relevant parameters need to be adjusted to obtain explicit and distortionless images before hyperspectral image collection in order to assure each sample’s availability. In this study, the height between lens of CCD camera and samples was set to 15 cm, the exposure time was set to 3 ms, and the mobile platform was set at a constant speed of 13 mm/s along the X-axis. Without adhesion, the wheat seeds were randomly put on a black plank and then placed on the mobile platform to acquire hyperspectral images. One hyperspectral image was obtained through every scanning. The number of wheat seeds might be inconsistent for different images. The eventual number of wheat seeds was calculated by related functions that are included in our written spectral extraction algorithm in Matlab.
Before extracting spectra and conducting spectral analysis, the raw hyperspectral images needed to be corrected by using the white and the dark reference images. Among them, the white reference image was obtained by using a white Teflon tile with 100% high-reflectance and the dark reference image was obtained by covering the lens with its opaque cap completely while turning off all of the lights. By calculating the Equation (1), below, the corrected images can be acquired.
I C = I raw I dark I white I dark
where IC is the corrected hyperspectral image, Iraw is the raw hyperspectral image, and Iwhite and Idark are the white and the dark reference images, respectively.

2.4. Spectral Extraction and Preprocessing

Each of wheat seed sample was considered as a region of interest (ROI). The spectra of all ROIs were extracted from the corrected hyperspectral images. An image segmentation procedure was conducted to isolate the wheat seeds from the black background. With the largest difference between wheat seeds and background, the image at 974 nm was selected to create a binary mask. Later, this mask was applied to the images of other wavebands. Besides, some morphological operations were also applied to avoid any overlapping among wheat seeds.
There was no doubt that the existence of random noise would influence samples’ spectra and further affect the accurate construction of the discrimination model [16,18]. Thus, standard normal variate (SNV), multiplicative scatter correction (MSC), and wavelet transform (WT) were employed to preprocess the spectral data in this study. For WT, the optimal parameters, such as wavelet function db6 and decomposition scale 3, were determined through the experiment. These preprocessing methods were analyzed and compared to improve the model performance.

2.5. Multivariate Data Analysis

2.5.1. Exploratory Classification

Principal component analysis (PCA), which is often applied in exploratory classification analysis, utilizes covariance and linear transformation among variables to recombine data set [19,20]. PCA is an unsupervised algorithm. Only through orthogonal transformation, a group of potentially correlated variables become linearly unrelated, which matches with the principle of variance maximization well. Additionally, the converted variables are often called principal components (PCs). In general, the first few PCs can reflect most of the information of the original variables and the information contained in each variable is not repeated. Therefore, in this study, the first few PCs were selected according to the accumulative contribution rate and they were used to explore the distinguishability of five varieties of wheat seeds. The differences and similarities of the samples could be clearly observed in the scattering plots of the first few PCs.
In addition, we also introduce another dimension-reducing method: linear discrimination analysis (LDA). LDA, as a supervised algorithm, could be usually served as a discriminant model for classification. Its other function similar to PCA is rarely employed. Different from PCA, LDA is based on the principle that it makes the points within the category as close as possible (concentrated), and the points among the categories as far as possible. The value, covariance matrix between different classes divided by covariance within classes, was defined as the reference index, which LDA makes bigger to meet our needs. Therefore, it is also suitable for exploring the discriminability of different varieties of wheat seeds.

2.5.2. Feature Wavelengths Extraction

There reportedly exist certain redundant characteristic variables among hundreds of spectral wavebands, which might slow down the modeling speed and influence the model’ performance [17,21]. Therefore, three common variable selection algorithms, successive projections algorithm (SPA), principal component analysis loading (PCA loading), and random frog (RF), were applied to extract representative spectral variables in this study.
SPA is a novel variable selection method that aims at eliminating the redundant information of raw spectral data to the biggest extent. As a forward selection algorithm, it is put forward to achieve the minimum of vector space collinearity by successive orthogonal projection [22,23]. The number of eventual feature variables could be decided, according to the minimal root mean square error of validation (RMSEV) in multiple linear regression calibration.
For PCA loading, the first few PCs contain a large proportion of spectral information, as previously mentioned in section of the exploratory classification analysis. During the transformation process, it is exactly the liner regression coefficient of original variables that plays the dominant role. Consequently, by loading as many and large proportion PCs as possible, the feature wavelengths with finger characteristics could be chosen without defect and omission [24].
RF is also a frequently-used variable selection strategy. It is based on the idea of the reversible jump markov chain monte carlo method and model cluster analysis in the iterative manner. Besides, implementing RF must be attached to the specific model [25,26]. In this study, the partial least square was decided by reason of strong capacity in handling correlated data. Concisely, the variable subset was initialized firstly, followed by generating a random number. Next, propose the candidate data set by choosing the nearest integer to a random number. Afterwards, confirm the variable subset by root mean square error of cross-validation and achieve the fixed number of iterations (which be set as 100). Lastly, the indicator of the importance of variables could be regarded as the final criterion by calculating selection probability of each variable.

2.5.3. Discrimination Models

As the eventual purpose of this study was to implement classification of wheat varieties, three models, including LDA, support vector machine (SVM), and extreme learning machine (ELM), were employed. These discriminant models from diverse fields (traditional and neural network algorithms) take effect on the basis of dissimilar principles, such as linear and nonlinear data processing or high-dimensional and low-dimensional space transformation, or otherwise. Their performance was evaluated using the classification accuracy and the proportion measured according the Equation (2).
Accuracy = The correct number of predicted labels The number of actual labels 100 %
LDA is a classical pattern recognition algorithm, which is usually recognized as a simplified version of SVM. As previously mentioned, LDA ensures the maximized separability of samples in the projection space. The key of LDA is to compute the right projected direction and establish the appropriate linear discriminant function.
SVM maps the original data into a higher dimensional space and constructs a separating hyperplane to maximize samples’ spacing distance. Based on structural risk minimization, it introduces kernel functions to effectively deal with nonlinear data or linear inseparable data [27,28]. An appropriate kernel function can improve the model’s performance. Radial basis function (RBF) is used popularly in the spectroscopic analysis field. To get the satisfactory performance, penalty coefficient c and the kernel parameter g should be determined in advance. In this study, a grid-search procedure was employed to select optimal c and g by using an internal toolkit of a library for support vector machine-libsvm (https://www.csie.ntu.edu.tw/~cjlin/libsvm/). Here, the searching range of c was set from 2−5 to 215 and g was set from 23 to 2−15.
ELM is a kind of feed-forward neural network with a single-hidden layer, which has generally been applied in multiclass discrimination. It outputs the weight by only adjusting the parameters of hidden layer and possesses powerful generalization [29]. By setting the number of hidden nodes from 1 to 3000 by steps of 100, the discrimination accuracy of training set possessing homologous incremental nodes can be successively calculated. The optimal number of hidden nodes, n, can be determined according to the optimal model performance.

2.5.4. Visualization Map of Classification

Simultaneously obtaining spectral and spatial information, hyperspectral imaging technology can combine with images’ processing method to locate individual wheat seed and visualize their corresponding varieties accurately. The specific steps were as follows:
  • Isolating samples from background and extracting the average spectrum of each ROI and the spatial locations of each pixel in this ROI.
  • Developing the optimal discrimination model.
  • Predicting the given wheat samples’ variety according to the optimal model.
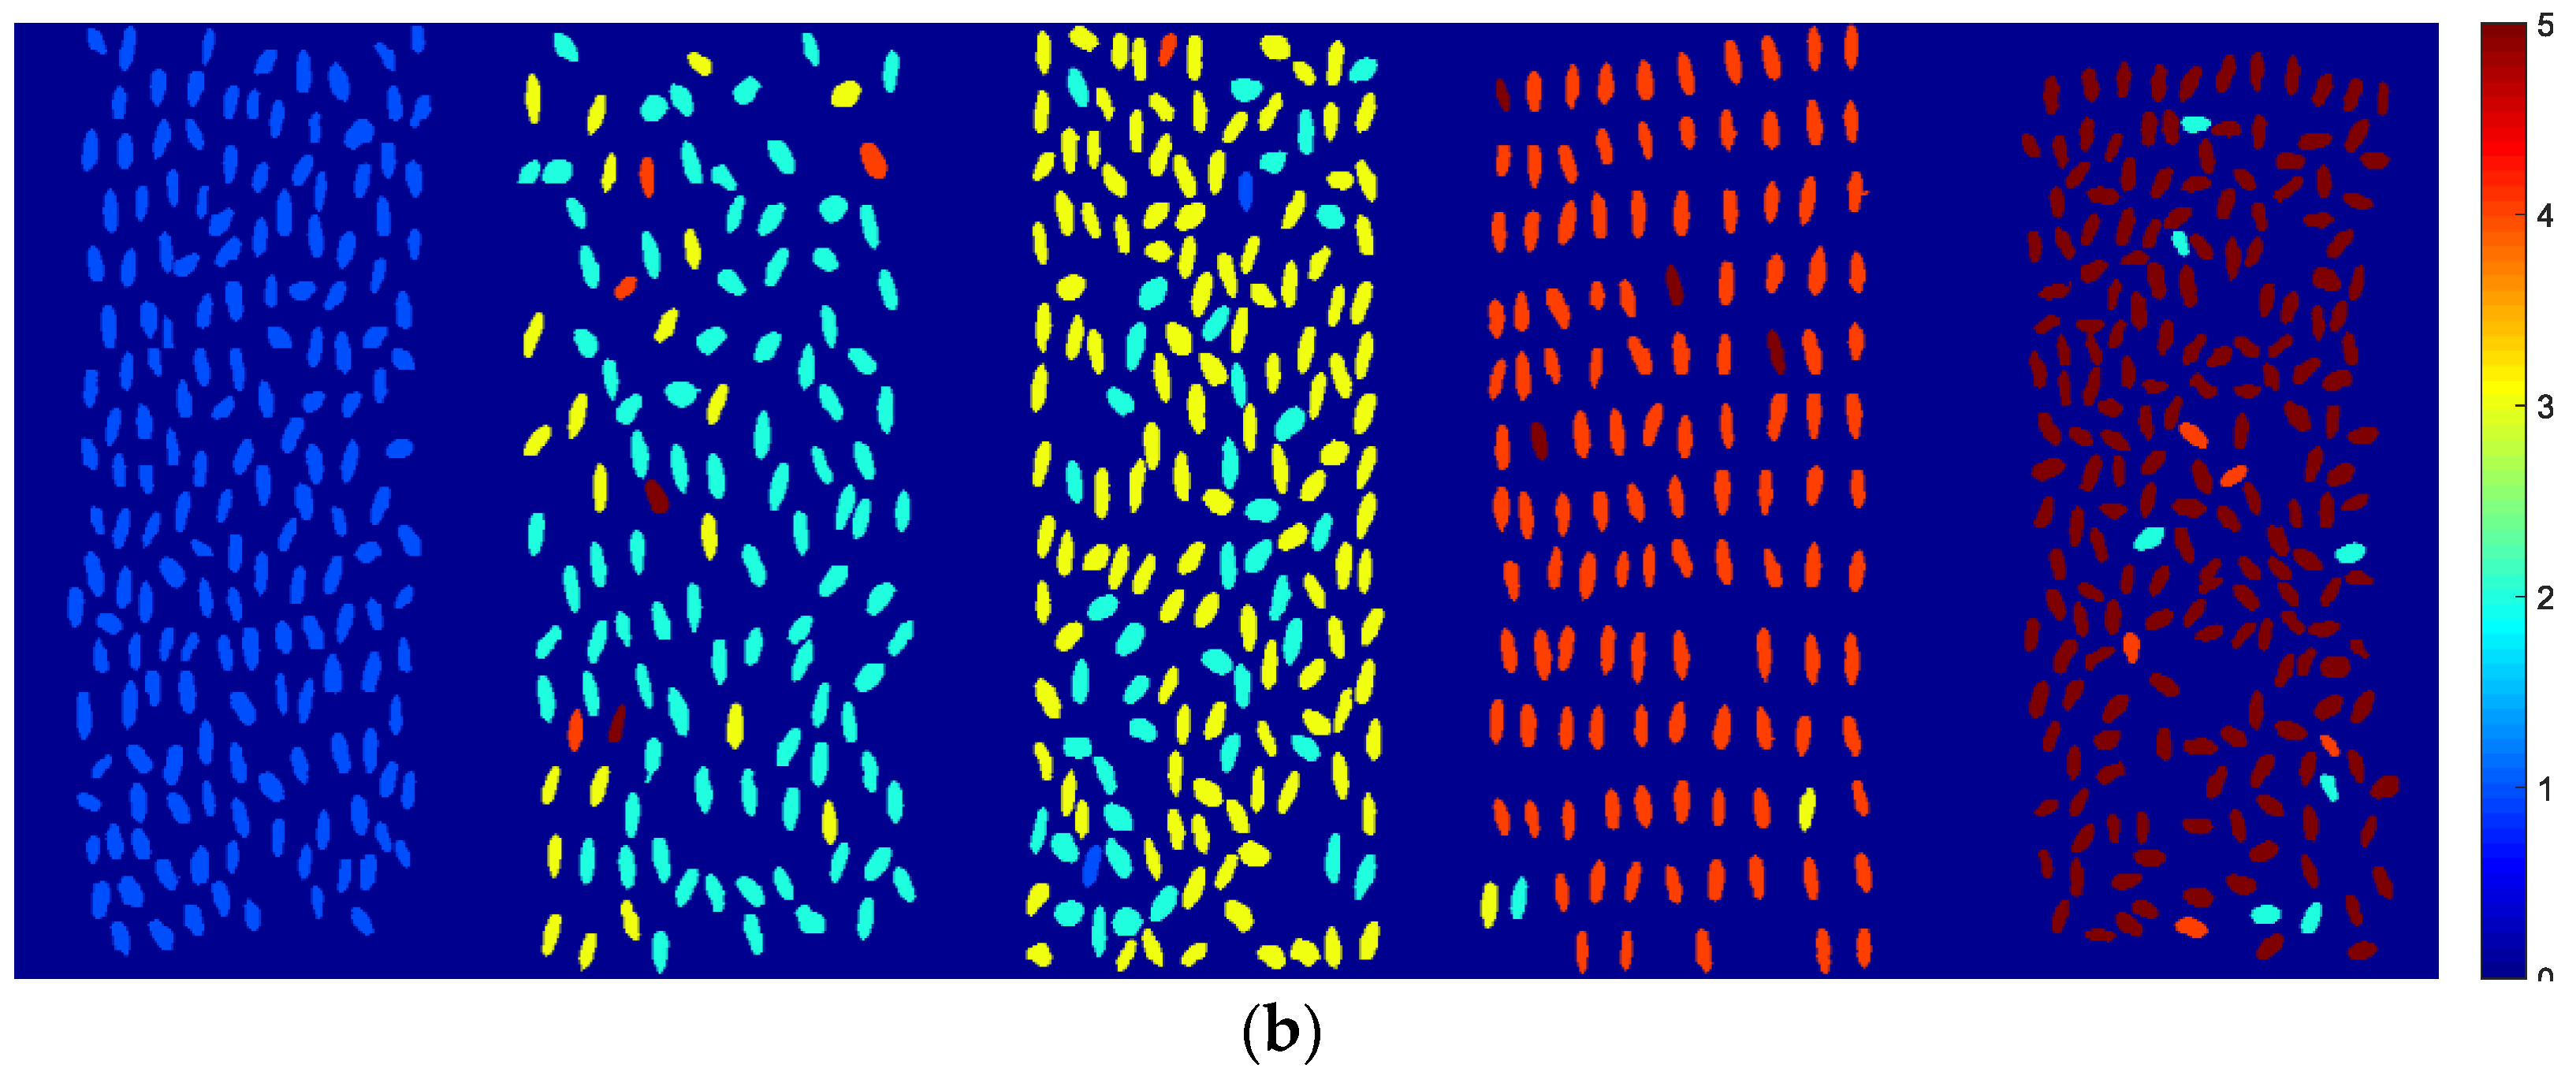
  • Assigning the variety label to all pixels of spatial position of corresponding sample and forming visualization classification by pseudo-color map.
Varieties visualization of wheat seeds is beneficial for convenient and clear discrimination, which can contribute to detecting the quality of grains on a large scale in modern seed industry.

2.6. Software

The ENVI 4.6 version (ITT, Visual Information Solutions, Boulder, CO, USA) was applied to preprocess and analyze the hyperspectral images. The MATLAB R2017a version (The MathWorks, Natick, MA, USA) was applied to extract spectral features of all the samples and preprocess these spectral data. Besides, the selection of feature wavelengths, the establishment of discrimination models and visualization of different varieties of wheat seeds were conducted on MATLAB R2017a. During the whole process, some common toolboxes, including statistics and machine learning toolbox, wavelet toolbox were employed. Especially, two third-party toolboxes, such as libpls and libsvm, were introduced for specific analysis in Matlab.

3. Results and Discussion

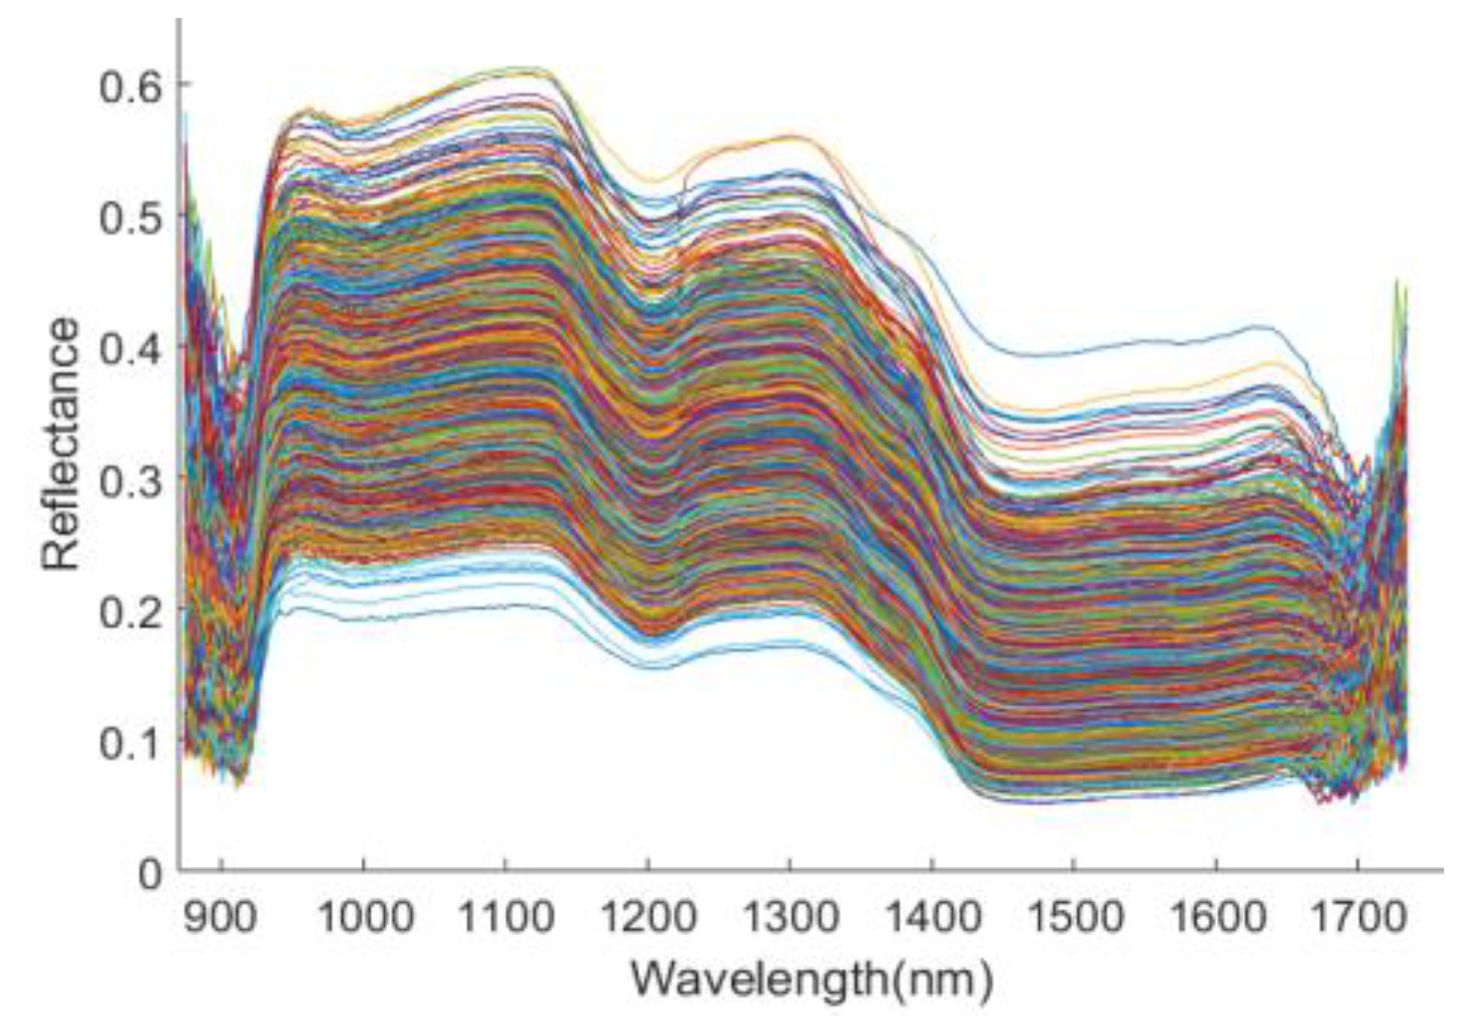
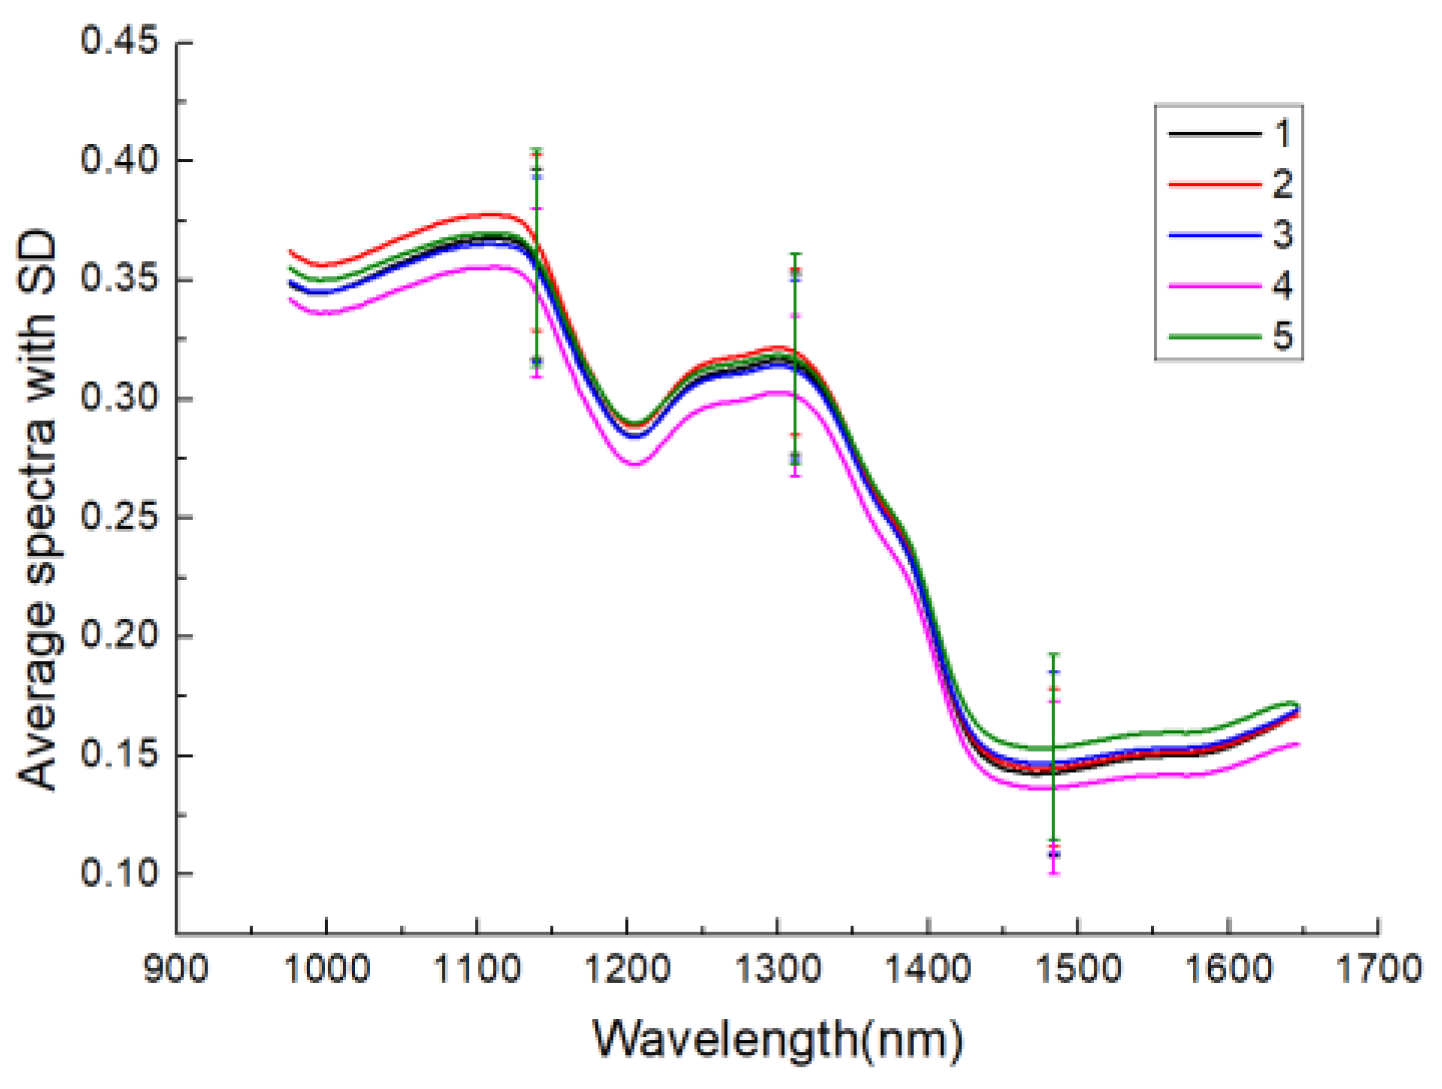
3.1. Analysis of Spectral Profiles

After extracting the spectral information of batches of wheat samples, the spectral curves of five varieties are displayed in Figure 1. It could be observed that the beginnings and ends of all the spectral curves presented strong noise caused by the instability of instrument or other factors. Thus, the spectral information of the middle wavebands, 975–1660 nm, were selected from the origin bands of 874–1734 nm for further analysis.
Figure 2 displays the average spectra and corresponding standard deviation (SD) of each variety. It can be seen that the trends of five spectral curves were similar on the whole. However, the reflectance of these five varieties of wheat seeds also exhibited certain discrepancy, which was attributed to the differences of internal physiological and biochemical components among them [20,21]. For example, the crest around 1100 nm was associated with the second overtone of C-H stretching, as are the crests and troughs around 1200 nm and 1300 nm [30,31,32]. Additionally, the trough around 1450 nm was associated with the first overtone of O-H and N-H inherent stretching and vibration [33,34,35]. These were related to the composition and content of chemicals, such as starch and protein [36], which resulted in diverse reflectivity. The spectral reflectance of five varieties of wheat seeds had strong fluctuation, especially variety 5, among which the overlapping degree among variety 1, 2, and 3 was comparatively high. All of these lay the foundation for the theoretical basis for the accurate classification of different varieties of wheat seeds. Thus, further chemometric analysis need be introduced for subsequent investigation.

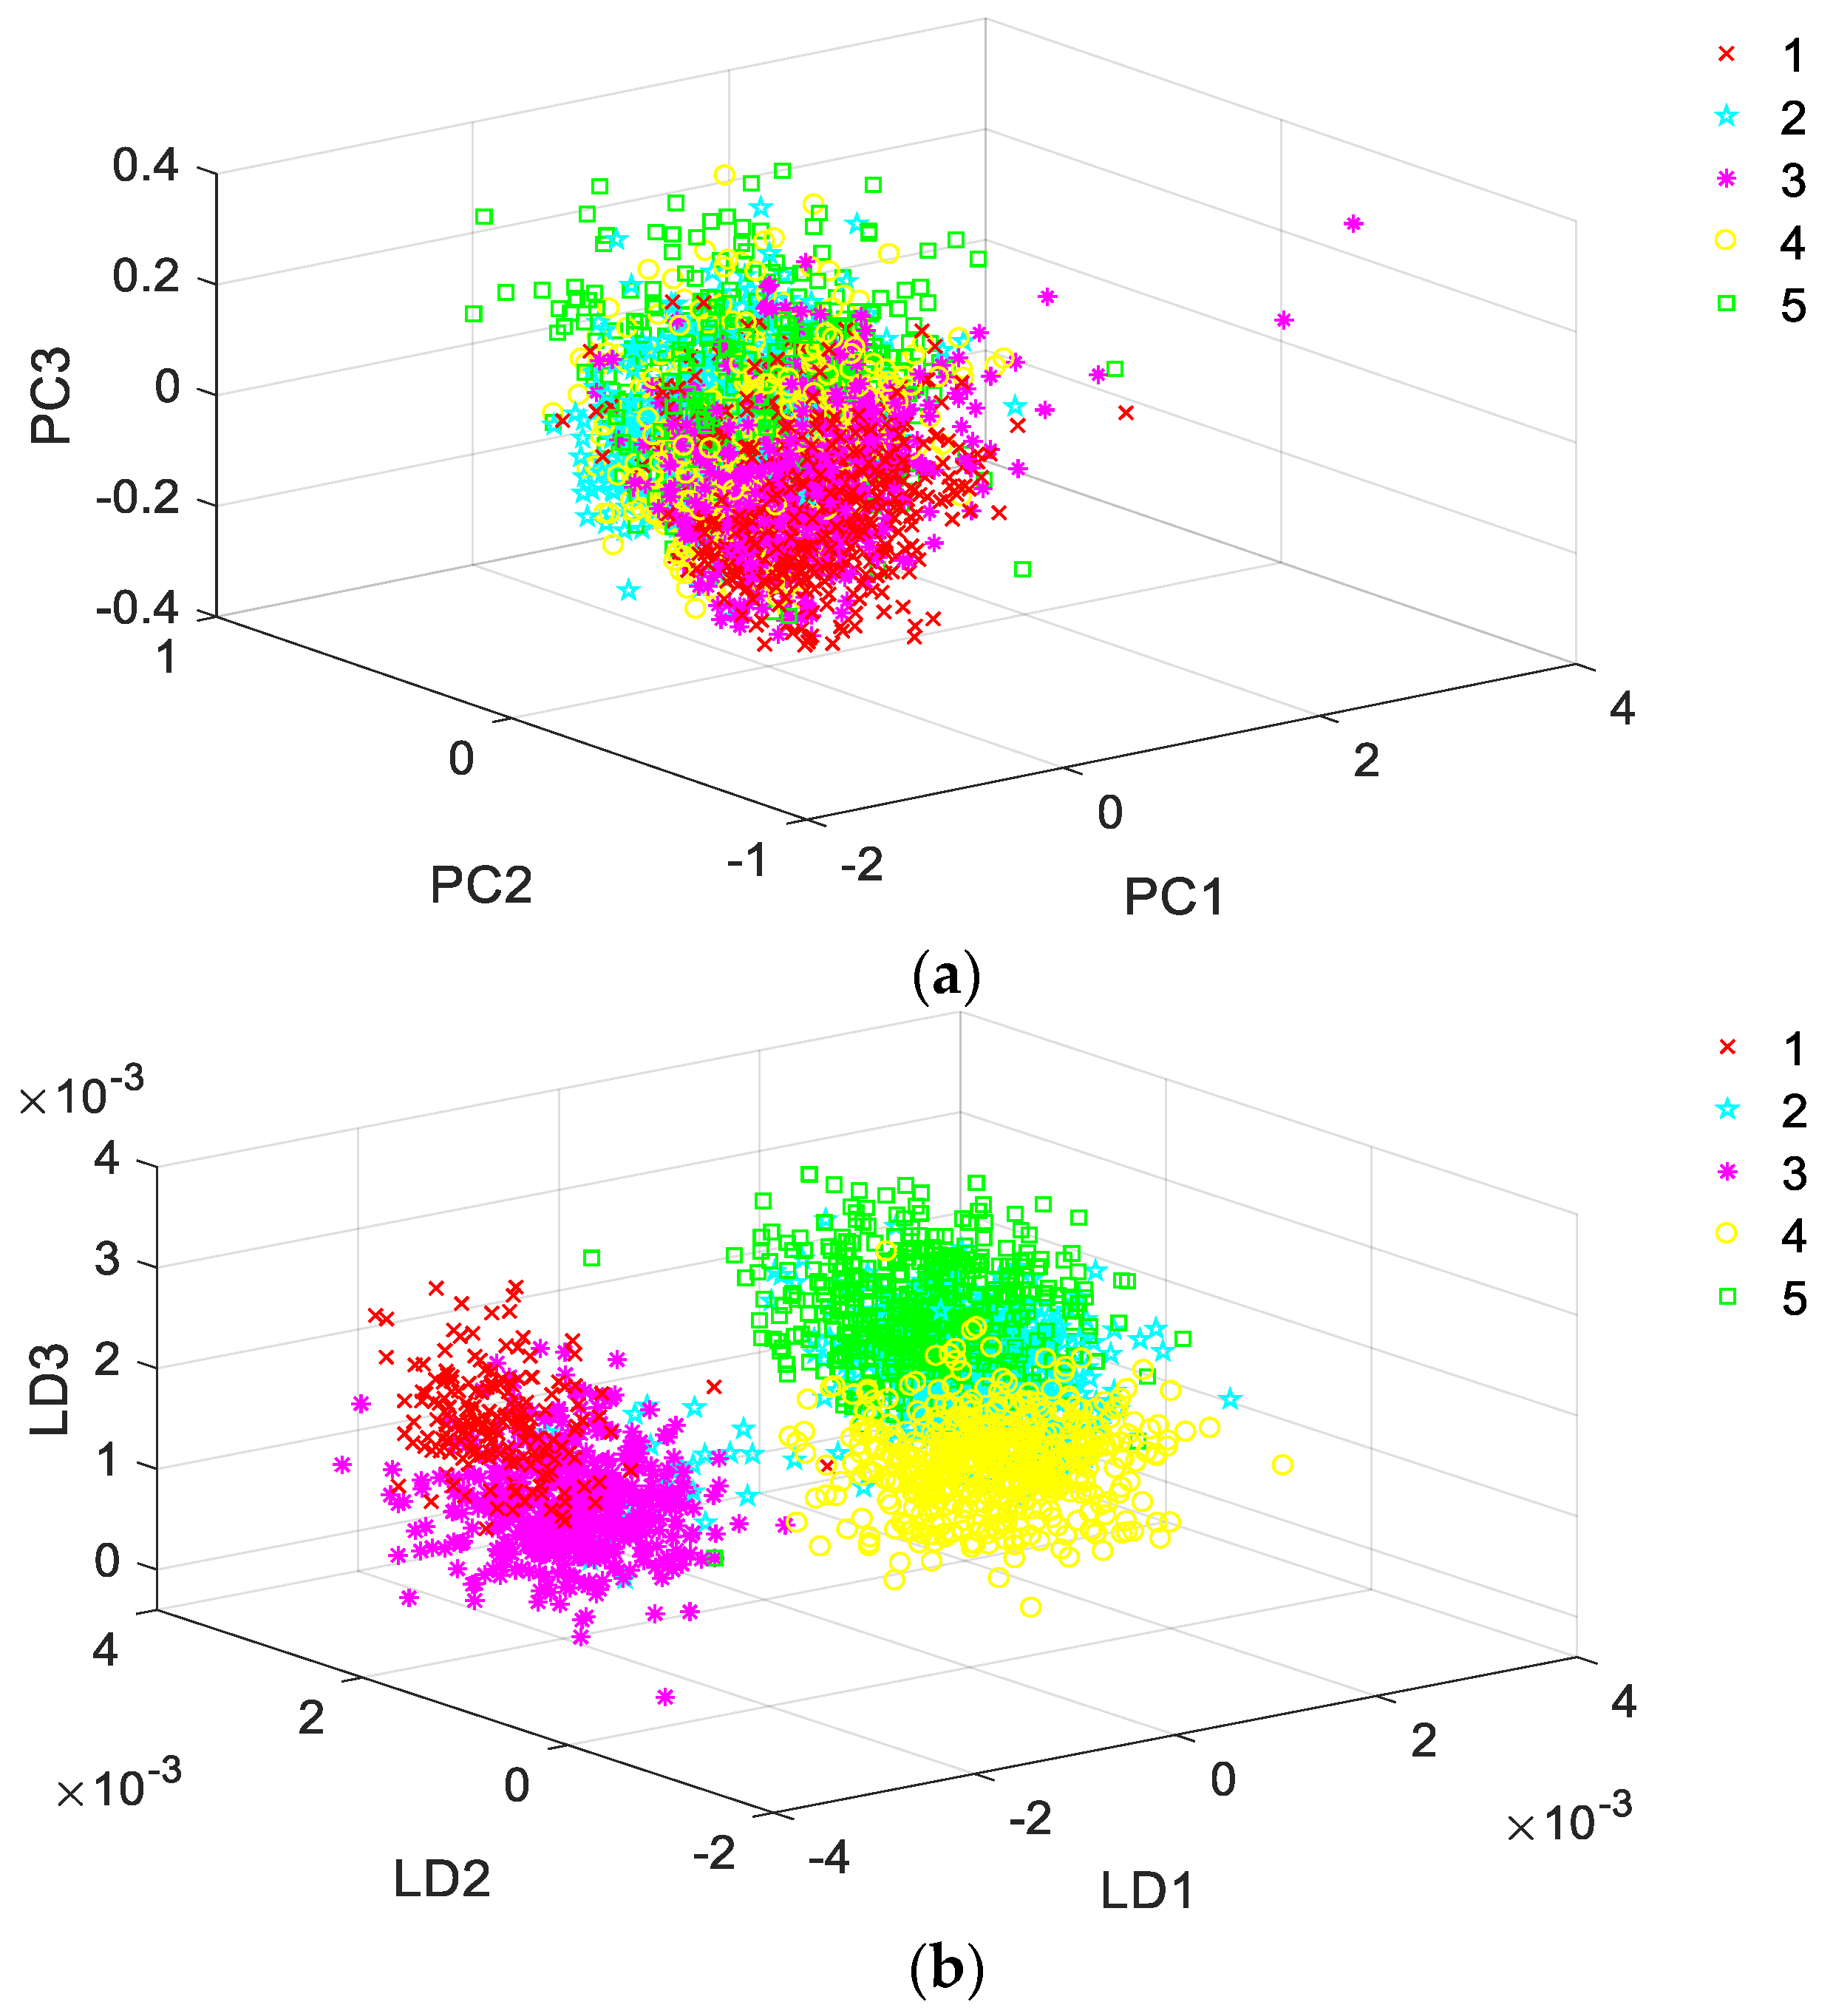
3.2. Exploratory Classification Analysis

To accelerate computational process and make the results more distinct, 500 wheat seeds were randomly selected from each variety, which was repeated five times to perform PCA for exploring the distinguishability of five varieties of wheat seeds. The same outcomes occurred, as described below. In general, the contribution rate of the first three PCs were 90.092%, 9.405%, and 0.334%, respectively. That means that they can reflect spectral variation above 99%. Hence, the first three PCs were selected for PCA analysis. Figure 3a displays the three-dimensional scattering plot. No significant boundary was observed among five varieties of wheat seeds from the figure. Even some crossovers existed between varieties, such as 1 and 3, 4, and 5. This was consistent with the spectral curve analysis. Different from the research [37,38], PCA did not give us a dramatically distinguishable basis for wheat varieties. That is to say, PCA does not work well for all grain classifications in terms of exploratory analysis. This was understandable, since PCA aims to maximize the variance of variables rather than to maximize the discriminability of different varieties of samples after projection.
Thus, another exploratory approach, LDA, was introduced for wheat seeds’ identification. Unlike PCA, the purpose of LDA is to find a projection space where the samples from different classes can be separated as far as possible. LDA was implemented in same condition as PCA. Its three major components were selected as well and its result was shown in Figure 3b. It could be clearly observed that, generally, samples from same varieties were clustered and seeds from different kinds were divided. When compared with the displayed results of PCA, LDA presented obvious boundaries among different wheat varieties. Therefore, LDA can be also served as a potential tool for exploratory analysis of discriminability between the wheat samples of different classes. This exploratory analysis provided us a powerful distinguishable basis quantitatively.

3.3. Classification Results and Analysis of Discriminant Models Based on Full Wavelengths

The discrimination models, LDA, SVM, and ELM, were established based on full wavelengths to classify five varieties of wheat seeds quantitatively using all wheat seeds sample, because of the distinguishable feasibility of part of random sample. The whole data set was divided into 10 groups and every time one group was taken for the test set, the other nine for the train set. Ten different data groups were input into the model, respectively, and their average accuracy was served as the final result. Three preprocessing methods were introduced and their influence on the discriminant model were analyzed because the spectral information contains lots of noise. The performance of all models and the relevant parameters were summarized in Table 1. As shown in Table 1, the three models based on full spectra all achieved good accuracies over 80% on predication set, which indicated a clear and available classification. Dealing by a linear segmentation, LDA got a lower performance than SVM while using hyperplane and ELM using neural network. SVM reached accuracy of 90.13% and 87.81% for calibration set and prediction set, respectively, which were close to the accuracy of 91.30% and 86.26% obtained by ELM model. However, it could be also seen from Table 1 that the models’ classification accuracies all slightly decreased after introducing the preprocessing methods. Among them, WT caused the most performance degradation, followed by MSC, and finally SNV, which was fairly close to the performance of the discriminant model based on the raw spectra. According to Ravikanth, the highest accuracy to classify contaminants and wheat was obtained by the classifier with SNV than MSC. Moreover, combined with both techniques, the modelling performance were also better than that based on raw spectra [17]. Zhang et al. concluded that the higher accuracy using SVM with WT was acquired than other preprocessing methods in prediction set to identify seed varieties [30]. However, none of the pretreatment methods used in this study, including WT, SNV, and MSC, improved the performance of the discriminant model and achieved satisfactory results. By conducting studies above, it could be indicated that not all of the preprocessing methods could improve the classification performance well. For different spectral data, it is not always possible to obtain better results employing the model that was preprocessed by same technique. The reasons were as follows: (1) the spectral information was inevitably disturbed in the process of noise elimination; (2) the transformation and disposal of spectral characteristics might reduce the credibility of data; and, (3) the inhomogeneity of noise random distribution in each band might be ignored. Thus, appropriate preprocessing method or only the original spectra should be selected in accordance with specific data set in the specific application. Besides, the running time using LDA and ELM was much shorter than SVM whose spent time, including optimal parameter selection, was more than one day. In conclusion, the pretreatment of spectra did not have significant impact on the performance of the models. When compared with LDA and SVM, the ELM model had greater advantages in both operational speed and classification accuracy.
The detailed presentation of optimal ELM model based on raw full wavelengths are shown in Table 2 in order to deeply explore which varieties caused the most misjudgment. The results showed variety 2 and 3 were difficult to classify with only 74.28% accuracy in prediction set, which fitted in with our analysis to the overview of spectral profiles. It could be known through seed industry co., LTD that Longping6 and Shannong102 were uniformly derived from the variety of anhui52 wheat. Physical characteristics, such as average plant height and number of ears per acre, maintained little difference. The proportion of crude protein and wet gluten were both similar around 14.9% and 32%, respectively, and as were also other ingredients. This might be the reason why these two varieties were not easy to distinguish. As it was, quantitative modeling analysis still provided serious potentiality for discriminating different wheat varieties while using hyperspectral imaging.

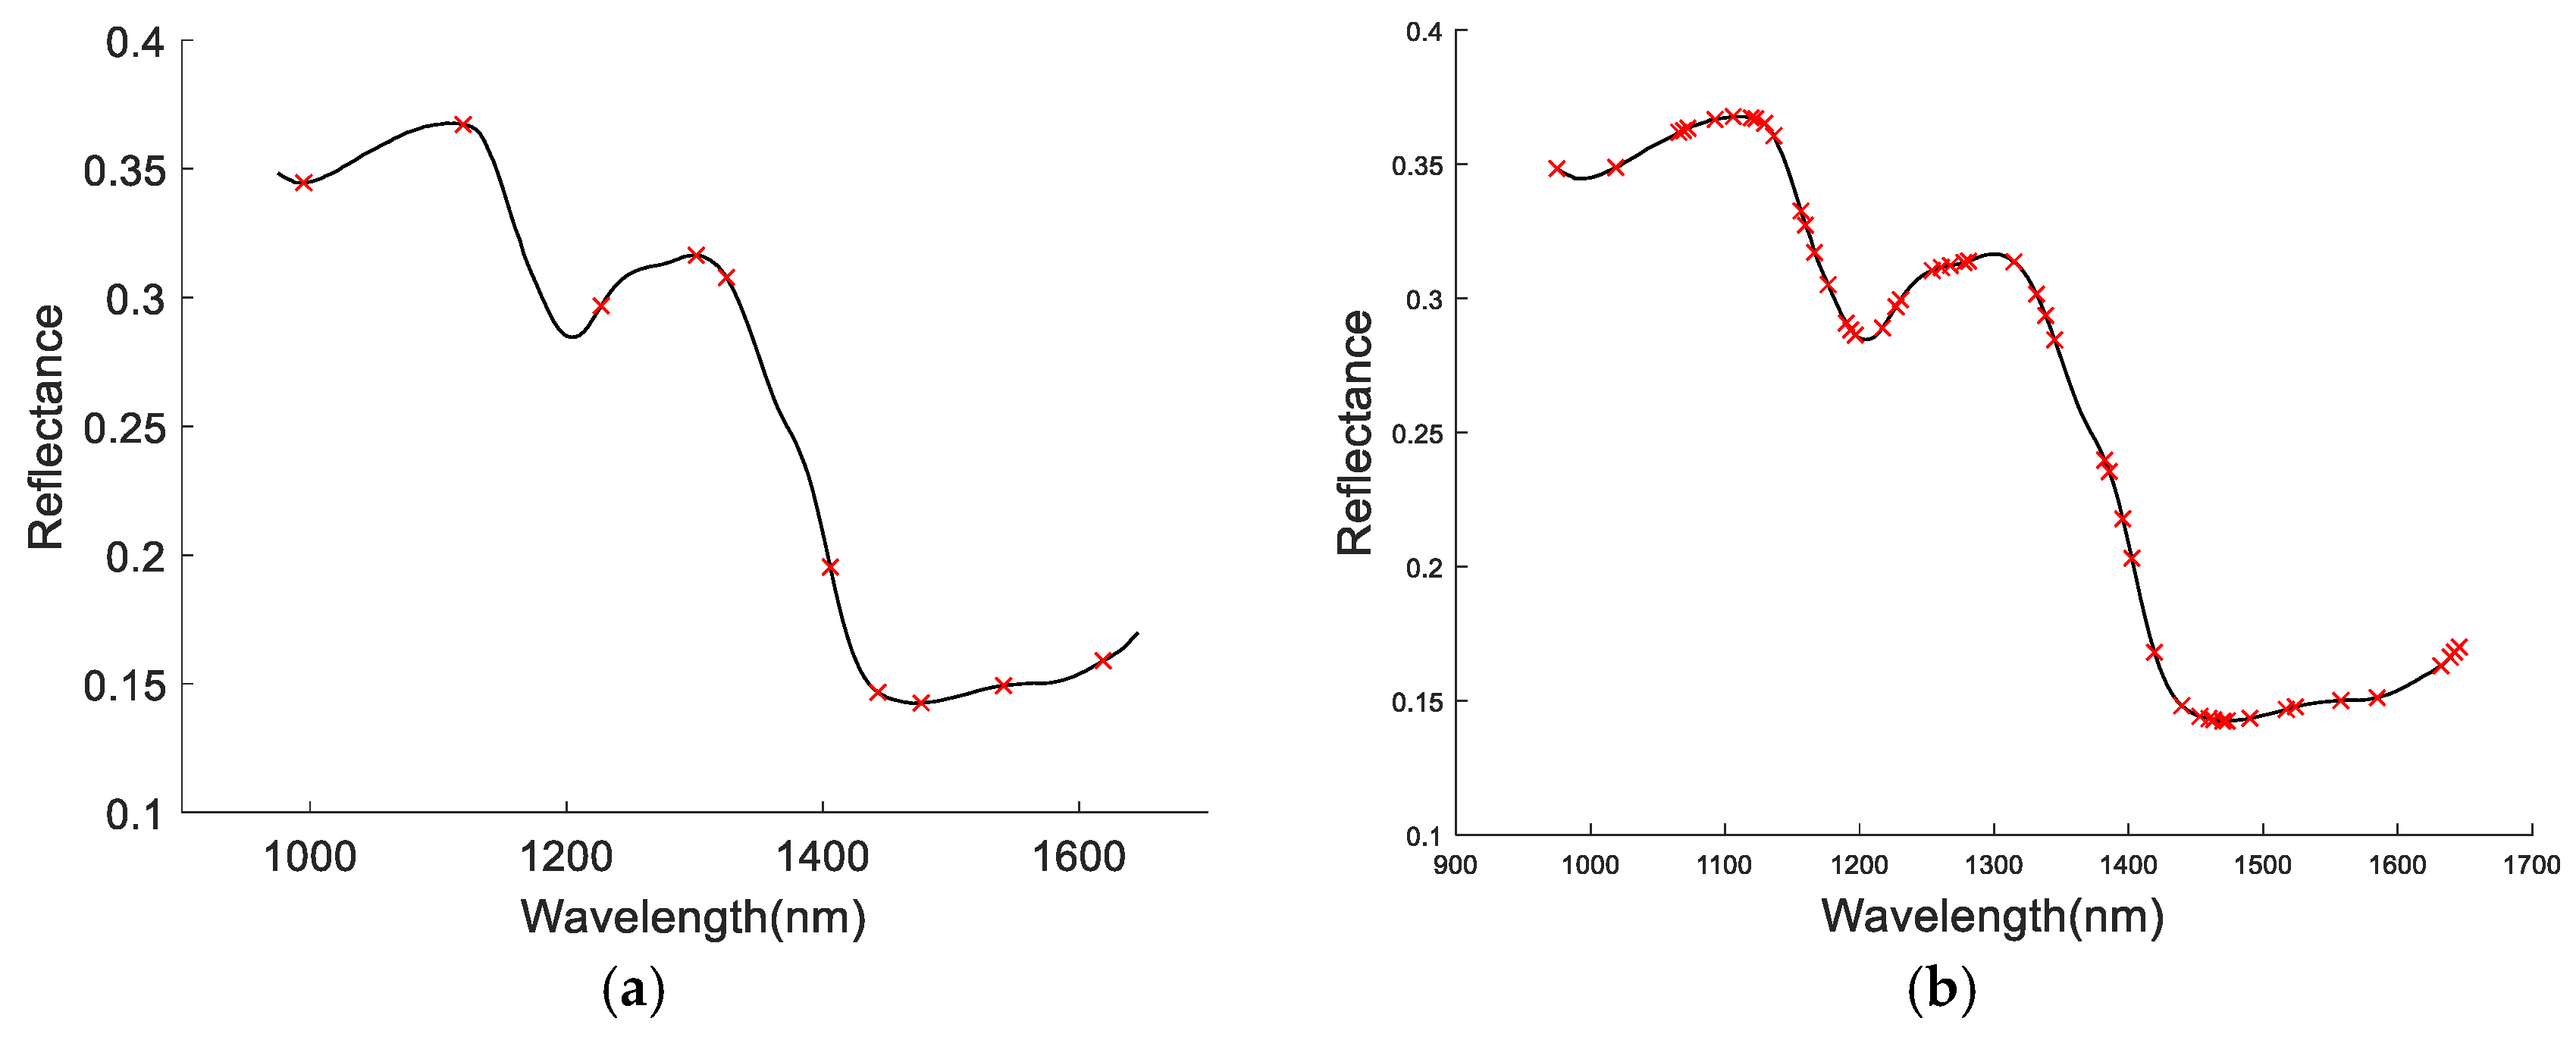
3.4. Extraction of Feature Wavelengths

To reduce the highly-correlated spectral information and facilitate the speed of modeling, the feature wavelengths were selected from raw full wavelengths while using SPA, PCA loading, and RF algorithms. After selection of feature wavelengths, the number of variables decreased from 200 to 10, 36, and 50, respectively. The specific wavelengths identified by the three variable selection algorithms were exhibited in Table 3.
Unlike PCA dimensional reduction, PCA loading should select as many PCs as possible, so as to comprehensively extract feature wavelengths. Accounting for a large proportion of contribution rate up to 99.97% totally (90.092%, 9.405%, 0.334%, 0.074%, 0.037%, 0.028%, respectively), the first six PCs could reflect spectral information comprehensively and completely. Hence, they were loaded to extract feature wavelengths and their loading curves are shown in Figure 4. It was noticed that the trend of PC1 curve was same as the original spectral curve of wheat seeds, which was different from other PCs. The wavelengths at the crests and troughs of the loading curves were selected as the key priority of feature wavelengths, as shown in Figure 4 [37].
The SPA and RF algorithms were implemented and their extracted wavelengths are displayed in Table 3. Before carrying out the two corresponding algorithms, the number of selected variables was set with min-value 5 and max-value 30 for SPA, and the maximal latent variables for cross-validation were set as 20 for RF. Subsequently, feature wavelengths through them are displayed visually in Figure 5.
Among all of the selected characteristic wavelengths, the bands between 973 nm and 1020 nm were attributed to the second overtone of N-H stretching. The selected wavelengths between 1100 nm and 1300 nm were ascribed to the second overtone of C-H stretching [31,32]. The spectral bands between 1300 nm and 1400 nm corresponded to the combinations of C-H vibration [33,34,35]. The selected bands between 1400 nm and 1600 nm corresponded to the first overtone of O-H and N-H telescopic auto-correlation [39]. The bands around 1480 nm were attributed to the second overtone of O-H stretching. The bands between 1600 nm and 1650 nm were attributed to the first overtone of C-H vibration, especially around 1630 nm band corresponding to aromatic C-H bond [40]. Reflecting the chemical bonds’ vibrations, these wavebands with fingerprint characteristics were the symbol of chemical component difference, such as starch, protein, and fat, among different wheat varieties. These laid the foundation for building accurate discrimination models based on reduced feature wavelengths effectively and reliably.

3.5. Classification Results and Analysis of Discriminant Models Based on Feature Wavelengths

LDA, SVM, and ELM models were established using feature wavelengths to discriminate different varieties of wheat seeds to explore the influence of feature wavelengths extracted by different methods on classification performance, and the results are shown in Table 4. It could be seen that ELM performance was the best, which achieved an accuracy of 87.74% on the calibration set and 83.24% on the prediction set when combined with RF. The performance of LDA model was inferior to the other two models, which was consistent with the modeling analysis that was based on full wavelengths. For variable selection algorithms, the discriminant models combined with RF was superior to those combined with SPA and PCA loading. This might be because RF algorithm extracted more spectral wavebands’ information with fingerprint characteristics approximately double times than the others. The number of feature wavelengths that were selected by SPA was the fewest, which perhaps filter too much useful information, leading to the worst accuracy of less than 75% both on calibration and prediction set. Although the number of feature wavelengths extracted by PCA loading is three more times than that of SPA, it also failed to achieve satisfactory results. The experience and judgement error of human might be the main reason for the unsatisfactory accuracy of PCA loading. In general, RF-ELM acquired the optimal performance among all of the discriminant models based on feature wavelengths. Although the accuracy was still lower than that of discriminant model based on raw full wavelengths displayed in Table 1; Table 2, it could be acceptable to some extent. In other words, the introduction of feature wavelengths helps to develop a multispectral imaging instrument for the classification of large-scale wheat seeds in the modern seed industry.
The discrimination performance that was based on the full spectra was also better than that of the feature spectra when different varieties of maize seeds and oat seeds were classified [16,37]. It could be understandable that the classification result based on feature wavelengths was not as good as that of the raw full wavelengths. As, in the process of extracting feature wavelength, plenty of useful spectral variables’ features for variety classification of wheat seeds might be lost in addition to the elimination of redundant information. However, the best classification performance was the SVM model paired with a variable selection method, SPA, when CRISPR/Cas9-induced rice mutants were identified [38]. That is to say, the methods of feature wavelengths extraction could be able to, but not always, improve the performance of the discriminant model. Selecting too few spectral variables might result in the loss of useful information, thus leading to unsatisfactory classification accuracy. Moreover, the effect of different variable selection methods would be different for different applications. Different feature extraction methods influence the performance of discriminant model distinctively. It is necessary to utilize an appropriate variable selection method or directly use the full wavelengths according to the characteristics of the specific data set.

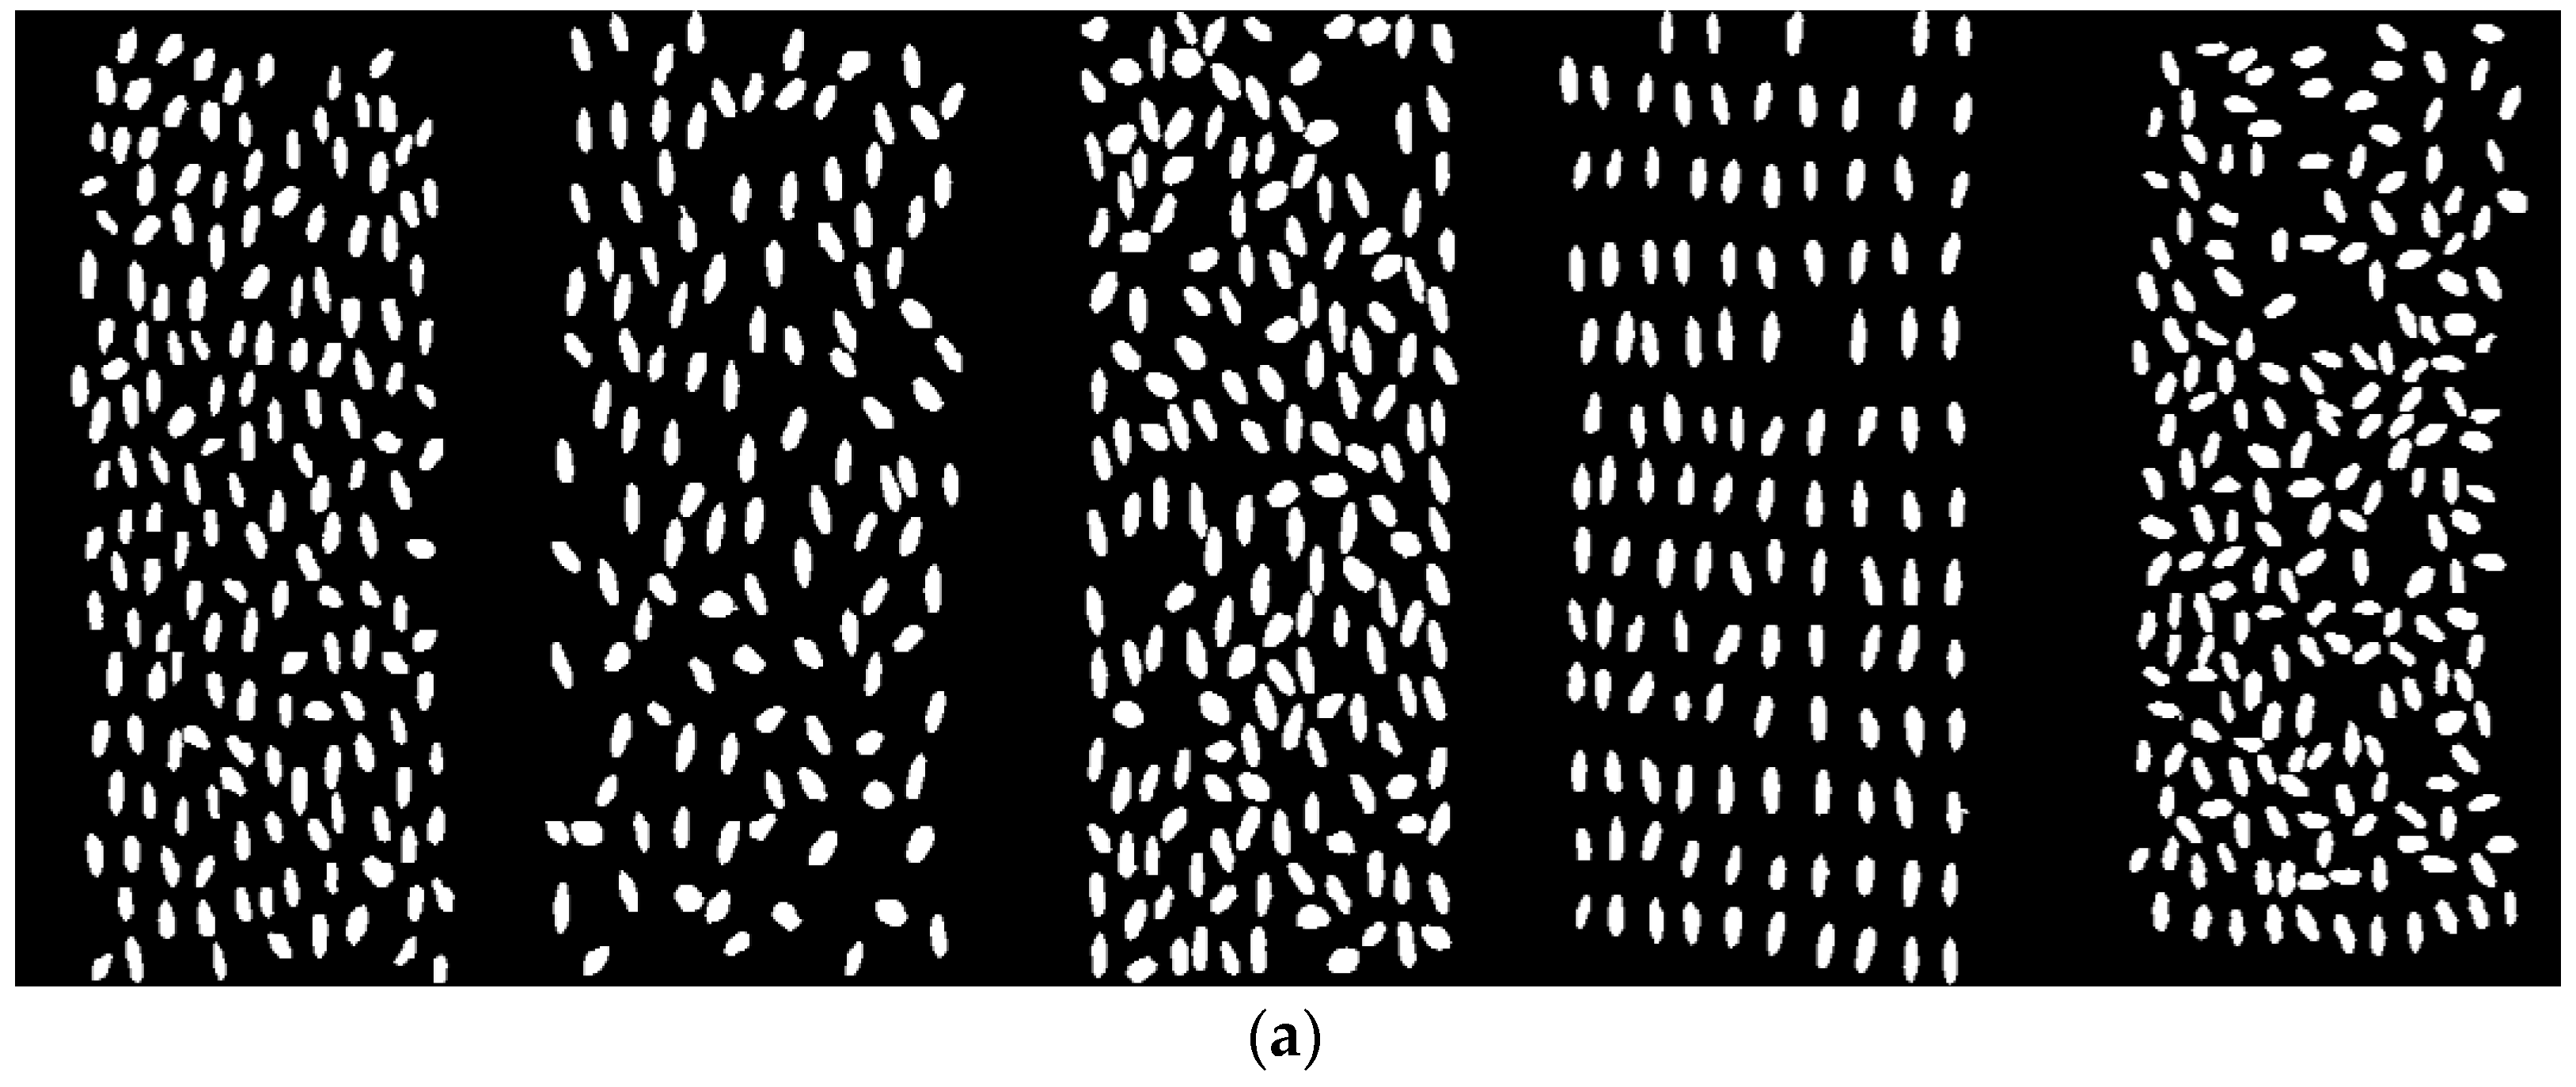
3.6. Classification Visualization of Wheat Varieties

The superiority of HSI to simultaneously obtain both spectral and spatial information makes it possible to display the classification results of wheat varieties using intuitive visualization map. In this study, the best model, ELM based on raw full wavelengths, was selected to visualize the classification results of wheat varieties. The spectral information of each wheat seed in hyperspectral images was input into ELM model to predict the corresponding variety. Combined the prediction results with spatial location’ information of wheat seeds, the visual classification map could be eventually formed. Representing corresponding wheat variety, each digit of different position was endowed with corresponding color to distinguish five varieties of wheat seeds (blue represents variety 1, light blue represents variety 2, yellow represents variety 3, pink represents variety 4, red represents variety 5), which gave a clear view of the variety of wheat seeds. The original gray image is shown in Figure 6a and the classification map was shown in Figure 6b. For these five hyperspectral images, the discriminant accuracy of five varieties of wheat seeds was 100%(169/169), 77.1%(91/118), 74.1%(126/170), 94.4%(117/124), and 93.9%(185/197), respectively, which came to agreement with the detailed interpretation in Section 3.3. The overall accuracy was up to 88% in the classification maps and could be fairly satisfactory. The visualization manner provided us an intuitive and accurate estimation of wheat varieties, which would be beneficial for detecting non-target seeds rapidly and removing them timely, so as to ensure the purity of grains in the production process actually.

4. Conclusions

In this study, the goal of classifying five varieties of wheat seeds was implemented and completed while using hyperspectral imaging technology combined with chemometric methods. During the process, two methods about exploratory classification analysis were studied: PCA and LDA. The latter one displayed the higher distinguishable degree specially, which also manifests the feasibility of identifying wheat grains precisely. Some research regarding the influence of three pretreatment methods on discriminant models was investigated. The results showed that the performance of three models based on different pretreatment had no obvious improvement when compared with that based on raw spectra data and indicated that using preprocessing methods could not always get good classification recognition. Besides, based on full wavelengths and feature wavelengths, the LDA, SVM, and ELM models were established. It can be found that accuracy of discrimination model based on the former was also higher than that of the latter. However, the classification result of RF feature extraction algorithm is also acceptable, which indicated feasibility of feature variable selection. In view of operational speed and economical cost, the model’ performance on feature wavelengths also indicates that it can be likely to be of more potential for developing a portable multispectral instrument to discriminate wheat seeds non-destructively and rapidly. However, the classification performance of wheat grains still needs to be improved. It is worthy of consideration to explore more kinds of spectral preprocessing and feature extraction methods even develop higher accuracy’ deep learning model. Besides, the pseudo-color visualization map was generated to observe the specific variety of each sample clearly and intuitively, which also contributes to developing an online and large-scale detecting system to screen the purity of different wheat varieties. All of the relative results show that with the characteristic of both spectral and spatial information and high throughout, HSI with chemometrics is potential to detect and identify large-scale grain seeds in the modern seed industry.

Author Contributions

C.M. and N.W. provided the conceptualization; C.M. performed the experiments, processed and summarized the spectral data; Y.B., C.M., N.W. and F.L. designed and wrote the article; F.L. is a corresponding author and Y.H. is a principle investigator for the project.

Funding

The research was funded by National Key R&D Program of China (No. 2018YFD0101002), and the Fundamental Research Funds for the Central Universities (No. 2019FZA5007).

Acknowledgments

We want to express thanks to Anhui Longping High-Tech Seed Industry Co., Ltd. for providing precious materials.

Conflicts of Interest

The authors declare no conflict of interest.

References

  1. FAOSTAT. Food and Agricultural Commodities Production. 2017. Available online: http://www.fao.org/faostat/en/#data/QC (accessed on 1 July 2019).
  2. FAOSTAT. Food Supply. 2013. Available online: http://www.fao.org/faostat/en/#data/CC (accessed on 1 July 2019).
  3. Fayyazi, S.; Abbaspourfard, M.H.; Rohani, A.; Monadjemi, S.A.; Sadrnia, H. Identification and classification of three Iranian rice varieties in mixed bulks using image processing and mlp neural network. J. Food Eng. 2017, 13, 20160121. [Google Scholar] [CrossRef]
  4. Manickavasagan, A.; Sathya, G.; Jayas, D.S.; White, N.D.G. Wheat class identification using monochrome images. J. Cereal Sci. 2008, 47, 518–527. [Google Scholar] [CrossRef]
  5. Li, G.; Li, Y.; Zhang, M. Study on identification of rice seeds by chemical oscillation fingerprints. RSC Adv. 2015, 5, 96472–96477. [Google Scholar] [CrossRef]
  6. Zhang, C.; Jiang, H.; Liu, F.; He, Y. Application of near-infrared hyperspectral imaging with variable selection methods to determine and visualize caffeine content of coffee beans. Food Bioprocess Technol. 2017, 10, 213–221. [Google Scholar] [CrossRef]
  7. Anisur, R.; Byoung-Kwan, C. Assessment of seed quality using non-destructive measurement techniques: A review. Seed Sci. Res. 2016, 26, 285–305. [Google Scholar]
  8. Gowen, A.A.; O’Donnell, C.P.; Cullen, P.J.; Downey, G.; Frias, J.M. Hyperspectral imaging–An emerging process analytical tool for food quality and safety control. Trends Food Sci. Technol. 2007, 18, 590–598. [Google Scholar] [CrossRef]
  9. Plaza, A.; Benediktsson, J.A.; Boardman, J.W.; Brazile, J.; Bruzzone, L.; Camps-Valls, G.; Chanussot, J.; Fauvel, M.; Gamba, P.; Gualtieri, A.; et al. Recent advances in techniques for hyperspectral image processing. Remote Sens. Environ. 2009, 113, S110–S122. [Google Scholar] [CrossRef]
  10. Rodionova, O.; Roger, J.M.; Walczak, B.; Tauler, R. Chemometrics in analytical chemistry—Part II: Modeling, validation, and applications. Anal. Bioanal. Chem. 2018, 410, 6691–6704. [Google Scholar]
  11. Zheng, Q.; Jian, C.; Zhao, Y.; Zhu, S.; He, Y.; Zhang, C. Variety identification of single rice seed using hyperspectral imaging combined with convolutional neural network. Appl. Sci. 2018, 8, 212. [Google Scholar]
  12. Huang, M.; He, C.; Zhu, Q.; Qin, J. Maize seed variety classification using the integration of spectral and image features combined with feature transformation based on hyperspectral imaging. Appl. Sci. 2016, 6, 183. [Google Scholar] [CrossRef]
  13. Du, Y.; Chen, X.; Liang, K.; Xu, J.H.; Shen, M.X.; Lu, W. Identification of deoxynivalenol content in wheat based on the hyperspectral image system. Sci. Technol. Food Ind. 2016, 37, 54–58. [Google Scholar]
  14. Ravikanth, L.; Singh, C.B.; Jayas, D.S.; White, N.D. Performance evaluation of a model for the classification of contaminants from wheat using near-infrared hyperspectral imaging. Biosyst. Eng. 2016, 147, 248–258. [Google Scholar] [CrossRef]
  15. Senthilkumar, T.; Jayas, D.S.; White, N.D.G.; Fields, P.G.; Gräfenhan, T. Detection of ochratoxin a contamination in stored wheat using near-infrared hyperspectral imaging. Infrared Phys. Technol. 2017, 81, 228–235. [Google Scholar] [CrossRef]
  16. Wu, N.; Zhang, Y.; Na, R.; Mi, C.; Zhu, S.; He, Y.; Zhang, C. Variety identification of oat seeds using hyperspectral imaging: Investigating the representation ability of deep convolutional neural network. RSC Adv. 2019, 9, 12635–12644. [Google Scholar] [CrossRef]
  17. Ravikanth, L.; Singh, C.B.; Jayas, D.S.; White, N.D. Classification of contaminants from wheat using near-infrared hyperspectral imaging. Biosyst. Eng. 2015, 135, 73–86. [Google Scholar] [CrossRef]
  18. Asmund, R.; Berg, F.V.D.; Søren, B.E. Review of the most common pre-processing techniques for near-infrared spectra. Trac-Trend Anal. Chem. 2009, 28, 1201–1222. [Google Scholar]
  19. De Luca, M.; Restuccia, D.; Clodoveo, M.L.; Puoci, F.; Ragno, G. Chemometric analysis for discrimination of extra virgin olive oils from whole and stoned olive pastes. Food Chem. 2016, 202, 432–437. [Google Scholar] [CrossRef] [PubMed]
  20. Puneet, M.; Alison, N.; Julius, T.; Guoping, L.; Sally, R.; Stephen, M. Near-infrared hyperspectral imaging for non-destructive classification of commercial tea products. J. Food Eng. 2018, 238, 70–77. [Google Scholar] [Green Version]
  21. Feng, X.; Zhao, Y.; Zhang, C.; Cheng, P.; He, Y. Discrimination of transgenic maize kernel using NIR hyperspectral imaging and multivariate data analysis. Sensors 2017, 17, 1894. [Google Scholar] [CrossRef]
  22. Nie, P.; Dong, T.; He, Y.; Xiao, S. Research on the effects of drying temperature on nitrogen detection of different soil types by near infrared sensors. Sensors 2018, 18, 391. [Google Scholar] [CrossRef]
  23. Milanez, K.D.T.M.; Nóbrega, T.C.A.; Nascimento, D.S.; Insausti, M.; Band, B.S.F.; Pontes, M.J.C. Multivariate modeling for detecting adulteration of extra virgin olive oil with soybean oil using fluorescence and UV–Vis spectroscopies: A preliminary approach. LWT-Food Sci. Technol. 2017, 85, 9–15. [Google Scholar] [CrossRef]
  24. Saerens, M.; Fouss, F.; Yen, L.; Dupont, P. The principal components analysis of a graph, and its relationship to spectral clustering. In Proceedings of the 15th European Conference on Machine Learning (ECML’04), Pisa, Italy, 20–24 September 2004; pp. 371–383. [Google Scholar]
  25. Li, H.D.; Xu, Q.S.; Liang, Y.Z. Random frog: An efficient reversible jump Markov Chain Monte Carlo-like approach for variable selection with applications to gene selection and disease classification. Anal. Chim. Acta 2012, 740, 20–26. [Google Scholar] [CrossRef] [PubMed]
  26. Hu, M.; Zhai, G.; Zhao, Y.; Wang, Z. Uses of selection strategies in both spectral and sample spaces for classifying hard and soft blueberry using near infrared data. Sci. Rep. 2018, 8, 6671. [Google Scholar] [CrossRef] [PubMed] [Green Version]
  27. Gerhardt, N.; Schwolow, S.; Rohn, S.; Pérez-Cacho, P.R.; Galán-Soldevilla, H.; Arce, L.; Weller, P. Quality assessment of olive oils based on temperature-ramped HS-GC-IMS and sensory evaluation: Comparison of different processing approaches by LDA, kNN, and SVM. Food Chem. 2019, 286, 307–308. [Google Scholar] [CrossRef] [PubMed]
  28. Mavroforakis, M.E.; Theodoridis, S. A geometric approach to Support Vector Machine (SVM) classification. IEEE Trans. Neural Netw. Lear. 2006, 17, 671–682. [Google Scholar] [CrossRef]
  29. Yuan, Y.; Zhi, B.; Zhao, B. Novel variable selection method based on uninformative variable elimination and ridge extreme learning machine: CO gas concentration retrieval trial. Spectrosc. Spect. Anal. 2017, 37, 299–305. [Google Scholar]
  30. Zhang, C.; Liu, F.; He, Y. Identification of coffee bean varieties using hyperspectral imaging: Influence of preprocessing methods and pixel-wise spectra analysis. Sci. Rep. 2018, 8, 2166. [Google Scholar] [CrossRef]
  31. Liu, Y.; Chen, Y.R. Two-dimensional correlation spectroscopy study of visible and near-infrared spectral intensity variations of chicken meats in cold storage. Appl. Spectrosc. 2000, 54, 1458–1470. [Google Scholar] [CrossRef]
  32. Liu, Y.; Chen, Y.R.; Ozaki, Y. Two-dimensional visible/near-infrared correlation spectroscopy study of thermal treatment of chicken meats. J. Agric. Food Chem. 2000, 48, 901–908. [Google Scholar] [CrossRef]
  33. Ribeiro, J.S.; Ferreira, M.M.C.; Salva, T.J.G. Chemometric models for the qantitative descriptive sensory analysis of Arabica coffee beverages using near infrared spectroscopy. Talanta 2011, 83, 1352–1358. [Google Scholar] [CrossRef]
  34. Vance, C.K.; Tolleson, D.R.; Kinoshita, K.; Rodriguez, J.; Foley, W.J. Near infrared spectroscopy in wildlife and biodiversity. J. Near Infrared Spectrosc. 2016, 24, 1–25. [Google Scholar] [CrossRef]
  35. Serranti, S.; Cesare, D.; Marini, F.; Bonifazi, G. Classification of oat and groat kernels using NIR hyperspectral imaging. Talanta 2013, 103, 276–284. [Google Scholar] [CrossRef] [PubMed]
  36. Cen, H.; He, Y. Theory and application of near infrared reflectance spectroscopy in determination of food quality. Trends Food Sci. Technol. 2007, 18, 72–83. [Google Scholar] [CrossRef]
  37. Zhao, Y.; Zhu, S.; Zhang, C.; Feng, X.; Feng, L.; He, Y. Application of hyperspectral imaging and chemometrics for variety classification of maize seeds. RSC Adv. 2018, 8, 1337–1345. [Google Scholar] [CrossRef] [Green Version]
  38. Feng, X.; Peng, C.; Chen, Y.; Liu, X.; Feng, X.; He, Y. Discrimination of CRISPR/Cas9-induced mutants of rice seeds using near-infrared hyperspectral imaging. Sci. Rep. 2017, 7, 15934. [Google Scholar] [CrossRef]
  39. Workman, J., Jr.; Weyer, L. Practical guide and spectral atlas for interpretive near-infrared spectroscopy. In Book Practical Guide and Spectral Atlas for Interpretive Near-Infrared Spectroscopy, 2nd ed.; CRC Press: Boca Raton, FL, USA, 2012. [Google Scholar]
  40. Liu, Y.; Chen, Y.R. Two-dimensional visible/near-infrared correlation spectroscopy study of thawing behavior of frozen chicken meats without exposure to air. Meat Sci. 2001, 57, 299–310. [Google Scholar] [CrossRef]
Figure 1. The spectra of wheat seeds samples.
Applsci 09 04119 g001
Figure 2. Average spectral curves with their standard deviation (SD) of five varieties of wheat seeds.; Note: 1, 2, 3, 4, 5 refer to Annong1124, Longpingmai6, Shannong102, Weilong169, Zhenmai9, respectively.
Applsci 09 04119 g002
Figure 3. Exploratory classification maps of five different varieties of wheat seeds: (a) Three-dimensional scattering plot performed by principal component analysis (PCA); (b) Three-dimensional scattering plot performed by linear discrimination analysis (LDA).; Note: 1, 2, 3, 4, 5 refer to Annong1124, Longpingmai6, Shannong102, Weilong169, Zhenmai9, respectively.
Applsci 09 04119 g003
Figure 4. The loading curves of the first six principal components (PCs) and corresponding distribution of feature wavelengths.
Applsci 09 04119 g004
Figure 5. The distribution maps of feature wavelengths extracted by different methods: (a) The distribution maps of feature wavelengths extracted by SPA; and, (b) The distribution maps of feature wavelengths extracted by RF.
Applsci 09 04119 g005
Figure 6. Visualization maps of five varieties of wheat seeds: (a) Grayscale image; (b) Pseudo-color classification map; (from left to right: Annong1124, Longpingmai6, Shannong102, Weilong169, Zhenmi9).
Applsci 09 04119 g006aApplsci 09 04119 g006b
Table 1. The classification performance of models based on full wavelengths and preprocessing methods.
Prepro.LDASVMELM
Cal./%Pre./%(c, g)Cal./%Pre./%nCal./%Pre./%
Raw85.1984.02(23,170.475, 0.35355)90.1387.81280091.3086.26
WT82.3081.81(32,768, 0.5)86.585.03210088.9785.35
SNV84.3282.93(1024, 0.5)92.8287.70210091.0785.87
MSC84.2382.82(4096, 2.0)88.2786.18270090.9685.64
Note: Prepro. means preprocessing methods; Cal. means the accuracy of calibration set; Pre. means the accuracy of prediction set; Penalty coefficient c and the kernel parameter g as the parameter of SVM; The optimal number of hidden nodes, n, as the parameter of ELM.
Table 2. The detailed discrimination results of five wheat varieties in extreme learning machine (ELM) model.
Var.Calibration SetPrediction Set
12345Acc./%12345Acc./%
1583112643098.6614328361196.89
21739067353430078.2511894250108371.63
31796324258212583.2578224950151274.28
40153249159897.130121611904894.00
50891462555197.111611737131491.89
Total 91.30 86.26
Note: Var. means different varieties of wheat samples. Acc. means classification accuracy of ELM model.
Table 3. The feature wavelengths extracted by successive projections algorithm (SPA), Principal component analysis (PCA), loading, and random frog (RF) based on raw spectra.
MethodNum.The Feature Wavelengths (nm)
SPA10995, 1119, 1301, 1405, 1442, 1475, 1618, 1324, 1227, 1540
PCA loading36995.15, 1005.22, 1025.37, 1048.88, 1062.31, 1095.92, 1102.64, 1112.72, 1122.81, 1129.54, 1173.26, 1179.99, 1200.19, 1203.55, 1227.12, 1281.01, 1301.23, 1304.60, 1311.35, 1321.46, 1372.05, 1378.80, 1395.67, 1405.79, 1412.54, 1439.55, 1446.31, 1469.95, 1473.33, 1483.46, 1551.07, 1561.21, 1574.74, 1584.89, 1622.12, 1628.89
RF50975.01, 1018.65, 1065.67, 1069.03, 1072.39, 1092.5601, 1106, 1119.45, 1122.81, 1129.54, 1136.26, 1156.4399, 1159.81, 1166.54, 1176.63, 1190.09, 1193.46, 1203.55, 1217.02, 1227.12, 1230.49, 1254.06, 1260.8, 1267.54, 1277.64, 1281.01, 1314.72, 1331.57, 1338.32, 1345.06, 1382.17, 1385.54, 1395.67, 1402.42, 1419.29, 1439.55, 1453.06, 1459.8101, 1463.19, 1469.95, 1473.33, 1490.22, 1517.26, 1524.02, 1557.83, 1584.89, 1632.27, 1639.04, 1642.43, 1645.82
Table 4. The performance of discriminant models based on feature wavelengths.
Feature Extracting MethodLDASVMELM
Cal./%Pre./%(c, g)Cal./%Pre./%nCal./%Pre./%
PCA loading60.7261.12(32,768, 2)66.9366.05260079.3972.0
SPA64.8965.54(32,768, 8)70.4670.62240070.0670.54
RF79.6278.48(32,768, 2)84.3782.00240087.7483.24
Note: Cal. means the accuracy of calibration set; Pre. means the accuracy of prediction set; Penalty coefficient c and the kernel parameter g as the parameter of SVM; The optimal number of hidden nodes, n, as the parameter of ELM.

