1. Introduction
With the growing development of communication and multimedia technology, more and more people use the Internet to obtain information online, such as browsing the web, listening to music, watching videos, downloading files, and so on. In this case, understanding and evaluating the network performance becomes an important task. Traditionally, network operation and maintenance centers use network technology-centric metrics in terms of quality of service (QoS), such as transmission delay, packet loss rate, etc., to measure the network quality. However, it has been demonstrated that the QoS primarily targets at improving the service quality with respect to application-level technical parameters, which lacks sufficient consideration of the user’s actual perceptions and feelings [
1]. To solve this problem, the user-centric measurement of service quality with the notion of quality of experience (QoE) is introduced, which has drawn much attention in both academia and industry [
2,
3,
4]. Generally, the assessment of QoE can be done in both subjective and objective ways [
5], where subjective evaluation is usually implemented by questionnaires and rating scales [
6], can be treated as the more direct and reliable way to evaluate QoE scores. However, it is time-consuming, costly, and inconvenient [
7]. Another assessment appraoch of QoE, objective assessment, uses predefined models to approximate the subjective QoE estimation without human involvement [
5].
The existing objective QoE assessment models can be roughly divided into two categories, namely, signal fidelity based and QoS-based. Generally, playback operations are needed when applying the signal fidelity methods, but it is difficult in most streaming services. Thus, the signal fidelity methods cannot be widely applied even if they are highly accurate. In terms of the QoS-based model, the aim is to find a mapping relation between QoS and QoE. As QoS is described by the network parameters, such as network delay, packet loss rate, and network flow throughput rate; once the mapping relation is built, the QoS-based QoE quantization will be established. Owing to this idea, substantial efforts have been made by engineers and scholars when exploring the QoS-based model, where some works have been done for specific types of network service, such as video stream service [
8,
9,
10,
11,
12], Internet of Things [
13], Instant Messaging [
14,
15,
16], File Sharing [
17], and so on, where proprietary features or parameters are also used in. In [
8], the authors proposed a QoE formulation for encrypted YouTube video stream, video source quality-oriented factors like video codec, codec profile, video resolution, bitrate, and video viewing-oriented factors like initial buffering latency, stalling ratio score are both considered into establishing the QoE equation. Chervenets et al. also proposed a QoE evaluation model by using relevant QoS parameters for video service [
10], where the QoS formula takes into account the parameters of packet loss, burst level, packet jitter, packet delay, and bandwidth, as well as the weights for each parameters. In [
11], a joint framework of QoS and QoE for video transmission over wireless multimedia sensor networks (WMSNs) is proposed, which can support QoS in WMSNs with a lightweight error concealment and utilize the maximum network throughput. The authors of [
12] analyzed the streaming video service performance with both the subjective and objective QoS factors (network delay, jitter, and packet loss rate) that affect QoE, which is an inspiration in the processes of both forming QoE model and doing experiments. Li et al. developed a regression equation between QoE and the principal QoS parameters of IoT applications [
13].
It should be pointed out that, in the QoE model based on the features of a particular service, it cannot be extended to other network services; however, network operation and maintenance centers often need to ensure that the QoE of all types of network services can be effectively evaluated, thus they can provide users with a better network experience. Therefore, the QoE evaluation model for a single specific service type does not meet the needs of the network operation and maintenance center. To solve this problem, some works have been done on the QoE evaluation algorithms that applicable to multiple service types [
18,
19,
20,
21,
22,
23,
24]. In [
20], Hsu et al. proposed an implementation of QoS/QoE mapping in software-defined networks for ISP to moniter the user-perceived QoE after accessing the service. The authors of [
24] also presented some parameteric QoE evaluation for VoIP, online video, FTP services, etc., where only specific part of network parameters are used for different services, such as transmission rate factor in VoIP and rate of correctly received data in FTP. In this paper, we proposed a network traffic classification-based nonlinear mathematical QoE quantization model for universal traffic types, which can be seen as a QoS-based QoE quantization method. For a network data flow, we first classify its traffic type by using a machine learning classifier, then extract its QoS metric values into the corresponding QoE quantization model, after that the QoE score will be obtained. The proposed QoE model has a nonlinear mapping relation with QoS, which will be less influenced by the “marginal effect” than other existing linear mapping quantization approaches. In addition, the proposed model has earned good quantization accuracy and engineering feasibility.
The main contributions of this paper can be listed as follows. (1) An end-to-end QoE score measurement method is proposed. (2) A machine learning classifier (random forest) is used to identify the type of network traffic, where the network traffics are categorized into 11 main types, including on-demand streaming media and live streaming media. (3) More elaborate QoE mathematical quantization formulae of different types of network traffic are given, the way in which different QoS metrics affect QoE is fully considered into the QoE formulas.
The rest of this paper is organized as follows.
Section 2 shows some preliminaries about QoS and QoE. In
Section 3, we introduce the whole structure of our QoE quantization system, and then the three key procedures, namely, flow features and QoS metrics extraction, random forest classifier, and QoE quantization model, are presented. The experiment details including traffic classification results and QoE quantization results will be given in
Section 4. At last, we will summarize the whole paper in
Section 5 and give the conclusions.
2. Preliminaries
2.1. Quality of Service (QoS)
QoS was firstly defined by ITU (International Telecommunication Union) in 1994 as a comprehensive measurement of a service’s performance in mobile telecommunication, computer networks, or other digital signal transmission systems. QoS mechanism provides different priorities to different applications, network sessions, or users to guarantee a certain level of performance to a data flow. Most commercial multimedia service providers have applied QoS-oriented optimizing method on effective data flow delivering through resource (bandwidth, throughput, etc.)-limited network, especially for real-time multimedia applications such as IPTV [
25], VoIP, online meeting, and multiplayer online games.
QoS mechanism generally uses numeric scores to quantify the network transmission quality of services, which is referred as QoS score. QoS score is usually valued by some related aspects of the network service, like transmission delay, packet loss rate, throughput, network jitter, resource availability, etc. [
26]. Typically, a general assessment model is designed as
where
is a network influencing factor,
N denotes the number of network influencing factors,
is their corresponding weight, and
represents a mapping function.
In the literature, the mapping function is a linear function; however, the linear mapping method ignores the “marginal effect” of some network parameters, which, in fact, cannot fully describe the relation between the network parameters and QoS score; for example, an extreme case, assuming that a certain kind of service is less sensitive to the network transmission delay, namely, it has a relatively small weight in influencing QoS score, and we further assume the network packet loss rate is 100%, which means packet loss will happen with a probability of 100%, with the throughput rate of 100 Mbps. It is clear that the aforementioned network will fail to deliver any packet, and theoretically the QoS scores will rise with the timeline, but unfortunately, a linear mapping function cannot indicate such trend.
2.2. Quality of Experience (QoE)
QoE refers to the user’s assessment of the network service experience under the overall network environment, which is a vital way for content providers and operators to evaluate and improve their service. Generally, we use subjective evaluation–MOS (Mean Opinion Score) to quantify QoE; MOS denotes the levels of experience and can be represented by a single number for evaluation in the range of 1 to 5, as in
Table 1.
However, obtaining QoE by subjective evaluation method is complex, as well as time-consuming and costly; therefore, realization of real-time quality monitoring is difficult. In order to overcome these difficulties, a series of objective evaluation methods are proposed, via some objective key performance indicators (KPIs) of network service. Remember that the QoE itself is a subjective perceptual score, so one can barely replace it with objective system attributes, directly. What we can do is to describe QoE to a certain degree, with a suitable mapping between objective parameters and QoE.
2.3. Random Forest Classifier
In general, random forest can be seen as a set of unpruned inference trees, who together will vote for the final decision in classification tasks, namely, “majority vote”. Assume a training dataset consisting of N samples with M features in full dimension. Each inference tree in random forest (RF) grows with bootstrap samples randomly selected from the same dataset, which can be described as random variable selection; note that only n training samples randomly selected from the dataset is used to build a single tree. Due to the two selection randomness of both the training sample and feature subsets and the advantage of the ensemble learning method, random forest obtains the capability of avoiding the problem of overfitting, high noise immunity, and outstanding computational accuracy. Furthermore, RF can also achieve extremely speedy computation on a parallel architecture, which allows each inference tree to run independently on a CPU core. Because of the excellent classification performance, random forest classifier has been widely used in various applications and tasks.
3. Proposed Method
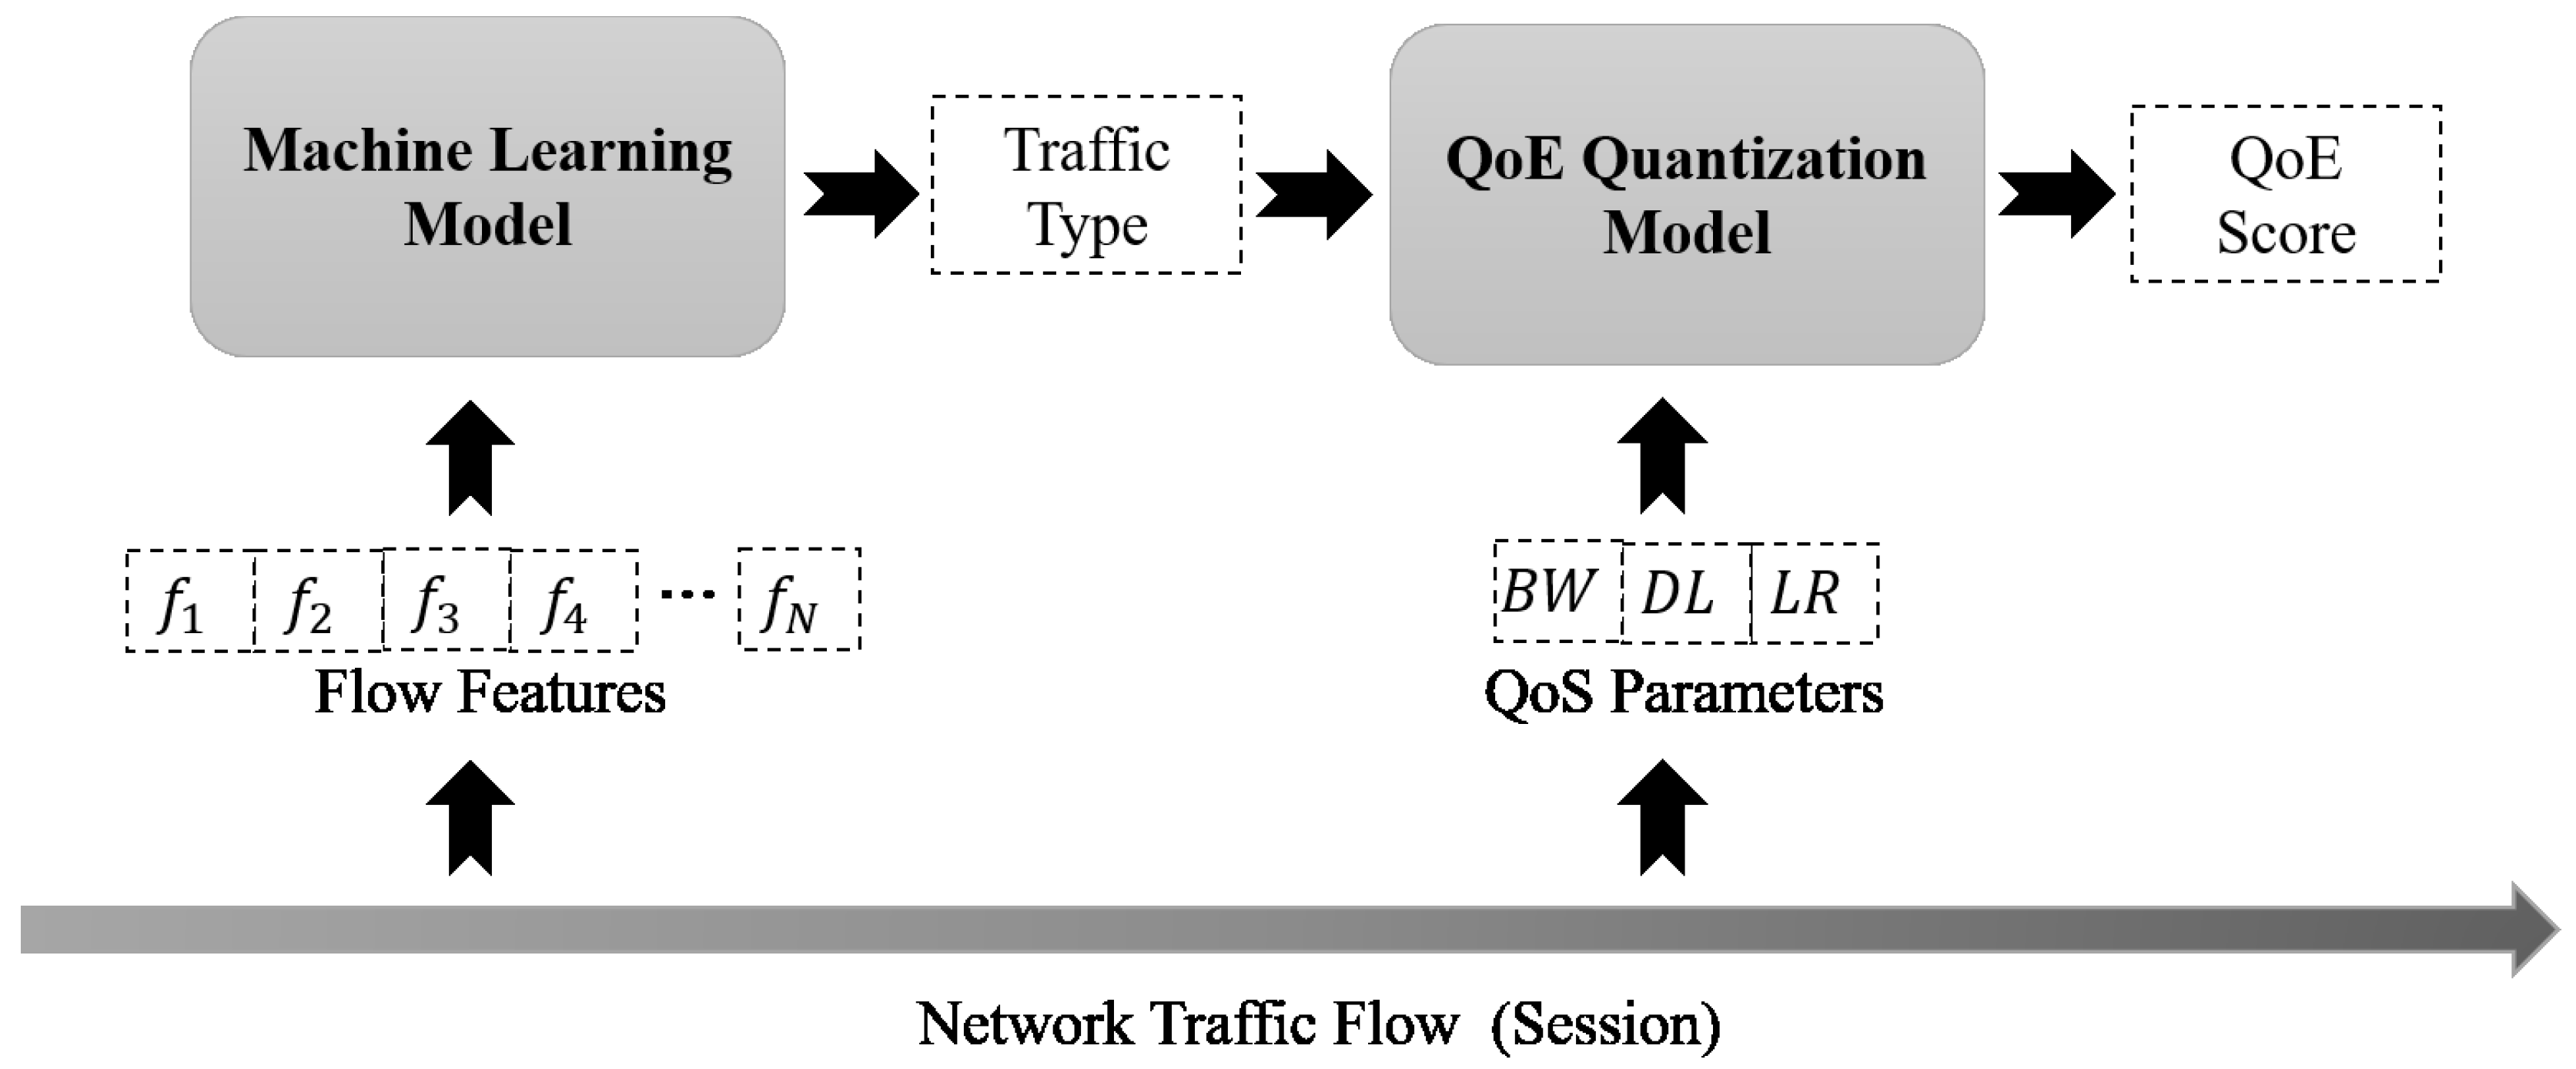
The proposed method of QoE score measurement, presented in
Figure 1, can be divided into three main steps, namely, flow features and QoS metrics extraction, flow traffic classification, and QoE quantization. The features are selected to describe the flow behavior and feed into the “Machine Learning Model” for traffic type classification, QoS metrics (such as time delay, loss rate, and throughput rate) are used in the “QoE Quantization Model” to calculate the QoE score for a network flow with the traffic type identified.
3.1. Flow Features and QoS Metrics Extraction
The network flow features, as shown in
Table 2, are extracted as the input of machine learning model, and further labeled to train or validate the model, which can be summarized as the following steps.
- (1)
Connect users’ terminal devices (smart phones and tablets) to the wireless network server; here, we use the Wi-Fi hotspot.
- (2)
Run the first target APP (application) on the users’ terminal devices, and start to capture the network packet data.
- (3)
After a period, e.g., 3 min, restore the captured packet data of the first kind of APP, let users stop running the current APP and open another, collect packet data of the next APP, and repeat such process on each APP one by one until the packet data collection and storage are completed.
- (4)
Extract the data features of each kind of APP from its captured data flow.
- (5)
Combine the features data of each APP together, as a feature dataset, and divide it into two sub-datasets: training dataset and test dataset.
- (6)
Label the training dataset.
- (7)
Train the machine learning model with training dataset, and then verify its accuracy with test dataset.
3.2. QoE Quantization Model
Here, we capture ground truth of
data to estimate the coefficients of the QoE quantization model (such as Equations (
5) and (
7)) of different services, which can be described as a QoE model estimation experiment taking the following steps.
- (1)
Connect user terminal devices to the wireless network (the Wi-Fi hotspot).
- (2)
Generate ~90–100 different network environments by varying network parameters (, , and ) at the Wi-Fi server terminal, where , , and denote the packet delay, loss rate, and flow throughput rate, respectively.
- (3)
Collect the QoS data and its corresponding MOS score under different environment, which will then be used as the training/test data and labels.
- (4)
Also, here, we need to divide the QoS data into training subset and test dataset without overlap, so the test dataset can help to check and improve model accuracy.
- (5)
Label the QoS training dataset and estimate the coefficients through machine learning algorithm.
- (6)
Test model accuracy and update the coefficients into a certain extent that meet the practical demand.
To solve the drawback that mentioned in
Section 2.2 of the linear mapping function
, we consider the relations between QoS and network parameters separately.
For the network packet delay,
,
For the packet loss rate,
,
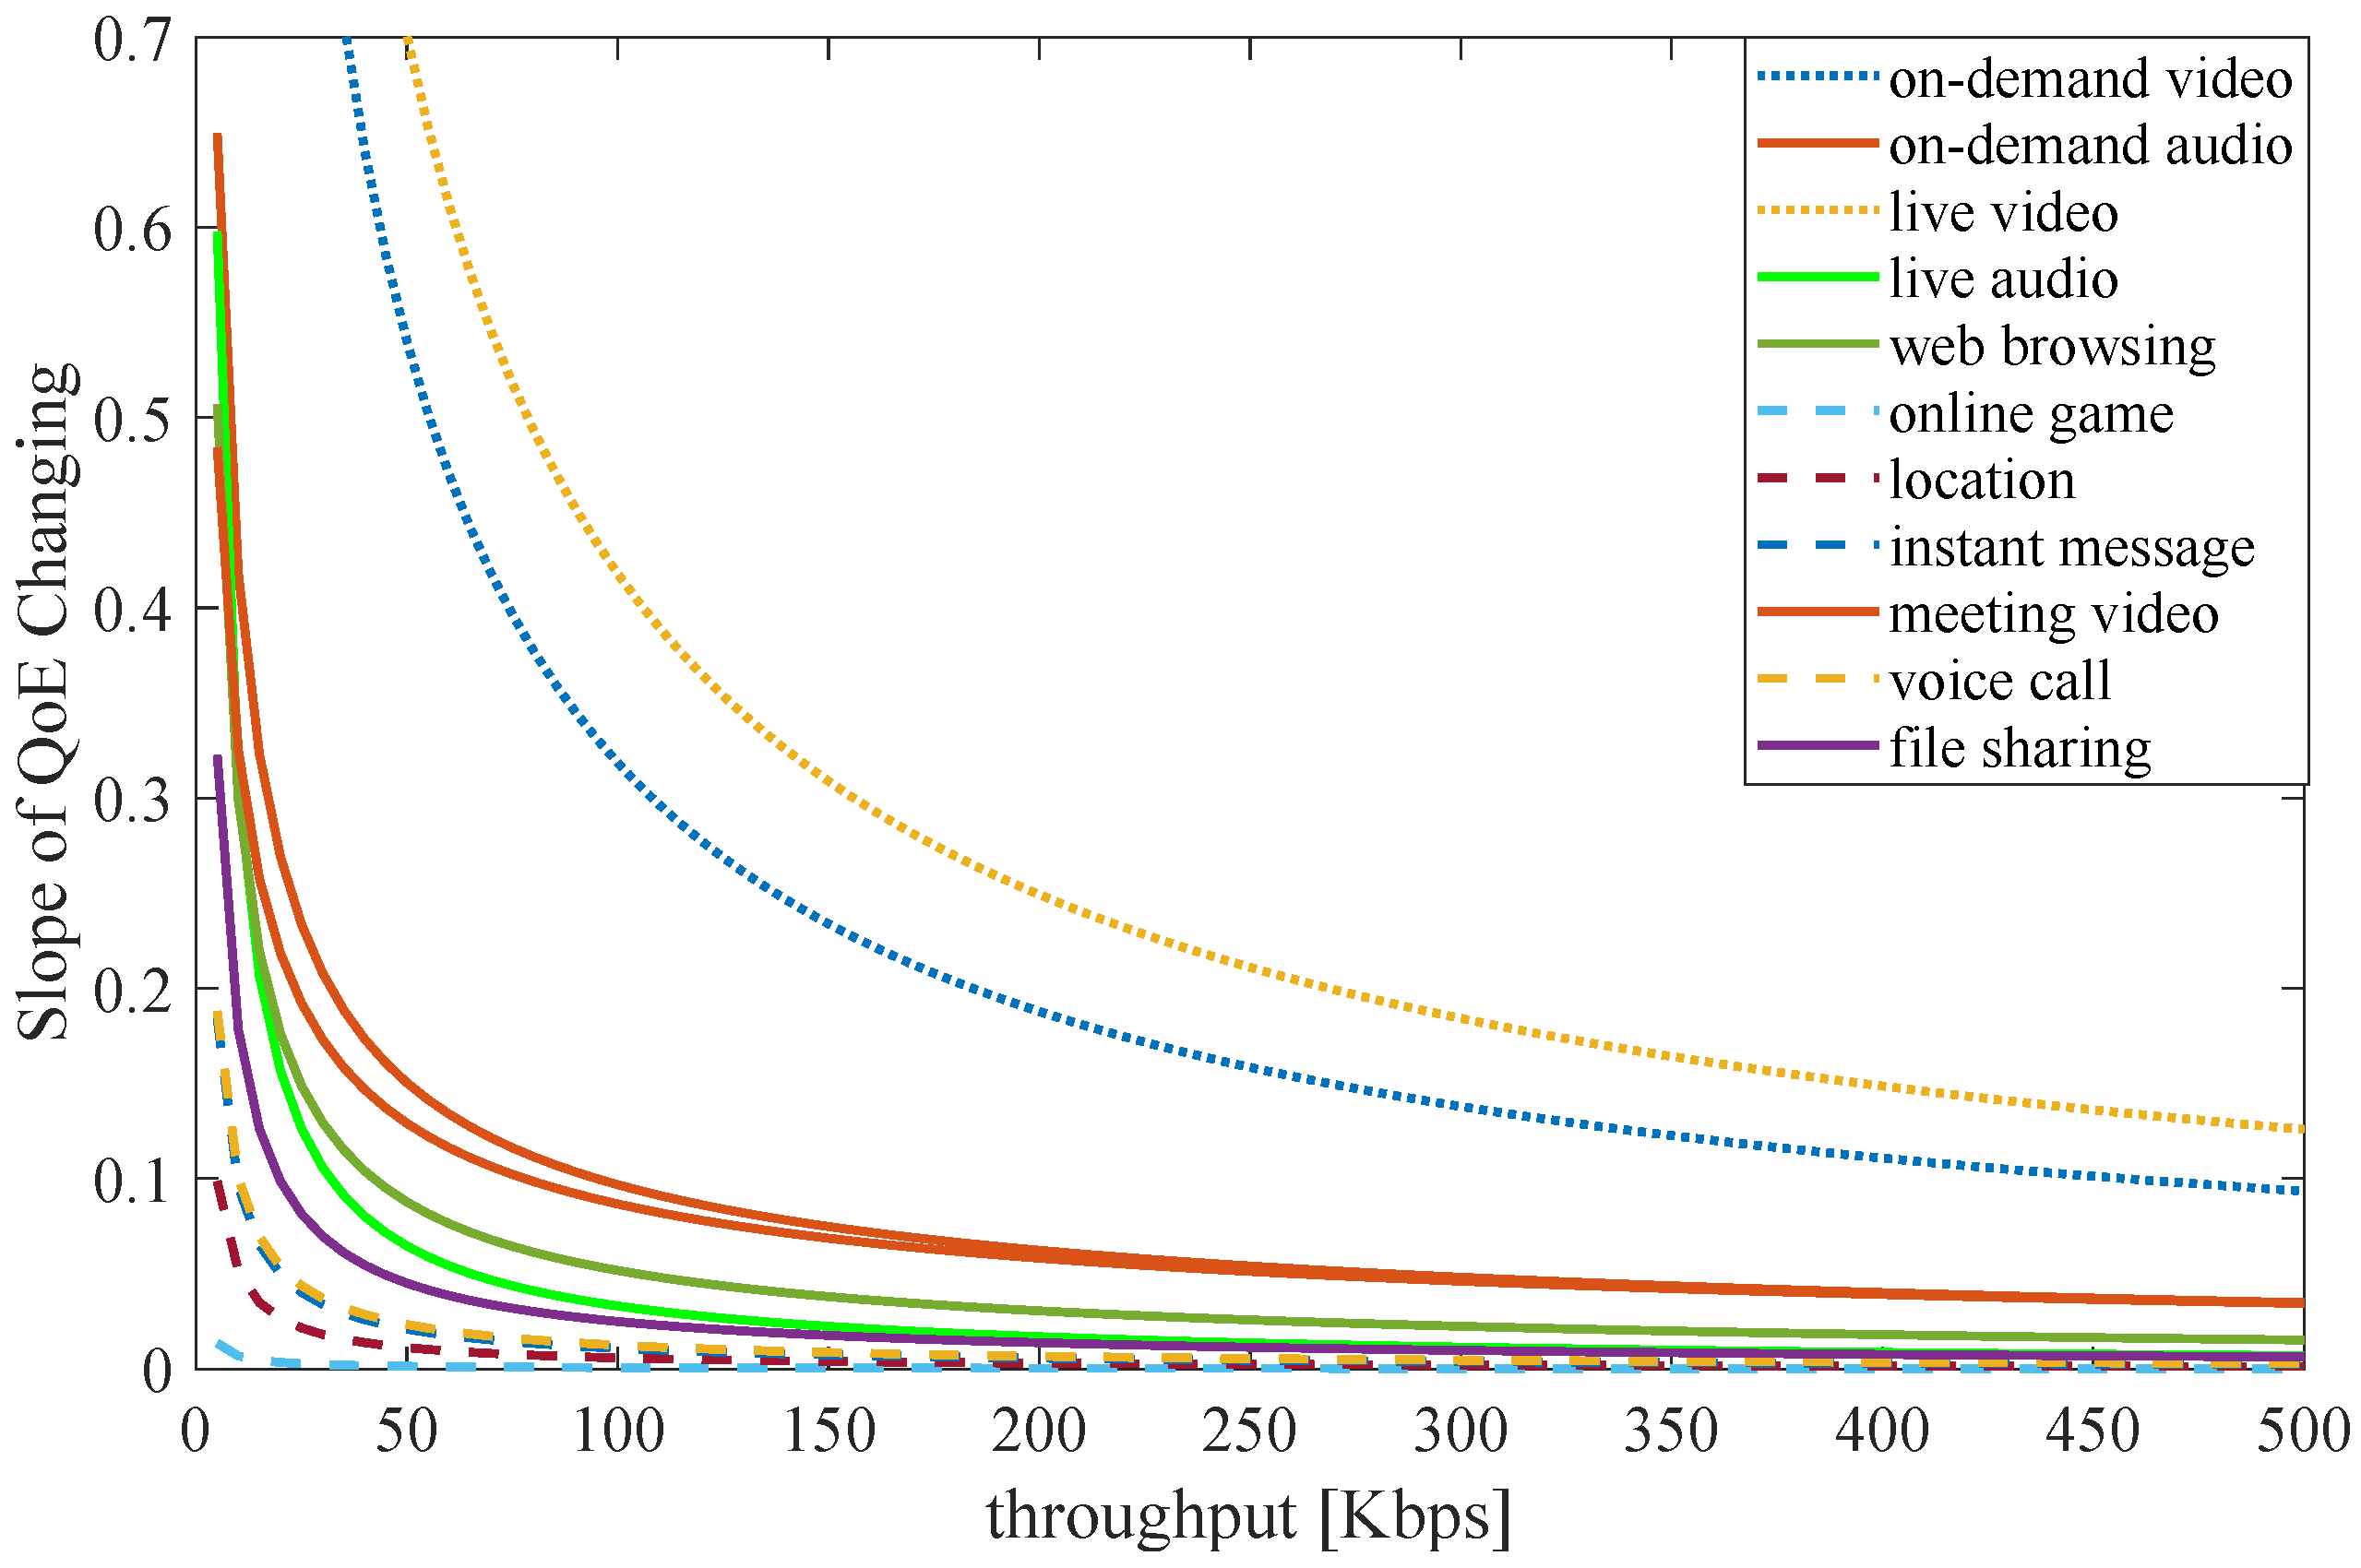
And for the flow throughput rate,
,
After merging and combining the three influencing factors, we get the QoS expression as follows,
where
, and
denote the transmission delay, packet loss rate, and data throughput rate, respectively.
and the parameters
need to be determined latter for different types of network services. Markus et al. [
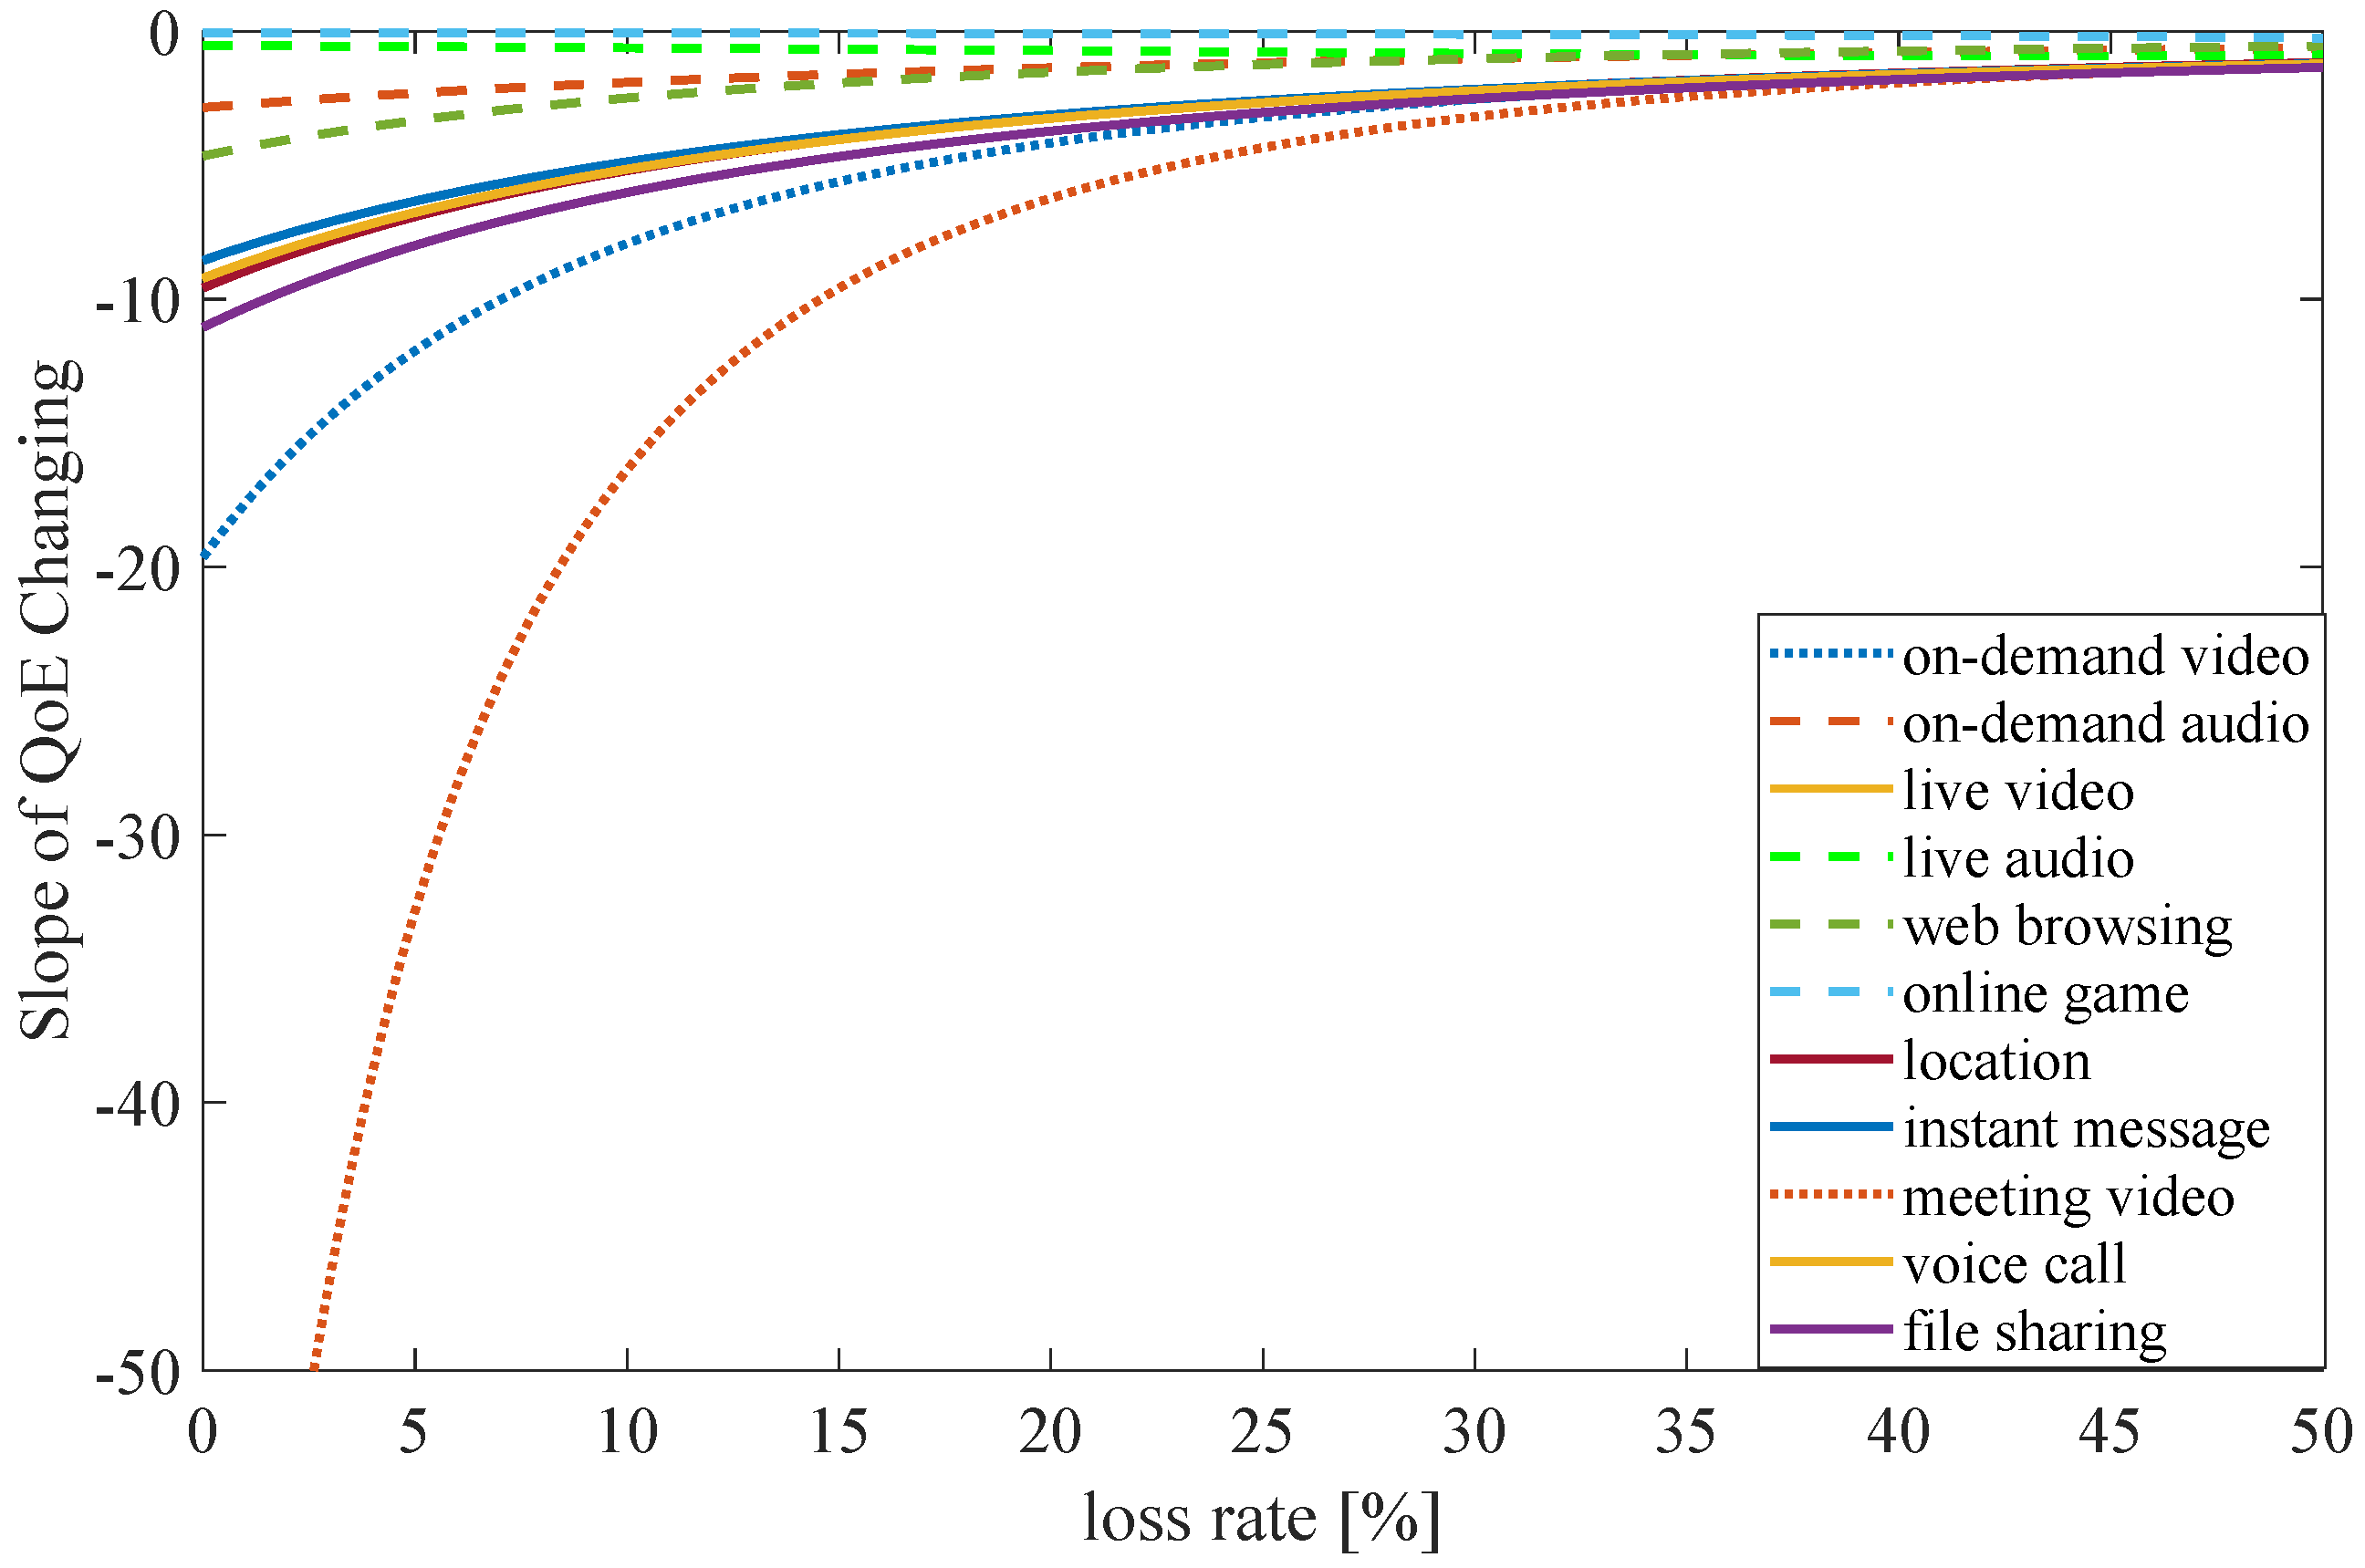
27] has demonstrated that when the current QoE value is high, a tiny perturbation in QoS can cause a significant fluctuation, whereas when the current QoE value is low, even a significant change pales; the relation can be described with a formula as follows,
The solution of the above differential formula is
where
is the rounding function,
also varies in different types of network traffic, i.e., on-demand video, on-demand audio, live video, live audio, etc. Using Equations (
5) and (
7), we establish the mathematical formulations between the values of QoE and QoS metrics (
).
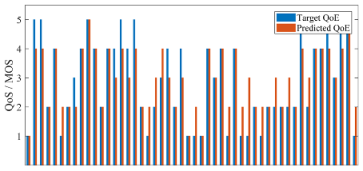
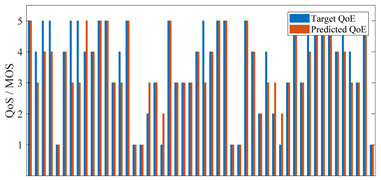
3.3. Determining the Model Parameters
To describe the QoE with mathematical formulas, function fitting methods, such as the least square method and nonuniform rational basis spline (NURBS) fitting method, are usually used to determine the hyperparameter in the formulas. These function fitting methods work well on continuous-value data sets. However, it should be noted that MOS-based QoE scores are discrete integer values in the range of 1 to 5, directly applying these conventional fitting methods on QoE task may cause high computation error. To solve this issue, in this paper, we propose an adaptive hyperparameter calculation algorithm inspired by artificial neural network training method.
Let be the dataset with N samples consists of the network QoS metrics and its labeled QoE score , .
According to (
7), we define continuous-value variable
where
denotes the upper rounding and down rounding function of
S. With
, we can calculate the corresponding values of
and
.
Then, define the predicted output vector , where , , and the rest of the elements of O are set as 0. Further, define the target output vector where and the other elements of T are also set as 0. To set an example, for predicted output , and its target output , we have , then the predicted output vector and the target output vector .
Define the output error using cross entropy and L2 regularization error:
where
is the regularization factor and
denotes the set of all the hyperparameters.
Calculating the gradient of
to model hyperparameters, we have
Let
, similarly, we can derive
With Equations (
10) and (
11), we can calculate the gradient of each hyperparameter reflecting to the QoE score fitting error, the hyperparameter determination algorithm is abstracted by the pseudocode presented in Algorithm 1, where parameters
, and
are set to 16, 100, and 0.01 in our implementation, respectively.
| Algorithm 1: Model Parameter Determination Algorithm. |
![Applsci 09 04107 i012]() |


