Ankle Joint Dynamic Stiffness in Long-Distance Runners: Effect of Foot Strike and Shoes Features
Abstract
1. Introduction
2. Materials and Methods
2.1. Participants
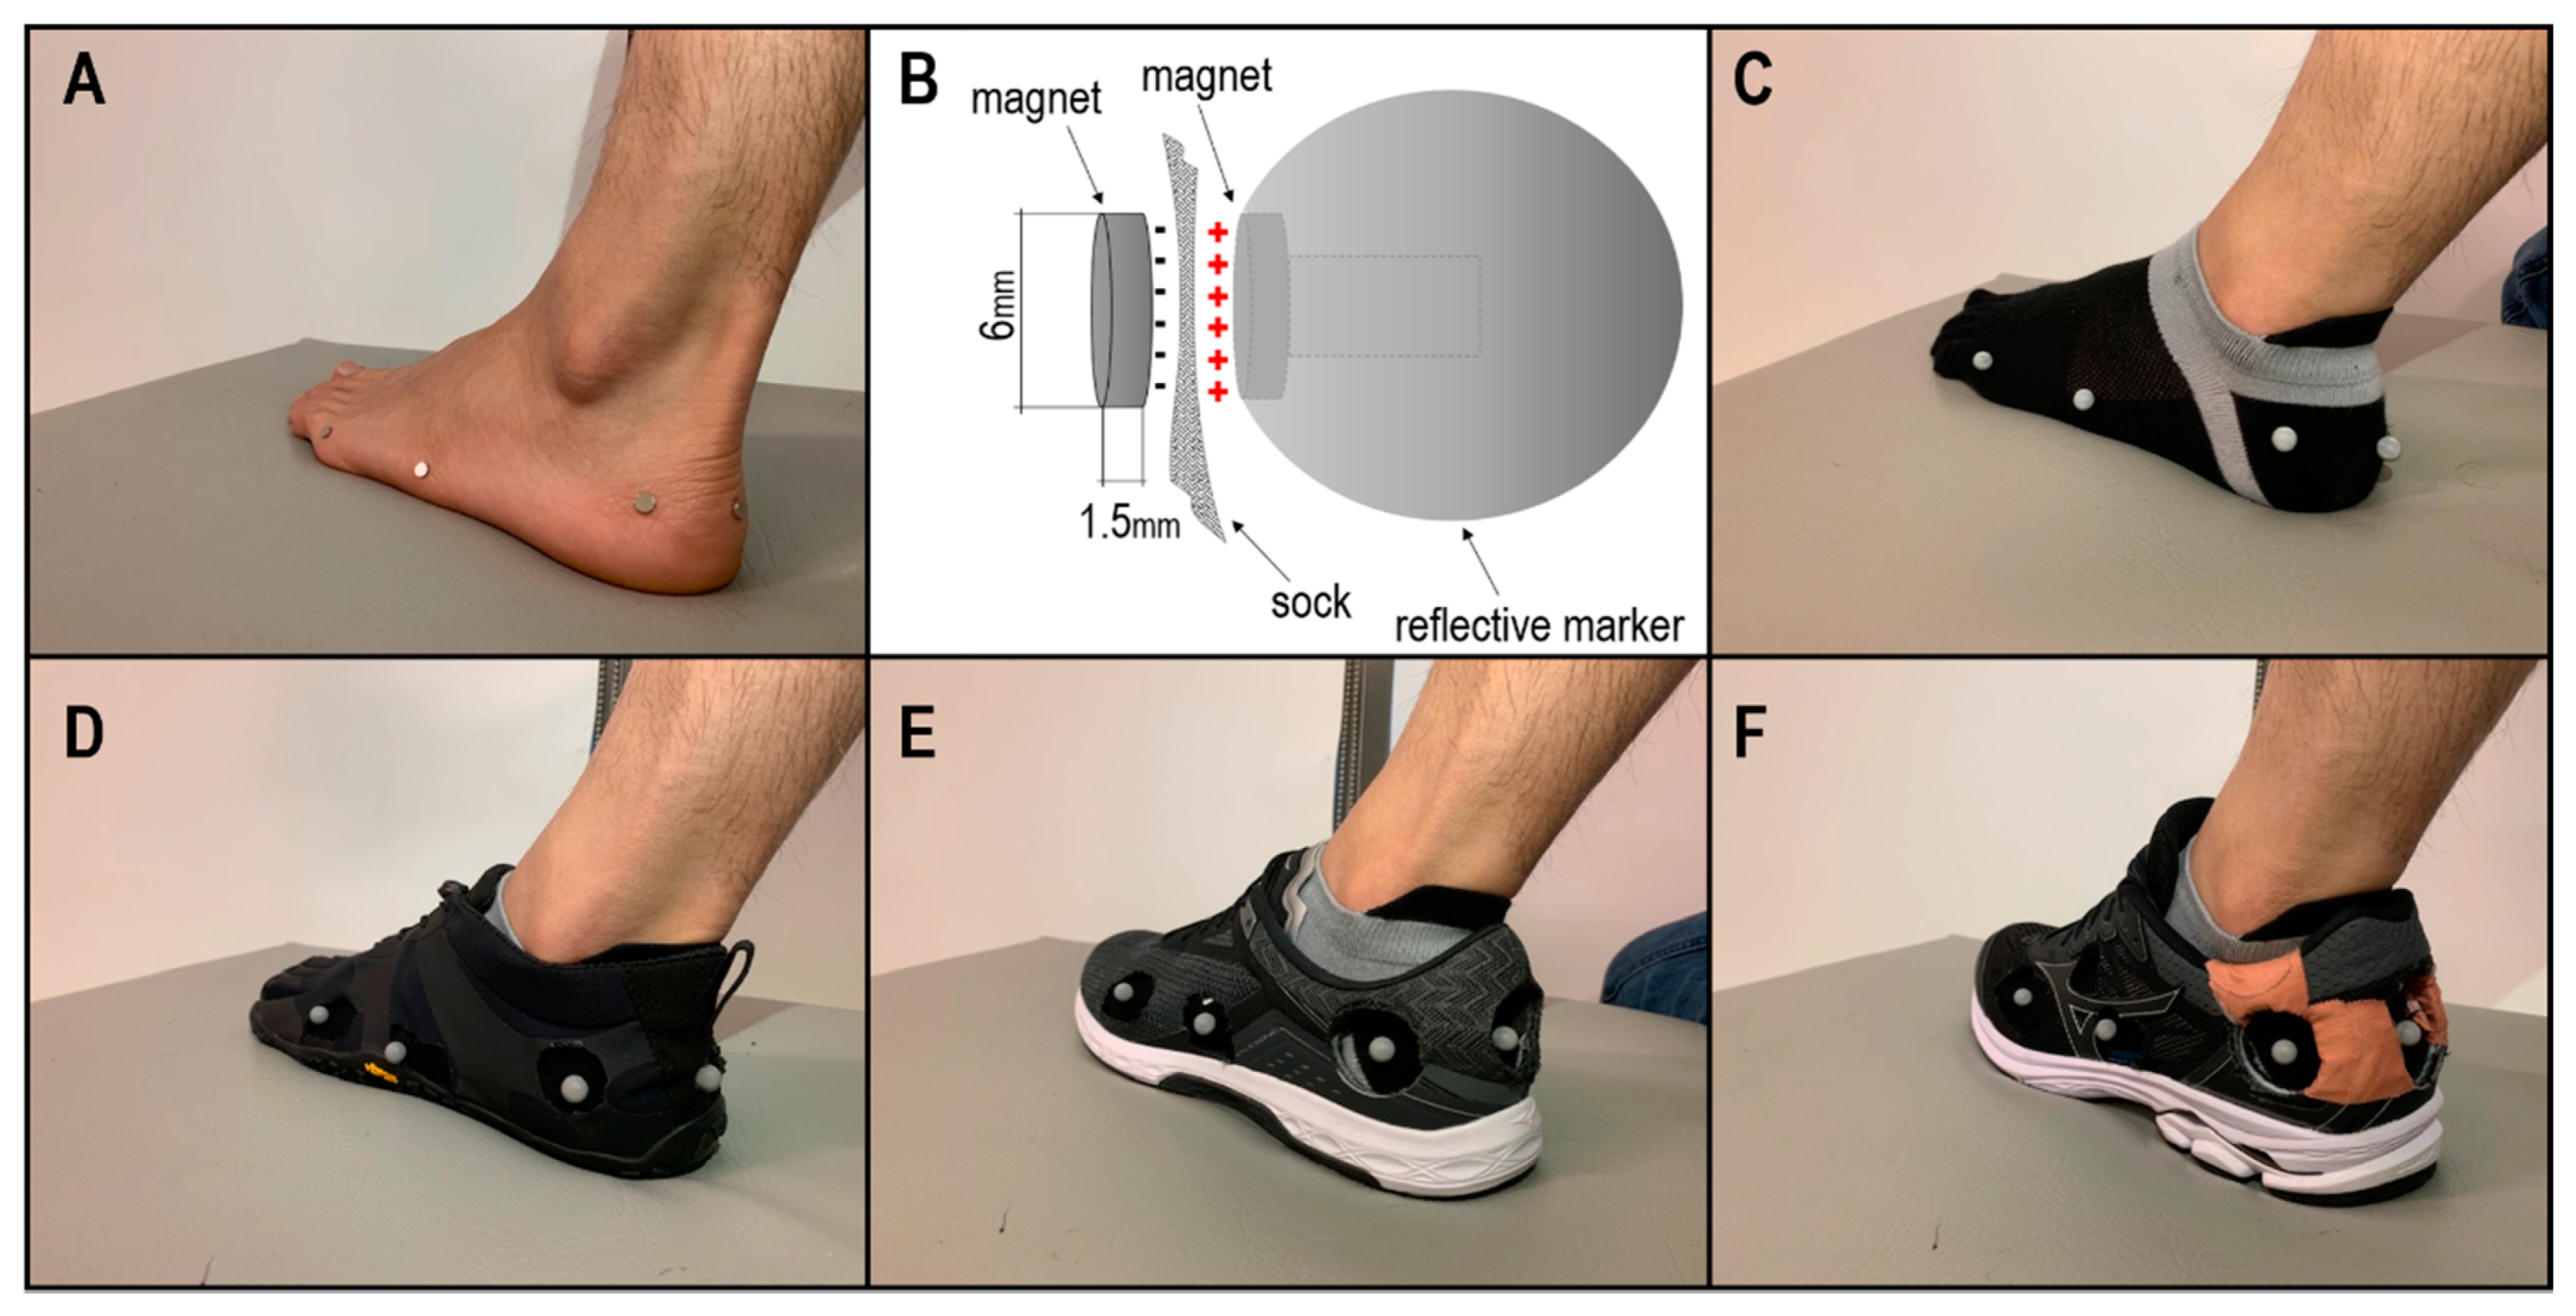
2.2. Experimental Protocol
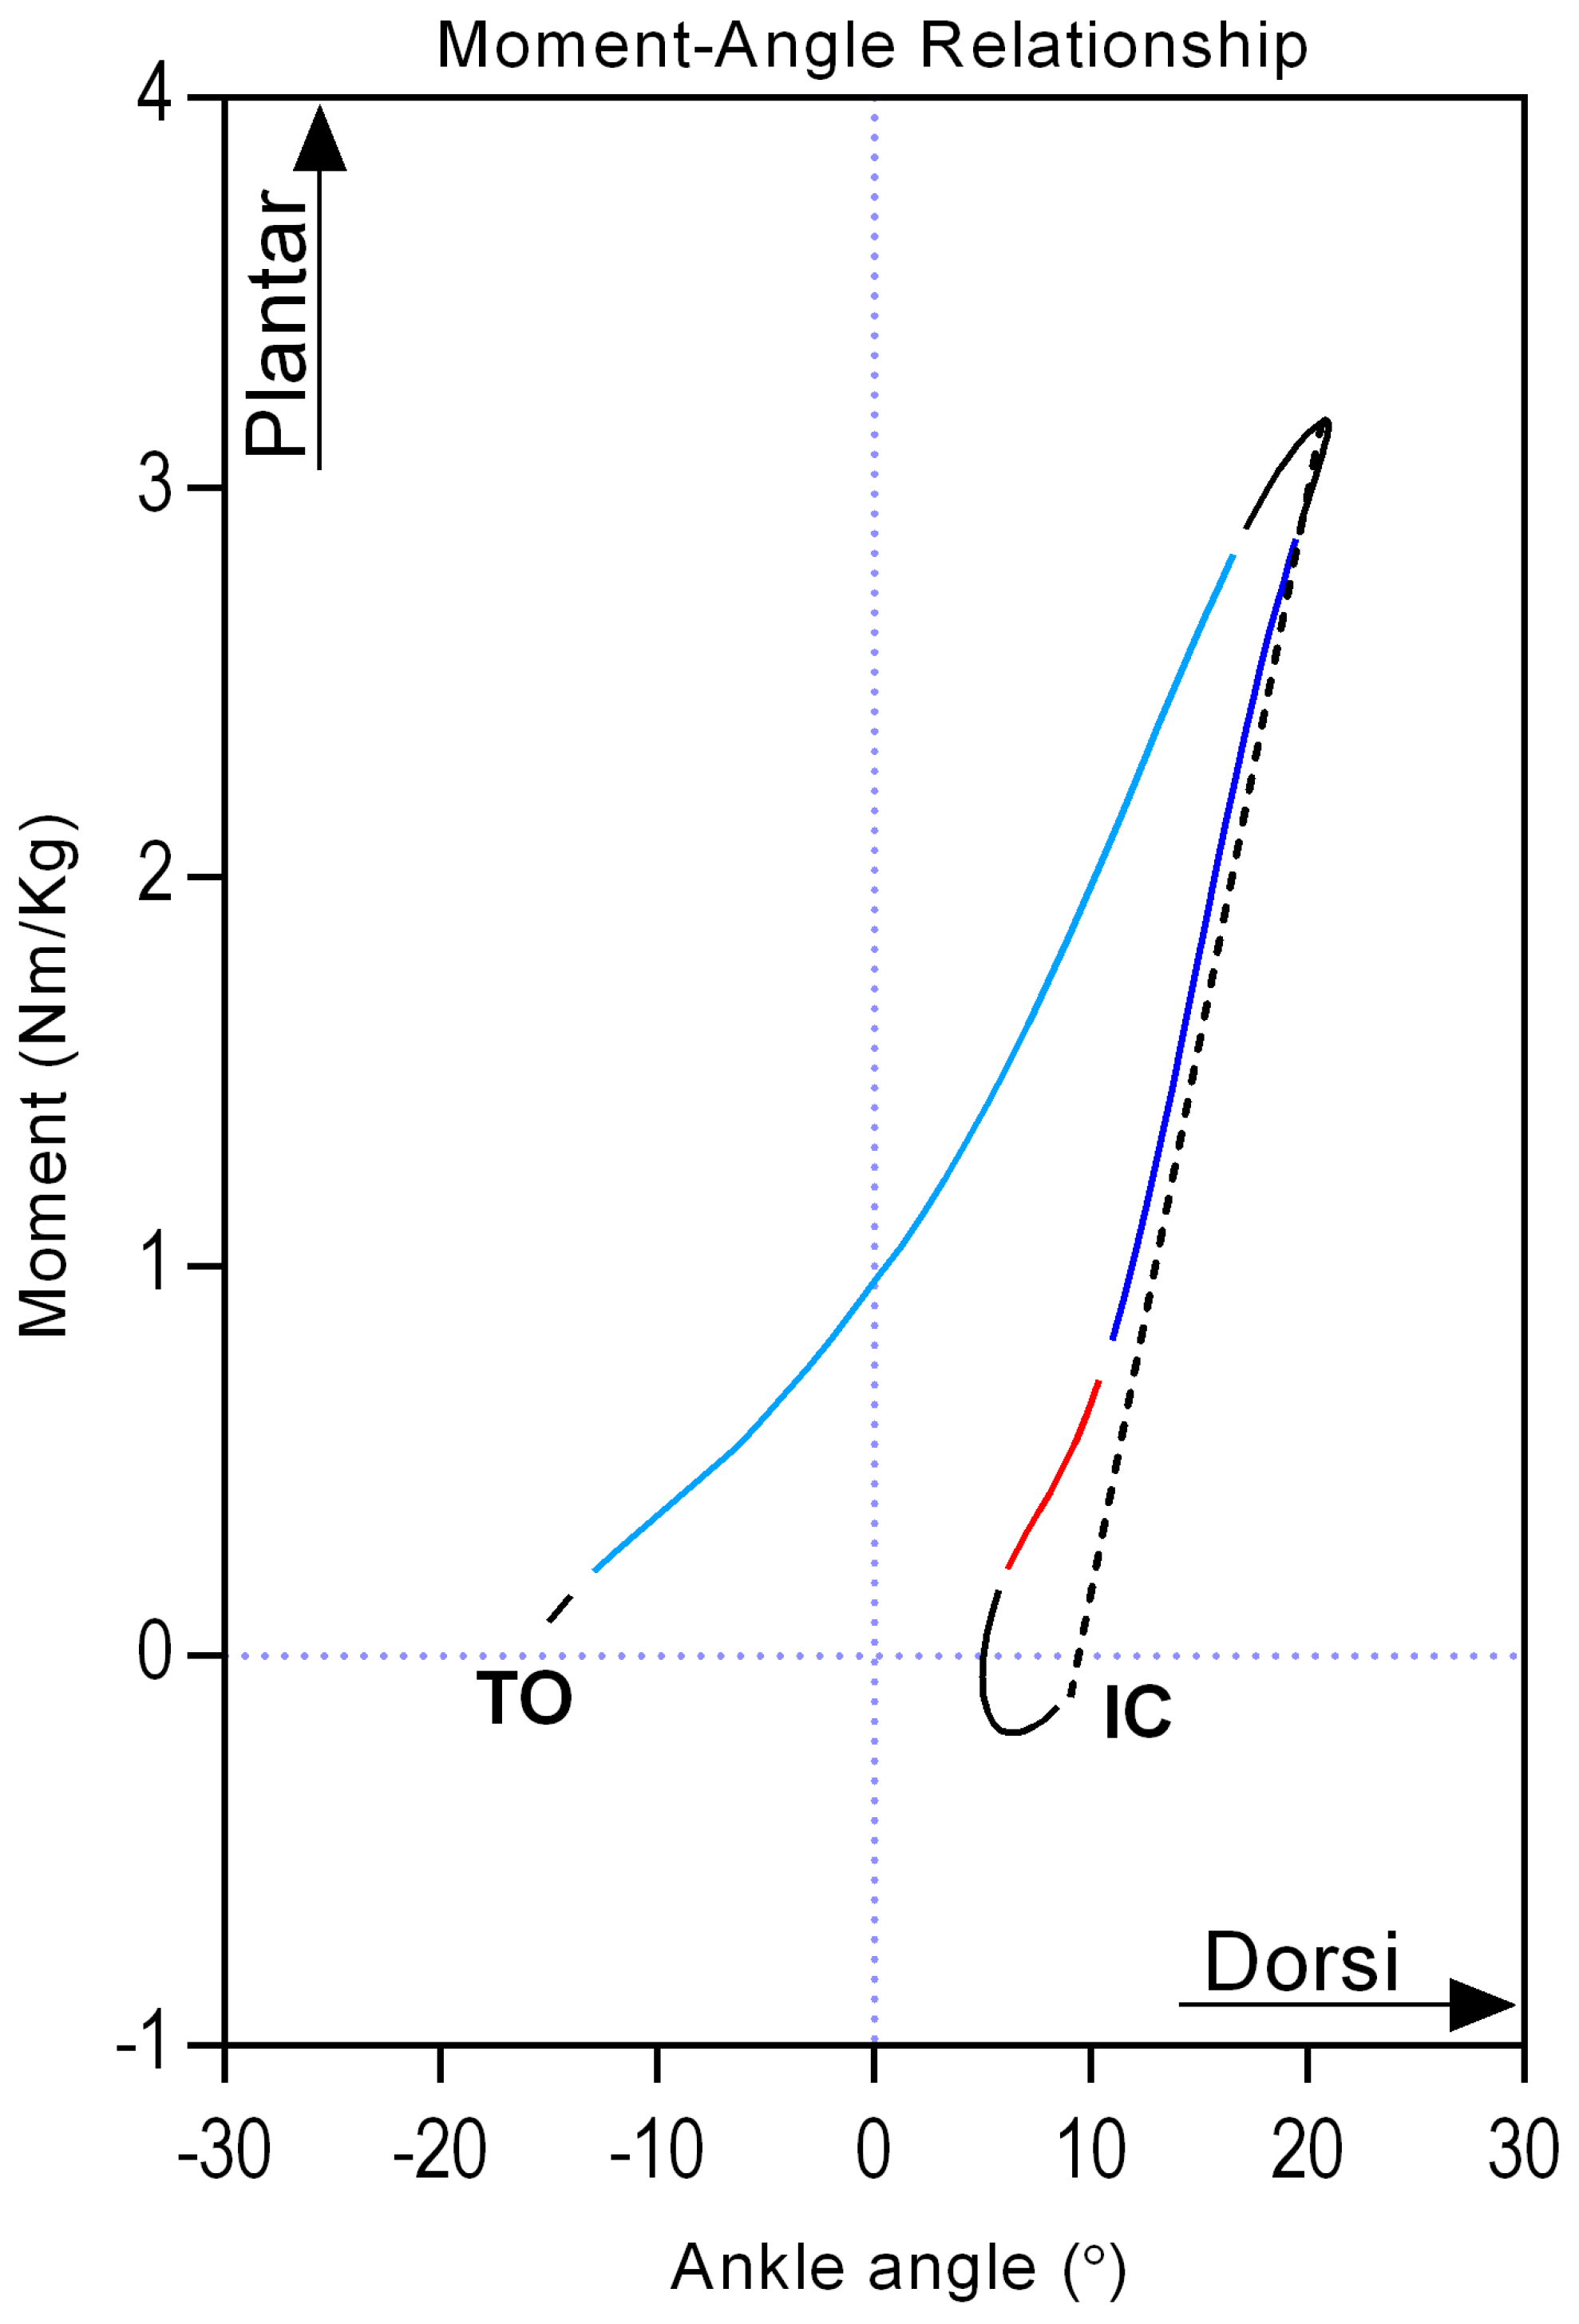
2.3. Data Analysis
2.4. Statistical Analysis
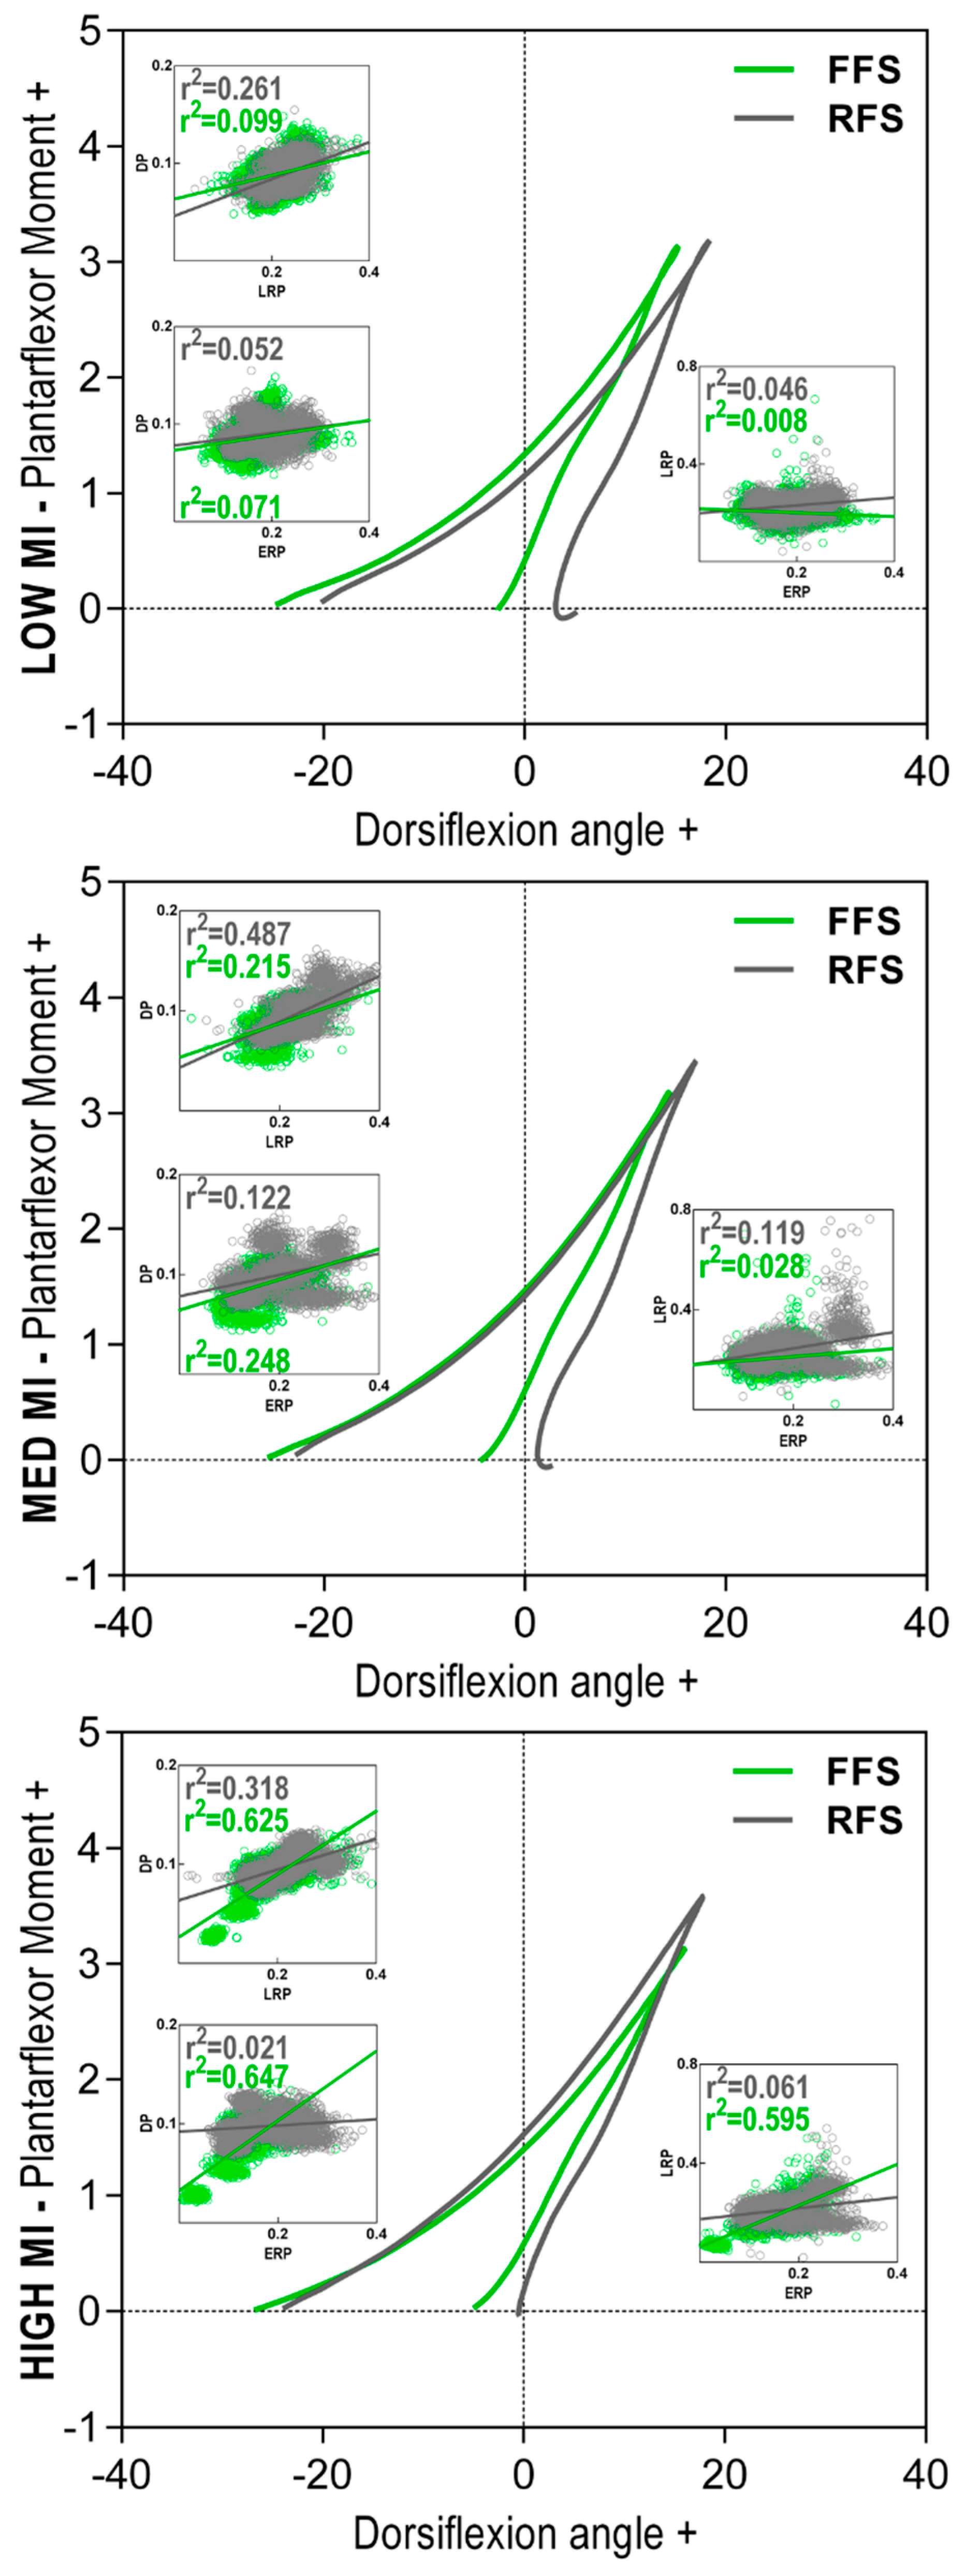
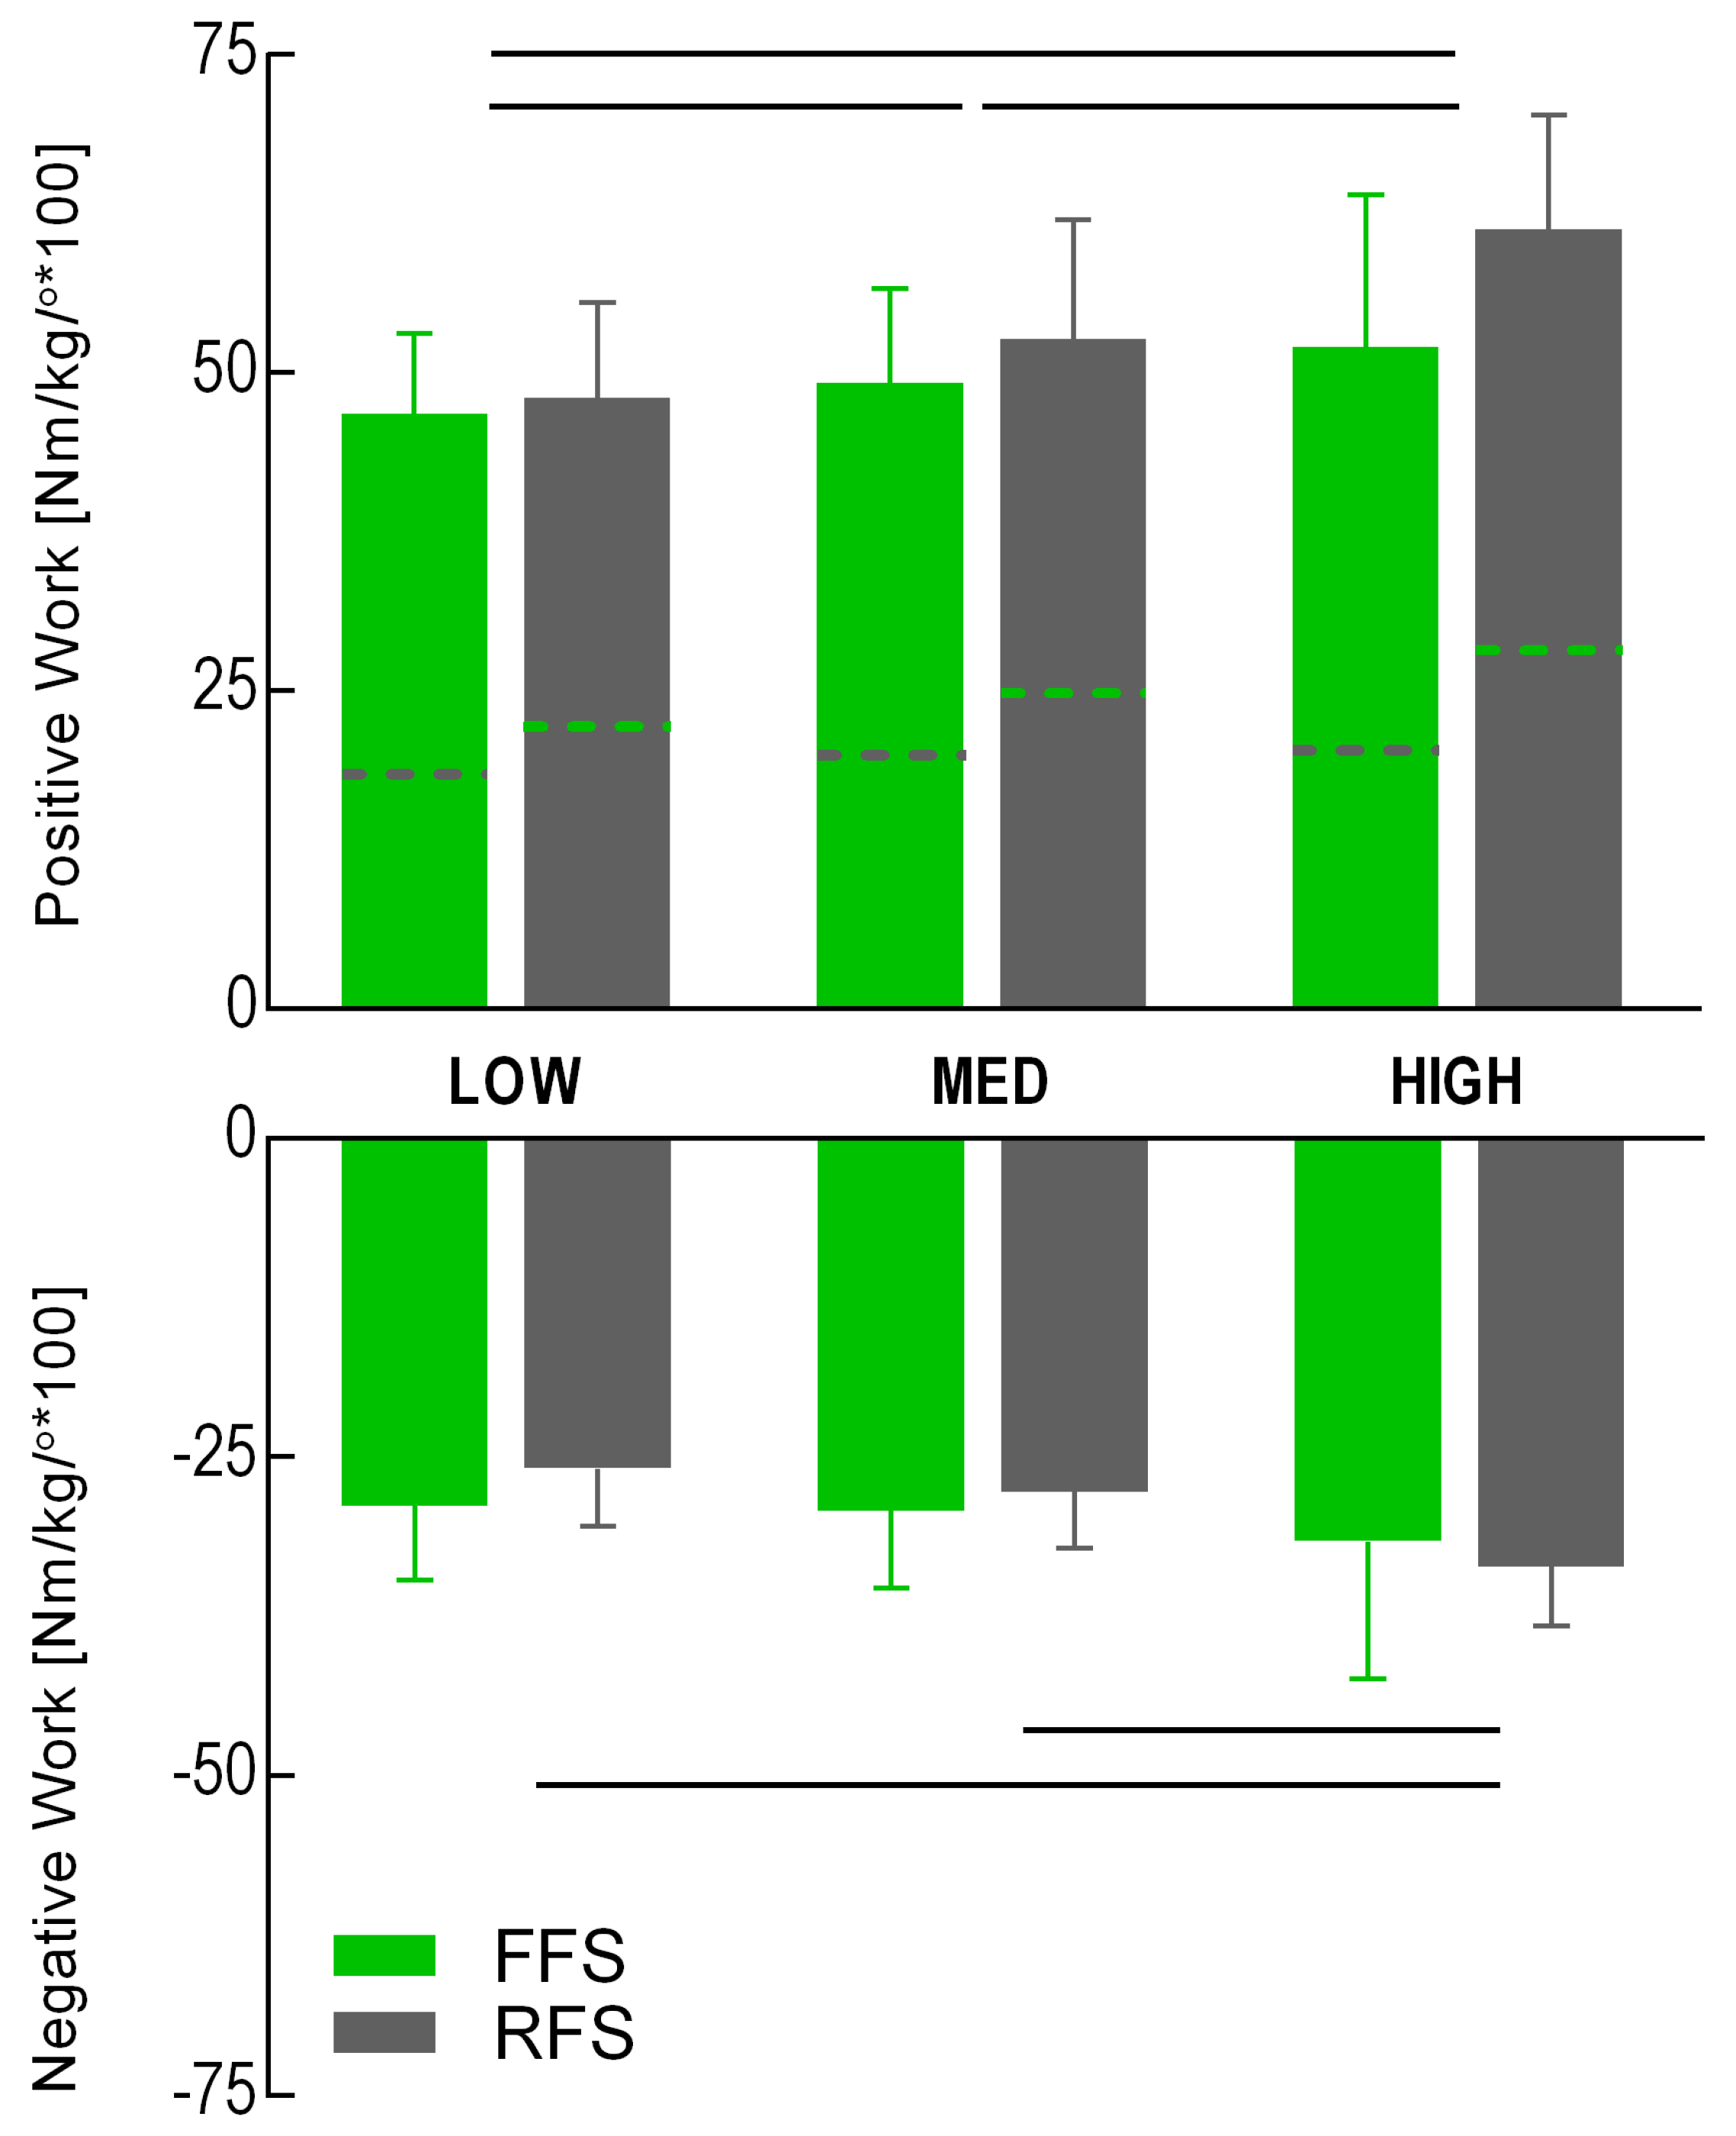
3. Results
4. Discussion
Limitations
5. Conclusions
Supplementary Materials
Author Contributions
Funding
Acknowledgments
Conflicts of Interest
Appendix A
Biomechanical Model

References
- Bramble, D.M.; Lieberman, D.E. Endurance running and the evolution of Homo. Nature 2004, 432, 345–352. [Google Scholar] [CrossRef] [PubMed]
- Davis, I.S.; Rice, H.M.; Wearing, S.C. Why forefoot striking in minimal shoes might positively change the course of running injuries. J. Sport Health Sci. 2017, 6, 154–161. [Google Scholar] [CrossRef] [PubMed]
- Hamill, J.; Gruber, A.H. Is changing footstrike pattern beneficial to runners? J. Sport Health Sci. 2017, 6, 146–153. [Google Scholar] [CrossRef] [PubMed]
- Larson, P.; Higgins, E.; Kaminski, J.; Decker, T.; Preble, J.; Lyons, D.; McIntyre, K.; Normile, A. Foot strike patterns of recreational and sub-elite runners in a long-distance road race. J. Sport Health Sci. 2011, 29, 1665–1673. [Google Scholar] [CrossRef] [PubMed]
- Hamill, J.; Gruber, A.H.; Derrick, T.R. Lower extremity joint stiffness characteristics during running with different footfall patterns. Eur. J. Sport Sci. 2014, 14, 130–136. [Google Scholar] [CrossRef] [PubMed]
- Garofolini, A.; Taylor, S.; Mclaughlin, P.; Vaughan, B.; Wittich, E. Acute adaptability to barefoot running among professional AFL players. Footwear Sci. 2017, 9, S44–S45. [Google Scholar] [CrossRef]
- Lacquaniti, F.; Ivanenko, Y.P.; Zago, M. Patterned control of human locomotion. J. Physiol. 2012, 590, 2189–2199. [Google Scholar] [CrossRef]
- Todorov, E.; Jordan, M.I. Optimal feedback control as a theory of motor coordination. Nat. Neurosci. 2002, 5, 1226–1235. [Google Scholar] [CrossRef] [PubMed]
- Jin, L.; Hahn, M.E. Modulation of lower extremity joint stiffness, work and power at different walking and running speeds. Hum. Mov. Sci. 2018, 58, 1–9. [Google Scholar] [CrossRef] [PubMed]
- Schache, A.G.; Brown, N.A.T.; Pandy, M.G. Modulation of work and power by the human lower-limb joints with increasing steady-state locomotion speed. J. Exp. Biol. 2015, 218, 2472–2481. [Google Scholar] [CrossRef]
- Günther, M.; Blickhan, R. Joint stiffness of the ankle and the knee in running. J. Biomech. 2002, 35, 1459–1474. [Google Scholar] [CrossRef]
- Crenna, P.; Frigo, C. Dynamics of the ankle joint analyzed through moment–angle loops during human walking: Gender and age effects. Hum. Mov. Sci. 2011, 30, 1185–1198. [Google Scholar] [CrossRef] [PubMed]
- Gabriel, R.C.; Abrantes, J.; Granata, K.; Bulas-Cruz, J.; Melo-Pinto, P.; Filipe, V. Dynamic joint stiffness of the ankle during walking: Gender-related differences. Phys. Ther. Sport 2008, 9, 16–24. [Google Scholar] [CrossRef] [PubMed]
- Latash, M.L.; Zatsiorsky, V.M. Joint stiffness: Myth or reality? Hum. Mov. Sci. 1993, 12, 653–692. [Google Scholar] [CrossRef]
- Stefanyshyn, D.J.; Nigg, B.M. Dynamic angular stiffness of the ankle joint during running and sprinting. J. Appl. Biomech. 1998, 14, 292–299. [Google Scholar] [CrossRef] [PubMed]
- Feldman, A. Superposition of motor programs—I. Rhythmic forearm movements in man. Neuroscience 1980, 5, 81–90. [Google Scholar] [CrossRef]
- Guissard, N.; Duchateau, J. Neural Aspects of Muscle Stretching. Exerc. Sport Sci. Rev. 2006, 34, 154–158. [Google Scholar] [CrossRef]
- Duchateau, J.; Enoka, R.M. Neural control of lengthening contractions. J. Exp. Biol. 2016, 219, 197–204. [Google Scholar] [CrossRef]
- Cronin, N.J.; Finni, T. Treadmill versus overground and barefoot versus shod comparisons of triceps surae fascicle behaviour in human walking and running. Gait Posture 2013, 38, 528–533. [Google Scholar] [CrossRef]
- Lichtwark, G.A.; Cresswell, A.G.; Newsham-West, R.J. Effects of running on human Achilles tendon length–tension properties in the free and gastrocnemius components. J. Exp. Biol. 2013, 216, 4388–4394. [Google Scholar] [CrossRef]
- Lieberman, D.E. Strike type variation among Tarahumara Indians in minimal sandals versus conventional running shoes. J. Sport Health Sci. 2014, 3, 86–94. [Google Scholar] [CrossRef]
- Kubo, K.; Miyazaki, D.; Ikebukuro, T.; Yata, H.; Okada, M.; Tsunoda, N. Active muscle and tendon stiffness of plantar flexors in sprinters. J. Sports Sci. 2017, 35, 742–748. [Google Scholar] [CrossRef] [PubMed]
- Lichtwark, G.; Bougoulias, K.; Wilson, A. Muscle fascicle and series elastic element length changes along the length of the human gastrocnemius during walking and running. J. Biomech. 2007, 40, 157–164. [Google Scholar] [CrossRef] [PubMed]
- Latash, M.L. The bliss (not the problem) of motor abundance (not redundancy). Exp. Brain Res. 2012, 217, 1–5. [Google Scholar] [CrossRef] [PubMed]
- Garofolini, A.; Taylor, S.; Mclaughlin, P.; Vaughan, B.; Wittich, E. Foot strike classification: A comparison of methodologies. Footwear Sci. 2017, 9, S129–S130. [Google Scholar] [CrossRef]
- Sinclair, J.; Atkins, S.; Taylor, P.J. The Effects of Barefoot and Shod Running on Limb and Joint Stiffness Characteristics in Recreational Runners. J. Mot. Behav. 2016, 48, 79–85. [Google Scholar] [CrossRef]
- Kuitunen, S.; Komi, P.V.; Kyröläinen, H. Knee and ankle joint stiffness in sprint running. Med. Sci. Sports Exerc. 2002, 34, 166–173. [Google Scholar] [CrossRef] [PubMed]
- Powell, D.W.; Williams, D.S., 3rd; Windsor, B.; Butler, R.J.; Zhang, S. Ankle work and dynamic joint stiffness in high-compared to low-arched athletes during a barefoot running task. Hum. Mov. Sci. 2014, 34, 147–156. [Google Scholar] [CrossRef]
- Roberts, T.J. Contribution of elastic tissues to the mechanics and energetics of muscle function during movement. J. Exp. Biol. 2016, 219, 266–275. [Google Scholar] [CrossRef]
- Jordan, K.; Challis, J.H.; Newell, K.M. Speed influences on the scaling behavior of gait cycle fluctuations during treadmill running. Hum. Mov. Sci. 2007, 26, 87–102. [Google Scholar] [CrossRef]
- Garofolini, A.; Taylor, S.; Lepine, J. Evaluating dynamic error of a treadmill and the effect on measured kinetic gait parameters: Implications and possible solutions. J. Biomech. 2019, 82, 156–163. [Google Scholar] [CrossRef] [PubMed]
- Esculier, J.-F.; Dubois, B.; Dionne, C.E.; Leblond, J.; Roy, J.-S. A consensus definition and rating scale for minimalist shoes. J. Foot Ankle Res. 2015, 8, 1–9. [Google Scholar] [CrossRef] [PubMed]
- Apps, C.; Sterzing, T.; O’Brien, T.; Lake, M. Lower limb joint stiffness and muscle co-contraction adaptations to instability footwear during locomotion. J. Electromyogr. Kinesiol. 2016, 31, 55–62. [Google Scholar] [CrossRef] [PubMed]
- Baltich, J.; Maurer, C.; Nigg, B.M. Increased vertical impact forces and altered running mechanics with softer midsole shoes. PLoS ONE 2015, 10, e0125196. [Google Scholar] [CrossRef] [PubMed]
- Riemann, B.L.; Myers, J.B.; Lephart, S.M. Sensorimotor system measurement techniques. J. Athl. Train. 2002, 37, 85–98. [Google Scholar] [PubMed]
- Lorimer, A.V.; Hume, P.A. Stiffness as a Risk Factor for Achilles Tendon Injury in Running Athletes. Sports Med. 2016, 46, 1921–1938. [Google Scholar] [CrossRef]
- Lai, A.; Schache, A.G.; Brown, N.A.; Pandy, M.G. Human ankle plantar flexor muscle–tendon mechanics and energetics during maximum acceleration sprinting. J. R. Soc. Interface 2016, 13, 20160391. [Google Scholar] [CrossRef]
- Hof, A.; van Zandwijk, J.; Bobbert, M. Mechanics of human triceps surae muscle in walking, running and jumping. Acta Physiol. Scand. 2002, 174, 17–30. [Google Scholar] [CrossRef]
- Biewener, A.A.; Roberts, T.J. Muscle and tendon contributions to force, work, and elastic energy savings: A comparative perspective. Exerc. Sport Sci. Rev. 2000, 28, 99–107. [Google Scholar]
- Hasegawa, H.; Yamauchi, T.; Kraemer, W.J. Foot strike patterns of runners at the 15-km point during an elite-level half marathon. J. Strength Cond. Res. 2007, 21, 888–893. [Google Scholar]
- Lieberman; Venkadesan, M.; Werbel, W.A.; Daoud, A.I.; D’Andrea, S.; Davis, I.S.; Mang’Eni, R.O.; Pitsiladis, Y. Foot strike patterns and collision forces in habitually barefoot versus shod runners. Nature 2010, 463, 531–535. [Google Scholar] [CrossRef] [PubMed]
- Perl, D.P.; Daoud, A.I.; Lieberman, D.E. Effects of footwear and strike type on running economy. Med. Sci. Sports Exerc. 2012, 44, 1335–1343. [Google Scholar] [CrossRef] [PubMed]
- Gruber, A.H.; Umberger, B.R.; Braun, B.; Hamill, J. Economy and rate of carbohydrate oxidation during running with rearfoot and forefoot strike patterns. J. Appl. Physiol. (1985) 2013, 115, 194–201. [Google Scholar] [CrossRef] [PubMed]
- Ogueta-Alday, A.; Rodríguez-Marroyo, J.A.; García-López, J. Rearfoot striking runners are more economical than midfoot strikers. Med. Sci. Sports Exerc. 2014, 46, 580–585. [Google Scholar] [CrossRef]
- Holt, N.C.; Roberts, T.J.; Askew, G.N. The energetic benefits of tendon springs in running: Is the reduction of muscle work important? J. Exp. Biol. 2014, 217, 4365–4371. [Google Scholar] [CrossRef] [PubMed]
- Gruber, A.; Umberger, B.R.; Miller, R.H.; Hamill, J.H. Muscle mechanics and energy expenditure of the triceps surae during rearfoot and forefoot running. bioRxiv 2018. [Google Scholar] [CrossRef]
- Yen, J.T.; Auyang, A.G.; Chang, Y.-H. Joint-level kinetic redundancy is exploited to control limb-level forces during human hopping. Exp. Brain Res. 2009, 196, 439–451. [Google Scholar] [CrossRef] [PubMed]
- Rapoport, S.; Mizrahi, J.; Kimmel, E.; Verbitsky, O.; Isakov, E. Constant and variable stiffness and damping of the leg joints in human hopping. J. Biomech. Eng. 2003, 125, 507–514. [Google Scholar] [CrossRef]
- Farris Dominic, J.; Brent, J.R. Modulation of leg joint function to produce emulated acceleration during walking and running in humans. R. Soc. Open Sci. 2017, 4, 160901. [Google Scholar] [CrossRef] [PubMed]
- Kelly, L.A.; Farris, D.J.; Lichtwark, G.A.; Cresswell, A.G. The Influence of Foot-Strike Technique on the Neuromechanical Function of the Foot. Med. Sci. Sports Exerc. 2018, 50, 98–108. [Google Scholar] [CrossRef]
- Riddick, R.; Farris, D.J.; Kelly, L.A. The foot is more than a spring: Human foot muscles perform work to adapt to the energetic requirements of locomotion. J. R. Soc. Interface 2019, 16, 20180680. [Google Scholar] [CrossRef] [PubMed]
- Ferris, D.P.; Louie, M.; Farley, C.T. Running in the real world: Adjusting leg stiffness for different surfaces. Proc. R. Soc. Lond. Ser. B Biol. Sci. 1998, 265, 989–994. [Google Scholar] [CrossRef] [PubMed]
- Cronin, N.J.; Carty, C.P.; Barrett, R.S. Triceps surae short latency stretch reflexes contribute to ankle stiffness regulation during human running. PLoS ONE 2011, 6, e23917. [Google Scholar] [CrossRef] [PubMed]
- Giuliani, J.; Masini, B.; Alitz, C.; Owens, B.D. Barefoot-simulating footwear associated with metatarsal stress injury in 2 runners. Orthopedics 2011, 34, e320–e323. [Google Scholar] [CrossRef] [PubMed]
- Daoud, A.I.; Geissler, G.J.; Wang, F.; Saretsky, J.; Daoud, Y.A.; Lieberman, D.E. Foot Strike and Injury Rates in Endurance Runners: A Retrospective Study. Med. Sci. Sports Exerc. 2012, 44, 1325–1334. [Google Scholar] [CrossRef] [PubMed]
- Farinelli, V.; Hosseinzadeh, L.; Palmisano, C.; Frigo, C. An easily applicable method to analyse the ankle-foot power absorption and production during walking. Gait Posture 2019, 71, 56–61. [Google Scholar] [CrossRef]
- Exell, T.A.; Irwin, G.; Gittoes, M.J.; Kerwin, D.G. Implications of intra-limb variability on asymmetry analyses. J. Sport Health Sci. 2012, 30, 403–409. [Google Scholar] [CrossRef]
- Taylor, W.R.; Ehrig, R.M.; Duda, G.N.; Schell, H.; Seebeck, P.; Heller, M.O. On the influence of soft tissue coverage in the determination of bone kinematics using skin markers. J. Orthop. Res. 2005, 23, 726–734. [Google Scholar] [CrossRef]
- Leardini, A.; Chiari, L.; Della Croce, U.; Cappozzo, A. Human movement analysis using stereophotogrammetry: Part 3. Soft tissue artifact assessment and compensation. Gait Posture 2005, 21, 212–225. [Google Scholar] [CrossRef]
- Leardini, A.; Benedetti, M.G.; Berti, L.; Bettinelli, D.; Nativo, R.; Giannini, S. Rear-foot, mid-foot and fore-foot motion during the stance phase of gait. Gait Posture 2007, 25, 453–462. [Google Scholar] [CrossRef]
- Camomilla, V.; Cereatti, A.; Vannozzi, G.; Cappozzo, A. An optimized protocol for hip joint centre determination using the functional method. J. Biomech. 2006, 39, 1096–1106. [Google Scholar] [CrossRef] [PubMed]
- Schwartz, M.H.; Rozumalski, A. A new method for estimating joint parameters from motion data. J. Biomech. 2005, 38, 107–116. [Google Scholar] [CrossRef] [PubMed]
- Robertson, D.G.E.; Robertson, G.; Caldwell, G.; Hamill, J.; Kamen, P.G.; Whittlesey, S. Research Methods in Biomech, 2nd ed.; Human Kinetics: Champaign, IL, USA, 2013. [Google Scholar]
- Baker, R. Pelvic angles: A mathematically rigorous definition which is consistent with a conventional clinical understanding of the terms. Gait posture 2001, 13, 1–6. [Google Scholar] [CrossRef]
- Schache, A.G.; Baker, R. On the expression of joint moments during gait. Gait Posture 2007, 25, 440–452. [Google Scholar] [CrossRef] [PubMed]


| FFS | RFS | ||||||||||||
|---|---|---|---|---|---|---|---|---|---|---|---|---|---|
| Slope LRP | Slope DP | Wabs | Wprod | Wnet | Wratio | Slope LRP | Slope DP | Wabs | Wprod | Wnet | Wratio | ||
| LOW | |||||||||||||
| Slope ERP | −0.16 | 0.41 | −0.41 | 0.04 | −0.46 | −0.39 | 0.19 | 0.20 | −0.27 | 0.60 | 0.31 | −0.01 | |
| Slope LRP | 0.10 | 0.47 | −0.22 | 0.26 | 0.38 | 0.58 | −0.03 | 0.44 | 0.36 | 0.35 | |||
| Slope DP | −0.52 | 0.09 | −0.65 * | −0.71 * | −0.24 | 0.02 | −0.41 | −0.39 | |||||
| Wabs | −0.69 * | 0.37 | 0.64 * | −0.50 | 0.27 | 0.60 | |||||||
| Wprod | 0.36 | 0.03 | 0.60 | 0.30 | |||||||||
| Wnet | 0.93 ** | 0.88 ** | |||||||||||
| MED | |||||||||||||
| Slope ERP | 0.41 | 0.67 * | −0.44 | 0.32 | −0.09 | −0.22 | 0.19 | 0.42 | −0.60 | 0.35 | 0.29 | −0.02 | |
| Slope LRP | 0.76 * | −0.10 | 0.13 | −0.29 | −0.21 | 0.67 * | −0.01 | −0.07 | −0.02 | 0.20 | |||
| Slope DP | −0.67 * | 0.55 | −0.27 | −0.44 | −0.05 | −0.43 | −0.47 | −0.24 | |||||
| Wabs | −0.82 ** | 0.08 | 0.50 | −0.61 | −0.53 | 0.16 | |||||||
| Wprod | 0.39 | −0.08 | 0.99 ** | 0.53 | |||||||||
| Wnet | 0.86 ** | 0.61 | |||||||||||
| HIGH | |||||||||||||
| Slope ERP | 0.95 ** | 0.84 ** | −0.19 | 0.30 | 0.71 * | 0.13 | 0.09 | −0.02 | 0.04 | 0.21 | 0.27 | 0.31 | |
| Slope LRP | 0.89 ** | −0.22 | 0.30 | 0.65 * | 0.08 | 0.92 ** | 0.26 | −0.08 | 0.21 | 0.43 | |||
| Slope DP | −0.53 | 0.58 | 0.58 | 0.07 | 0.14 | −0.08 | 0.15 | 0.25 | |||||
| Wabs | −0.93 ** | −0.01 | 0.38 | −0.52 | 0.19 | 0.66 * | |||||||
| Wprod | 0.26 | −0.16 | 0.64 * | 0.21 | |||||||||
| Wnet | 0.61 | 0.79 ** |
© 2019 by the authors. Licensee MDPI, Basel, Switzerland. This article is an open access article distributed under the terms and conditions of the Creative Commons Attribution (CC BY) license (http://creativecommons.org/licenses/by/4.0/).
Share and Cite
Garofolini, A.; Taylor, S.; Mclaughlin, P.; Mickle, K.J.; Frigo, C.A. Ankle Joint Dynamic Stiffness in Long-Distance Runners: Effect of Foot Strike and Shoes Features. Appl. Sci. 2019, 9, 4100. https://doi.org/10.3390/app9194100
Garofolini A, Taylor S, Mclaughlin P, Mickle KJ, Frigo CA. Ankle Joint Dynamic Stiffness in Long-Distance Runners: Effect of Foot Strike and Shoes Features. Applied Sciences. 2019; 9(19):4100. https://doi.org/10.3390/app9194100
Chicago/Turabian StyleGarofolini, Alessandro, Simon Taylor, Patrick Mclaughlin, Karen J Mickle, and Carlo Albino Frigo. 2019. "Ankle Joint Dynamic Stiffness in Long-Distance Runners: Effect of Foot Strike and Shoes Features" Applied Sciences 9, no. 19: 4100. https://doi.org/10.3390/app9194100
APA StyleGarofolini, A., Taylor, S., Mclaughlin, P., Mickle, K. J., & Frigo, C. A. (2019). Ankle Joint Dynamic Stiffness in Long-Distance Runners: Effect of Foot Strike and Shoes Features. Applied Sciences, 9(19), 4100. https://doi.org/10.3390/app9194100


