Article

Transmission Performance Analysis of RV Reducers Influenced by Profile Modification and Load

Beijing Engineering Research Center of Precision Measurement Technology and Instruments, College of Mechanical Engineering and Applied Electronics Technology, Beijing University of Technology, Beijing 100124, China
*
Author to whom correspondence should be addressed.
Appl. Sci. 2019, 9(19), 4099; https://doi.org/10.3390/app9194099
Submission received: 31 August 2019 / Revised: 25 September 2019 / Accepted: 25 September 2019 / Published: 1 October 2019
(This article belongs to the Section Mechanical Engineering)

Abstract

:

Featured Application

A new multi-tooth contact model proposed in this study provides an effective method to determine the optimal profile modification curves to improve transmission performance of RV reducers.

Abstract

RV reducers contain multi-tooth contact characteristics, with high-impact resistance and a small backlash, and are widely used in precision transmissions, such as robot joints. The main parameters affecting the transmission performance include torsional stiffness and transmission errors (TEs). However, a cycloid tooth profile modification has a significant influence on the transmission accuracy and torsional stiffness of an RV reducer. It is important to study the multi-tooth contact characteristics caused by modifying the cycloid profile. The contact force is calculated using a single contact stiffness, inevitably affecting the accuracy of the result. Thus, a new multi-tooth contact model and a TE model of an RV reducer are proposed by dividing the contact area into several differential elements. A comparison of the contact force obtained using the finite element method and the test results of an RV reducer prototype validates the proposed models. On this basis, the influence of load on the different modification methods is studied, including a TE, the mechanical performance, and the transmission efficiency. In addition, the proposed reverse profile is particularly suitable for situations with a large clearance and torque. This study provides a reliable theoretical basis for a multi-tooth contact analysis of a cycloid profile modification.

1. Introduction

RV reducers are planocentric reduction mechanisms used for precise transmission applications. Such mechanisms incorporate numerous cycloid-pin teeth that are engaged concurrently. Therefore, RV reducers have a compact and highly rigid construction that is robust against shock-load and overloading. Furthermore, a minimal backlash and inertia assure a rapid acceleration and extremely accurate positioning. An RV reducer is ideally suited for precision mechanical control in industrial robots, machine tools, and assembly equipment, where precise positioning and a torsional stiffness capability are required [1].
Transmission errors (TEs) are key parameters used to represent the transmission performance of an RV reducer. The TE measurement method of a precision planetary cycloid reducer is defined in GB/T 37718-2019 [2]. The optimal measurement speed can be determined according to the Stribeck friction model [3,4]. The determination of optimal measurement speed of transmission errors could improve the measurement precision. A cycloid profile modification is one of the factors causing the TEs of an RV reducer [5,6,7]. However, to avoid the influence of machining errors on an RV reducer assemble, a cycloid tooth profile modification is commonly used in engineering practice. The modification methods often include a modification of the moved distance, equidistance, rotation angle, and their combination [8]. An angular modification needs to be used with other methods concurrently. In [9], based on a tooth contact analysis, the TE caused by different combinations of modifications is quantitatively analyzed. To reduce the impact of a modification on the RV reducer transmission accuracy, the optimal cycloidal tooth profile modification method has been studied by numerous researchers. In [10], a modification method for designing the modification gap curves by adjusting the positions of five key points on the cycloid profile was proposed. This method can improve the carrying capacity of cycloidal drive, eliminate noise and vibration and develop the transmission accuracy. Compared with the designed modified tooth profile, the actual tooth profile with machining errors can be accurately measured to compensate such errors between the actual and designed tooth profiles [11,12]. In addition, judging the optimal modified tooth profile according to the amplitude frequency vibration response of the transmission system caused by different modified tooth profiles is an effective method [13].
The torsional stiffness of an RV reducer achieves a relatively large benefit from its multi-tooth contact characteristics, and thus can ensure a high transmission accuracy. Therefore, the contact force calculation of a cycloid-pin is particularly important when multiple teeth mesh together to transmit a power load [14,15]. Among the many studies conducted in this area, Xu proposed a numerical method to determine the number of teeth that are loaded simultaneously [16,17]. The model can be used to investigate the effect of changing the geometrical design parameters of the tooth profile of the cycloid gear. However, the contact area of each mesh tooth is treated as a whole, and the contact force is calculated using a single contact stiffness. Such a treatment method results in some errors in the actual contact status [18]. To reduce this deficiency, Ma established a hybrid contact force model. The contact cylinder surface is divided into many differential elements using the discrete element theory. Each differential element calculates the contact force separately according to the compression depth. Therefore, the contact model is more accurate for a complex profile contact [19].
Studies on cycloid tooth profile modification have mostly focused on the design method of optimizing the tooth profile, and the evaluation index is often limited to the transmission accuracy. The influences of the modification of the mechanical properties, contact area, and transmission efficiency have rarely been reported. However, such performances are also of concern among users of an RV reducer. In addition, the most important point that is often neglected is the load impact on the tooth profile modification. Regarding the multi-tooth contact model introduced in the references herein, the accuracy of the results will be significantly affected because it is based on a single contact stiffness model. In this paper, each tooth contact area is replaced by multiple differential contact units, and a multi-tooth contact model and a TE model of an RV reducer are first established. The proposed models are then verified using the finite element method and experimental measurements. On this basis, the influence of load on the different modification methods is studied in detail. The evaluation index considered includes the transmission accuracy, mechanical performance, and transmission efficiency. Finally, considering the load influence, the proper applications of different modification methods are discussed.

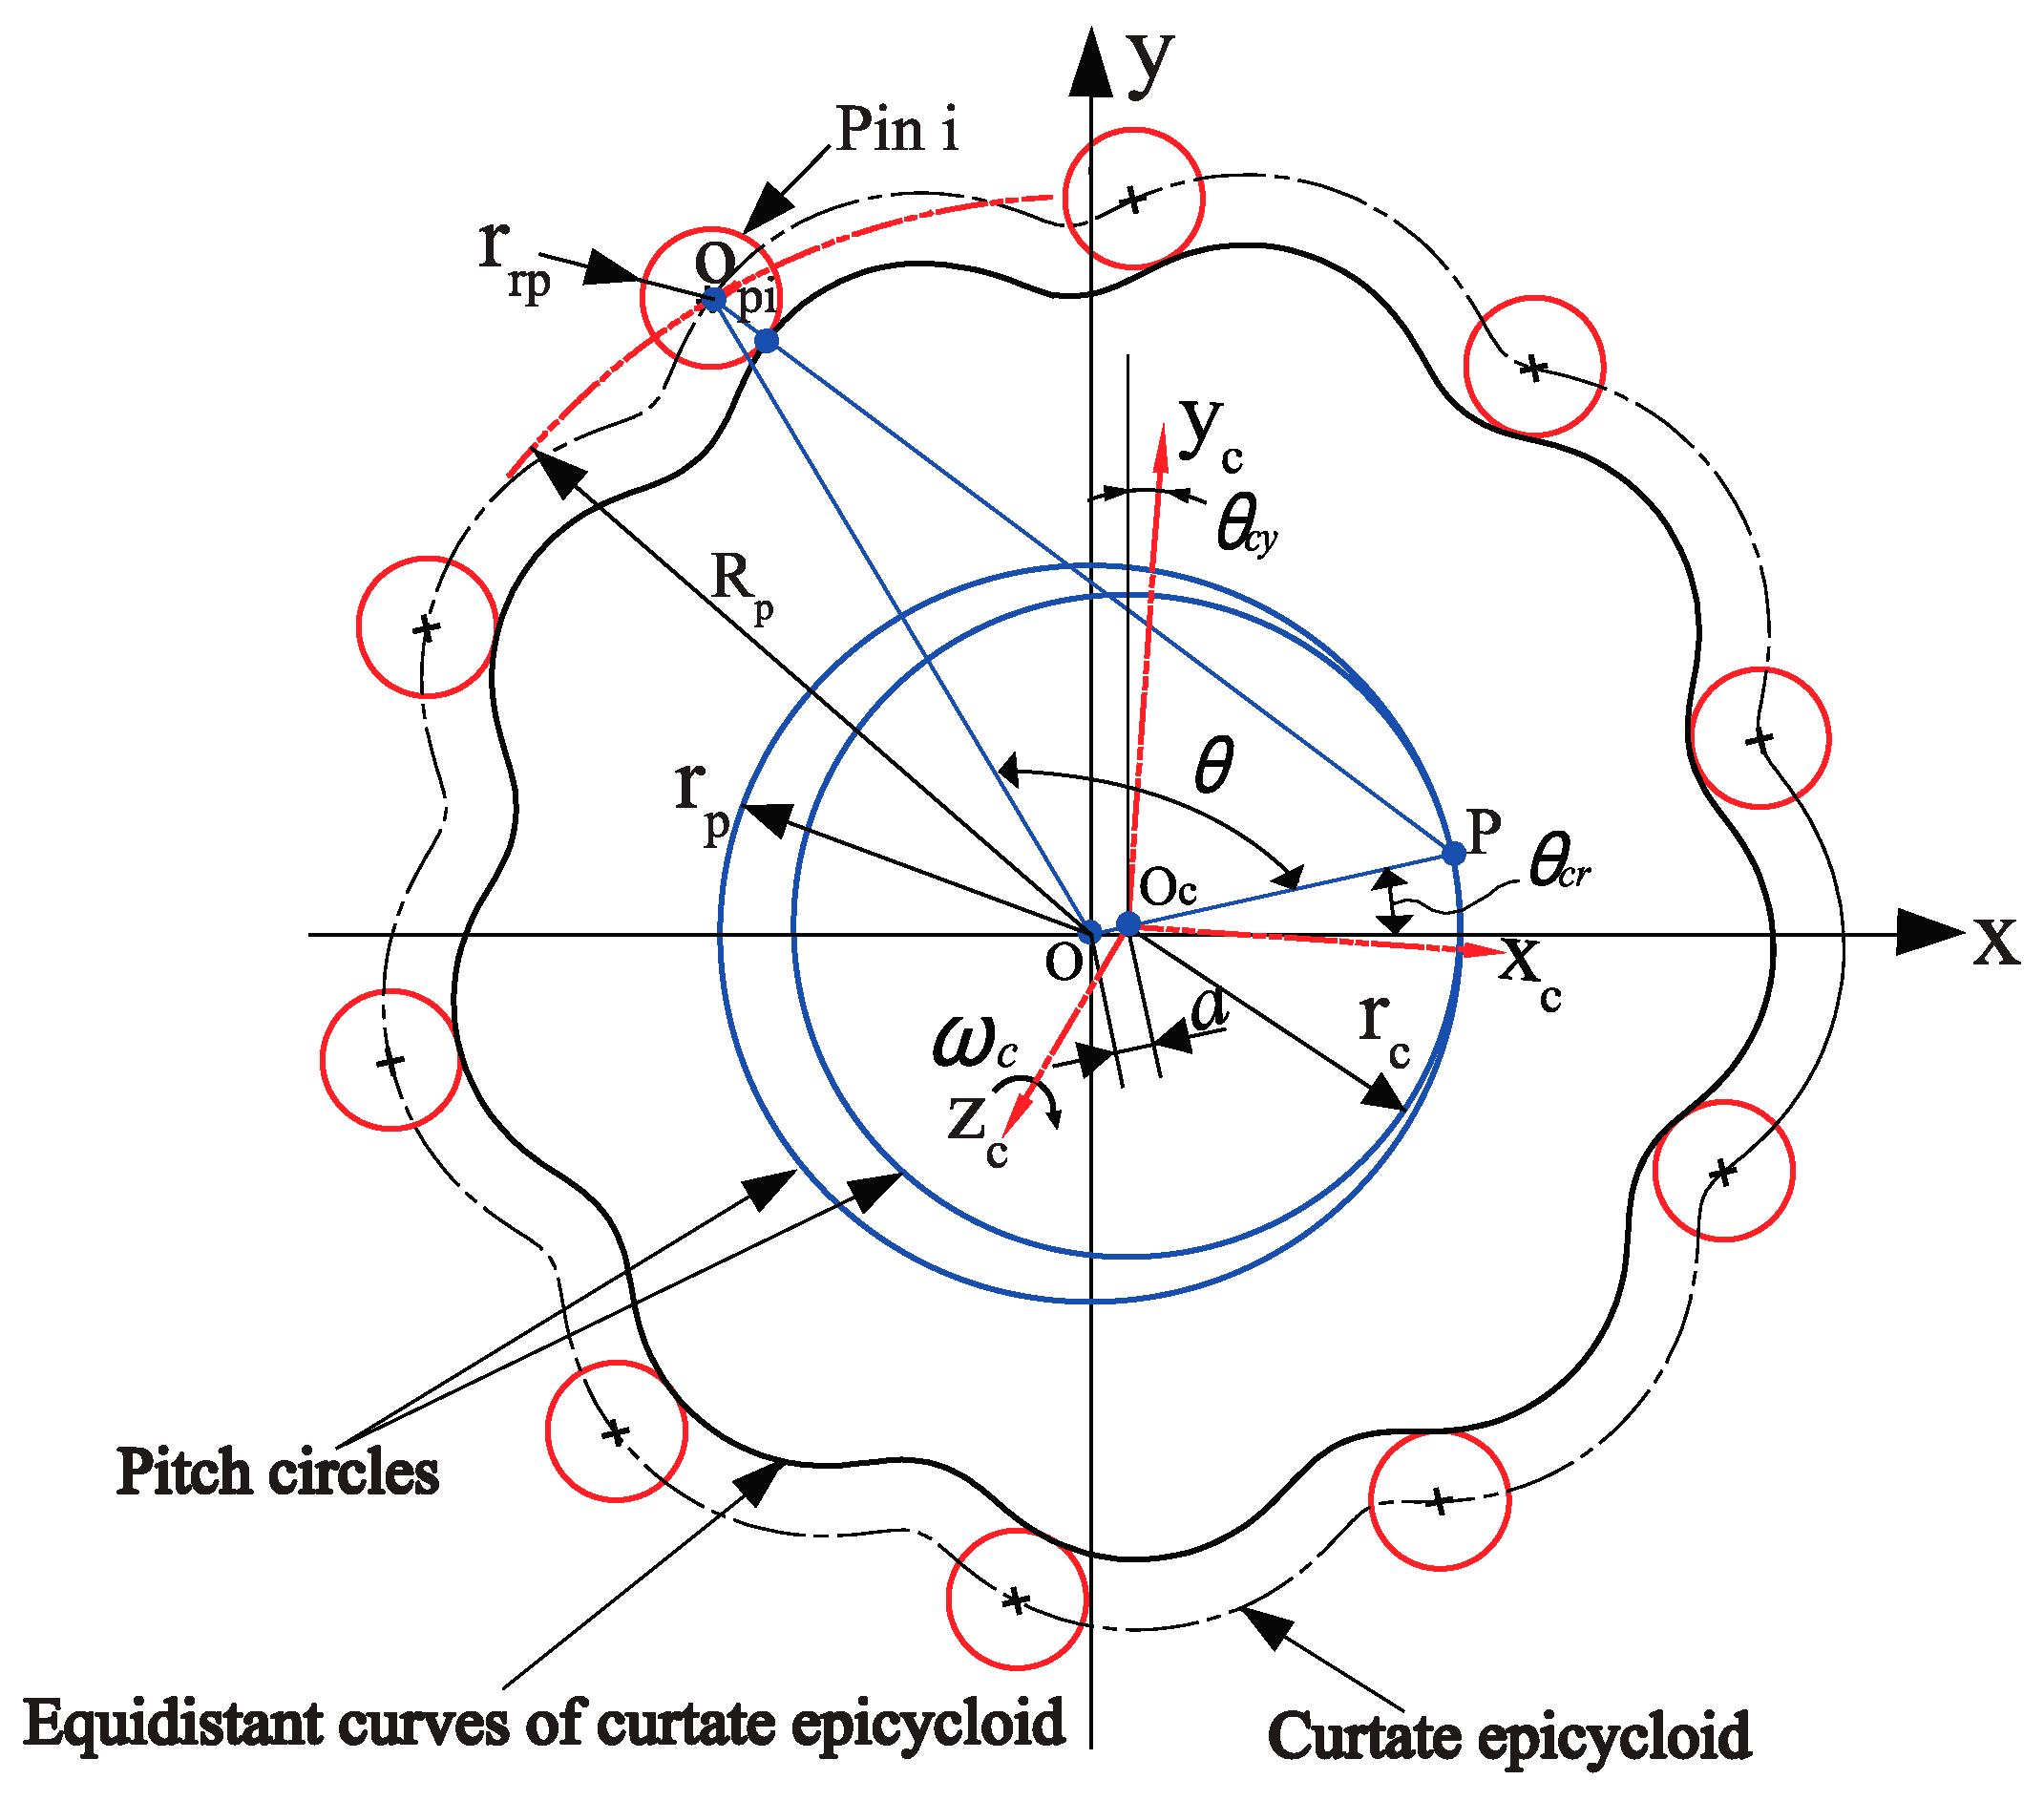
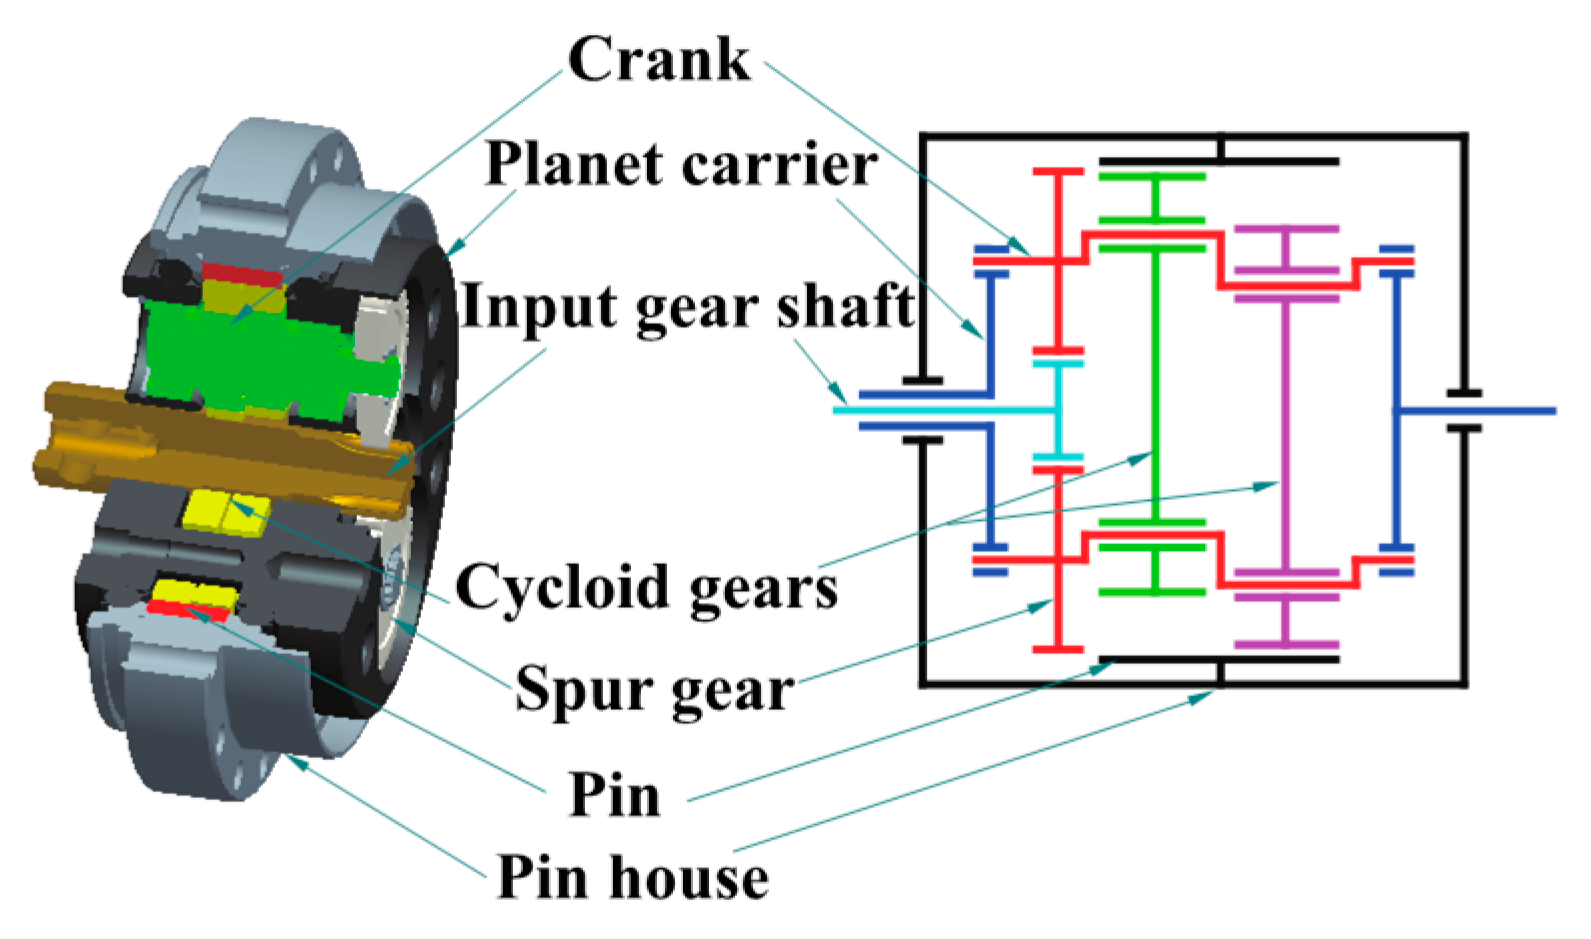
2. Analytical Model of RV Reducer with Tooth Profile Modifications

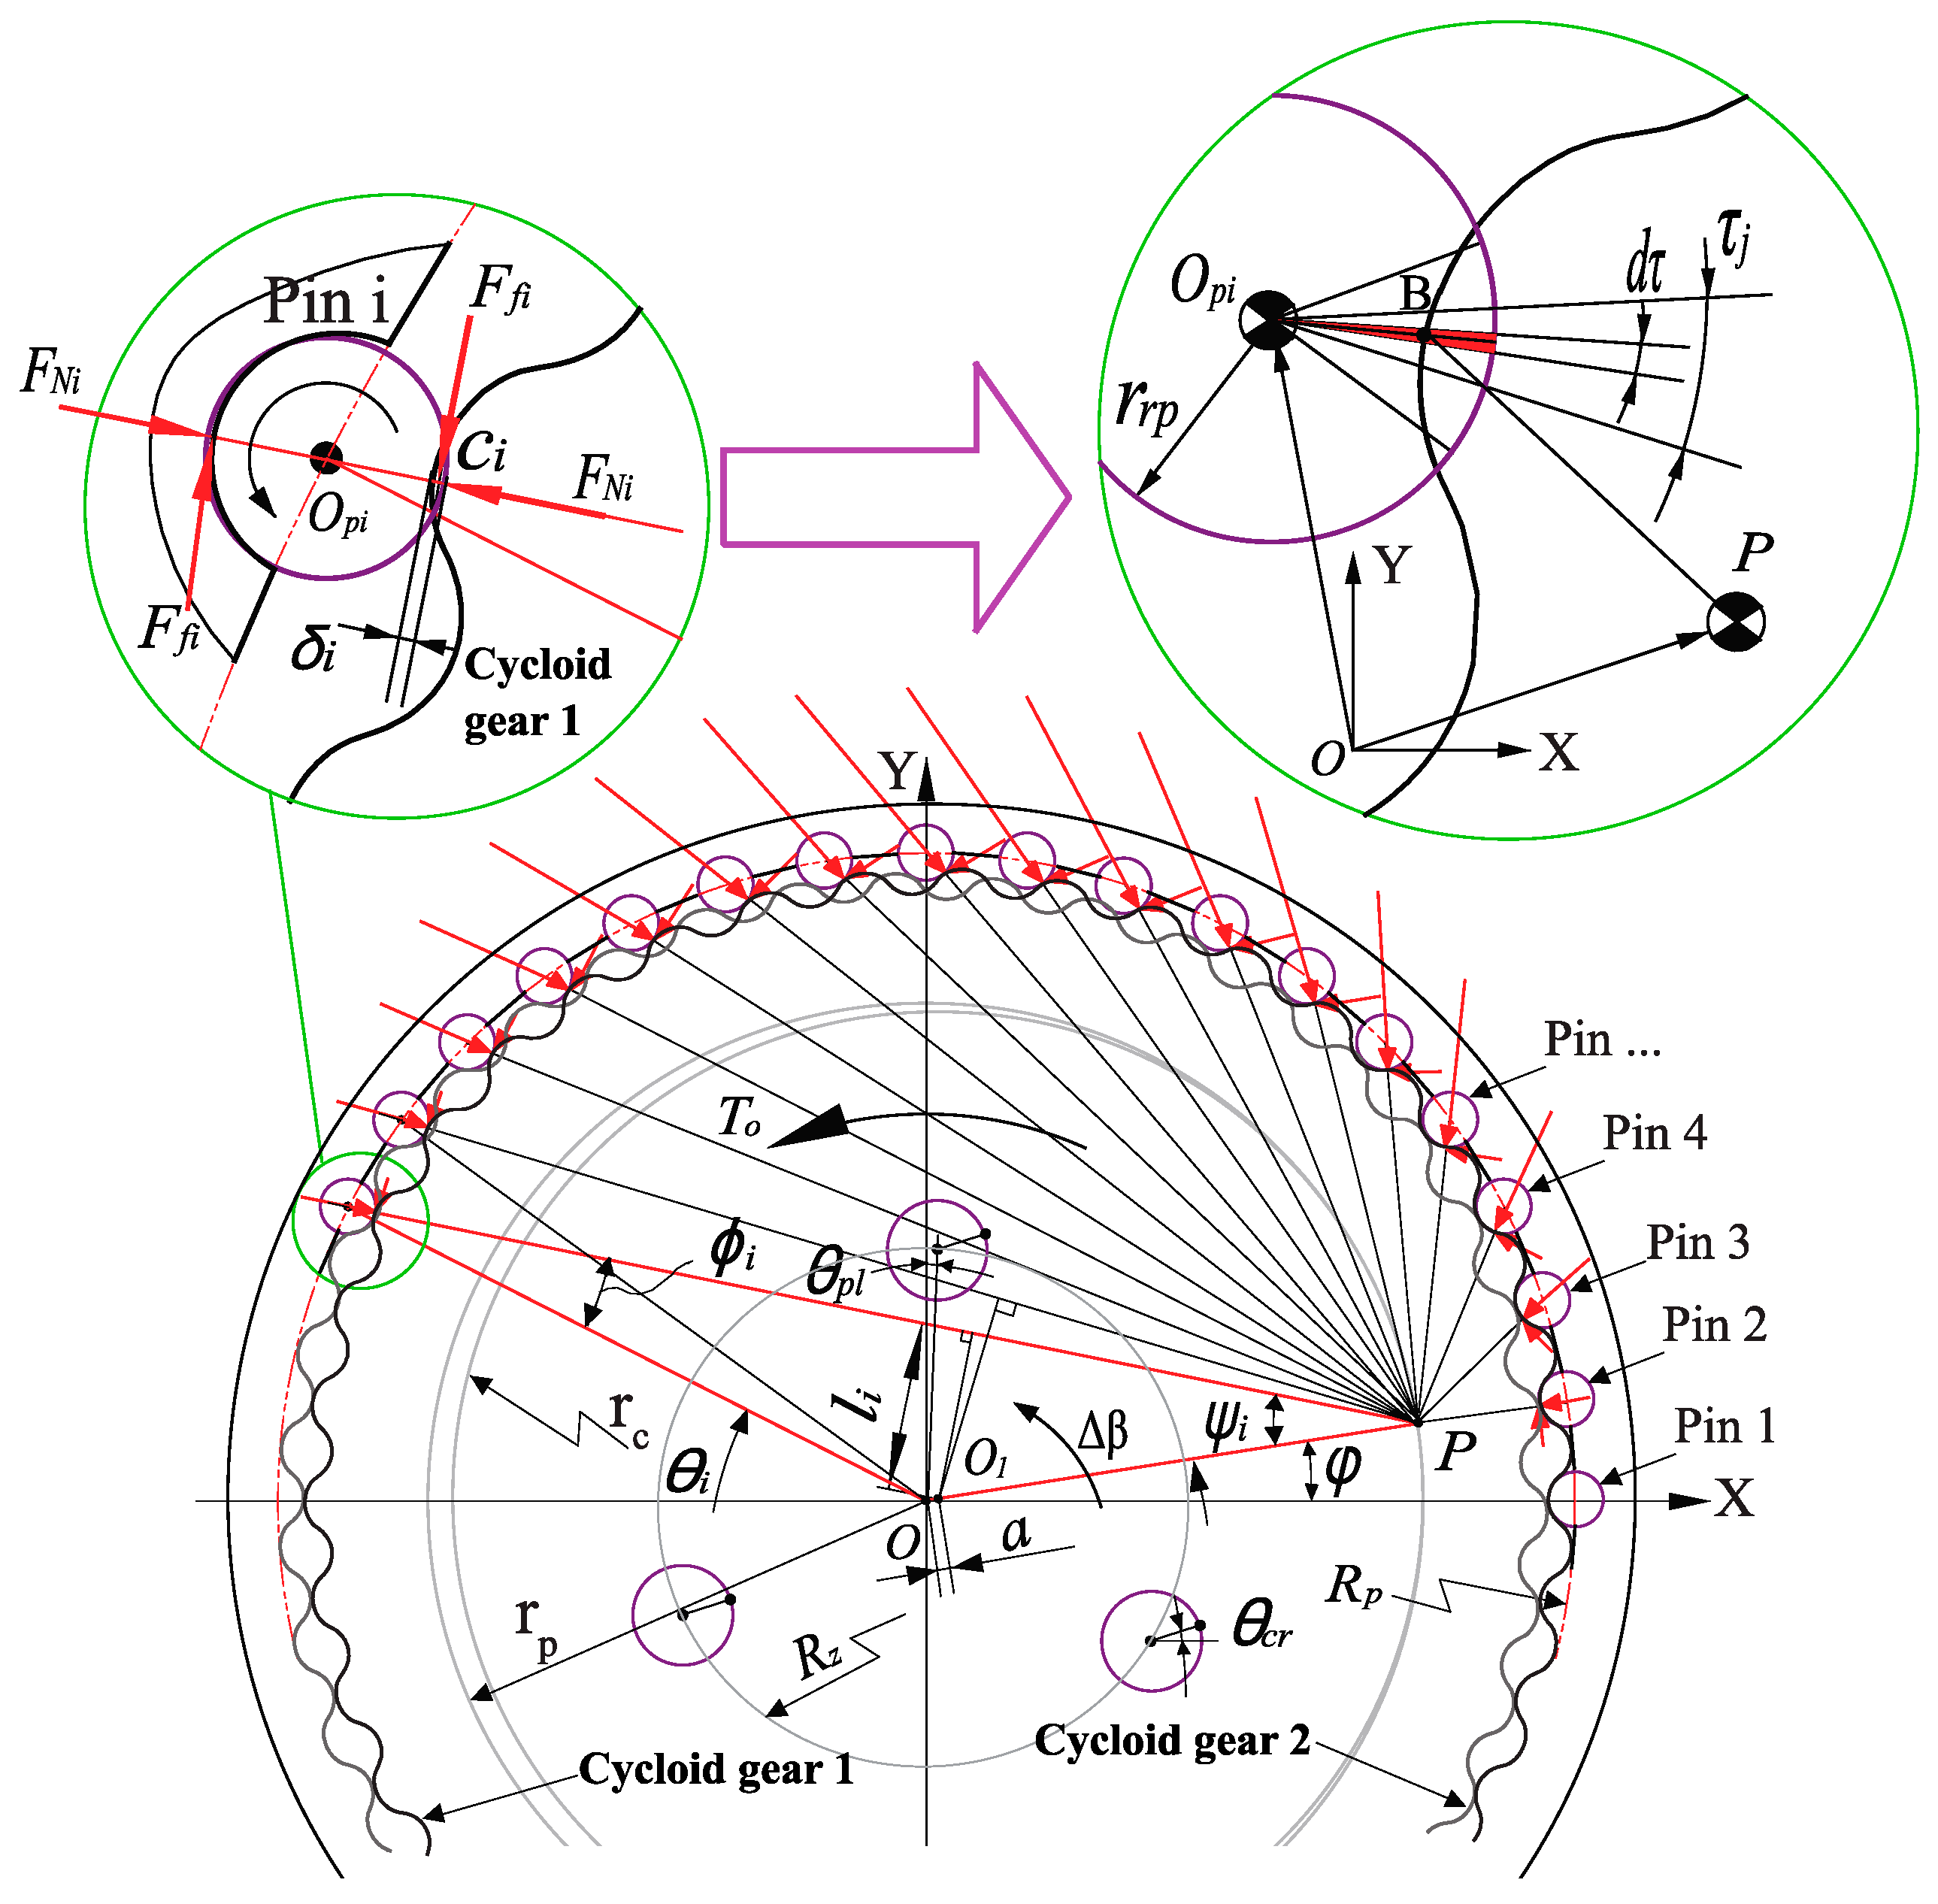
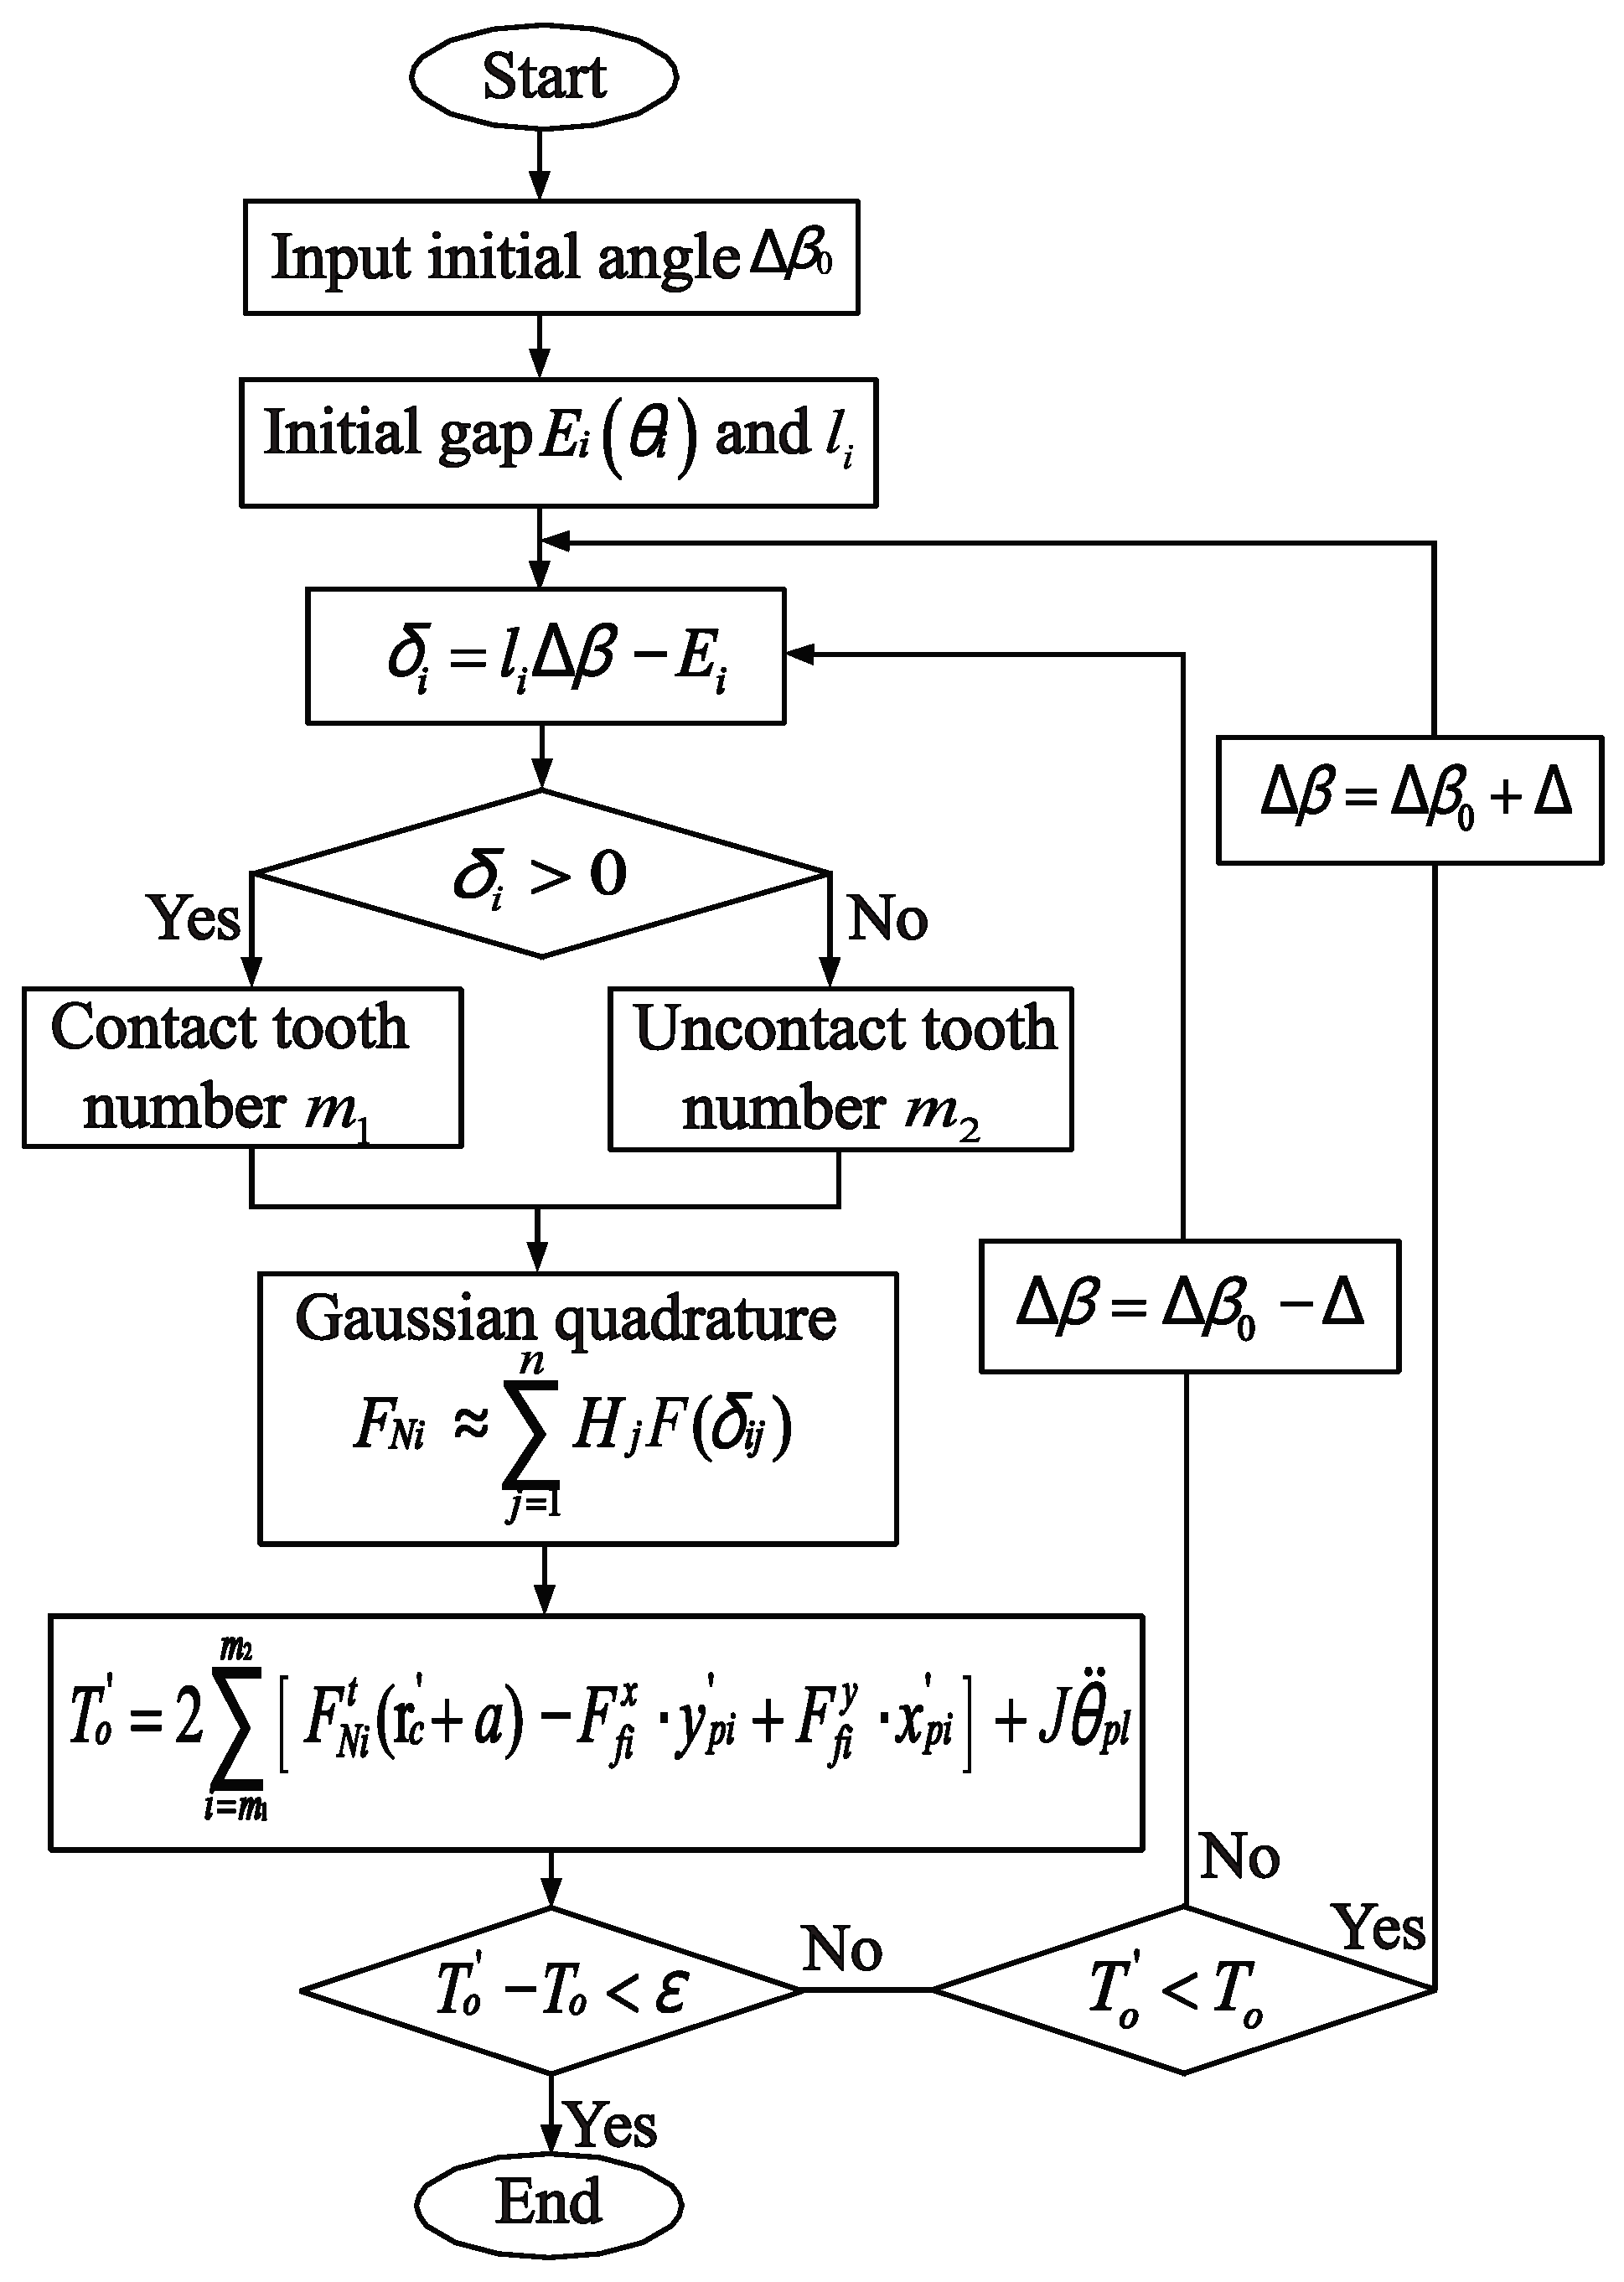
2.1. Contact Force Calculation

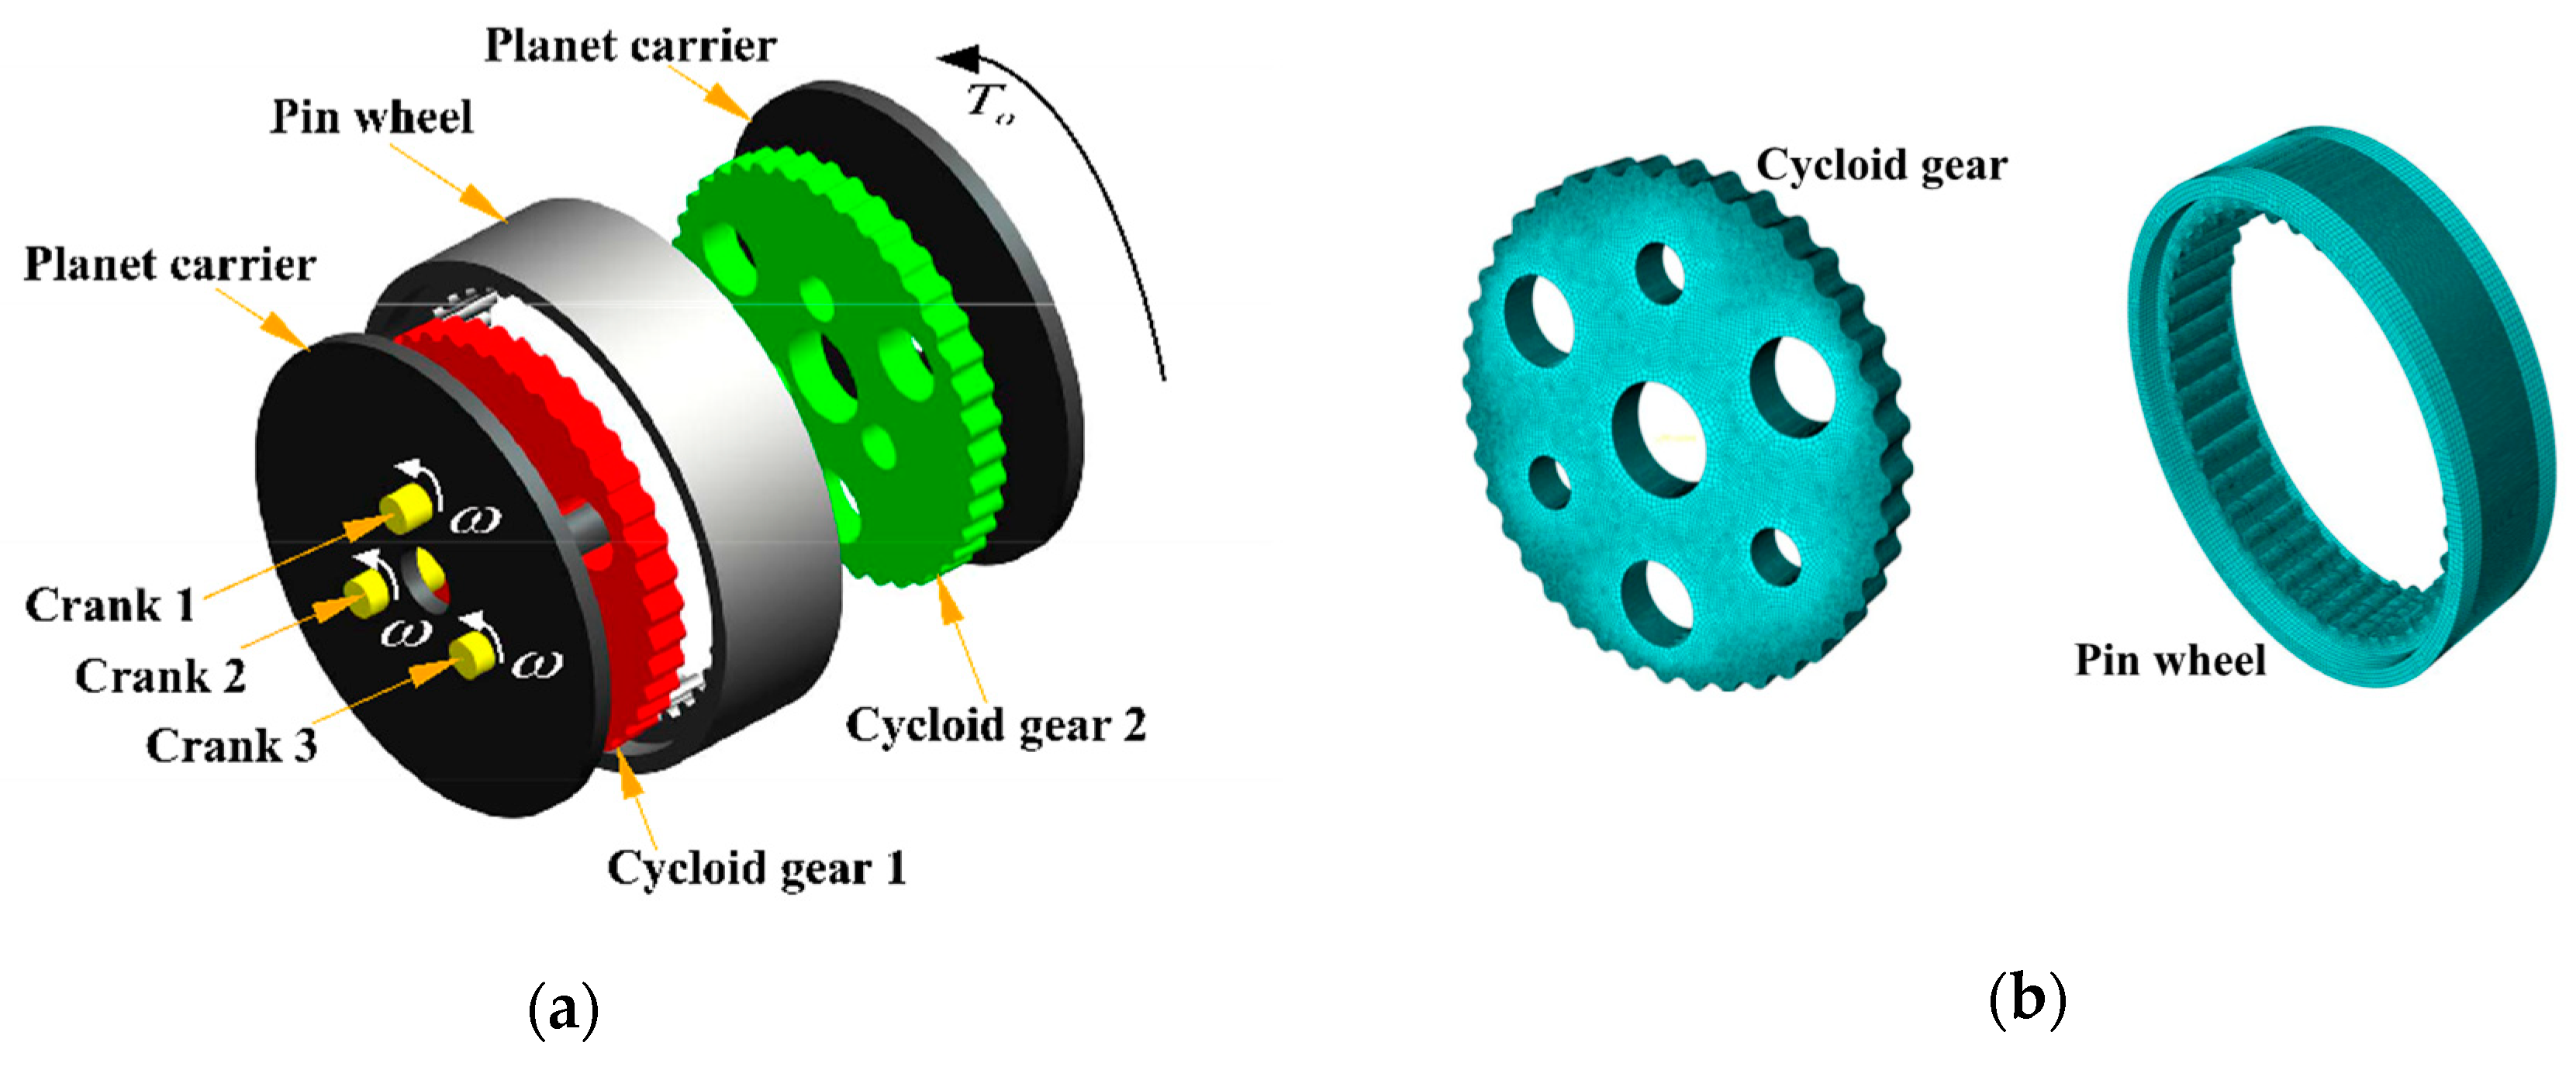
2.1.1. Contact Force Model

A traditional cycloid drive is the basis used to analyze an RV reducer, and Figure 1 shows a traditional cycloid drive coordinate system. Here, x o y and x c o c y c represent the static coordinates of a pin wheel and cycloid gear, O and O c denote the center of the pin wheel and cycloid gear, and r p and r c denote the pitch circle radius of a pin wheel and cycloid gear, respectively. Pitch point P is the instant velocity center of a cycloid drive and O O c is the position of the crank. When the crank rotates θ c r , the cycloid gear will rotate θ c y according to the transmission ratio. The rotation of a cycloid gear is output using a parallelogram mechanism.
The track of the meshing point of a cycloid-pin in a static coordinate system is part of the circular arc of the pin. According to the meshing principle of a cycloid drive, the tooth profile of a cycloid gear can be obtained as follows [20]:
{ x = ( R p + Δ R p ) c o s [ ( 1 i H ) θ ] a c o s ( i H θ ) + ( r r p + Δ r r p ) S 1 2 { K c o s ( i H θ ) c o s [ ( 1 i H ) θ ] } y = ( R p + Δ R p ) s i n [ ( 1 i H ) θ ] + a s i n ( i H θ ) ( r r p + Δ r r p ) S 1 2 { K s i n ( i H θ ) + s i n [ ( 1 i H ) θ ] } ,
where
i H = Z p Z c ,
K = a Z p R p + Δ R p ,
S = 1 + K 2 2 K c o s θ .
Here, θ represents the angle of the pin position vector; Δ R p and Δ r r p refer to the modification coefficient of the moved distance and equidistance, respectively; Z c and Z p denote the cycloid disc teeth number and pin number; r r p and R p represent the pin radius and pin center circle radius, respectively; and a represents the eccentricity.
The pitch circle radius of a pin wheel and cycloid gear can be calculated using the following equations:
{ r p = a Z p r c = a Z c
Figure 2 shows the mechanism of an RV reducer. Because the machining precision of the crank, cycloid gear, and planetary carrier is extremely high, these are generally known as the three key parts of an RV reducer. Two cycloid gears are supported in the planet carrier by three cranks. The purpose of these two cycloid gears is to balance the radial force and improve the load capacity. An RV reducer contains three freedoms of rotation, namely, the rotations of the input gear shaft, pin wheel, and planet carrier. Any fixed parts can form a mechanism for increasing or decreasing the speed. Because an involute planet drive is applied to the high-speed stage, its TE is significantly attenuated by the transmission chain [5,6]. Therefore, to focus on the main factors affecting the transmission performance of an RV reducer, an involute gear transmission is not considered in the present study. The torque is applied to the three cranks as an input of the involute planetary drive. The RV reducer parameters used in this paper are listed in Table 1.
A geometric model of an RV reducer is shown in Figure 3. Here, O and O 1 represent the center of a pin wheel and cycloid gear 1, respectively. In addition, pitch point P represents the instant velocity center of a cycloid gear 1, O p i denotes the center of the i t h pin, c i refers to the meshing point of the i t h pin with cycloid gear 1, and l i represents the normal arm length. Moreover, Δ O P O 1 is defined as the meshing triangle, where ϕ i , ψ i , and θ i denote the contact angle, normal angle, and azimuth of the i t h pin. Because three cranks are supported in the planet carrier, as a difference between the RV reducer and a traditional cycloid drive, the cranks have an extra rotation relative to the pin wheel. The angle between the center line O O 1 ¯ and the X axis is φ = θ c r / i H , where θ c r is the crank rotation angle. The rotation angle of the planet carrier is θ p l = θ c r / Z p .
The contact angle can be obtained based on the geometric relationship of Δ O P O p i , which can be expressed as Equation (6) [21]:
ϕ i = t a n 1 [ a Z p s i n α i R p a Z p c o s α i ] = t a n 1 [ s i n α i R P / ( a Z p ) c o s α i ] ,
where α i = φ 2 π i H · i , and i is the pin number, i.e., i = 1 , 2 , 3 Z p .
The i t h pin azimuth may be obtained using Equation (7).
θ i = m o d ( 2 π Z p · i φ , π )
Furthermore, the normal angle ψ i can be obtained from the inner angle relationship of Δ O P O p i .
ψ i = π θ i ϕ i
The static coordinate value of the theoretical meshing point c i may be obtained through a coordinate transformation as follows:
[ x p i y p i 1 ] = [ c o s θ p l s i n θ p l a c o s ( θ c r / i H ) s i n θ p l c o s θ p l a s i n ( θ c r / i H ) 0 0 1 ] [ x i y i 1 ] ,
where x i and y i are the values in Equation (1), which may be calculated by substituting α i into θ .
The contact deformation caused by torque load T o between the cycloid gear 1 and the i t h pin is δ i in the enlarged view of Figure 3. As a result of a contact deformation, the cycloid gear 1 will rotate a small angle Δ β around O 1 in the direction of the torque load.
The contact deformation δ i may be expressed as follows:
δ i = l i Δ β E i
Here, E i is the initial tooth gap along the normal line caused by a tooth profile modification (TPM), and is calculated as follows [20]:
E i ( θ i ) = Δ r r p ( 1 s i n θ i 1 + K 2 2 K c o s θ i ) Δ R p · 1 K c o s θ i 1 K 2 s i n θ i 1 + K 2 2 K 2 c o s θ i
The normal arm length l i at meshing point c i may be calculated using Equation (12).
l i = r c sin ψ i
If δ i 0 , the pin will mesh with cycloid gear 1; otherwise, the pin will not participate in the transmission. This condition is used to judge the number of pins that are simultaneously engaged. To calculate the contact force more accurately, the Gaussian quadrature method is used to discretize the contact areas in the present study [22]. The compression region is divided into many small differential units, as indicated in the enlarged view of Figure 3. Thus, each differential element can be replaced with a spring-damped model. Therefore, the normal contact force of the contact area can be expressed as follows:
F N i j = 1 n H j F ( δ i j ) ,
where n represents the number of differential elements, and H j is the weight coefficient. As shown in Figure 3, the penetration of the j t h small element can be calculated based on the difference between r r p and O p i B as follows:
δ i j = r r p O p i B
The area of the differential element may be calculated in the following manner:
d A i j = 1 2 r r p L d τ
Because the Lankarani–Nikravesh contact force model exhibits a higher accuracy based on the Hertz contact force model, it is adopted to calculate the contact force of a single differential element. The contact force model is as follows [23]:
d F N i j = d K i j δ i j n + d D i j δ ˙ i j ,
where K i j is the Hertz contact stiffness of the differential element, which is calculated as follows [19]:
K i j = E c E p A i j [ E c ( 1 v c 2 ) + E p ( 1 v p 2 ) ] W i j
Here, W i j is the thickness of the elastic layer, and D i j is the damping coefficient, the modified formula of which is [24]:
D i j = 3 K i j ( 1 c e 2 ) e 2 ( 1 c e ) δ i j n 4 δ ˙ i j ( ) ( δ i j > 0 )
where δ ˙ i j ( ) is the initial penetration velocity upon impact of the differential element of the i t h contact area, and c e is the restitution coefficient. The exponent n is set to 1.5 for metallically circular or elliptical surfaces.
Thus, the contact force of the entire contact area of the i t h pin is as follows:
F N i = 0 τ i d F N i j = 0 τ i ( 4 δ ˙ i j ( ) + 3 ( 1 c e 2 ) e 2 ( 1 c e ) δ ˙ i j 8 W i j δ ˙ i j ( ) ) r r p δ i j 1.5 L E c E p [ E c ( 1 v c 2 ) + E p ( 1 v p 2 ) ] d τ
The contact force F N i can be divided into the radial and tangential components in the direction and vertical direction of the center line O O 1 ¯ . The contact force can then be expressed as follows:
F N i = F N i t i + F N i r j
{ F N i t = F N i s i n ψ i F N i r = F N i c o s ψ i
In this study, the Ambrósio friction force model is adopted to calculate the friction force between meshing surfaces. Compared with the traditional Coulomb friction model, the dynamic correction coefficient c d is added to the Ambrósio friction model [25], effectively preventing the friction from changing direction when the tangential velocity is zero. Therefore, the improved friction model creates numerical stability and is more suitable for a computer simulation. The calculation formula is as follows:
F f i = c f c d F N i V f V f = F f i x i + F f i y j ,
{ F f i x = F f i s i n ( φ ψ i ) F f i y = F f i c o s ( φ ψ i ) ,
where F f i x and F f i y represent the horizontal and vertical components of friction, respectively; c f is the friction coefficient; V f is the relative tangential velocity; and c d is the dynamic correction coefficient, which can be expressed in the following manner:
c d = { 0 i f V f v d V f v d v u v d i f v d V f v u 1 i f V f v u ,
where v d and v u are the given tolerances for the relative tangential velocity of the contact surfaces.
Then, the torque balance equation of cycloid transmission may be expressed as follows:
T o J θ ¨ p l = 2 i = m 1 m 2 [ F N i t ( r c + a ) F f i x · y p i + F f i y · x p i ] ,
where m 1 is the serial number of pins that begin to mesh, and m 2 is the serial number of pins that exit the meshing, which are determined from Equation (10). The simulation flow of all calculation processes is shown in Figure 4.

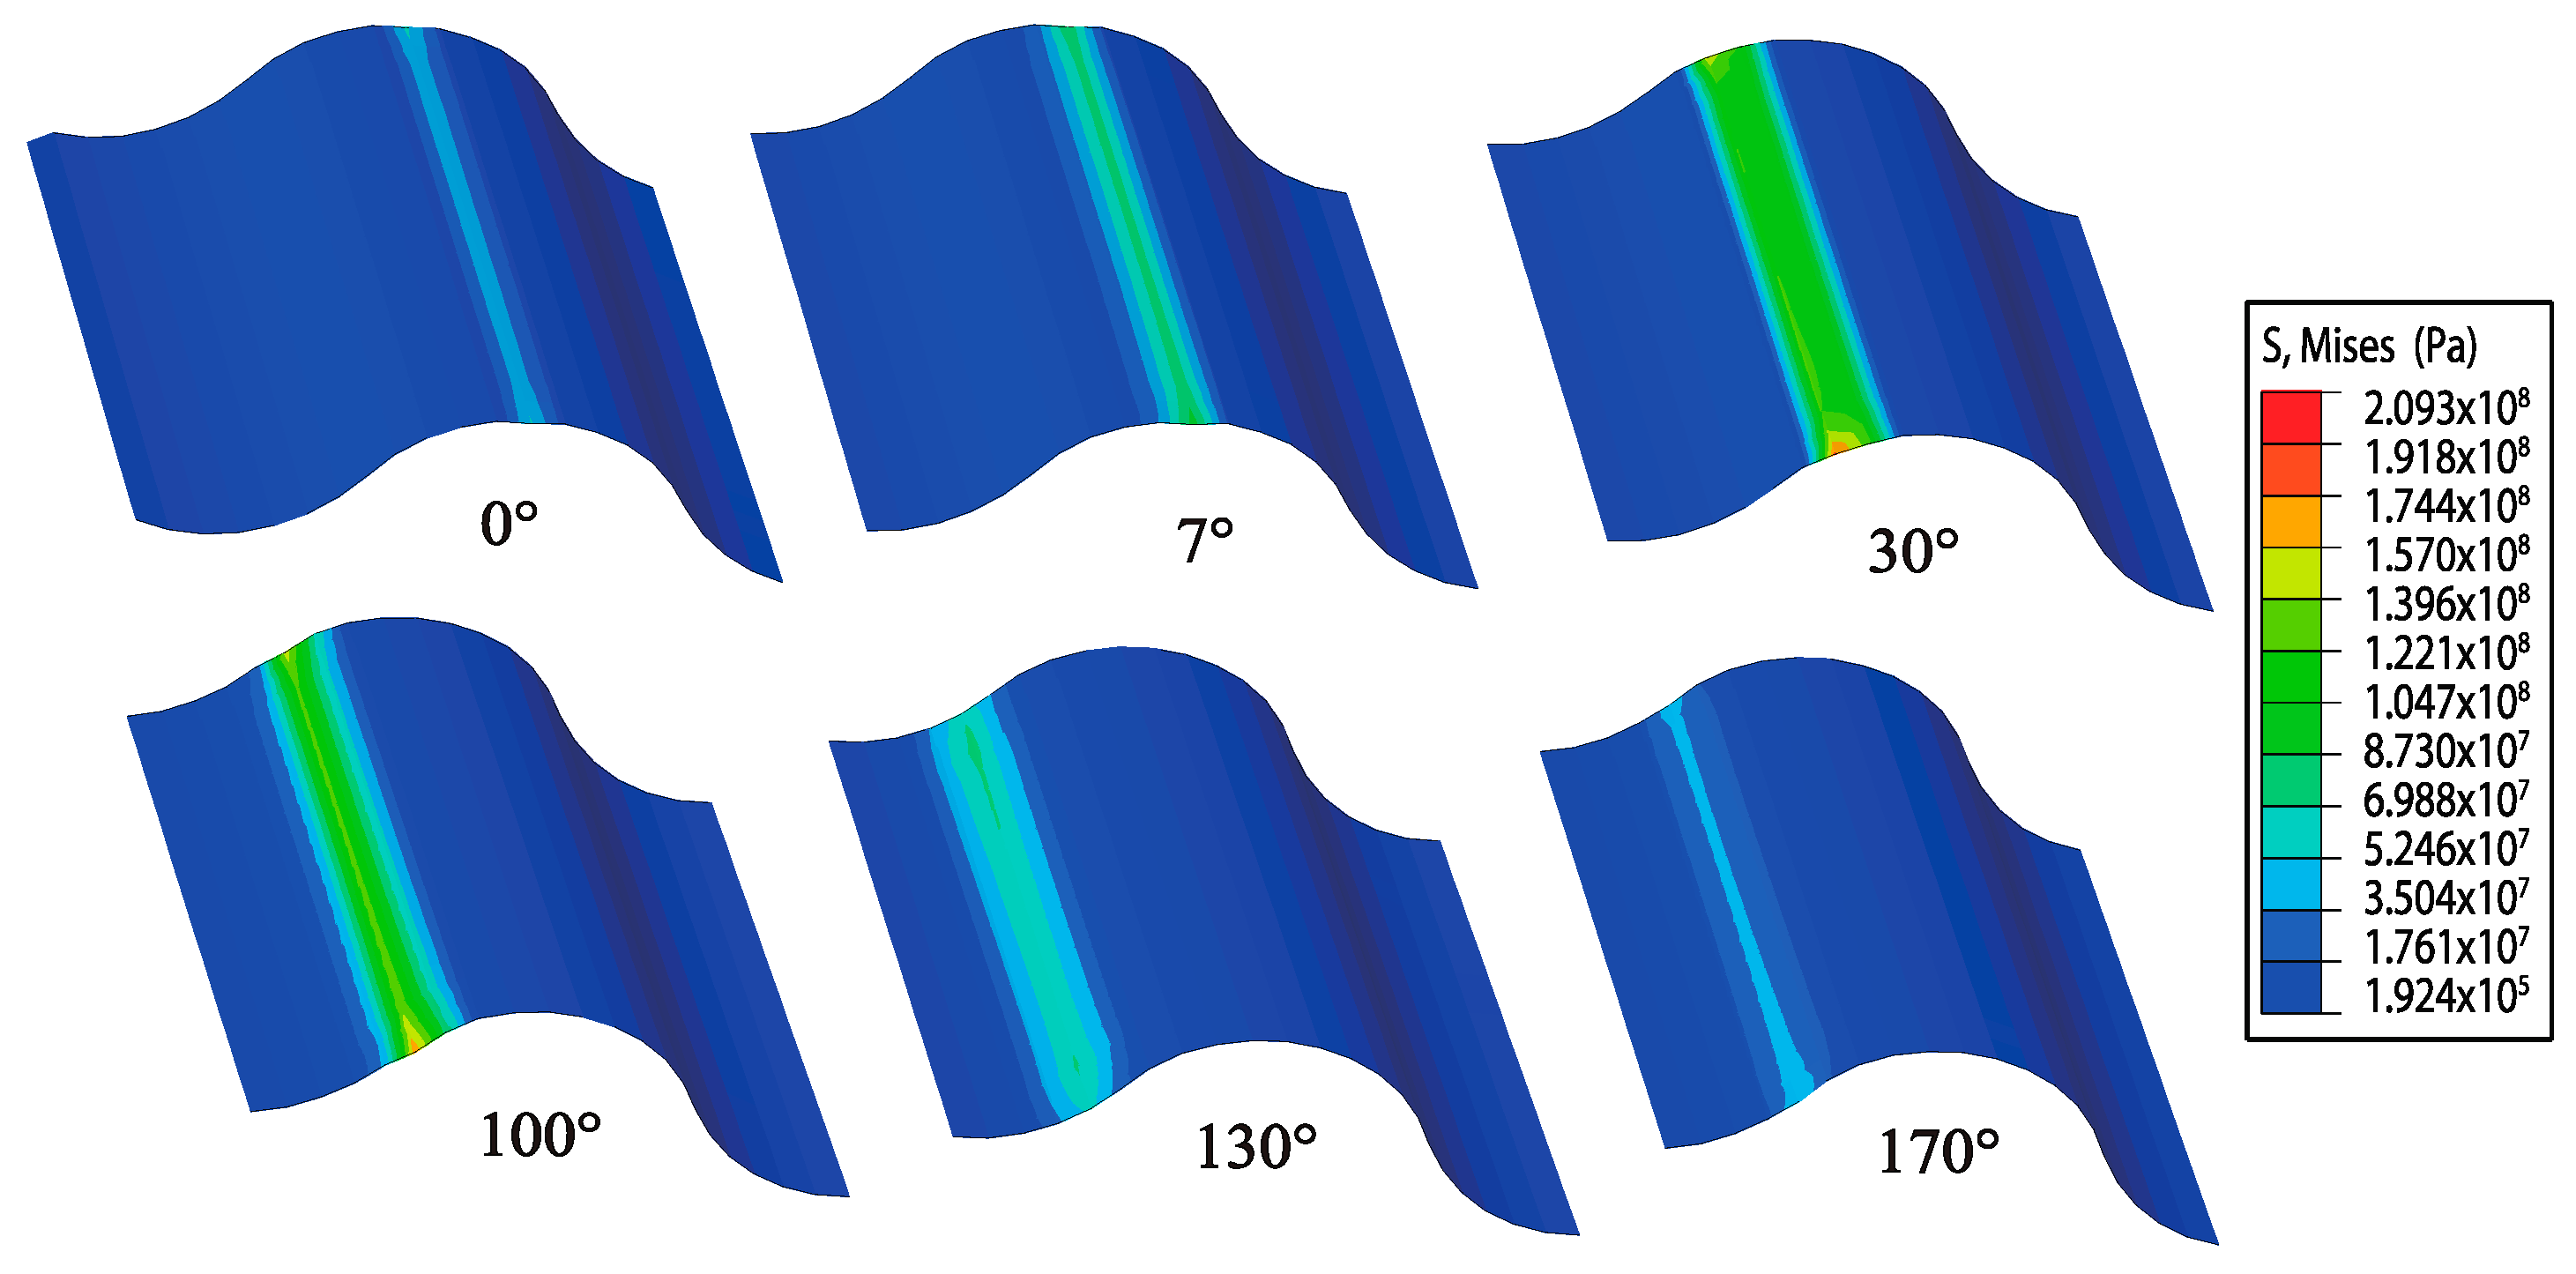
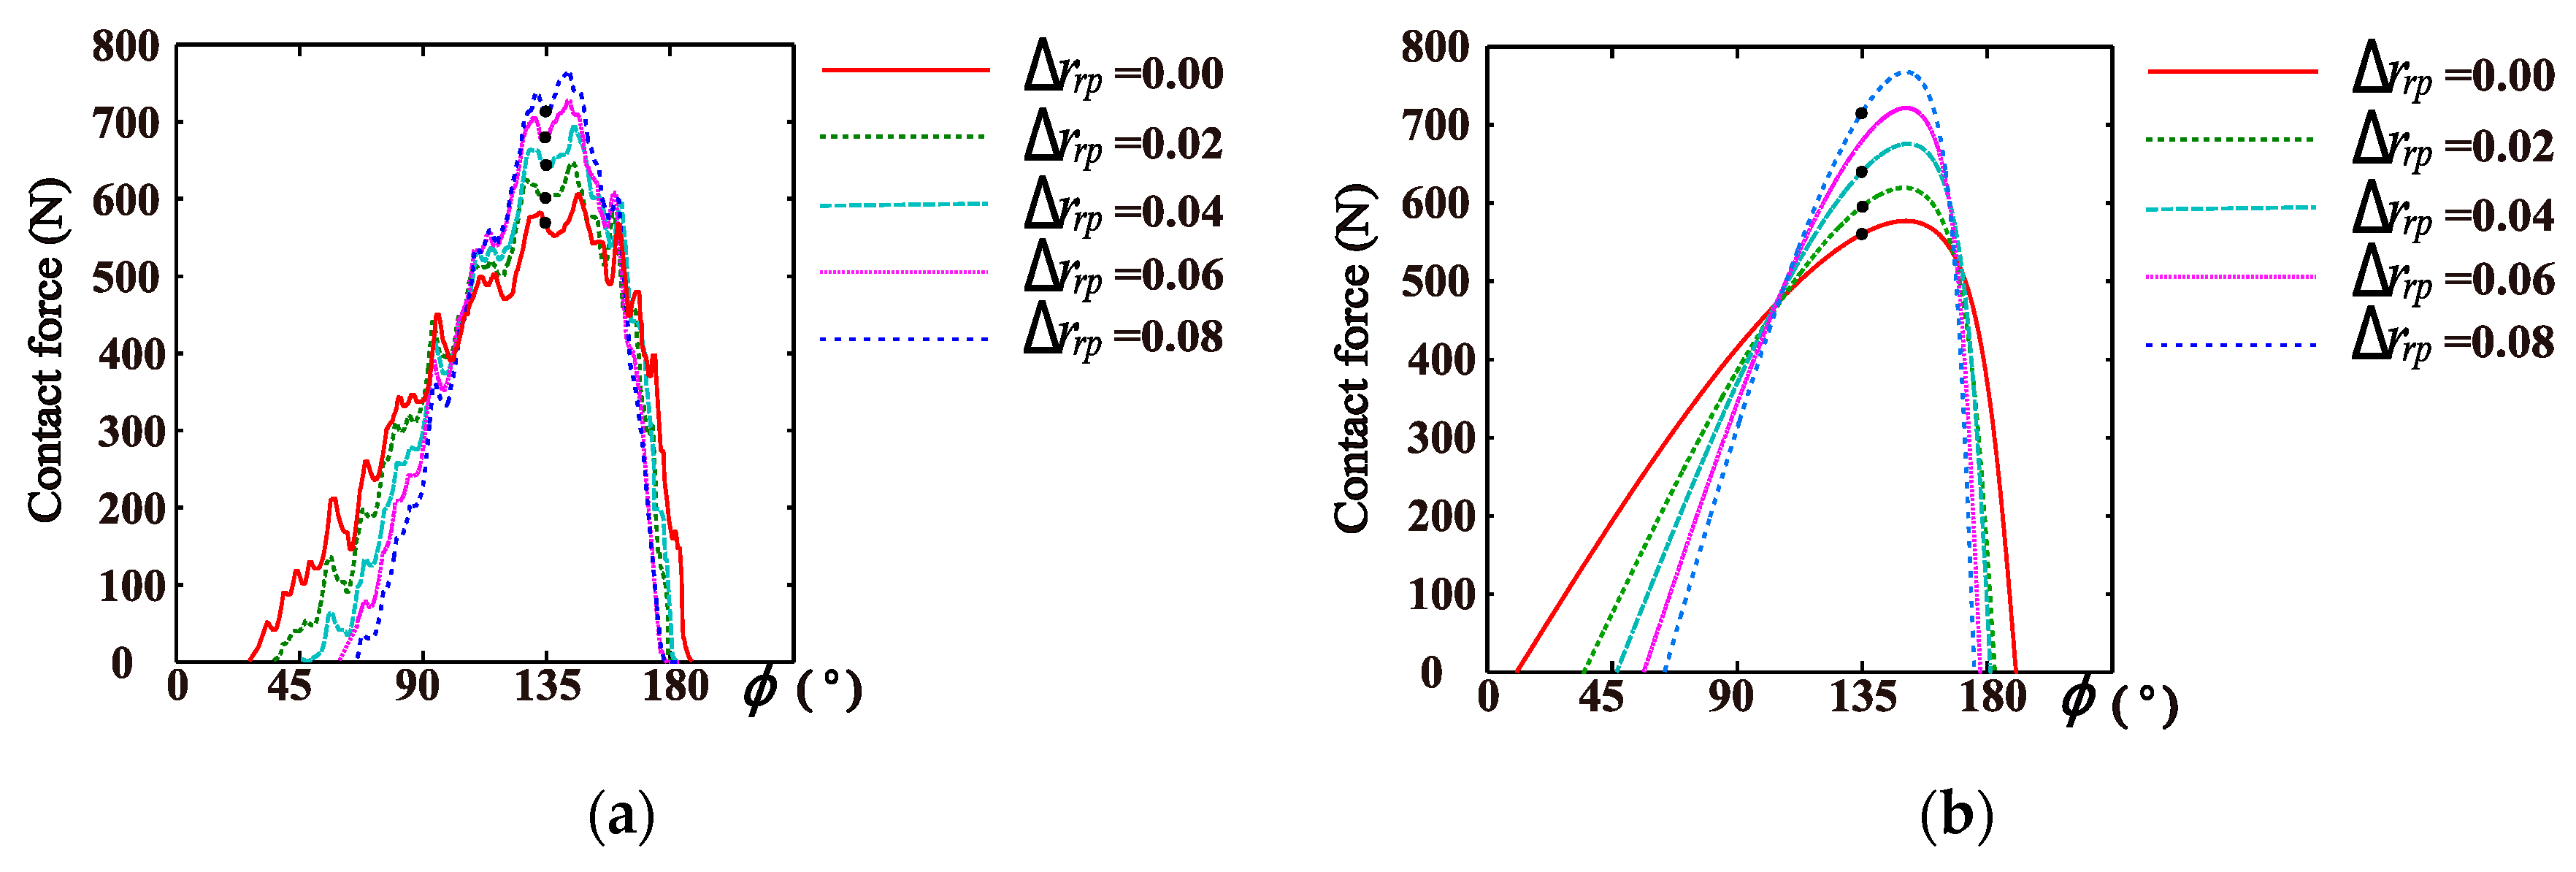
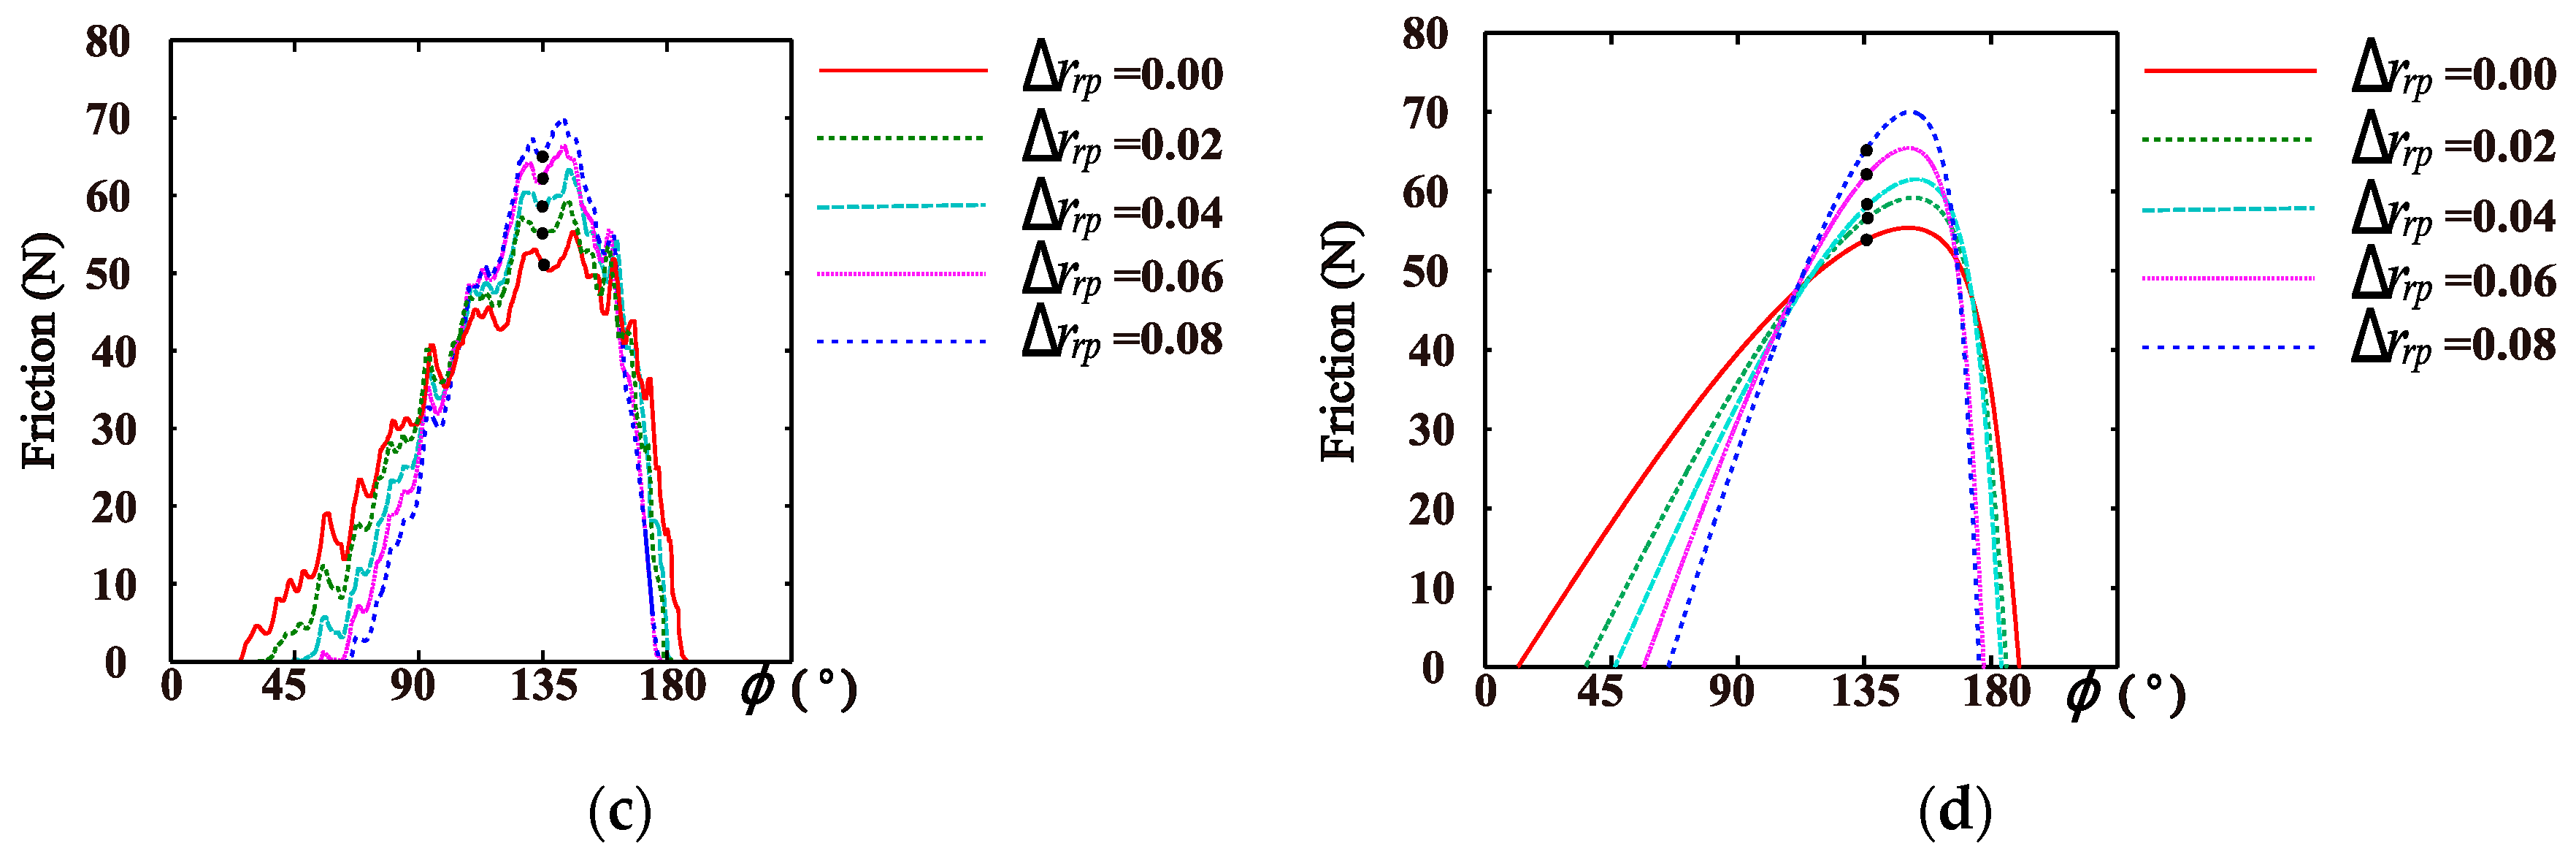
2.1.2. Contact Force Model Verification Using the Finite Element Method

The dynamics simulation model of an RV reducer is established according to the parameters listed in Table 1. This dynamics analysis employs SolidWorks 2017 COSMOS (Dassault Systemes, Paris, France) for modeling and solving. The stress variation of an RV reducer during movement can be calculated using the finite element method (FEM). Figure 5a shows the FE model of an RV reducer, and Figure 5b shows the mesh division model of a cycloid gear and pin wheel. To simplify the simulation model, the pins are fixed on the wheel. In addition, the non-pin wheel can reduce vibrations and stress fluctuations [26]. For consistency with the theoretical model, the influence of the first stage is not considered. The rotation motion is applied to the three cranks individually, and the load torque is applied to the center of the planet carrier. The influence of the bearing is simulated by setting the contact stiffness and damping coefficient at the bearing bore. The impact function is used to calculate the contact force iteratively. According to the lubrication condition of the RV reducer prototype, the static friction coefficient between the relative moving surfaces is set as 0.08, and the dynamic friction coefficient is set as 0.05.
In this study, the total simulation time is 20 s, and the data are obtained from a period of 0.0375–18.075 s. The results indicate that the crank rotates one round, the data are solved at every angle, the interval angle is 1/10°, and the interval time is 0.00625 s. The contact stress on the cycloid tooth surface as the crank rotates 170°, is shown in Figure 6.
To verify the validity of the analytical model for a profile-shifted gear with TPM, Δ r r p = 0 to 0.08 mm is adopted to calculate the contact force and friction which, as obtained through analytical and FE methods, are displayed in Figure 7. The contact force and friction at a rotation angle of 135° are compared, demonstrating the largest differences. The percentage of differences between the analytical method and the FE method are presented in Table 2. The results from the analytical and FE methods are in good agreement.

2.2. Tranmission Error Calculation

2.2.1. Transmission Error Model of RV Reducer

A TE is one of the most important methods used to measure the accuracy of an RV reducer, and is defined as the difference between the theoretical and actual rotation angles of the output shaft as the input shaft rotates at any angle. Because this study focuses on the influence of the cycloid drive in an RV reducer, the angle of the crank is expressed as the input angle. Thus, the TE may be calculated as follows:
θ e i = θ c r i / Z p θ p l i
Here, the upper corner i indicates a certain moment, and the mean value of the TE is the following:
θ ¯ e = 1 n i = 1 n θ e i ,
where n represents the number of data points. In addition, the TE amplitude is calculated as follows:
θ e a = m a x ( θ e i ) m i n ( θ e i )
Because the main factor generating the mean value of the TE is the backlash of the RV reducer, the mean value of the TE can be used to calculate indirectly the backlash of the RV reducer. As the mean value of the TE also includes the contact deformation caused by a tooth engagement, this part can be approximated based on the amplitude of the TE. Additionally, considering that the starting position of the cycloid gear is in the middle of the tooth gap, the backlash of the RV reducer may be approximated as follows:
B 2 θ ¯ e θ e a

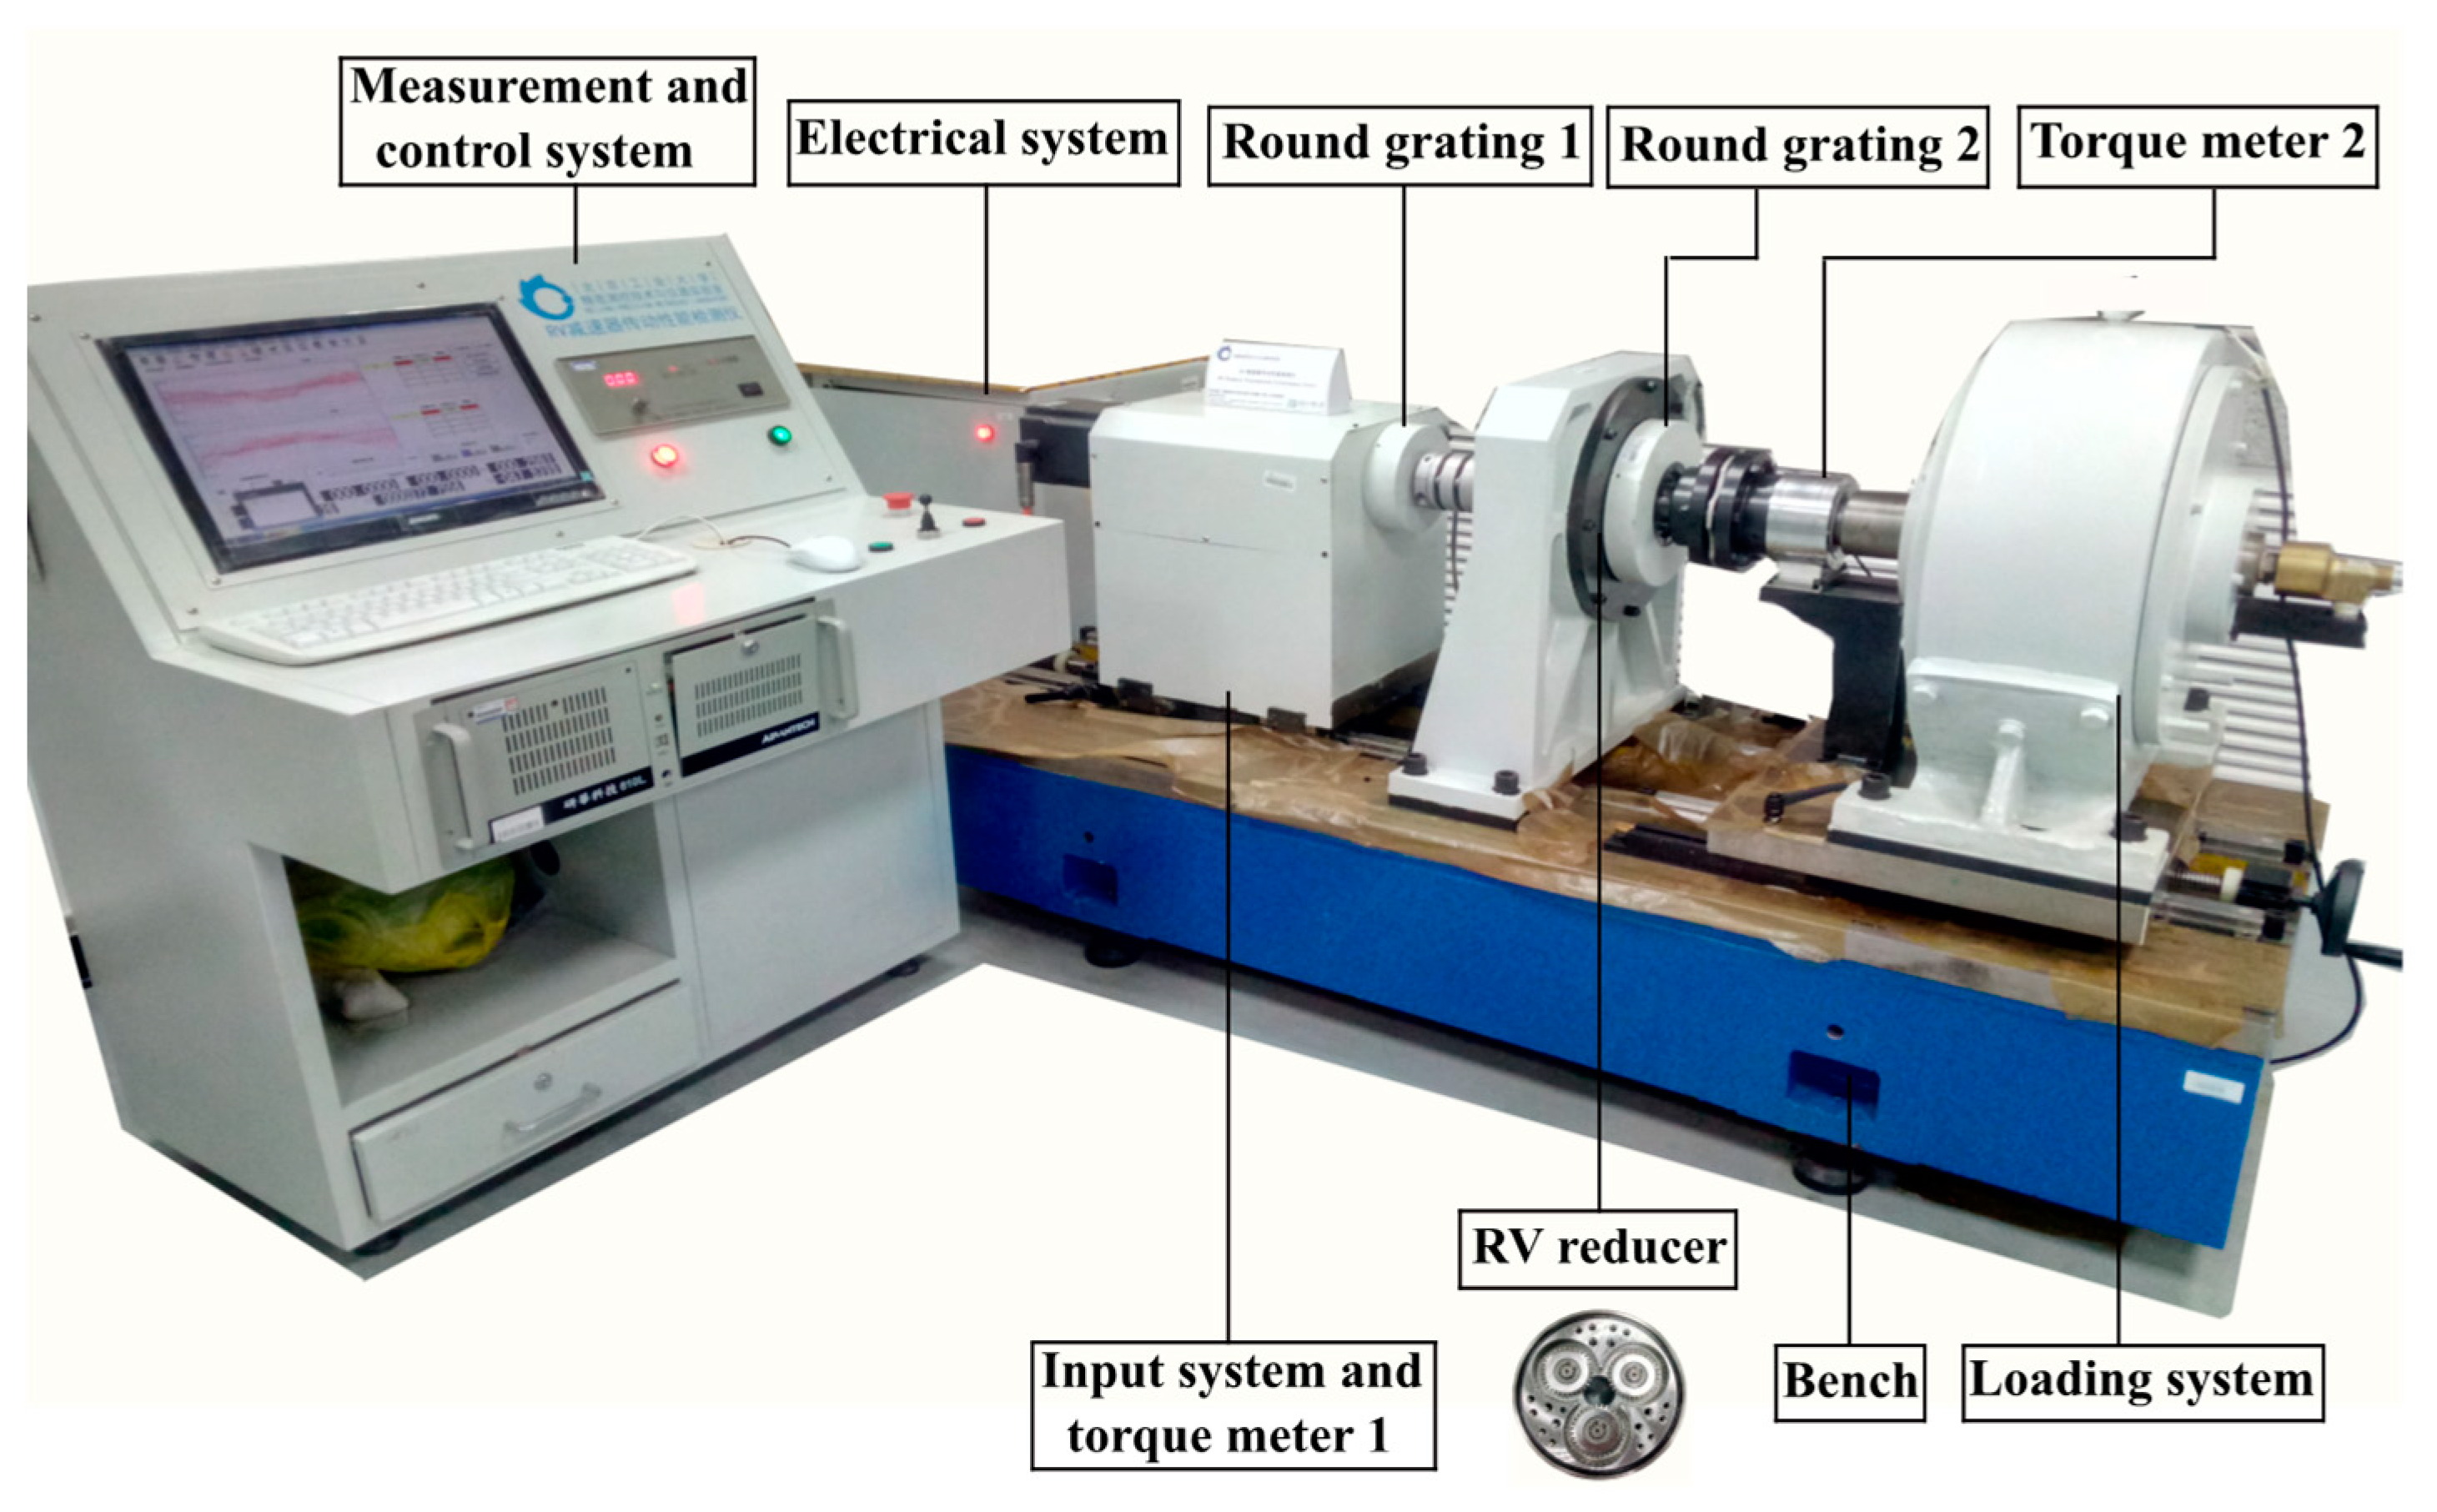
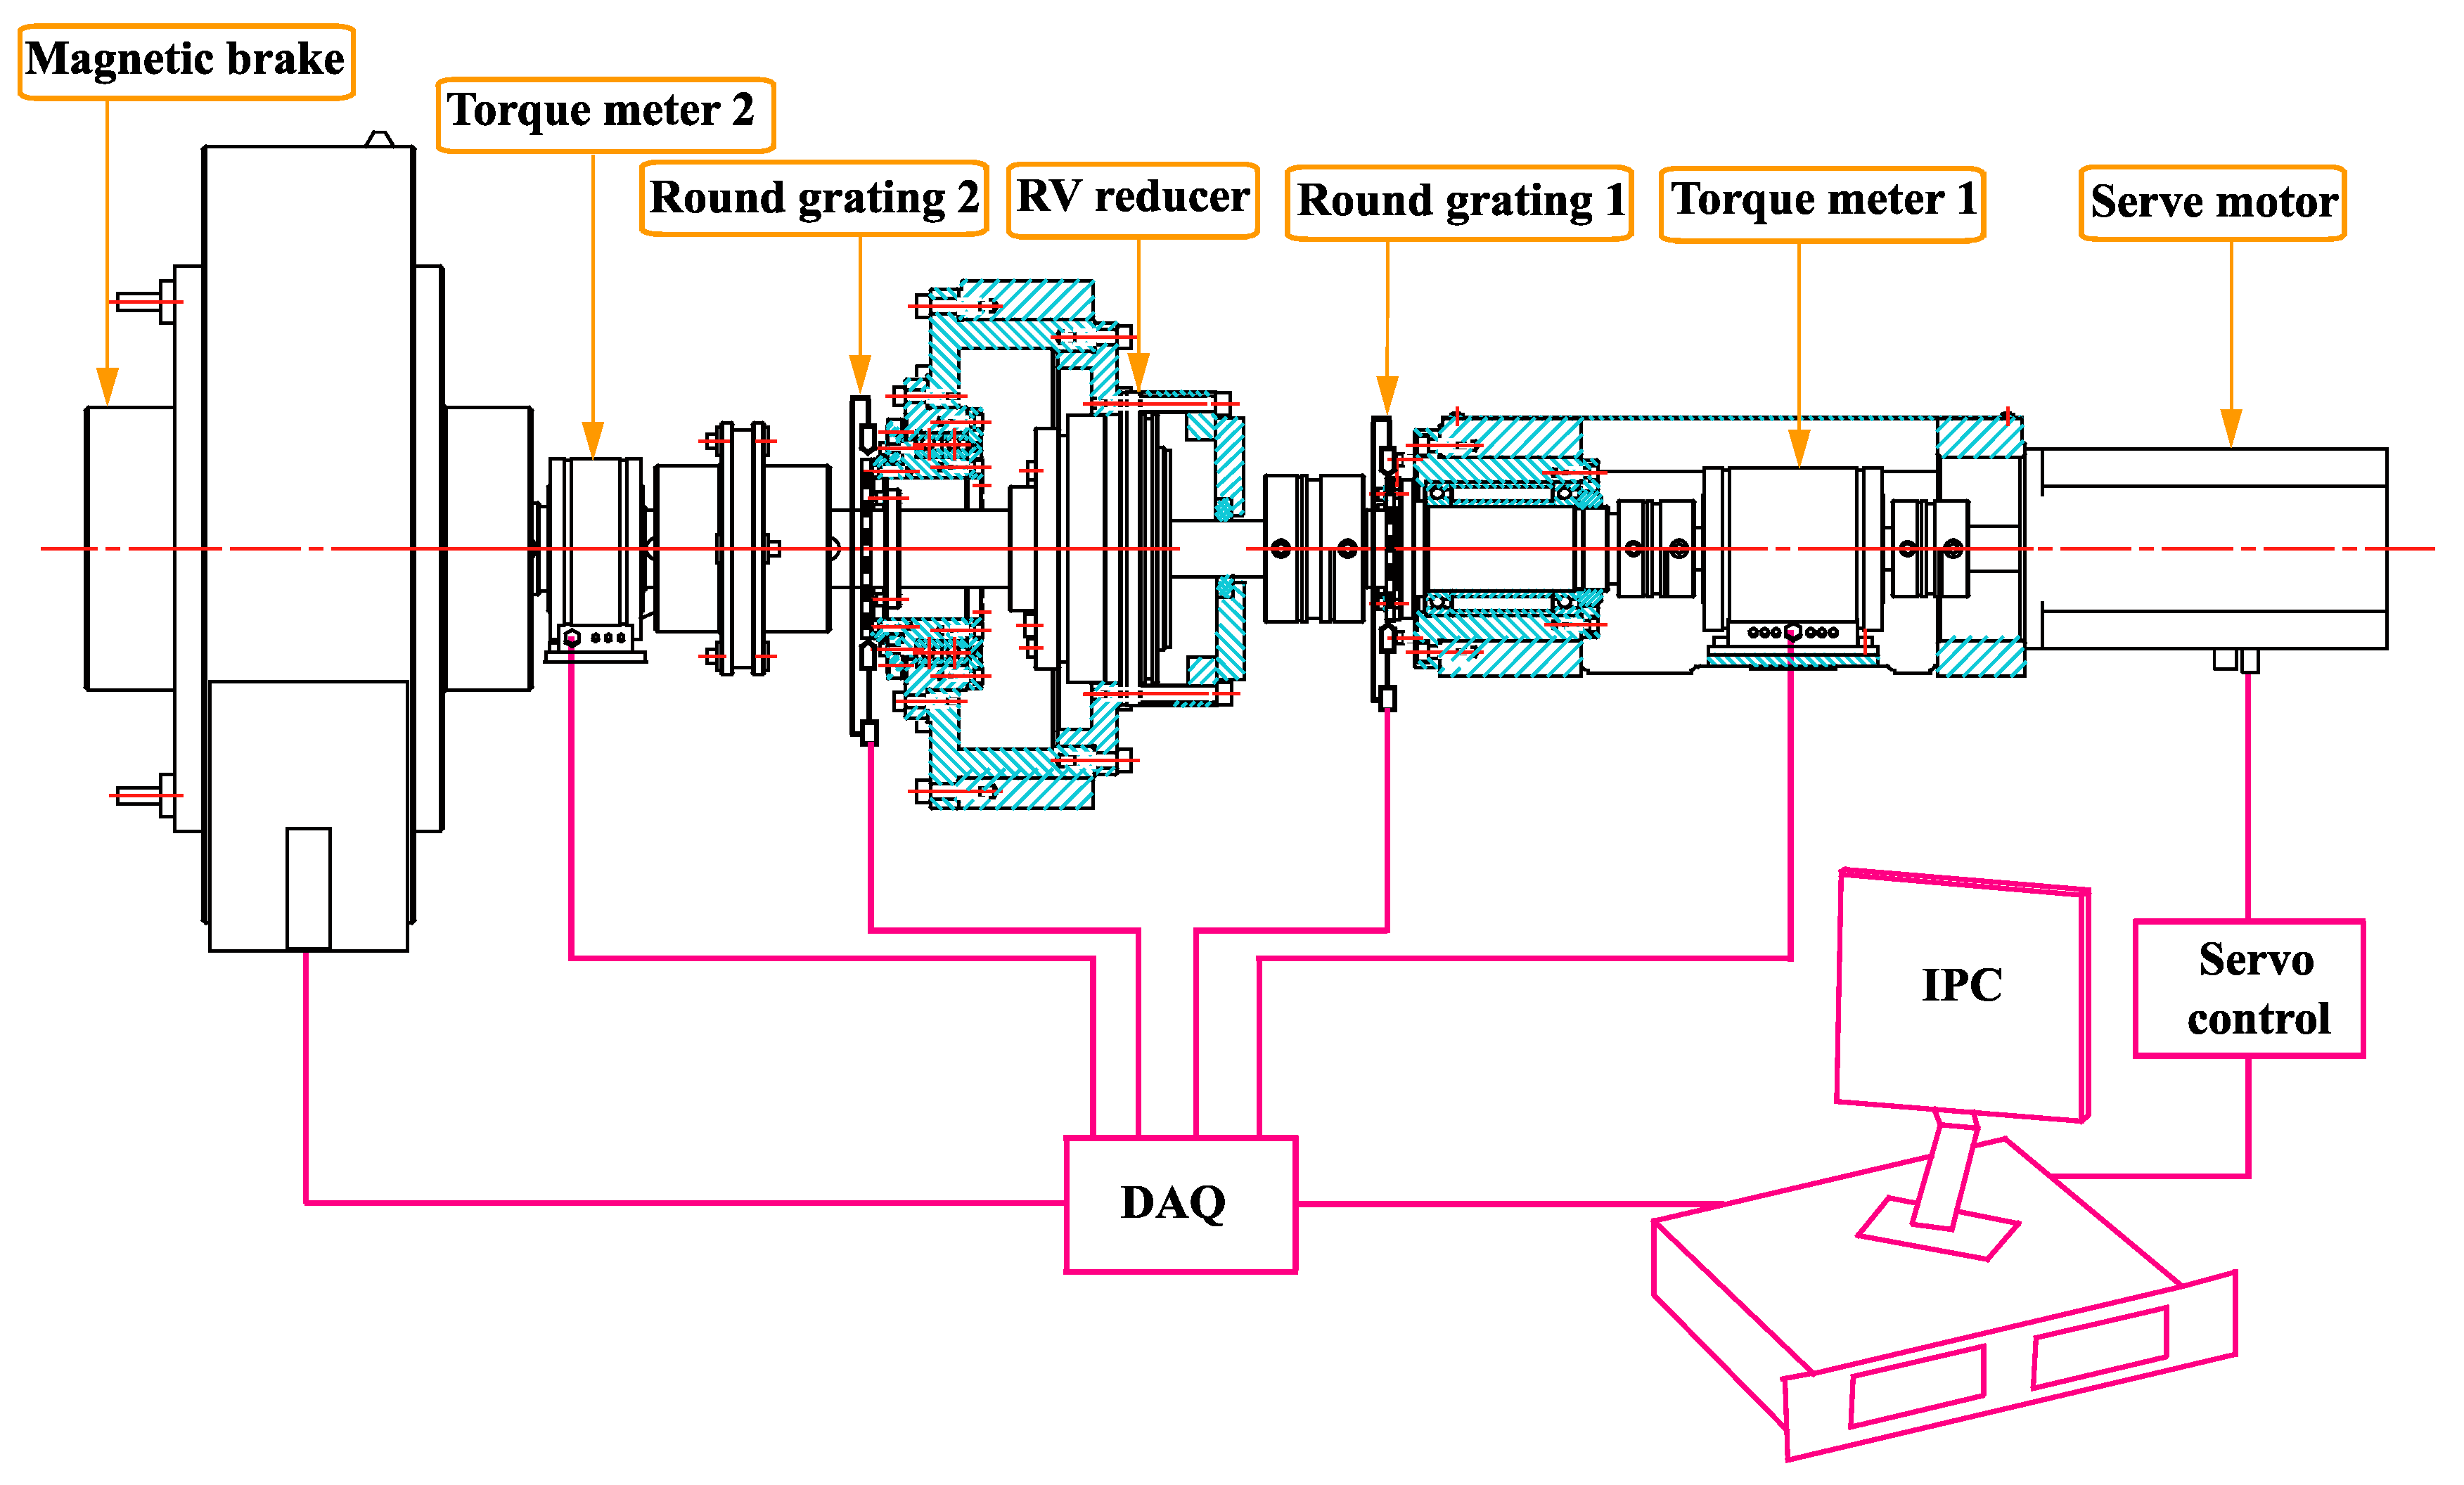
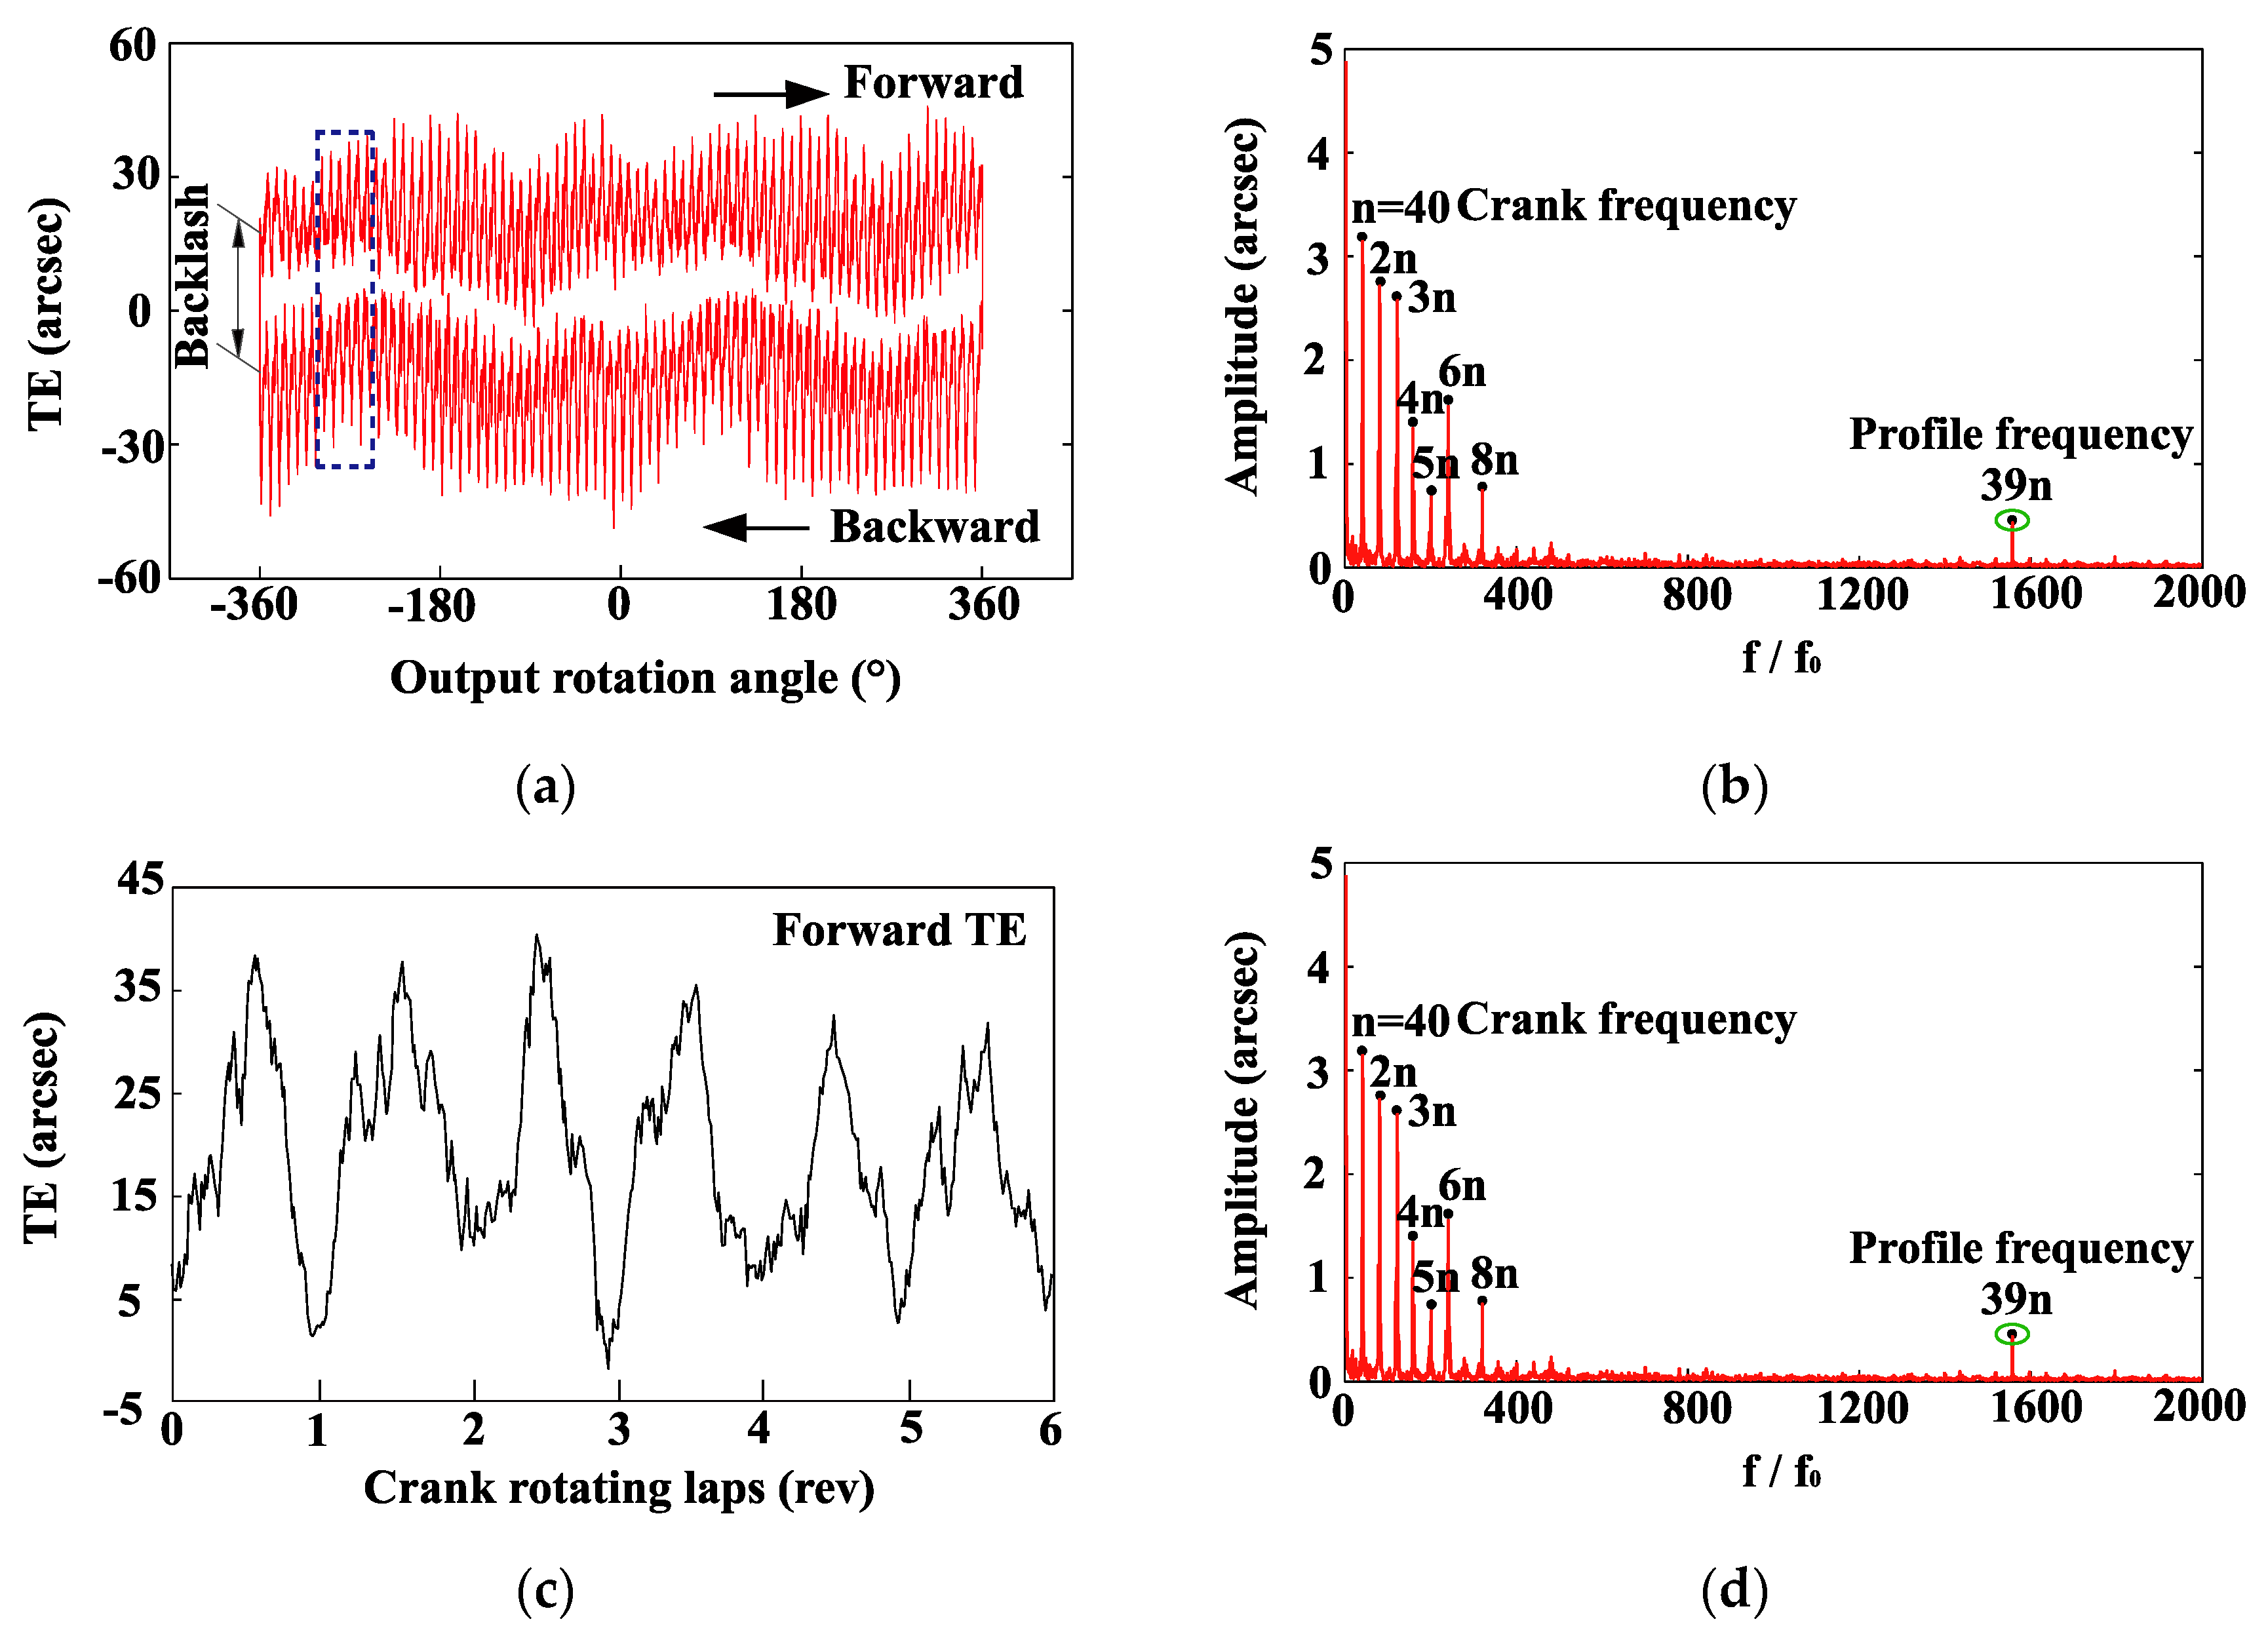
2.2.2. Transmission Error Measurement Experiment

A physical prototype of an RV reducer is produced according to the parameters in Table 1. Several tests were conducted to measure the transmission performance of the RV reducer prototype to validate the analytical model. These tests were conducted on a rig composed of a servo motor, two torque meters to measure the input and output torque, two round gratings to measure the input and output rotation angles, the tested reducer, and a magnetic brake acting as a load equipment. The rated torque of the magnetic brake is 2000 N·m. The test rig is shown in Figure 8. The control system is shown in Figure 9. The input and output round gratings are mounted on the end of the RV prototype. To avoid the influence of eccentricity on the accuracy of the output grating, the thin reed structure is adopted to connect the output shaft and the round grating. The measurement accuracy of the test rig is 2 arcsec. The output shaft of the RV reducer was loaded to 784 N·m using a magnetic brake. The parameters of the sensors are listed in Table 3.
The forward and backward TEs were tested in one loop to obtain the backlash of the RV reducer. Moreover, the TE in one direction was tested twice continuously to verify the repeatability of the test results. It can be seen from Figure 10a that the TE is consistent. The backlash of the RV prototype is 31.03 arcsec. In addition, the analytical backlash is 28.12 arcsec, as calculated using Equation (29), which is smaller than the experimental value because small influencing factors are ignored. The forward transmission error is 40 arcsec, and the backward TE is 42 arcsec. Figure 10b shows the harmonic spectrum of the forward TE as the output shaft rotates one round. Figure 10c,d show an enlarged view of the forward and backward TEs, respectively, as the cranks rotate six rounds.
As the cranks rotate one round, the TE curves generate a large peak. There are 40 main peaks as the output shaft rotates one round, which is the same as the crank rotation period. This fully demonstrates that the cycloid drive is the main factor affecting the transmission performance of the RV reducer, which also indicates the correctness of the simplified model. Most of the other harmonics are multiple frequencies of the cranks, as shown in Figure 10b. The details of the main harmonic components are listed in Table 4. Because the cycloid gear generates 39 meshing cycles in one crank revolution, it can be concluded that the 1560th harmonic is caused by the cycloid tooth profile [27]. The TE amplitude is 0.47 arcsec, whereas the analytical result is 0.49 arcsec. The percentages of differences between the analytical method and the test results are presented in Table 5. The analytical and test results are in good agreement.

2.3. Transmission Efficiency

Because an RV reducer is a type of precision drive, the loss of the rotation angle is extremely small. The rotation angle loss can then be neglected, and only the torque loss owing to the friction torque is used to calculate the transmission efficiency. Because the friction loss of a bearing and load independent power loss is not the scope of the present study, it is not considered herein [28]. Therefore, the efficiency of the RV reducer is defined as follows:
η c = 1 T f T o ,
where T f is the friction torque of the cycloid gears, which can be calculated as follows:
T f = 2 i = m 1 m 2 ( F f i x · y p i + F f i y · x p i )

2.4. Contact Ratio

In theory, half of the cycloid teeth without a TPM will participate in the meshing simultaneously. However, because the cycloid profile will be thinned with a TPM, which inevitably reduces the meshing area, in order to study the variation in the meshing area caused by a TPM the contact ratio is defined, which may be calculated using the ratio of the actual meshing area length with the cycloid profile length of a single tooth. The contact ratio may be expressed as follows:
R c = l c l 0

3. Effects of Modification Coefficients and Load

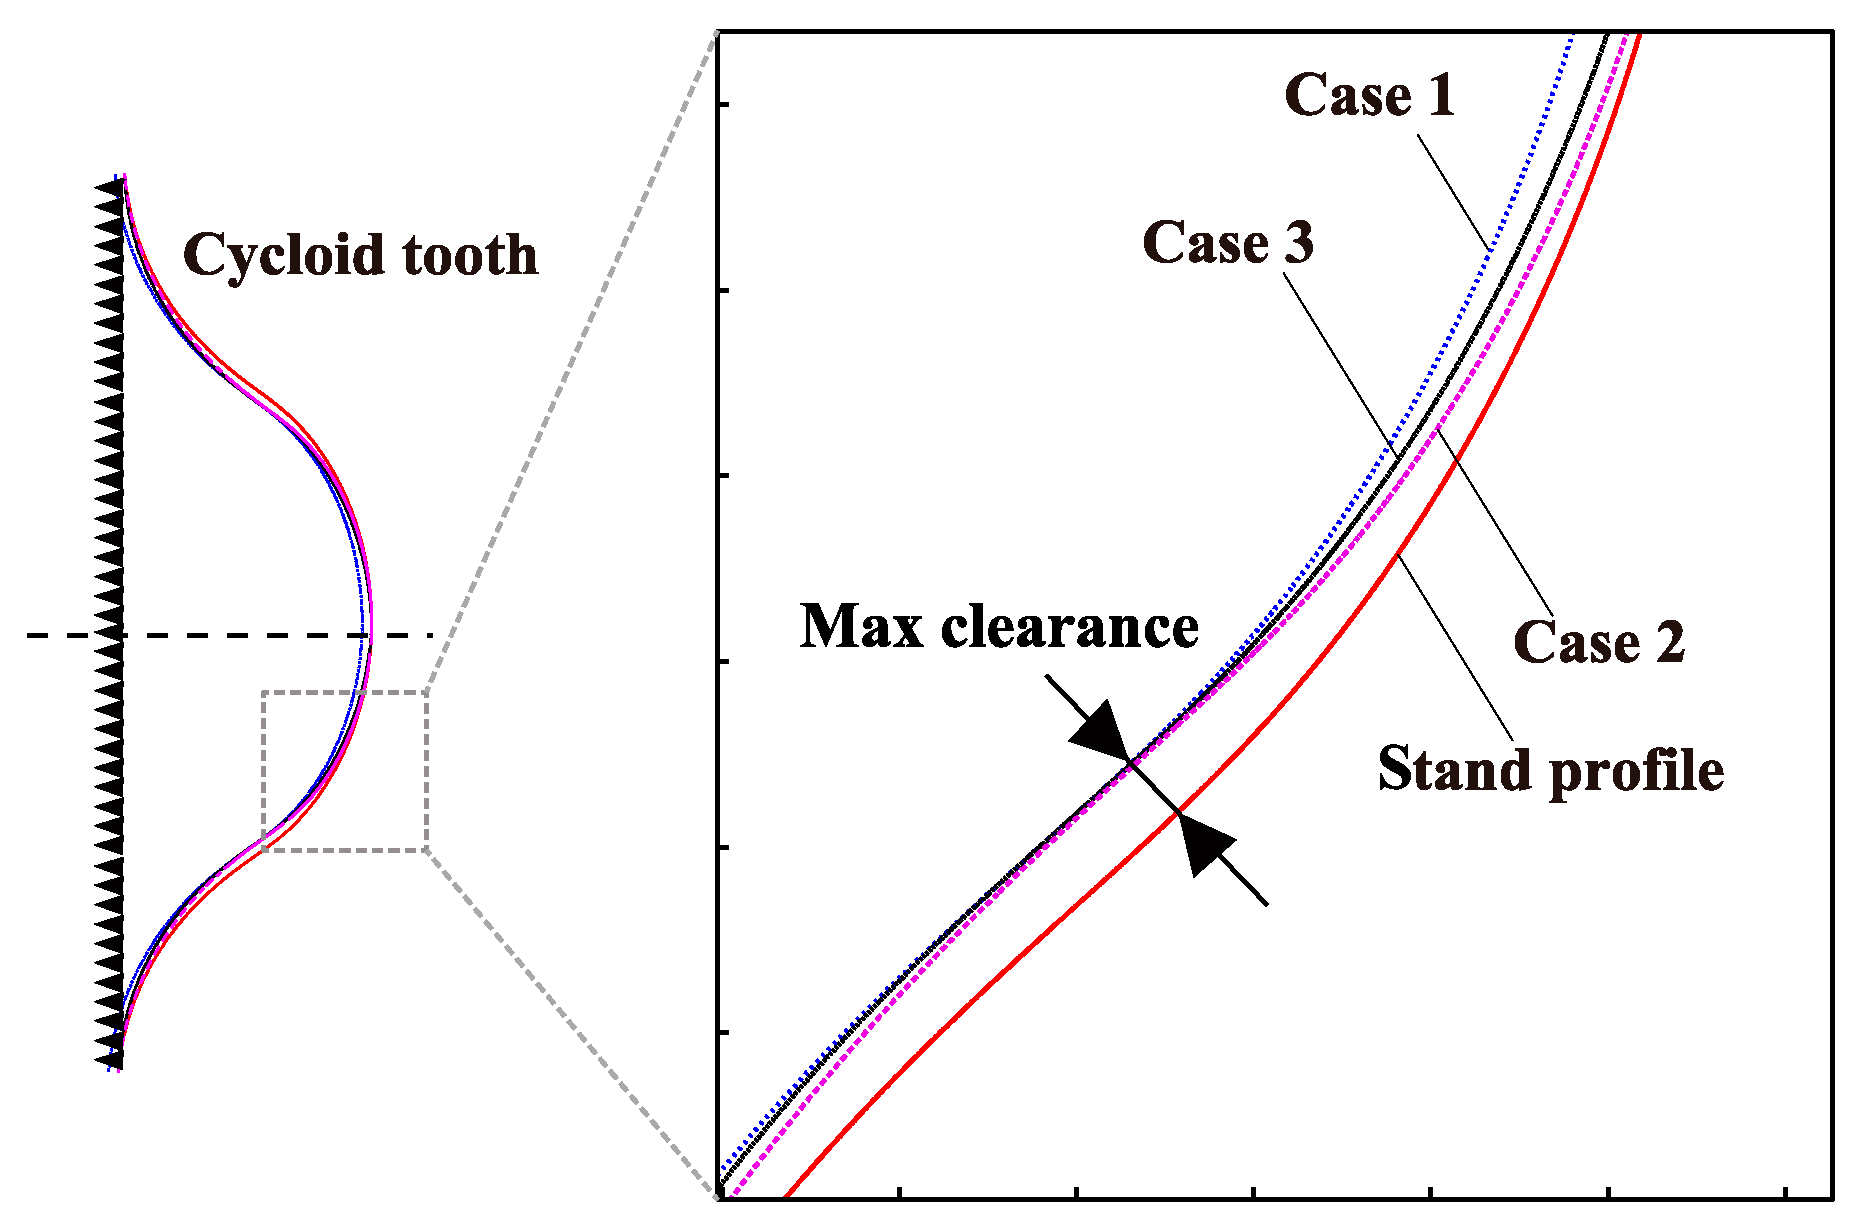
3.1. Tooth Profile Modification Method

We applied three modification methods in this study. The first two methods are commonly used in engineering when forming a modification profile by changing the modification coefficients Δ r r p and Δ R p . The cycloid profile of these two methods can be obtained using Equation (1).
Case 1: Modification by fixing coefficient Δ r r p
The modification coefficient Δ r r p is a constant in the case 1 method, which focuses on the impact of the modification coefficient Δ R p on the RV reducer.
Case 2: Modification by changing coefficients Δ r r p and Δ R p with the same value
In the case 2 method, the modification coefficients Δ r r p and Δ R p are changed simultaneously to the same value.
Case 3: Modification based on traditional contact force formula
The case 3 method is based on the characteristics of the contact force distribution along the cycloid profile, which uses the contact force curves as the modification curves. The case 3 method is defined as the reverse modification method in this study. The inverse modification curve is obtained using the traditional contact force formula of a cycloid gear [29]. The contact force of a cycloid profile may be calculated as follows:
P i = 2 M S 1 2 s i n θ i K Z c R p ,
where M is the load torque on the output shaft in the formula, but is a dimensionless coefficient used to obtain different modification curves in this study.
In a cycloid gear coordinate system, the modification amount is as follows:
{ x s i = P i cos ( ψ i φ ) y s i = P i sin ( ψ i φ )
Then, the reverse modification cycloid profile is obtained as:
{ x f i = x i x s i y f i = y i y s i ,
where, x i and y i are the stand cycloid profile coordinates in Equation (1).
Then, the initial tooth gap caused by a TPM using the case 3 method may be calculated as follows:
E i ( θ i ) = x s i 2 + y s i 2
The modification parameters of the three methods are listed in Table 6 based on the same maximum clearance of 0.012 to 0.105 mm. In addition, the TPM profiles with the same maximum modification gap are shown in Figure 11. To investigate the load effect, the transmission performances of an RV reducer under three load conditions were calculated respectively, including one to three times rated output torque.
The transmission performance of an RV reducer includes three main aspects. The first is the transmission accuracy, which can be measured based on the amplitude and mean value of the transmission error. The second aspect is the mechanical performance, including the maximum normal contact force and maximum friction on the cycloid profile, which is obtained using the improved contact force formula proposed herein. The third aspect is the change in contact ratio and transmission efficiency.

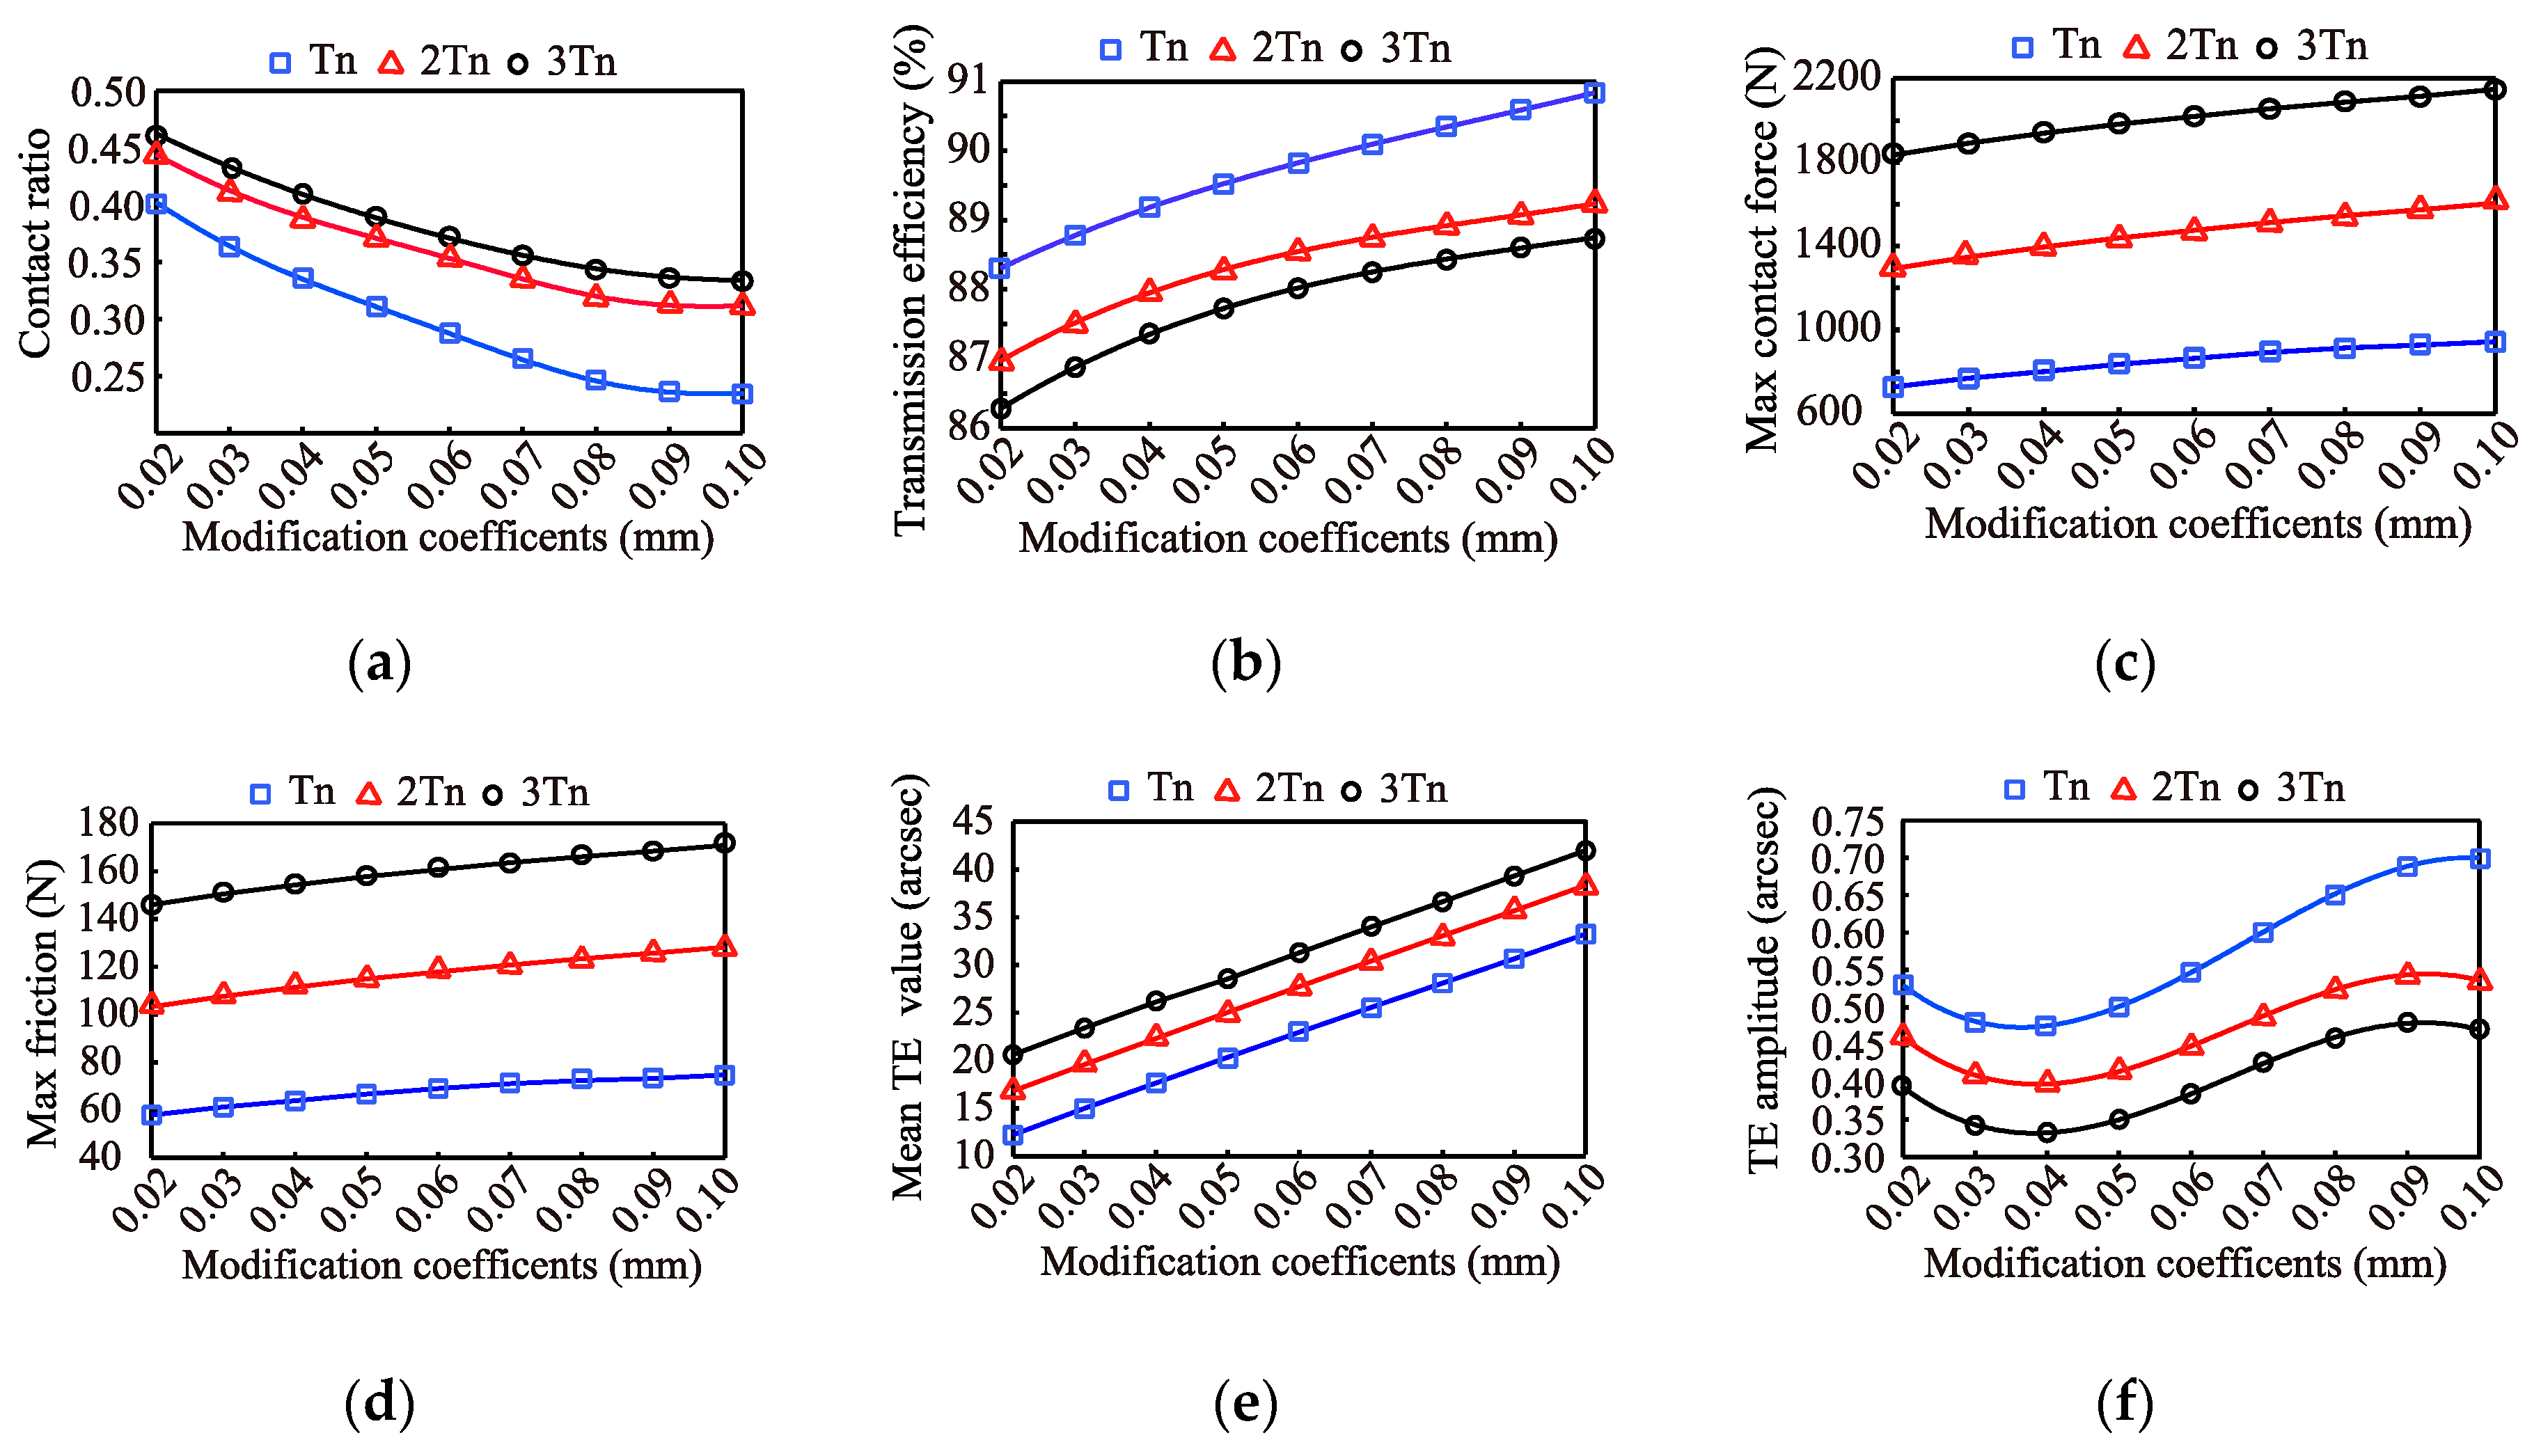
3.2. Influence of Load for Case 1 Modification Method

Changes in the transmission performance metrics of an RV reducer were obtained using the case 1 modification method, as shown in Figure 12. As can be seen from Figure 12a, an increase in the TPM significantly reduces the contact ratio. However, as the torque load increases, this effect is effectively reduced. Contrary to the changing trend of the contact area shown in Figure 12a, a TPM will increase the transmission efficiency of the RV reducer. The smaller the load torque, the more obvious the increase in transmission efficiency, as shown in Figure 12b. As can be seen from Figure 12c,d, the TPM increases the maximum contact force and friction. Under different torque load conditions, the change trend is basically the same. At the same time, the TPM will increase the mean value of the TE, as shown in Figure 12e. However, when the amount of modification is less than 0.04 mm, the TPM reduces the amplitude of the TE. When the amount of modification is greater than 0.04 mm, the TPM will increase the amplitude of the TE, as shown in Figure 12f.

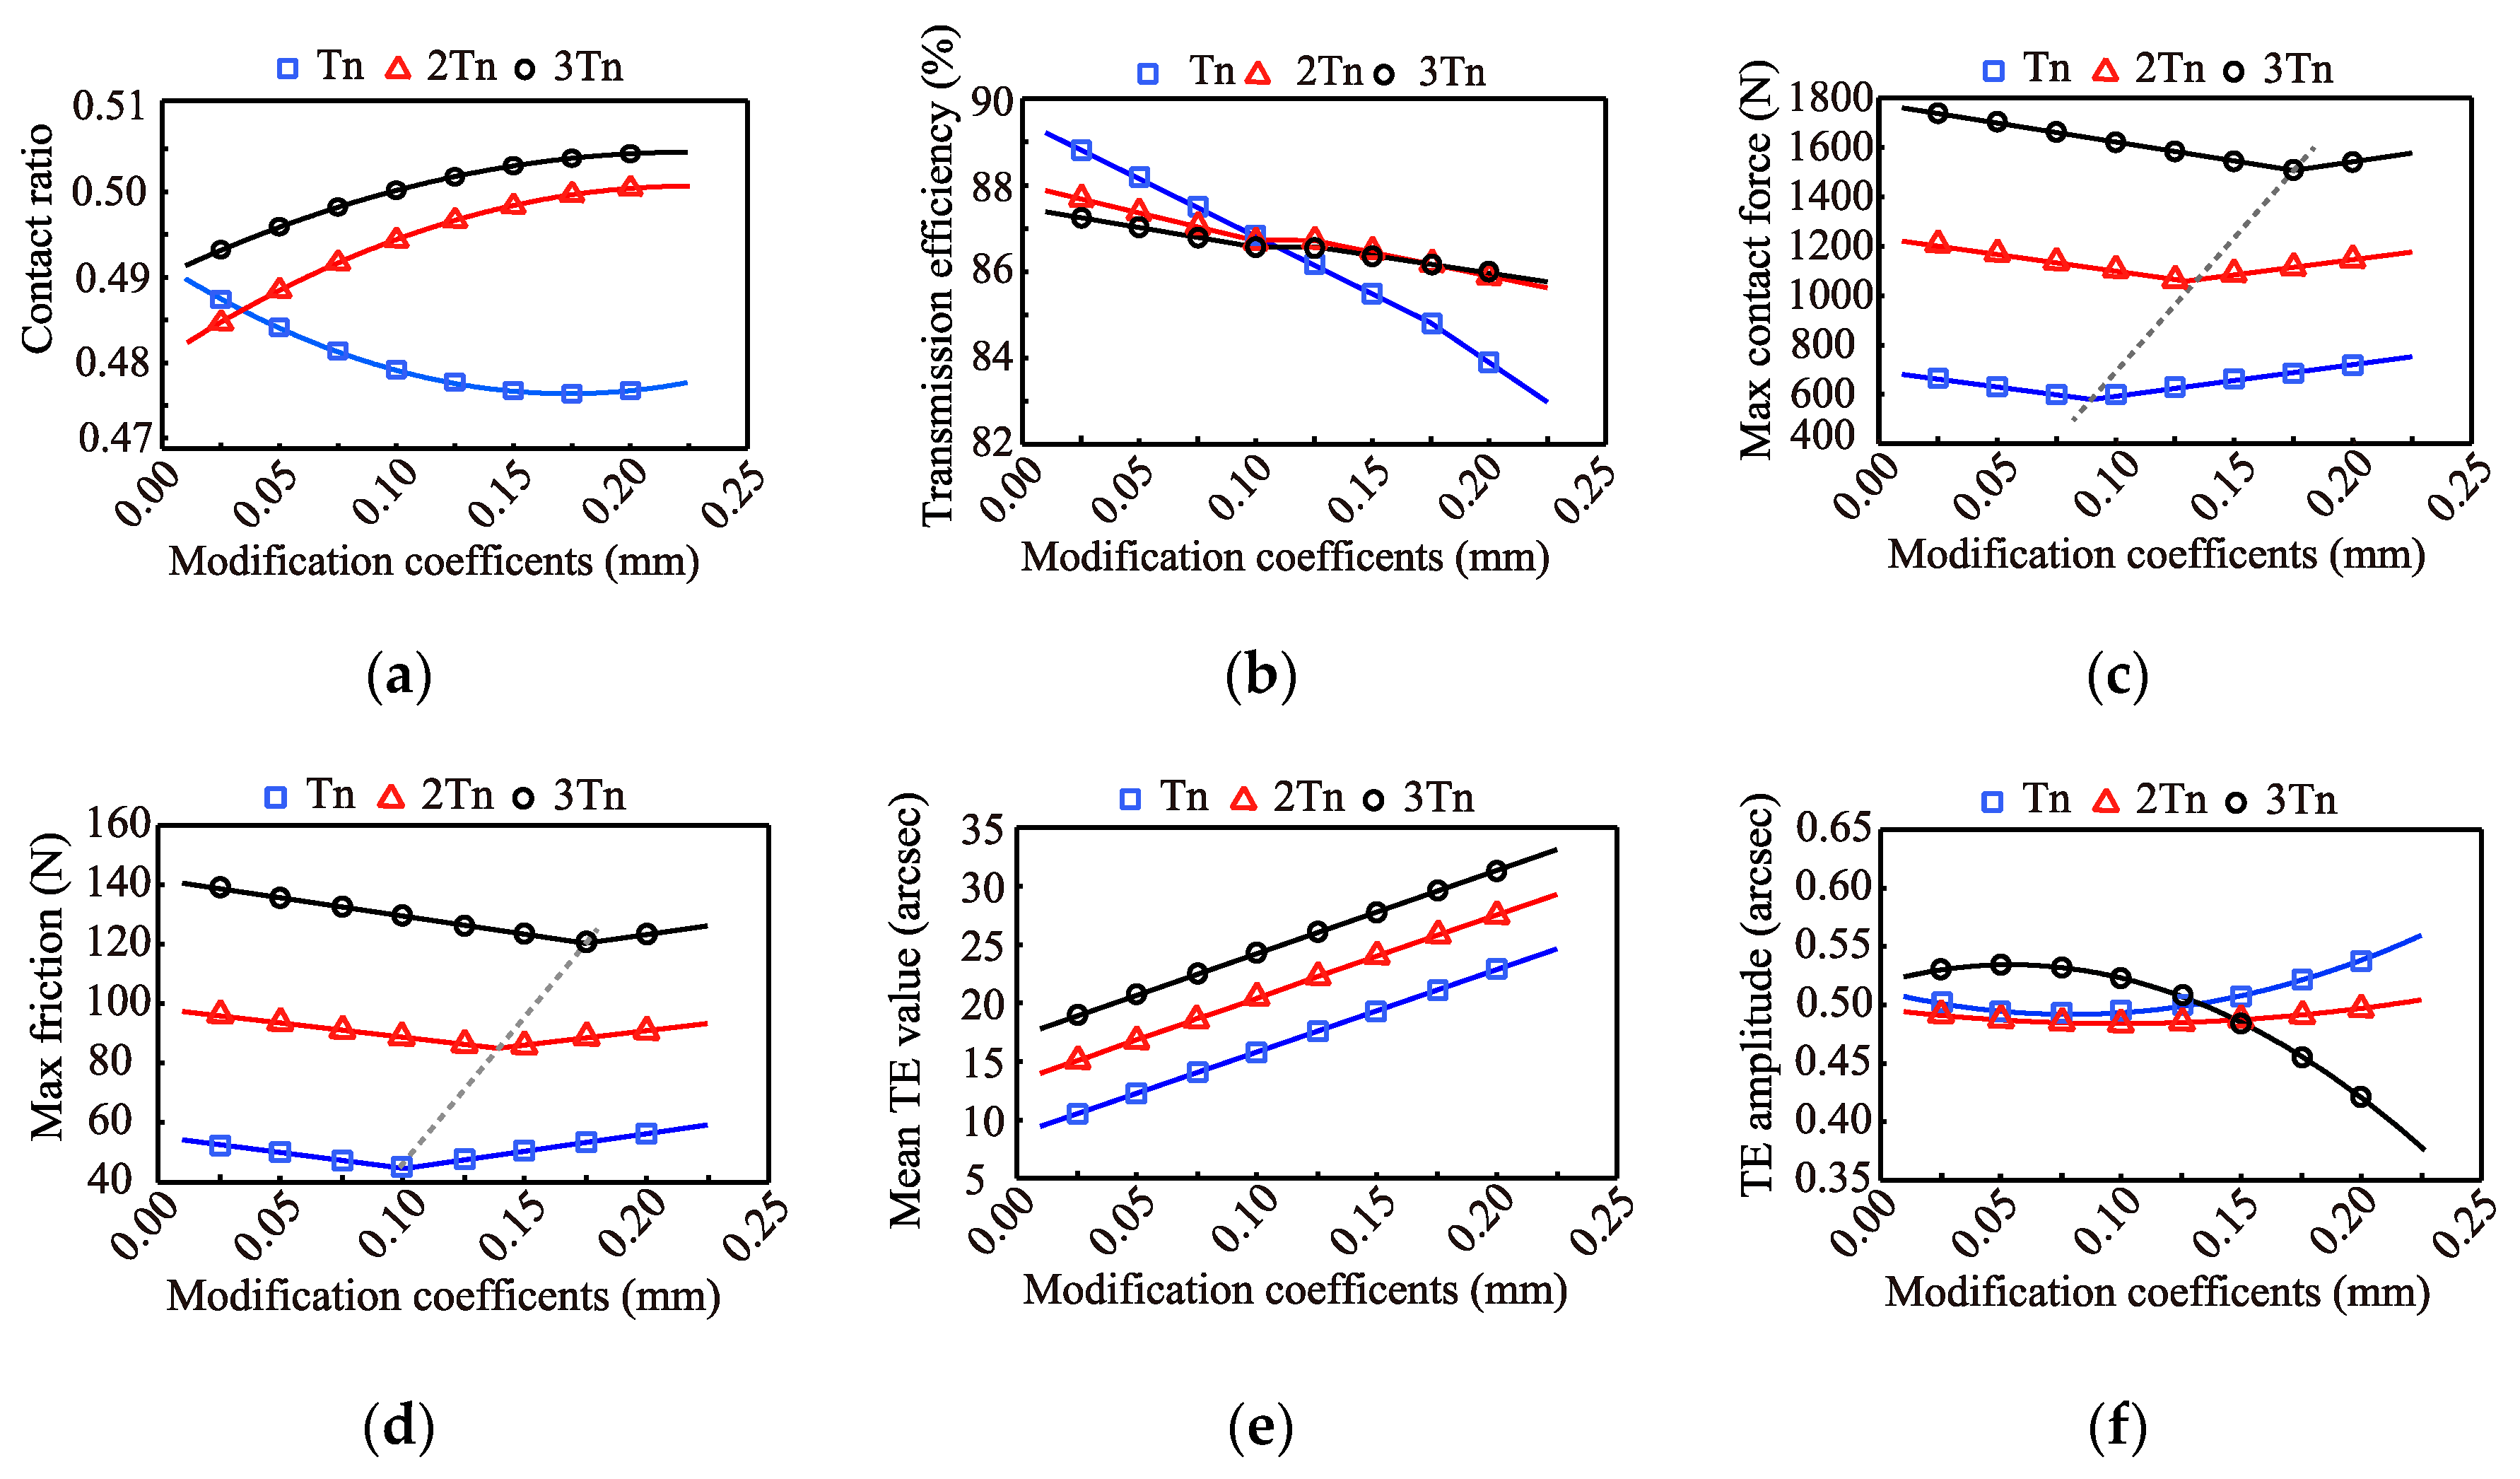
3.3. Influence of Load for Case 2 Modification Method

Changes in the transmission performance metrics of an RV reducer are obtained using the case 2 modification method, as shown in Figure 13. It can be seen from Figure 13a that the meshing area under the rated output torque is reduced as the modification amount increases. However, as the load torque is increased to twice and three-times the rated torque, the meshing area increases slightly rather than declining. It can be concluded that the TPM does not always reduce the meshing area of the tooth profile but is also affected by the load conditions. However, as can be seen from Figure 13b, the increase in the TPM causes the transmission efficiency to decrease. This means the TPM will increase the friction torque, and the smaller the load torque is, the faster the transmission efficiency will decrease. In Figure 13c, the torque load significantly increases the maximum value of the contact force and friction. However, the TPM causes the contact force and friction to decrease first, and then increase at a certain value of modification. Moreover, as can be seen from Figure 13c,d, the turning point is related to the load torque.
Although the TPM increases the mean value of the TE, as shown in Figure 13e, the amplitude of the TE does not always increase with the TPM, particularly in the case of large loads. The results obtained in [9] also show that, if variables for compound modification are appropriately selected, a larger value of modification can still acquire smaller kinematic errors. It can be seen from Figure 13f that when the modification amount is less than 0.125 mm, the TPM has little effect on the amplitude of the TE. When the modification amount is larger than 0.125 mm, the TPM causes the amplitude of the TE to significantly decrease at three-times the rated load. In addition, the amplitude of the TE at the rated torque and at twice the rated torque is slightly increased.

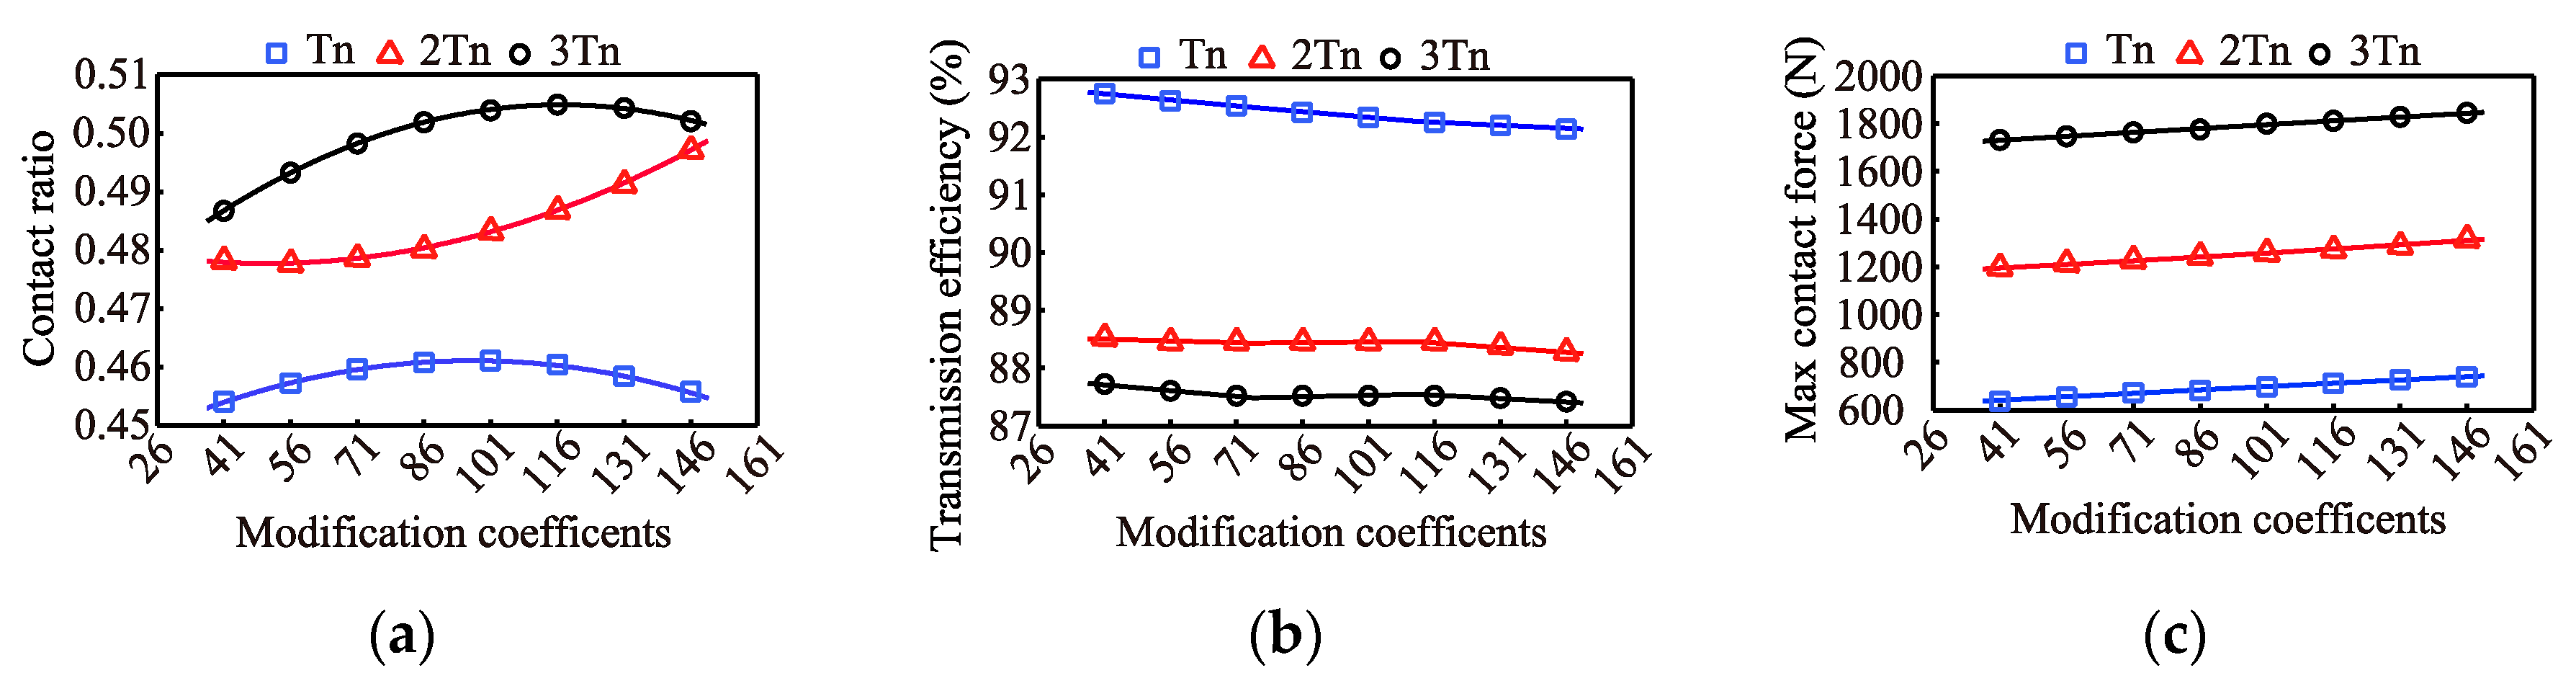
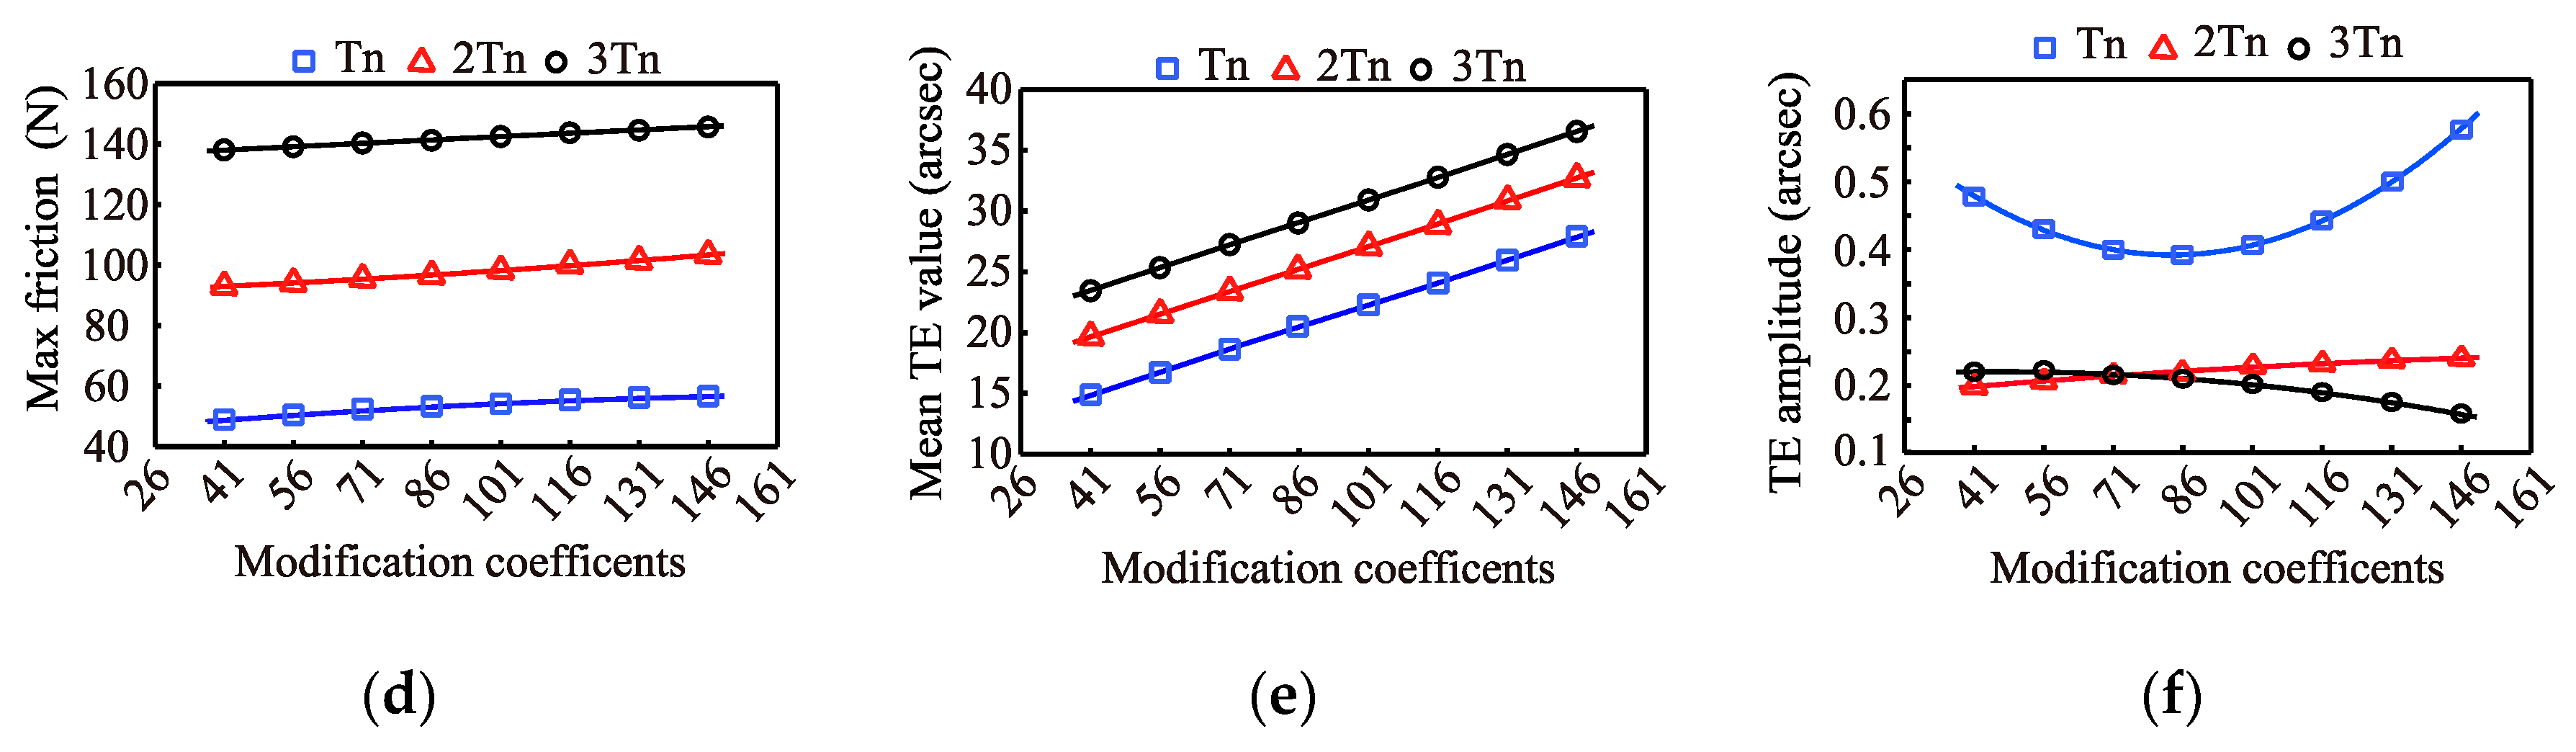
3.4. Influence of Load under Case 3 Modification Method

Compared with the previous two traditional compound modification methods, the load effect on the transmission performance using the case 3 method is specific. As can be seen from Figure 14a, the changing trend is basically the same as under both the rated load and thrice the rated load. However, the TPM will cause an opposite changing trend at twice the rated load. Under the rated load torque, the contact area is the largest when the modification coefficient is 101. With the increase in the TPM, the meshing area is significantly increased at twice the rated load. For large load conditions, such as twice and thrice the rated load, the TPM has little effect on the transmission efficiency, as shown in Figure 14b. However, the TPM slightly reduces the transmission efficiency at the rated load. It can be seen from Figure 14c,d that, similar to the case 1 and case 2 methods, the TPM increases the maximum contact force and friction. As can be seen from Figure 14e, the influence of the TPM on the mean value of the TE is linear, as is the influence of the load. However, when the modification coefficient is 86 at the rated torque, the amplitude of the TE is minimized, as shown in Figure 14f. The TPM causes the TE amplitude to increase slightly at twice the rated load. In addition, the TE amplitude is slightly reduced at three times the rated load.

4. Discussion

To determine the optimal profile of the modification methods used for different applications, the changes in the mean value and amplitude of the TE, the contact ratio, the maximum contact force, the friction, and the transmission efficiency of the three kinds of modification methods are compared. The TPM increases the mean value of the TE linearly under the three load conditions using the proposed three modification methods. However, the mean value of the TE is at minimum when using the case 2 method as compared with that of the other two methods. In addition, the mean value of the TE is the largest when using the case 1 method. However, under large load conditions, the amplitude of the TE is the smallest when using the case 3 method. Moreover, the case 1 method will reduce the contact ratio significantly from 0.38 to 0.24 under the rated load condition, although the contact ratio changes slightly when using the case 2 and 3 methods. The maximum contact force and friction have a changing point when using the case 2 method. Moreover, the TPM has little effect on the maximum contact force and friction when using the case 3 method, although the effect is significant when using the case 1 method. Although the first two modification methods will affect the transmission efficiency significantly, the case 3 method has a slight effect on the transmission efficiency, with a change of only 92.8% to 92.1% under the rated load condition. Therefore, it can be concluded that the case 2 and 3 modification curves are better than that of the case 1 method in terms of the contact force and transmission accuracy. However, under large load conditions, such as twice the rated load, the case 3 method may be the optimal profile modification method compared with the case 2 method. This is because the case 3 method can maintain a good transmission performance with an increase in the load and modification coefficient.

5. Conclusions

Owing to the multi-tooth contact that occurs in an RV reducer, the results calculated using a traditional contact model with a single contact stiffness will be inaccurate. Therefore, a new multi-tooth contact model and a transmission error model of an RV reducer were proposed to analyze the influence of the tooth profile modification and load on the transmission accuracy, mechanical properties, and transmission efficiency. The following conclusions were drawn:
(1)
The accuracies of the contact force model and the transmission error model were validated by comparing the calculation results of the FEM and the test results of the RV reducer prototype, respectively.
(2)
In general, a tooth profile modification and load have a comprehensive effect on an RV reducer. Both the modification and load increase the mean value of the transmission error, although the appropriate modification amount can be selected to minimize the amplitude of the transmission error under different loads. With modification method 2, the contact force and friction can be minimized under the optimal modification amount, which increases linearly with the load. When the load is large, increasing the modification amount will increase the contact ratio for modification methods 2 and 3.
(3)
Modification method 1 will significantly reduce the contact ratio and increase the contact force, although the friction torque will be reduced, thus improving the transmission efficiency. In general, modification method 2 achieves a good performance and is suitable for common modification occasions. The transmission efficiency and contact ratio of modification method 3 are almost unaffected by the modification, and thus the method is suitable when a large clearance and load are needed.
The multi-tooth contact model presented here can also be applied to various profile modification methods. Moreover, this research can serve as a fundamental for both the analyses of the transmission characteristics of the RV reducers, and further investigations of the rigidity and strength of the RV reducers.

Author Contributions

Conceptualization, Z.-Y.S. and H.W.; methodology, Z.-Y.S. and H.W.; validation, B.Y. and H.W.; formal analysis, H.W.; data curation, H.X.; writing—original draft preparation, H.W.; writing—review and editing, H.W. and B.Y.; funding acquisition, Z.-Y.S. and B.Y.

Acknowledgments

This research was supported by the National Natural Science Foundation of China (No. 51805011, 51635001), and the National High Technology Research and Development Program 863 of China (No. 2015AA043002).

Conflicts of Interest

The authors declare no conflict of interest.

References

  1. Pham, A.D.; Ahn, H.J. High precision reducers for industrial robots driving 4th industrial revolution: state of arts, analysis, design, performance evaluation and perspective. Int. J. Precis. Eng. Manuf.-Green Technol. 2018, 5, 519–533. [Google Scholar] [CrossRef]
  2. GB/T 37718-2019. Precision Planetary Cycloidal Reducers for Robot; Standardization Administration of the People’s Republic of China: Beijing, China, 2019. [Google Scholar]
  3. Xu, H.; Shi, Z.Y.; Yu, B.; Wang, H. Optimal measurement speed and its determination method in the transmission precision evaluation of precision reducers. Appl. Sci. 2019, 9, 2146. [Google Scholar] [CrossRef]
  4. Xu, H.; Shi, Z.Y.; Yu, B.; Wang, H. Dynamic measurement of the lost motion of precision reducers in robots and the determination of optimal measurement speed. J. Adv. Mech. Des. Syst. 2019, 13, JAMDSM0044. [Google Scholar] [CrossRef]
  5. Yang, Y.H.; Zhang, J.; Xu, L.X. Precision analysis of RV transmission mechanism. J. Tianjin Univ. 2013, 46, 623–628. [Google Scholar]
  6. Li, B.; Du, J.W.; Chen, L.; Xu, H.J.; Hou, C.Y. Transmission error analysis for industrial robot RV reducer. J. Xi’an Jiaotong Univ. 2017, 10, 1–6. [Google Scholar]
  7. Zhang, L.Y.; Zhou, H.K.; Wang, C.L.; Qiao, X.T. Analysis of meshing characteristics and return clearance of precision cycloid transmission for robot. J. Mech. Trans. 2017, 3, 50–53. [Google Scholar]
  8. Huang, C.S. On the Surface Design, Tooth Contact Analysis, and Optimum Design of Cycloidal Drives with Modified Tooth Profiles. Master’s Thesis, National Cheng Kung University, Tainan, Taiwan, 2006. [Google Scholar]
  9. Lin, W.; Shih, Y.; Lee, J. Design of a two-stage cycloidal gear reducer with tooth modifications. Mech. Mach. Theory 2014, 79, 184–197. [Google Scholar] [CrossRef]
  10. Ren, Z.Y.; Mao, S.M.; Guo, W.C.; Guo, Z. Tooth modification and dynamic performance of the cycloidal drive. Mech. Syst. Signal Pr. 2017, 85, 857–866. [Google Scholar] [CrossRef]
  11. Wang, R.; Gao, F.Q.; Liu, T.D. Study on modification and compensation of tooth profile of RV reducer cycloidal gear. Chin. J. Sci. Instrum. 2018, 3, 81–88. [Google Scholar]
  12. Sun, X.; Han, L.; Ma, K. Lost motion analysis of CBR reducer. Mech. Mach. Theory 2018, 120, 89–106. [Google Scholar] [CrossRef]
  13. Ma, H.; Pang, X.; Feng, R.J.; Wen, B.C. Evaluation of optimum profile modification curves of profile shifted spur gears based on vibration responses. Mech. Syst. Signal Pr. 2016, 70, 1131–1149. [Google Scholar] [CrossRef]
  14. Tsai, S.J.; Huang, C.H. A study on loaded tooth contact analysis of a cycloid planetary gear reducer considering friction and bearing roller stiffness. J. Adv. Mech. Des. Syst. 2017, 6, JAMDSM0077. [Google Scholar]
  15. Liang, S.F.; Den, X.Z.; Li, T.X.; Wang, C.L.; Yang, J.Z. Tooth contact analysis of cycloidal pinwheel drive in RV reducer of robot. J. Mech. Trans. 2017, 11, 17–22. [Google Scholar]
  16. XU, L.; YANG, Y. Dynamic modeling and contact analysis of a cycloidal-pin gear mechanism with a turning arm cylindrical roller bearing. Mech. Mach. Theory 2016, 104, 327–349. [Google Scholar] [CrossRef]
  17. Xu, L.X.; Chen, B.K.; Li, C.Y. Dynamic modelling and contact analysis of bearing-cycloid-pinwheel transmission mechanisms used in joint rotate vector reducers. Mech. Mach. Theory 2019, 137, 432–458. [Google Scholar] [CrossRef]
  18. Lin, K.S.; Chan, K.Y.; Lee, J.J. Kinematic error analysis and tolerance allocation of cycloidal gear reducers. Mech. Mach. Theory 2018, 124, 73–91. [Google Scholar] [CrossRef]
  19. Ma, J.; Qian, L.F.; Chen, G.S. Dynamic analysis of mechanical systems with planar revolute joints with clearance. Mech. Mach. Theory 2015, 94, 148–164. [Google Scholar] [CrossRef]
  20. Editorial Board of Machinery Handbook. Machinery Handbook. (Gear Train); China Machine Press: Beijing, China, 2007. [Google Scholar]
  21. Shin, J.H.; Kwon, S.M. On the lobe profile design in a cycloid reducer using instant velocity center. Mech. Mach. Theory 2006, 41, 596–616. [Google Scholar] [CrossRef]
  22. Abramowitz, M.; Stegun, I.A. Handbook of Mathematical Functions with Formulas, Graphs, and Mathematical Tables; Doves Publications: New York, NY, USA, 1974. [Google Scholar]
  23. Lankarani, H.M.; Nikravesh, P.E. A contact force model with hysteresis damping for impact analysis of multibody systems. ASME J. Mech. Des. 1990, 112, 369–376. [Google Scholar] [CrossRef]
  24. Qin, Z.; Lu, Q. Analysis of impact process model based on restitution coefficient. J. Dyn. Control 2006, 4, 294–298. [Google Scholar]
  25. Flores, P.; Ambrósio, J.; Claro, J.C.; Lankarani, H.M. Translational joints with clearance in rigid multibody systems. J. Comput. Nonlinear Dyn. 2008, 3, 011007. [Google Scholar] [CrossRef]
  26. Hsieh, C.F. Dynamics analysis of cycloidal speed reducers with pinwheel and nonpinwheel designs. ASME J. Mech. Des. 2014, 136, 091008. [Google Scholar] [CrossRef]
  27. Wang, H.; Ishida, T.; Hidaka, T.; Hashimoto, M. Rotational transmission error of K-H-V planetary gears with cycloid gear (3rd report, Mutual effects of errors of the elements on the rotational transmission error). JSME Trans. 1994, 60, 286–293. [Google Scholar]
  28. Concli, F.; Maccioni, L.; Gorla, C. Lubrication of gearboxes: CFD analysis of a cycloidal gear set. WIT Trans. Eng. Sci. 2019, 123, 101–112. [Google Scholar]
  29. Zhengzhou Institute of Technology. Cycloid-Pin Planetary Transmission; Science Press: Beijing, China, 1978. [Google Scholar]
Figure 1. Traditional cycloid drive coordinates.
Applsci 09 04099 g001
Figure 2. Construction of RV reducer.
Applsci 09 04099 g002
Figure 3. Geometric model of RV reducer.
Applsci 09 04099 g003
Figure 4. Simulation flow chart.
Applsci 09 04099 g004
Figure 5. Finite element (FE) model of RV reducer: (a) exploded view and (b) mesh calculation.
Applsci 09 04099 g005
Figure 6. Contact stress on the cycloid tooth surface during meshing.
Applsci 09 04099 g006
Figure 7. Contact force and friction obtained using analytical (right) and FE (left) methods: (a,b) contact force and (c,d) friction.
Applsci 09 04099 g007aApplsci 09 04099 g007b
Figure 8. Transmission performance tester of RV reducer.
Applsci 09 04099 g008
Figure 9. Control system of transmission performance tester.
Applsci 09 04099 g009
Figure 10. Test results of RV prototype: (a) transmission error (TE) including backlash, (b) harmonic spectrum of a TE as output shaft rotates one round, (c) enlarged view of forward TE in the dashed frame of (a), and (d) enlarged view of backward TE in the dashed frame of (a).
Applsci 09 04099 g010
Figure 11. Modification curves.
Applsci 09 04099 g011
Figure 12. Effect of case 1 modification method on the transmission performance of RV reducer: (a) contact ratio, (b) transmission efficiency, (c) max contact force, (d) max friction, (e) mean TE value, and (f) TE amplitude.
Applsci 09 04099 g012
Figure 13. Effect of case 2 modification method on the transmission performance of RV reducer: (a) contact ratio, (b) transmission efficiency, (c) max contact force, (d) max friction, (e) mean TE value, and (f) TE amplitude.
Applsci 09 04099 g013
Figure 14. Effect of case 3 modification method on the transmission performance of RV reducer: (a) contact ratio, (b) transmission efficiency, (c) max contact force, (d) max friction, (e) mean TE value, and (f) TE amplitude.
Applsci 09 04099 g014aApplsci 09 04099 g014b
Table 1. Parameters of RV reducer.
ParametersValue
Transmission ratio81
Pin center circle radius R p (mm)114.5
Crank center circle radius R z (mm)70
Pin radius r r p (mm)5
Eccentricity a (mm)2.2
Pin number Z p 40
Number of cycloid disc teeth Z c 39
Width of cycloid disc L (mm)18
Rated output torque T o (N·m)784
Elasticity modulus of pin E p (MPa)2.19 × 10⁵
Poisson’s ratio of pin v p 0.3
Elasticity modulus of cycloid disc E c (MPa)2.11 × 10⁵
Poisson’s ratio of cycloid disc v c 0.292
Modification parameter Δ r r p (mm)0.05
Modification parameter Δ R p (mm)0.05
Table 2. Percentage of differences between analytical and FE method.
Modification ParameterContact Force (N)Relative Difference (%)Friction (N)Relative Difference (%)
Analytical MethodFE MethodAnalytical MethodFE Method
05505754.5453513.77
0.025826033.6156551.78
0.046256554.8158591.72
0.066736851.7862611.61
0.087017253.4265661.53
Table 3. Parameter list of sensors.
NameTypeRangeAccuracy
Torque sensorsHY-G33/HY-G32±10 N·m/±1500 N·m±0.25% Fs
Round gratingsREXM360°±2″/±1″
Table 4. Main harmonic components of the test TE.
Harmonic ComponentsAmplitudes
(Arcsec)
Harmonic ComponentsAmplitudes
(Arcsec)
Harmonic ComponentsAmplitudes
(Arcsec)
14.813n2.446n1.42
n3.284n1.568n0.68
2n2.685n0.6439n0.47
Table 5. Percentage differences of analytical method relative to test results of backlash and TE caused by tooth profile modification (TPM) and load.
ParametersAnalytical MethodTest ResultsDifference (%)
Backlash (arcsec)28.6131.037.79%
TE (arcsec)0.490.474.08%
Table 6. Modification conditions.
Case 1Case 2Case 3
Δ r r p Δ R p Δ R p = Δ r r p M
0.01 mm0.02 to 0.1 mm0.01 to 0.225 mm41 to 161

