3.2. Temperature Rise Under Parameter Variation
In the following, the heating curves for the varying stress levels, frequencies and the two concretes are presented. In the diagrams, the heating curves on the center of the surface are displayed in each case. This represents the maximum temperature rise which was measured in all tests. As shown in
Table 1, three frequencies (3/10/20 Hz) were tested for the UHPC 1 and three different maximum stress levels (σ
o = 0.6/0.7/0.8) were applied at each frequency. The diagrams in
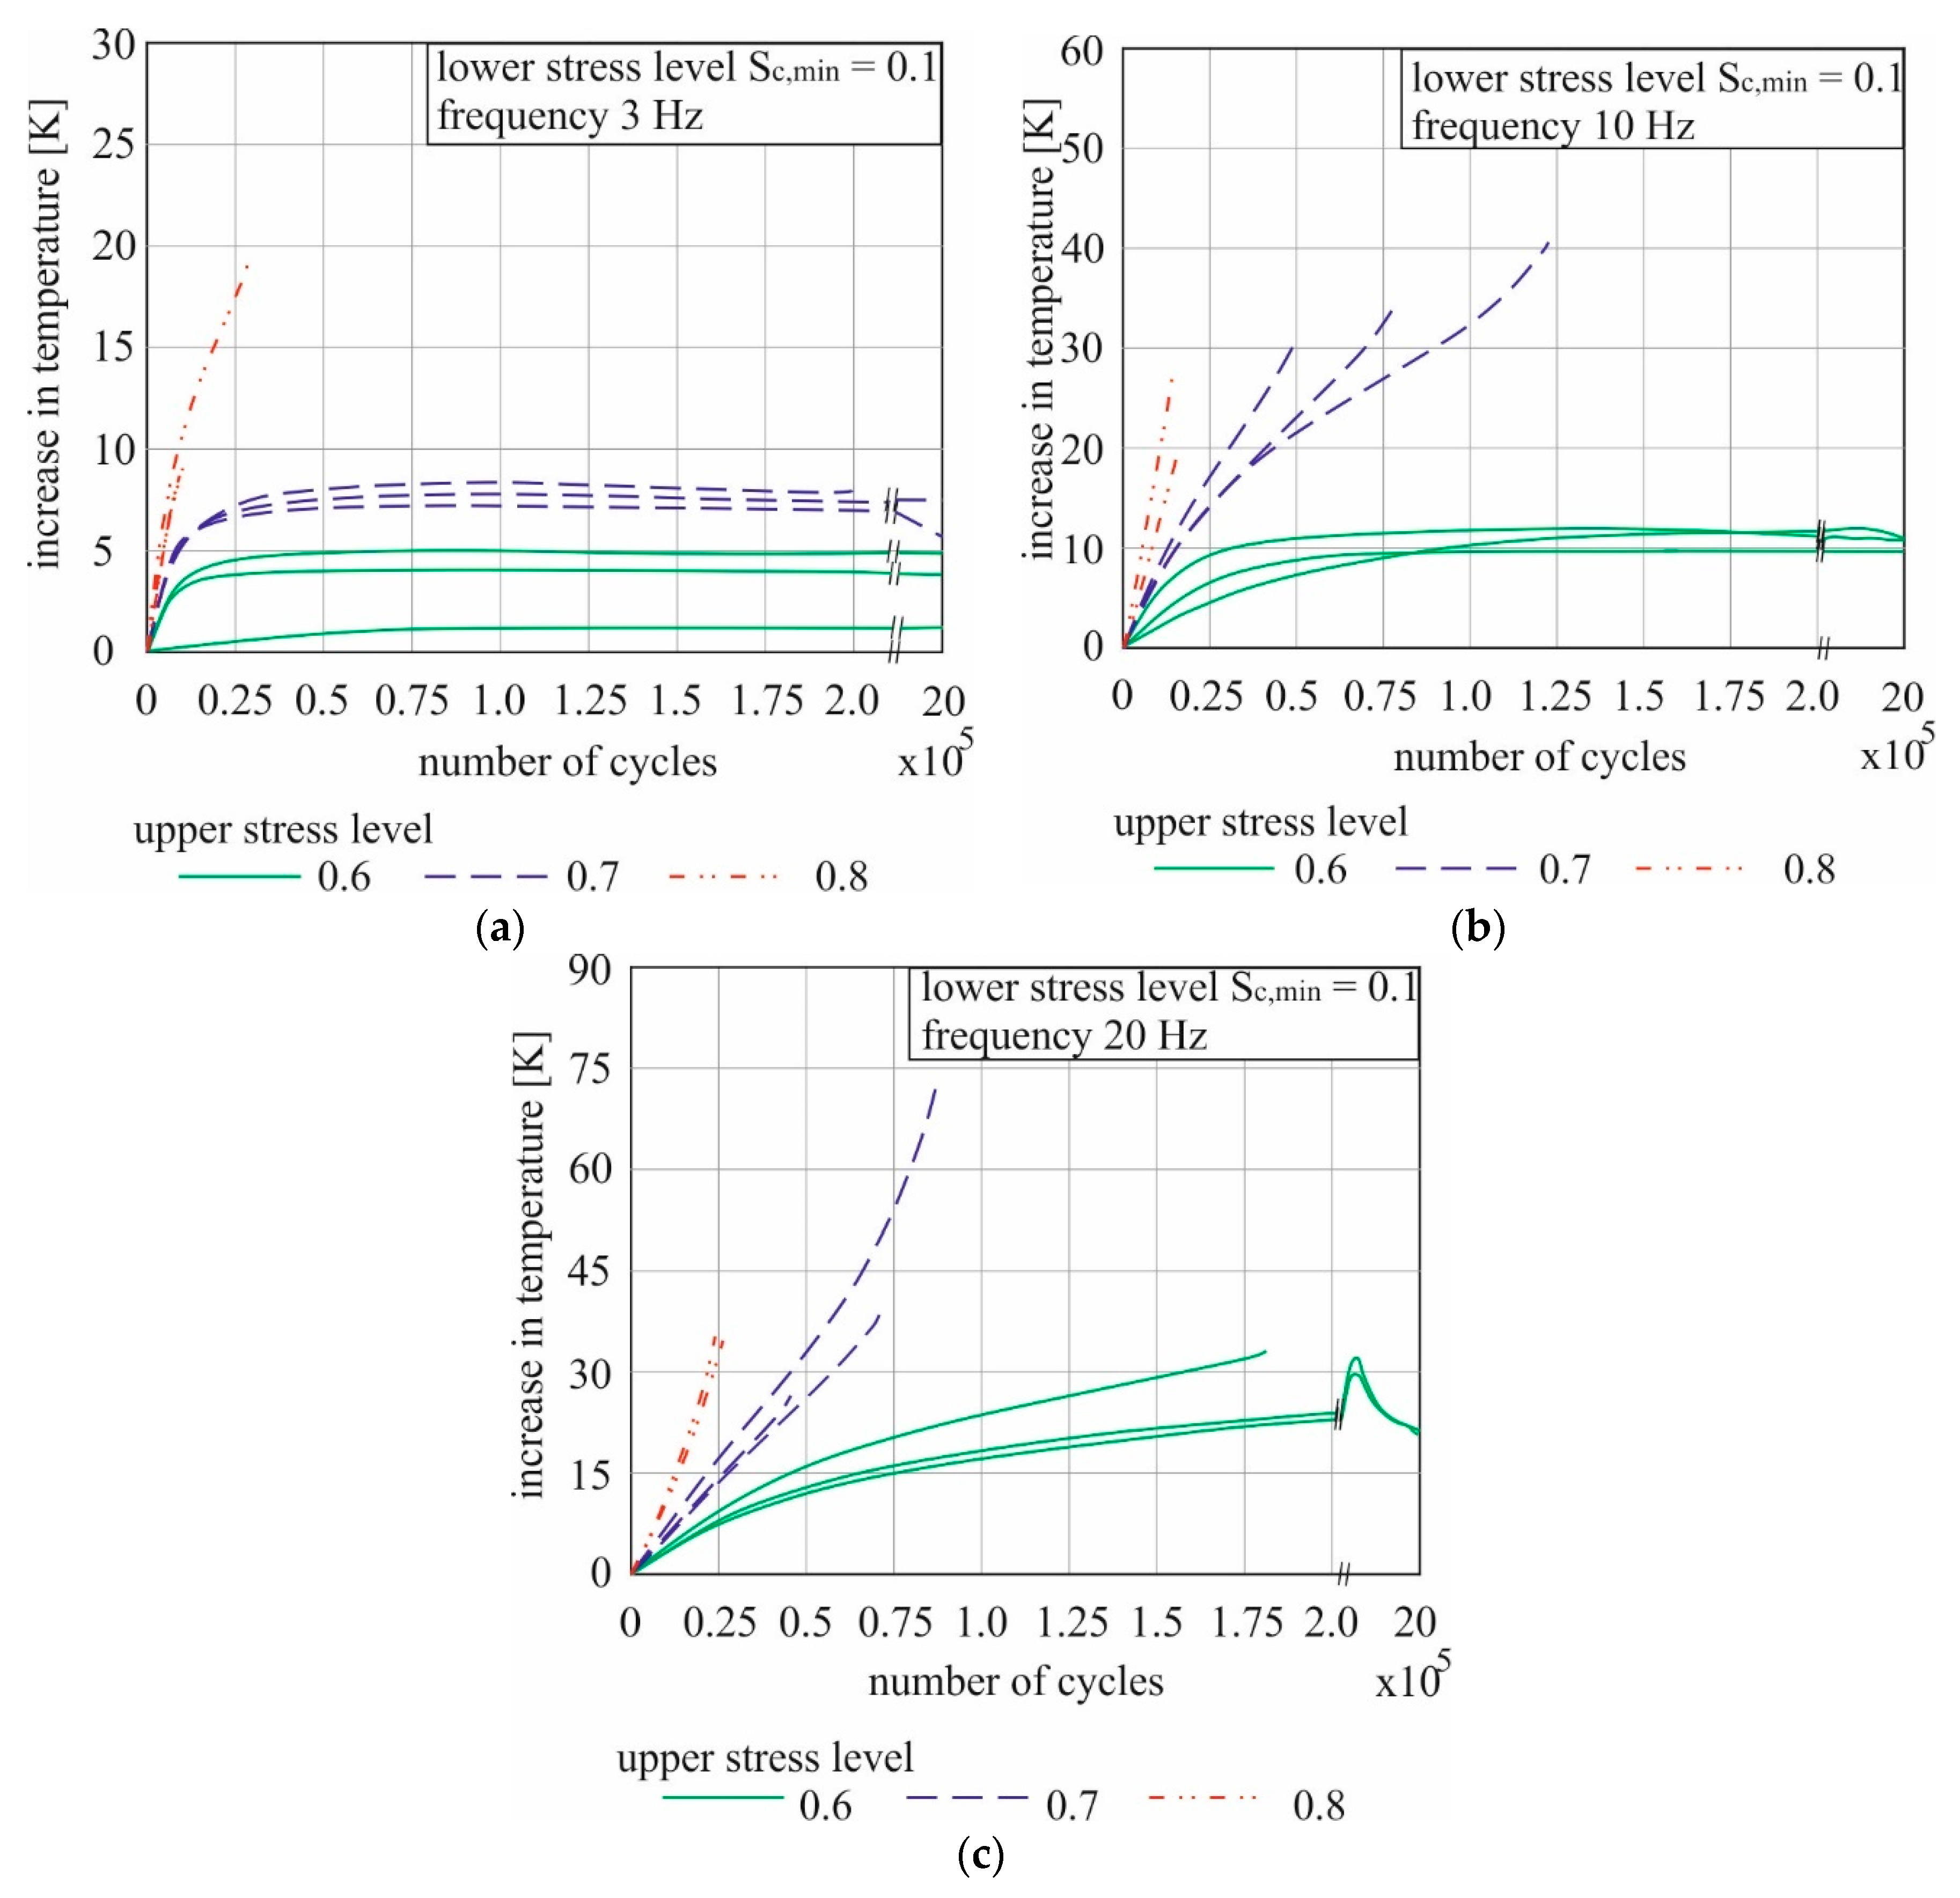
Figure 5 present the heating curves over the number of load cycles for all 27 tests. The influences of the load-dependent parameters on the temperature increase of the UHPC 1 under fatigue stress can be seen clearly. It should be noted, that a change in the scaling for the number of load cycles at 200,000 load cycles takes place in the X-axis in all diagrams (marked by two small oblique strokes). Thus it is possible to make the courses of curves with an early and a late failure visible in one graphic. Please also note that the scaling of the Y-axes is different.
Basically, all tests show a temperature increase of the UHPC samples. The characteristics of the curves indicate a strong dependence of the heating of the samples on the two load-dependent parameters.
The diagram (a) of
Figure 5 shows the curves for the lowest frequency of 3 Hz. At 3 Hz, a higher maximum temperature is reached with increasing maximum stress level. Not only the maximum temperature, but also the steepness of the curve of heating increases is maximally. At an upper load level s
c,max of 80% of concrete strength, the specimens failed during the temperature rise, which was in 2 of 3 cases nearly linear over the whole test. In these two trials, the specimens achieve both a temperature increase of less than 10 K. The failure occurred very early due to the high fatigue damage. At s
c,ma = 0.7, a maximum temperature difference of about 8 K was recorded after 20 to 25 thousand cycles. The temperature then remained almost constant. Two of three specimens reached the break-off criterion of 2 million load cycles without failure, where a minimal temperature drop could be noticed. At s
c,max = 0.6, the curves are similar to the 0.7 ones. However, the maximum temperature differences were with only 5 K even lower. Each test was finished after 2 million load changes as stated in
Section 2.4.
The rise of the temperature curves was dependent on the maximum stress level also at 10 Hz, as can be seen in the diagram (b) of
Figure 5. However, the temperature maxima achieved were significantly higher than for the slower loading. Again at s
c,max = 0.6 a maximum value was reached at approximately 80 thousand load cycles. From this point on, the temperature difference to the starting temperature of all three specimens remained at approximately 12 K and no failure of the test specimen occurred until the tests were stopped. All attempts with higher stress level shows a steady increase in temperature until failure. At s
c,max = 0.8, the increase was again the steepest, but the total temperature increase of round about 24 K (in average) was approximately 11 K less than the average value for cyclic loading with the mean level of s
c,max = 0.7. In addition, the tested 0.8 specimen failed already near 20 thousand load cycles, whereby the same temperature of the test specimens with s
c,max = 0.7 was first reached at a little under 50 thousand load cycles on average. However, the mean values were not that meaningful at 70 percent as upper stress level, since there was a large variation. That can be seen in the load cycle numbers. The failure occurred between 50 thousand and 120 thousand load cycles.
The curves for s
c,max = 0.7 and 0.8 in the diagram (c) of
Figure 5 display a basically similar picture at 20 Hz as at 10 Hz, but higher temperatures were reached. The greatest increase in temperature of a test specimen was achieved in the entire test series at s
c,max = 0.7 and 20 Hz with 68 K. This value stands out significantly, as in the two other tests with the same configuration only temperature increases of 28 K and 38 K were recorded, respectively. The highest stress velocity caused an increase of more than 30 K even at the lowest maximum stress level of 0.6 and was thus significantly higher than at the lower frequencies. These increases run in two of three attempts over 500 thousand load cycles. After that, the samples cooled down by about 12 K. From 1.25 million to 2 million load cycles, the temperature remained constant. One specimen failed after 180 thousand load cycles.
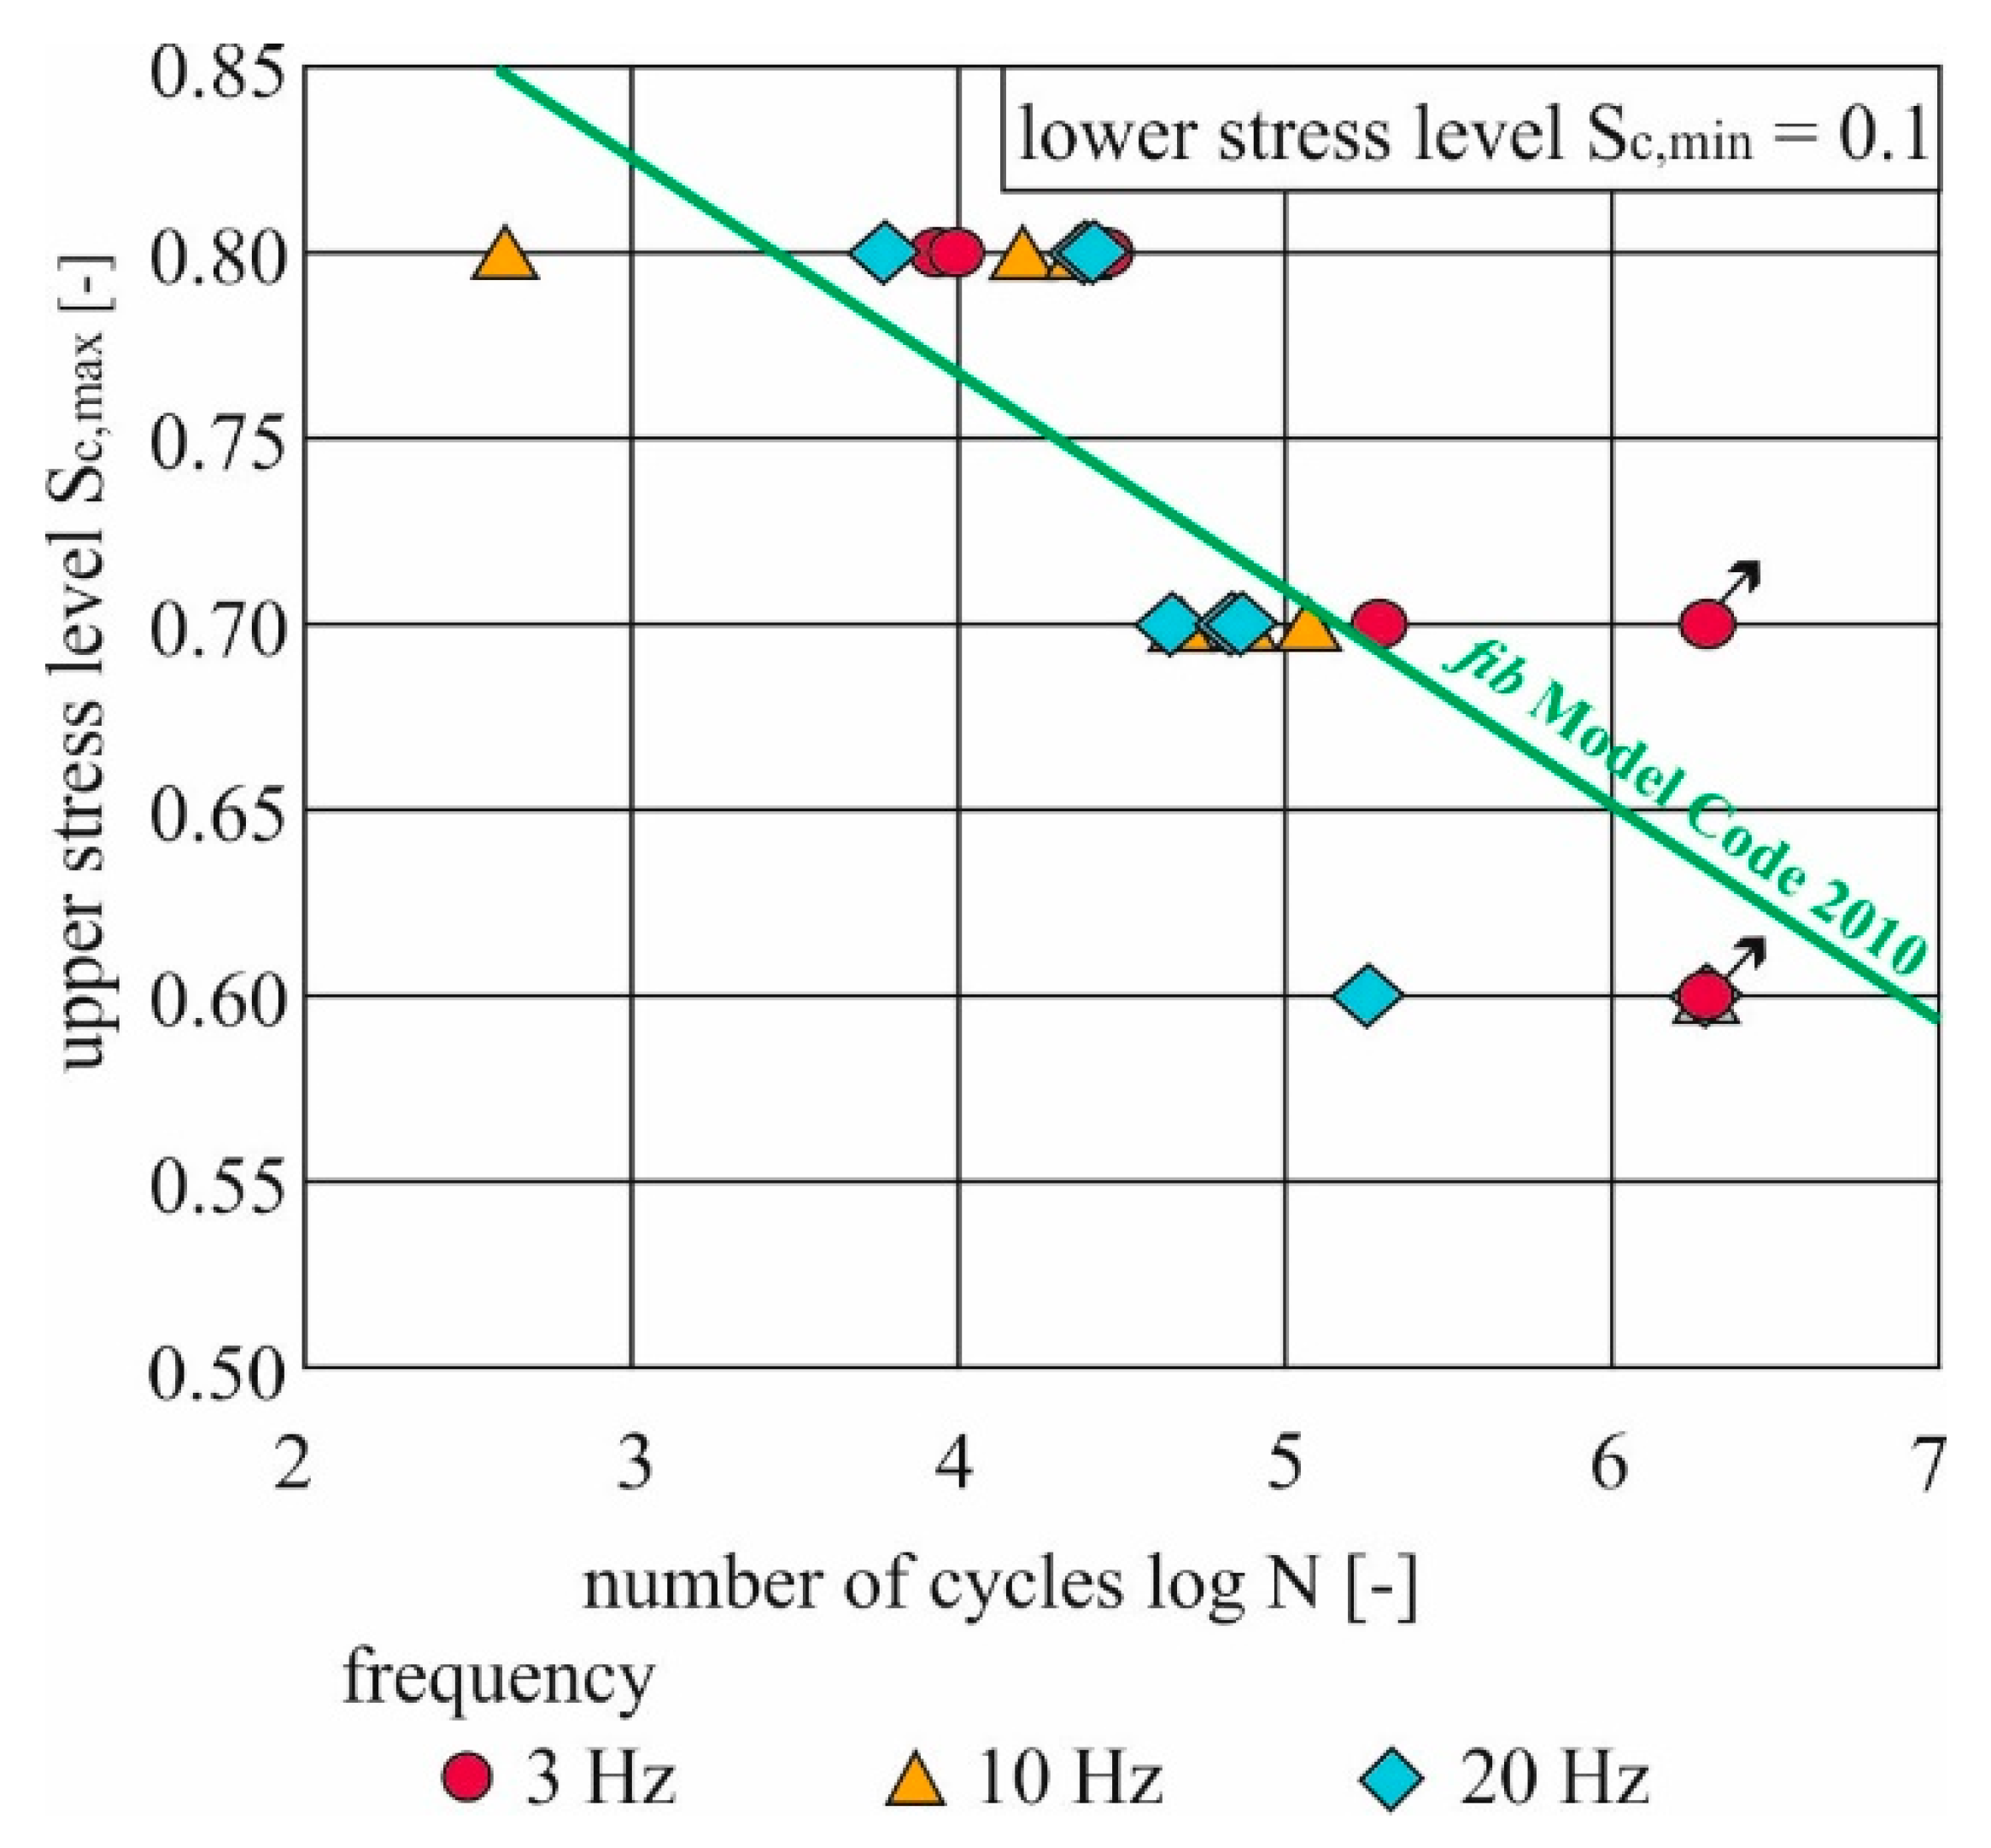
In total it is noticeable that only at a frequency of 10 Hz and 20 Hz a strong temperature increase in the concrete can be achieved. At 3 Hz, the increase generated was usually so low that the influence on the fatigue strength for the UHPC 1 is negligible. This can also be seen in
Figure 6. There, the achieved number of load cycles for all tests is presented logarithmically as a function of the maximum stress level. The continuous line describes the expected value for the number of load cycles according to the Wöhler curve included in the Model Code 2010 [
19]. The attempts with a maximum stress level of 0.6 achieved, with a few exceptions, the termination criterion of 2 million load cycles. In all cases, the heating curves also reached a maximum value at which the warming stopped. The break-off criterion lied below the Wöhler curve, which is why this comparison does not make sense. At s
c,ma = 0.8 we got the steepest rise of the heating curves at each frequency, but at 10 Hz and 20 Hz not the maximum temperatures. Failure was expected to occur very early. The values according to fib Model Code 2010 were also reached (or even exceeded) with temperature increase. The early failure in comparison to the other maximum stress levels was mainly caused by the high degradation. The one outlier below the Wöhler curve had large blowholes due to production and is therefore not considered for the mean values.
As can be seen in
Figure 6, only the tests specimens at 70% of the uniaxial compressive strength as upper stress level failed before the calculated values according to [
20] were reached, and this at 10 Hz and 20 Hz, where also the maximum temperatures were reached. Thus, a non-negligible influence of the warming up on fatigue strength of UHPC can be assumed here. Thus, at frequencies that cause significant heating, there is a range between 60% and 80% of the mean concrete strength in which sufficient temperature is generated to have an influence on the strength, but failure does not occur previously due to fatigue loading. As [
4,
5,
6,
13] have determined, for example, there is a point at approx. 75% of the mean concrete strength as an upper stress level at which the failure and damage behavior change somewhat. The changing influence of the frequency on the fatigue strength above and below the value was often detected. With a different increase in damage and differently oriented crack growth, heating can possibly also be influenced. The results show that although there is still a significant increase in temperature, the heating rate is clearly influenced over the test length, which is discussed in more detail in
Section 3.3. The comparison with the UHPC 2 is therefore displayed with tests at 10 Hz and s
c,max = 0.7.
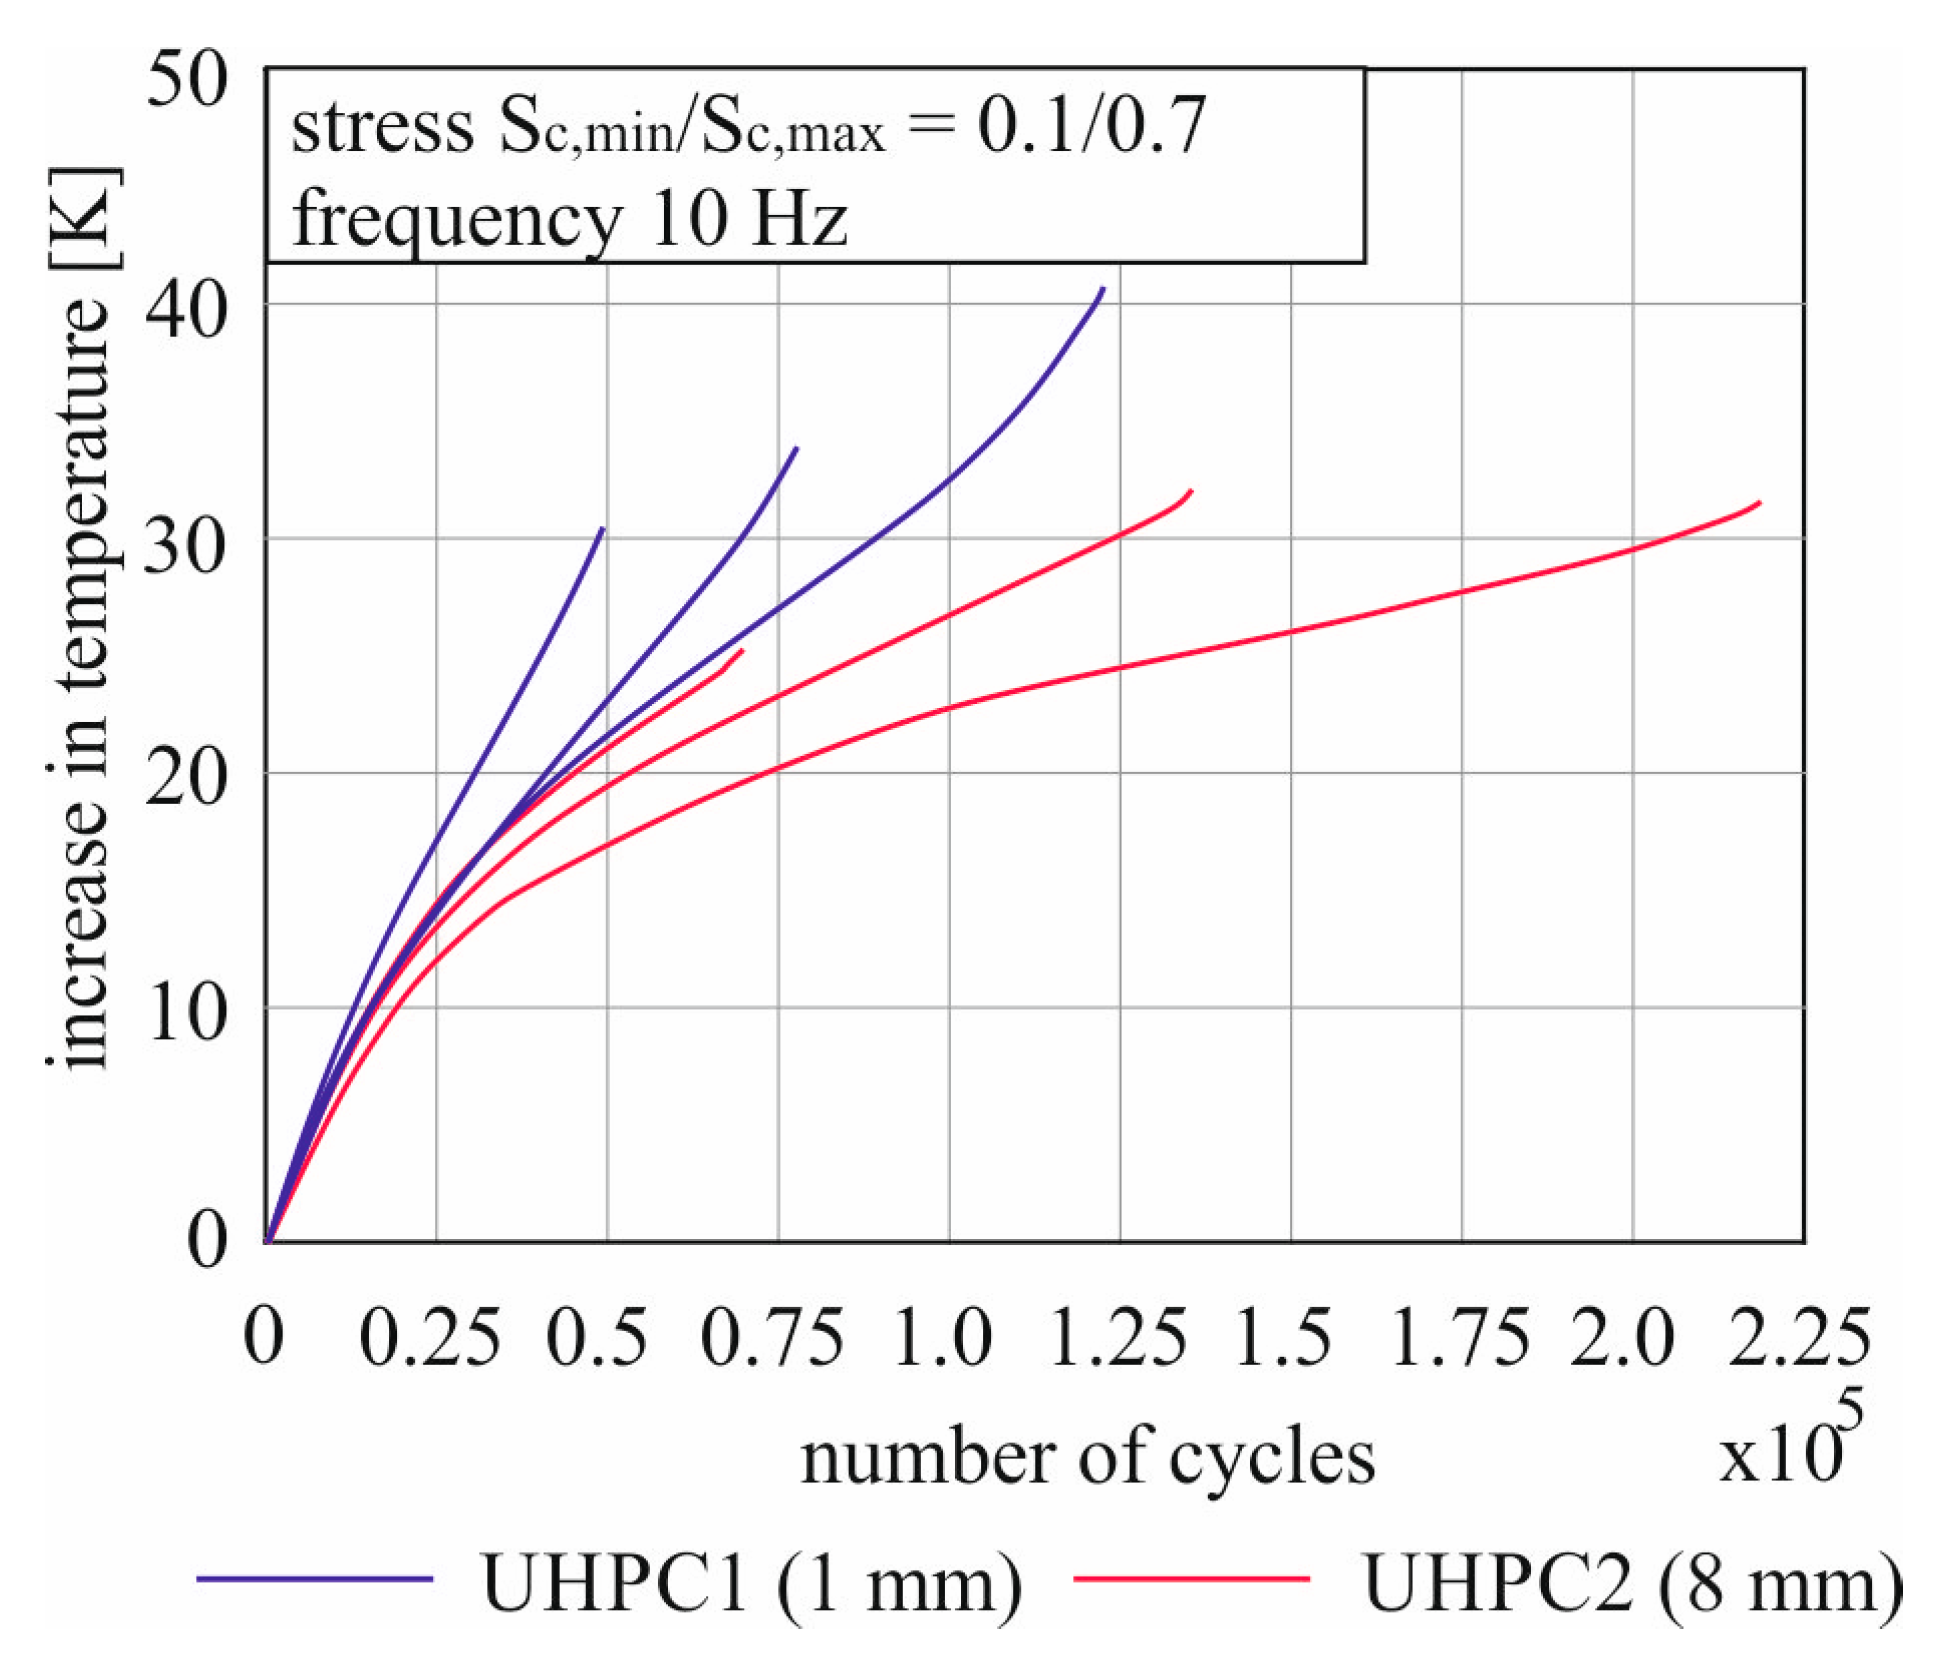
Figure 7 shows a comparison of the heating curves for UHPC 1 and UHPC 2. Here, the influence of the maximum grain size on the temperature curve can be displayed.
As already described for the UHPC 1, the UHPC 2 test specimens also failed during the heating process. On average, the temperatures reached are similar for both concretes. However, it is noticeable that the curves with the smaller maximum grain size of 1 mm always show a steeper course. In addition, the number of load cycles achieved with the larger maximum grain size of 8 mm for the same strength is on average double that of the UHPC 1. Relative to the Wöhler curve, the test specimens of the UHPC 2 also reached the expected number of load cycles with 140 thousand on average.
3.3. Heating Rate of the Concrete
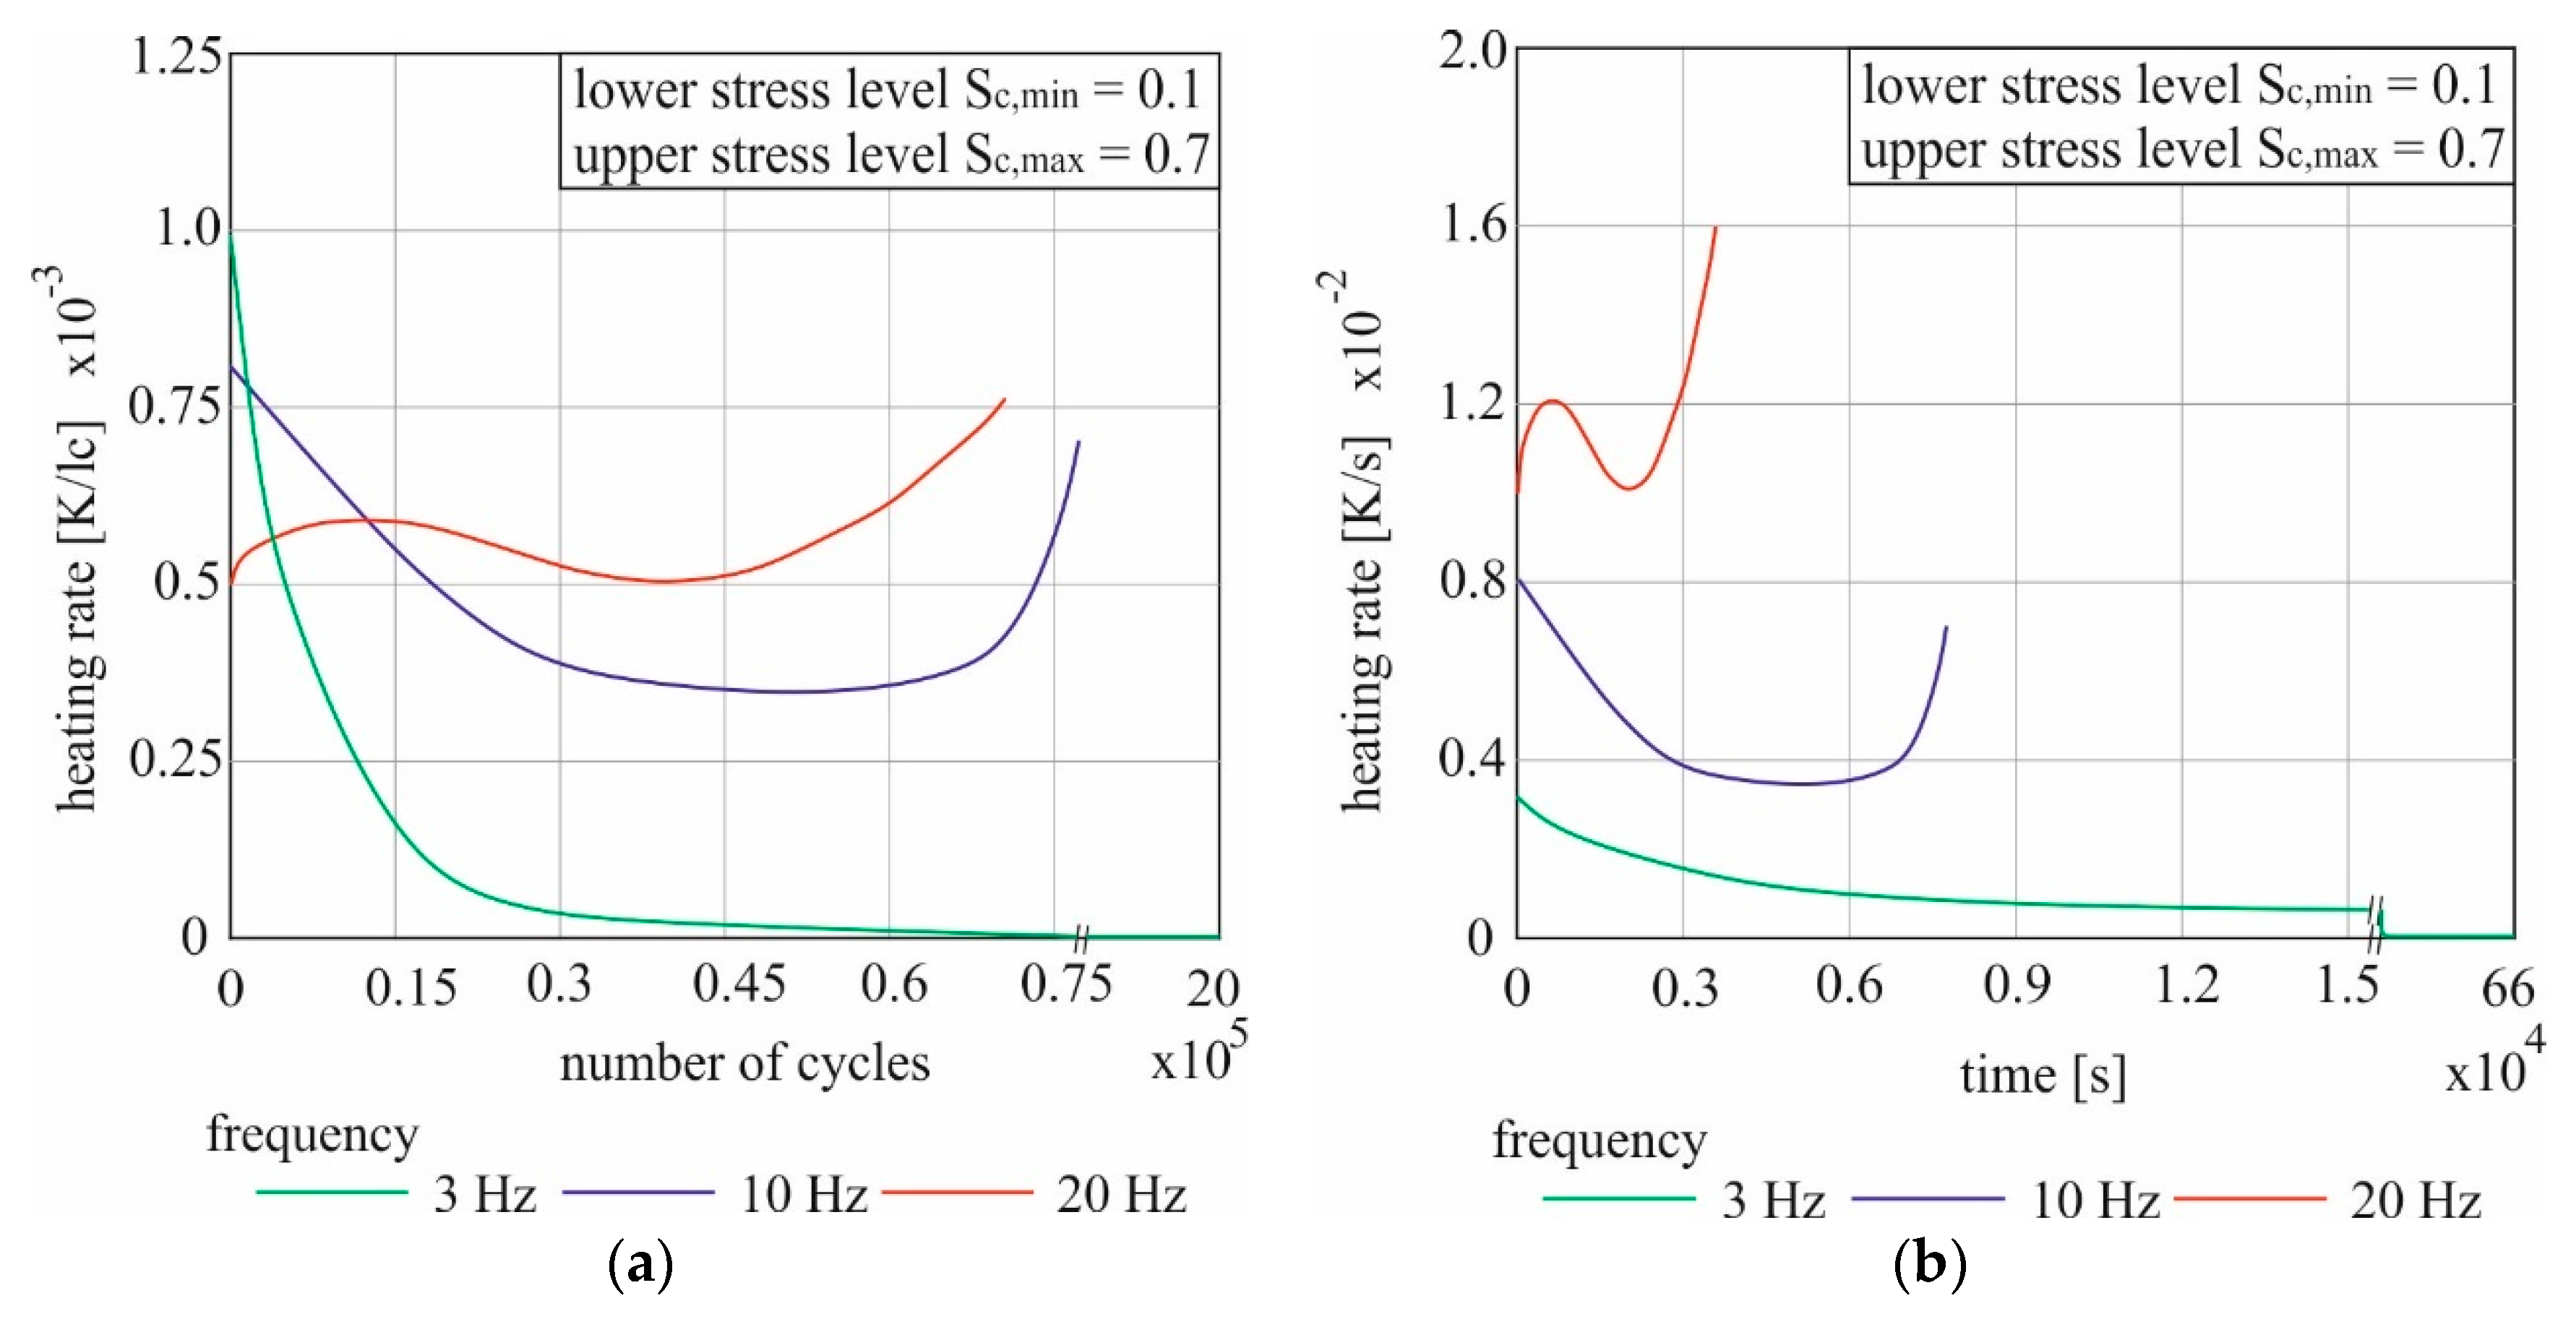
The steepness of the warming up curves can be used to estimate how strong the increase in temperature was during the test. In order to quantify this heating rate, the heating curves can be derived. This was done for the attempts at s
c,max = 0.7 for the UHPC 1 concerning both the number of load cycles and the duration.
Figure 8 shows the speed of the temperature increase for one attempt each at 3 Hz, 10 Hz and 20 Hz. As an example, the test that reached the temperature in the middle of the respective configuration was selected for the representation.
The diagram (a) in
Figure 8 shows the rates of temperature increase per load cycle. The fastest rise of 10
−3 K/lc was recorded in the attempt with the lowest total temperature difference reached at 3 Hz. It was measured directly at the beginning of the test. In relation to a load change, more force is applied to the test specimen over time as the length of the load change increases. For 3 Hz, the longest force application is generated with 1/3 s. The speed of the temperature increase decreased rapidly afterwards. After 1,500 load cycles the point of overlap with the 10 Hz curve is reached, and after 4,150 load cycles with the 20 Hz curve. Additionally, with regard to the number of load cycles, the heating per load cycle was therefore quickly at its slowest at the lowest test frequency. After only 0.25% of the total number of load changes, this speed has already halved. The regressive curve reaches the value 0 after 75 thousand load cycles. This means that no further heating of the test specimen occurred after less than 4% of the total number of load cycles up to the break-off criterion.
The experiment with 10 Hz had its maximum heating speed also at the beginning of the attempt with 0.8·10-3 K/lc. Then, the course did not drop to 0, though, rather at 0.35·10−3 K/ lc a turning point after about two thirds of the overall course was reached and the heating speed increased again. The warming rate decrease at the beginning was noticeably lower than at 3 Hz and during the first 15 thousand load changes nearly linear with 1.67·10−8 K/lc2. The increase in heating velocity was particularly strong during the last 10% of the experiment. The specimen failed at a heating speed of 0.7·10−3 K/lc before the initial value was reached again.
In contrast to 10 Hz, the maximum heating speed was reached at 20 Hz for all evaluated samples that failed before the break-off criterion; the maximum speed of the temperature increase was reached immediately before the failure. In relation to the number of load changes, the rate of warming at the start is lowest with 0.5·10−3 K/lc. However, this starting velocity did not decrease during the test. The curve shows two turning points. After 12 thousand of 70.7 thousand load changes, a first maximum of 0.6·10−3 K/lc is reached. Then the speed decreased until the start value was reached again. From 12 thousand load changes, compared to the other frequencies resp. load speeds, the highest warming speed per load cycle at 20 Hz was also permanently recorded. Immediately before failure, the heating rate was 0.76·10−3 K/lc.
The diagram (b) in
Figure 8 shows the same attempts. This case, however, the heating rate is displayed in relation to the test duration in seconds instead of load cycles. The curve characteristics remain the same like described before for diagram (a). Due to the changed reference value on the X-axis, the curves are significantly compressed and stretched. Because the number of load cycles per second varies significantly between 3, 10 and 20, the test durations are correspondingly very different. The test with 20 Hz was already finished after 58 min, the test with 10 Hz lasted 2 h and 10 min and the 3 Hz test took over a week until the break-off criterion was reached. If the start values of the speed are considered in terms of time, the order is exactly reversed in comparison to the load cycle-related values. The difference of the load changes per second (factor 2) is also clearly expressed here. The resulting temperature increase rates are so far apart that there are no intersections of the curves. The clearly lowest maximum value of the temperature increase rate was reached in the test with 3 Hz with 0.31·10
−2 K/s and reaches 0 after 25 thousand seconds.
Looking at the 10 Hz and the 20 Hz attempt, one can compare the first and the second reached maximum value of the warming speed. The load speed factor between both is 2.0. The heating rate at 10 Hz had a starting value of 0.8·10−2 K/s. At 20 Hz, this value was 1.2·10−2 K/s. The factor here is therefore only 1.5 and is thus less than the frequency difference. If observing the heating rate in each test directly before failure, the result is 0.7·10−2 K/s for 10 Hz and 1.6·10−2 K/s for 20 Hz. The factor in this case is 2.28 and thus above the frequency comparison.
The comparisons of the velocity show that with the same load cycle level between 0.1 and 0.7 of the mean concrete compressive strength, the temperature input is different depending on the load cycle (lc) and the test duration at different frequencies.
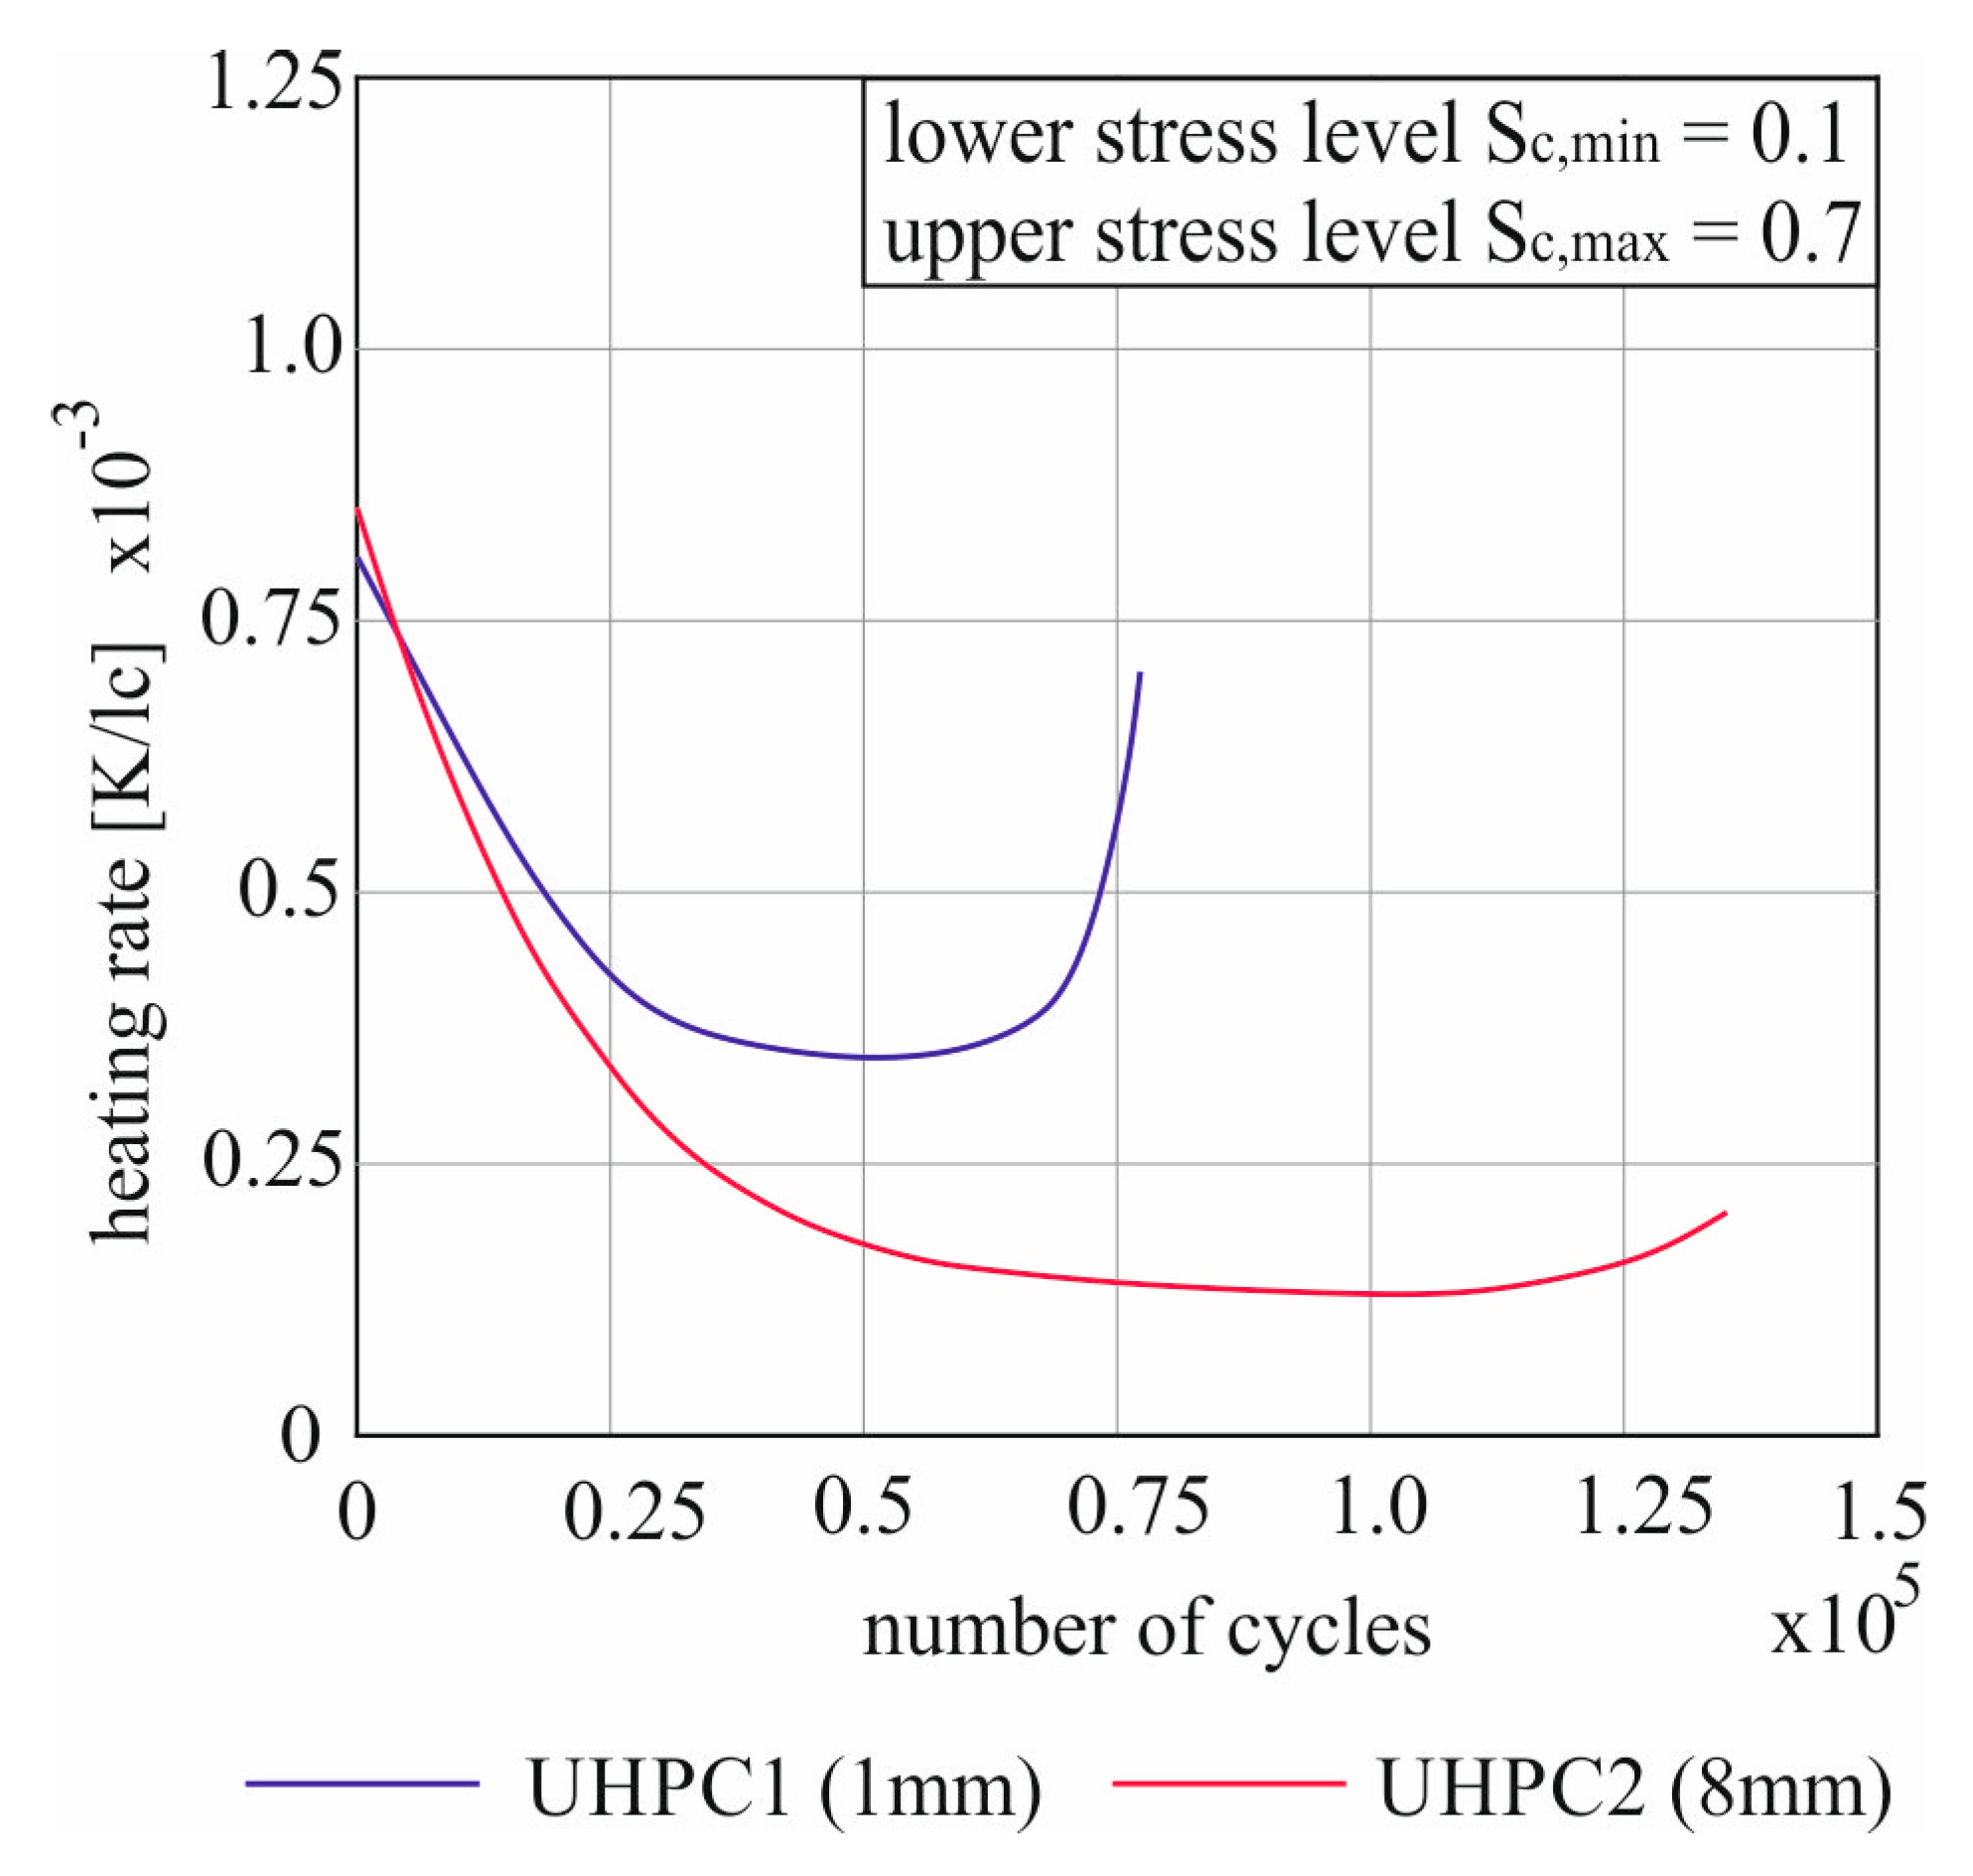
As with the heating curves, the UHPC 2 is compared to the UHPC 1 for the same load cycle at a frequency of 10 Hz to discuss the influence of the maximum grain size on the heating rate. This is represented by the load-cycle-related velocity in
Figure 9.
The two curves show principally similar behavior. In each case, the maximum value of the heating rate can be seen at the start of the test. With 0.8·10
−3 K/lc for the UHPC 1 with a maximum grain size of 1 mm and 0.85·10
−3 K/lc for the UHPC 2 with a larger maximum grain size of 8 mm, these values lie very close together. This is followed by a reduction in the warming up rate which was first linear in both experiments and then attenuated. Thereby the warming speed of the UHPC 2 decreased faster. In both attempts, a turning point was reached at a minimum heating rate before it rose again. As from 4,500 load changes, the heating speed of the UHPC 2 was always lower than that of the UHPC 1, which led to a slower increase in the temperature difference curves (
Figure 7). The maximum temperatures difference reached with +33.4 K (UHPC 1) and +32.1 K (UHPC 2) were very close to each other. Due to the higher heating rate, however, this temperature was reached after 77.5 thousand load changes at the finer aggregate concrete. For aggregates up to 8 mm, on the other hand, almost 135 thousand load cycles were required for the same temperature increase.
Another clear difference can be seen from the derived curves of the temperature rise. Both attempts start with a similar heating rate, but the increase before failure is very different. The UHPC 1 reached 87.5% of the starting velocity before failure occurred. In contrast, the UHPC 2 reached only 25% of the start value after the climb to the end.
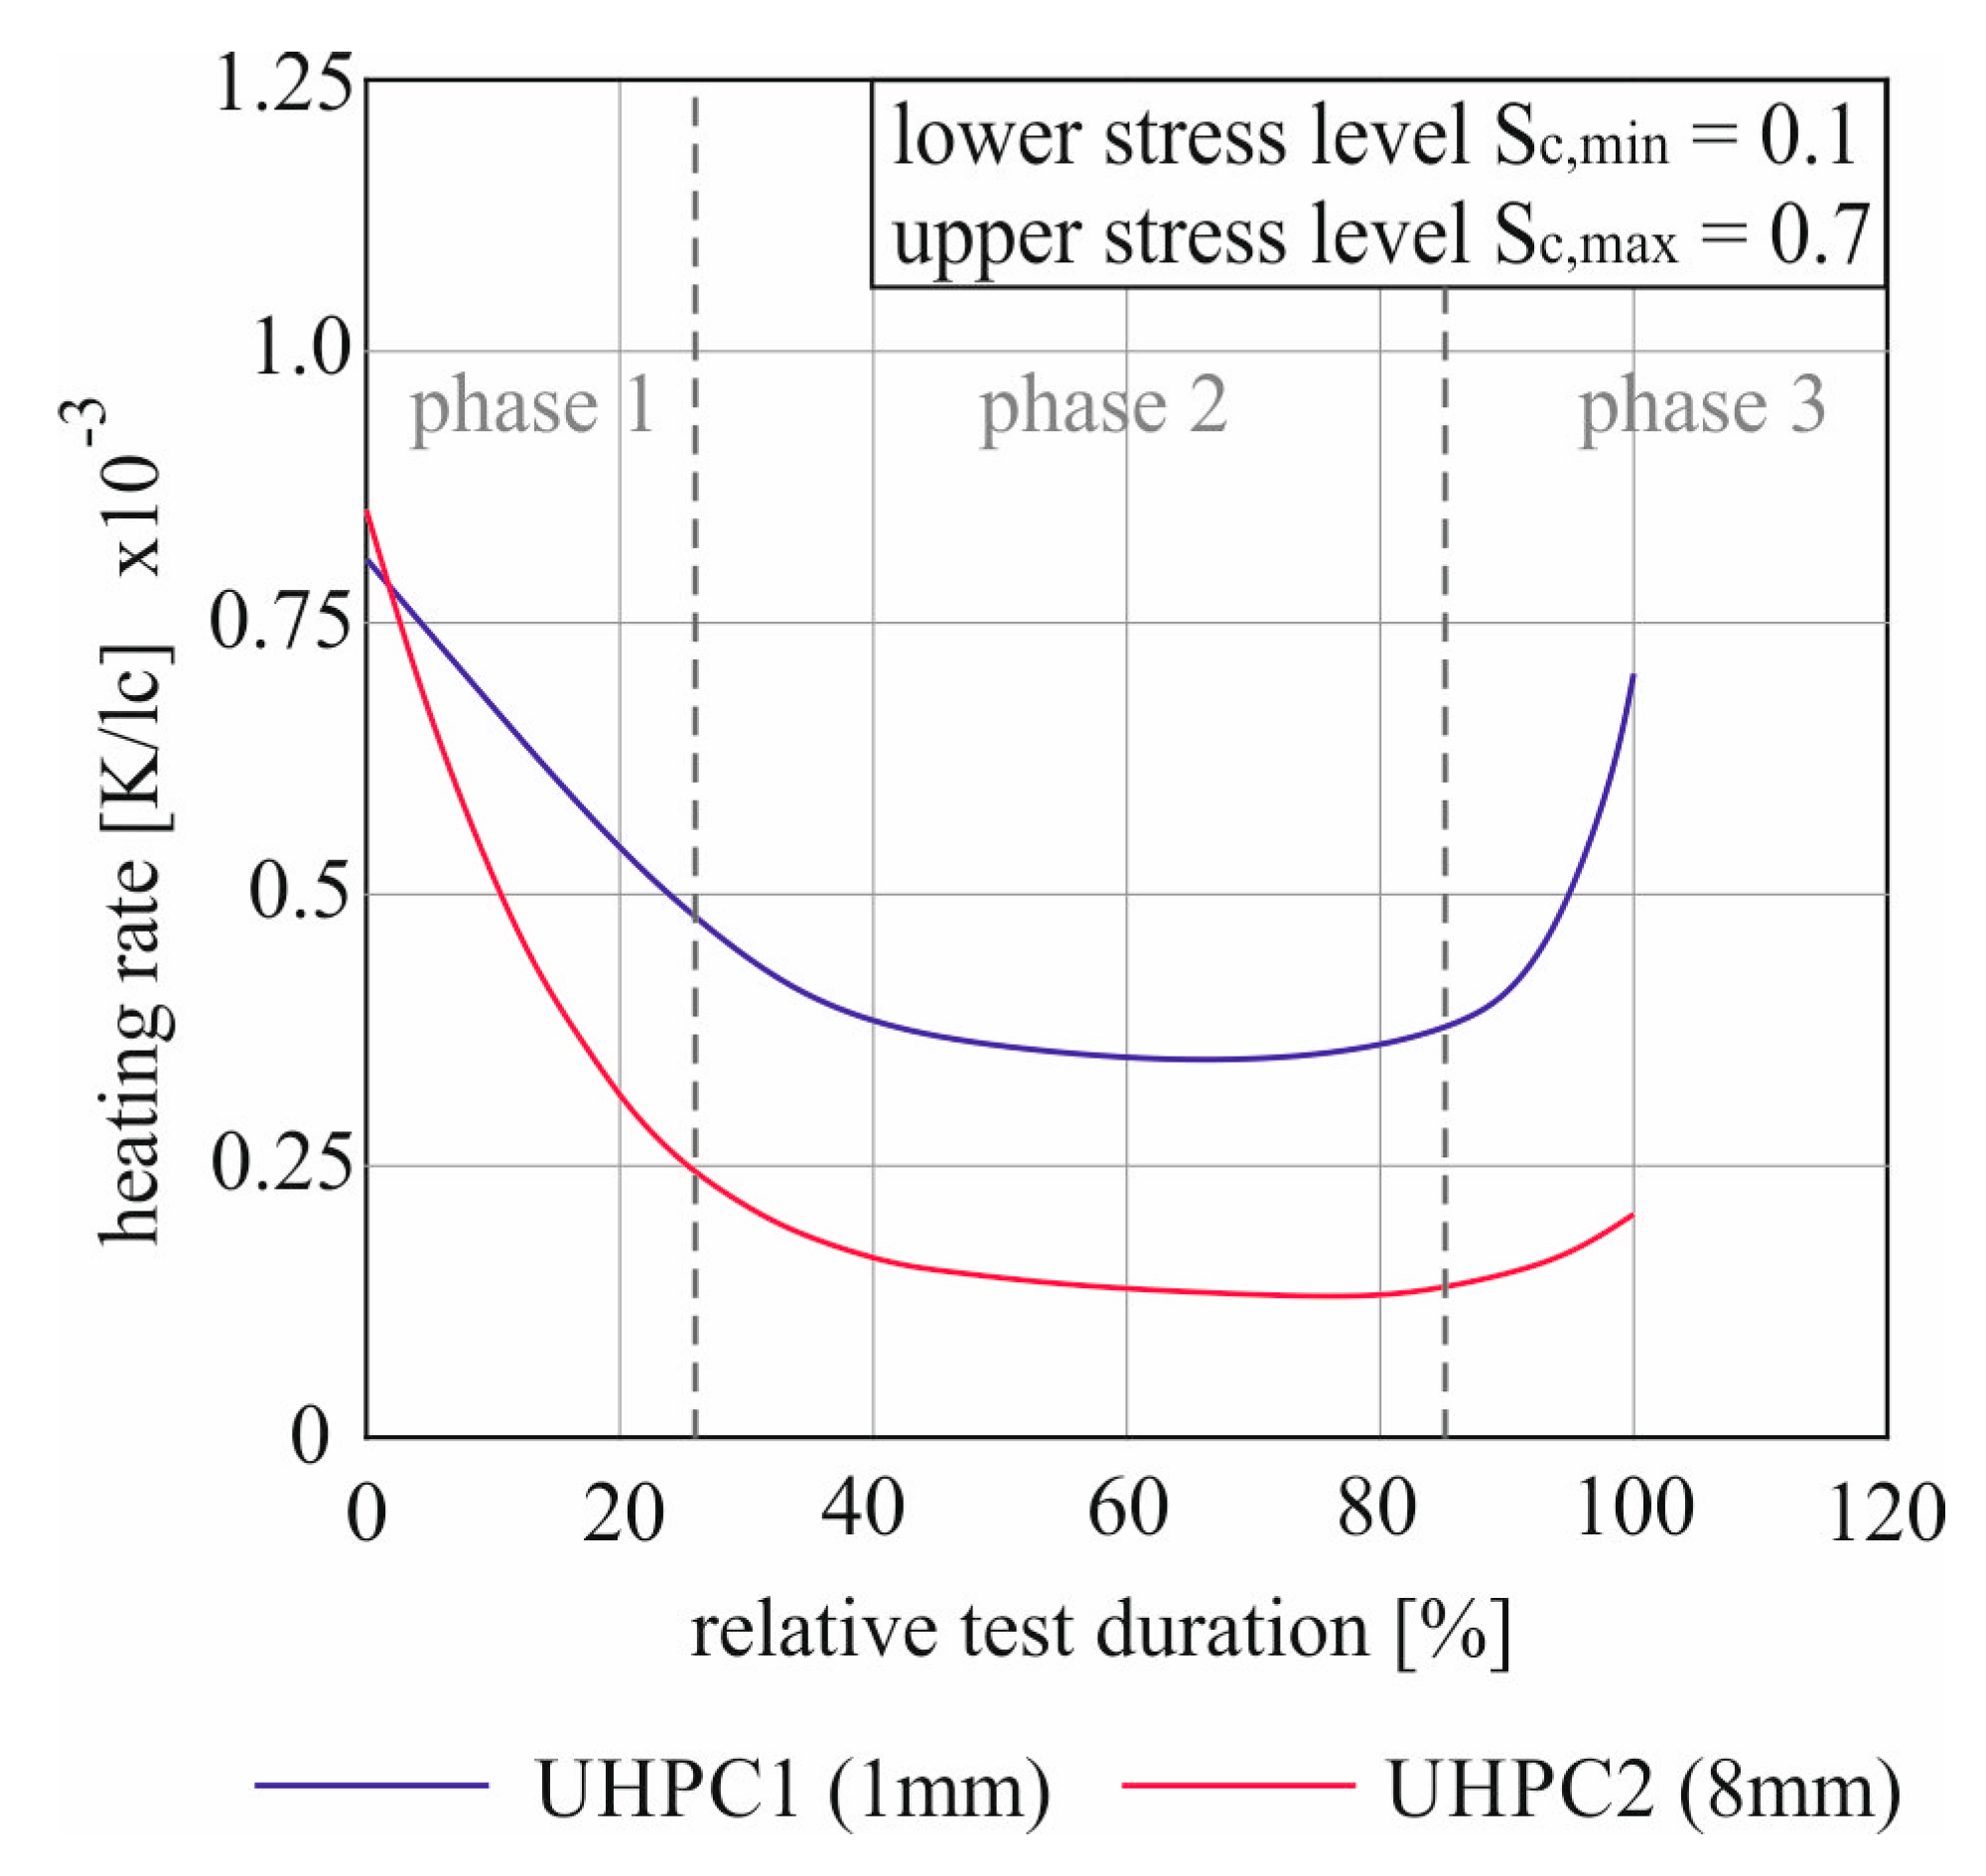
In order to be able to compare the two curves relatively to each other, they are shown again in
Figure 10 with reference to the relative test duration with 100% means the end of the attempt.
The similarity of the curve can also be seen very well in relation to the percentage duration in
Figure 10. After the initial linear decrease of the velocity, the heating rate decreases regressively between approx. 20% and 40%. Until about 2/3 of the test duration, the curves then run approximately parallel until the lowest heating rate is reached. Finally, there is an equal relative duration of the ascent at the end, with visibly different intensity. The curves can be divided into three phases. The phases 1 and 3 are characterized by strong changes in heating speed. During these phases, the difference between the curves also increases visibly. Phase 2, on the other hand, displays an almost linear reduction of the heating rate of about the same amount in both experiments. Thus a constant distance remains. After both attempts started with almost the same warming speed, they already had a difference of 0.22·10
−3 K/ lc at the turning point and the heating rate of UHPC 1 was 2.7 times higher than that of UHPC 2. During phase 3, this difference has increased to 0.5·10
−3 K/lc until failure. At the end of the trials, the factor between the courses was already 3.5.
The comparison of the two concretes with the same strength and different aggregate shows, that with the same loading parameters, the courses of the heating rate-relative test duration curves are basically similar, but the absolute values are clearly dependent on the maximum grain size. The only exception seems to be the start of the test. This may be caused by the fact that at the beginning of the test there was no structural change in the concrete due to fatigue loading. With the duration of the test continuing, the damage will result in different conditions in the concretes and thus probably the different friction potentials.
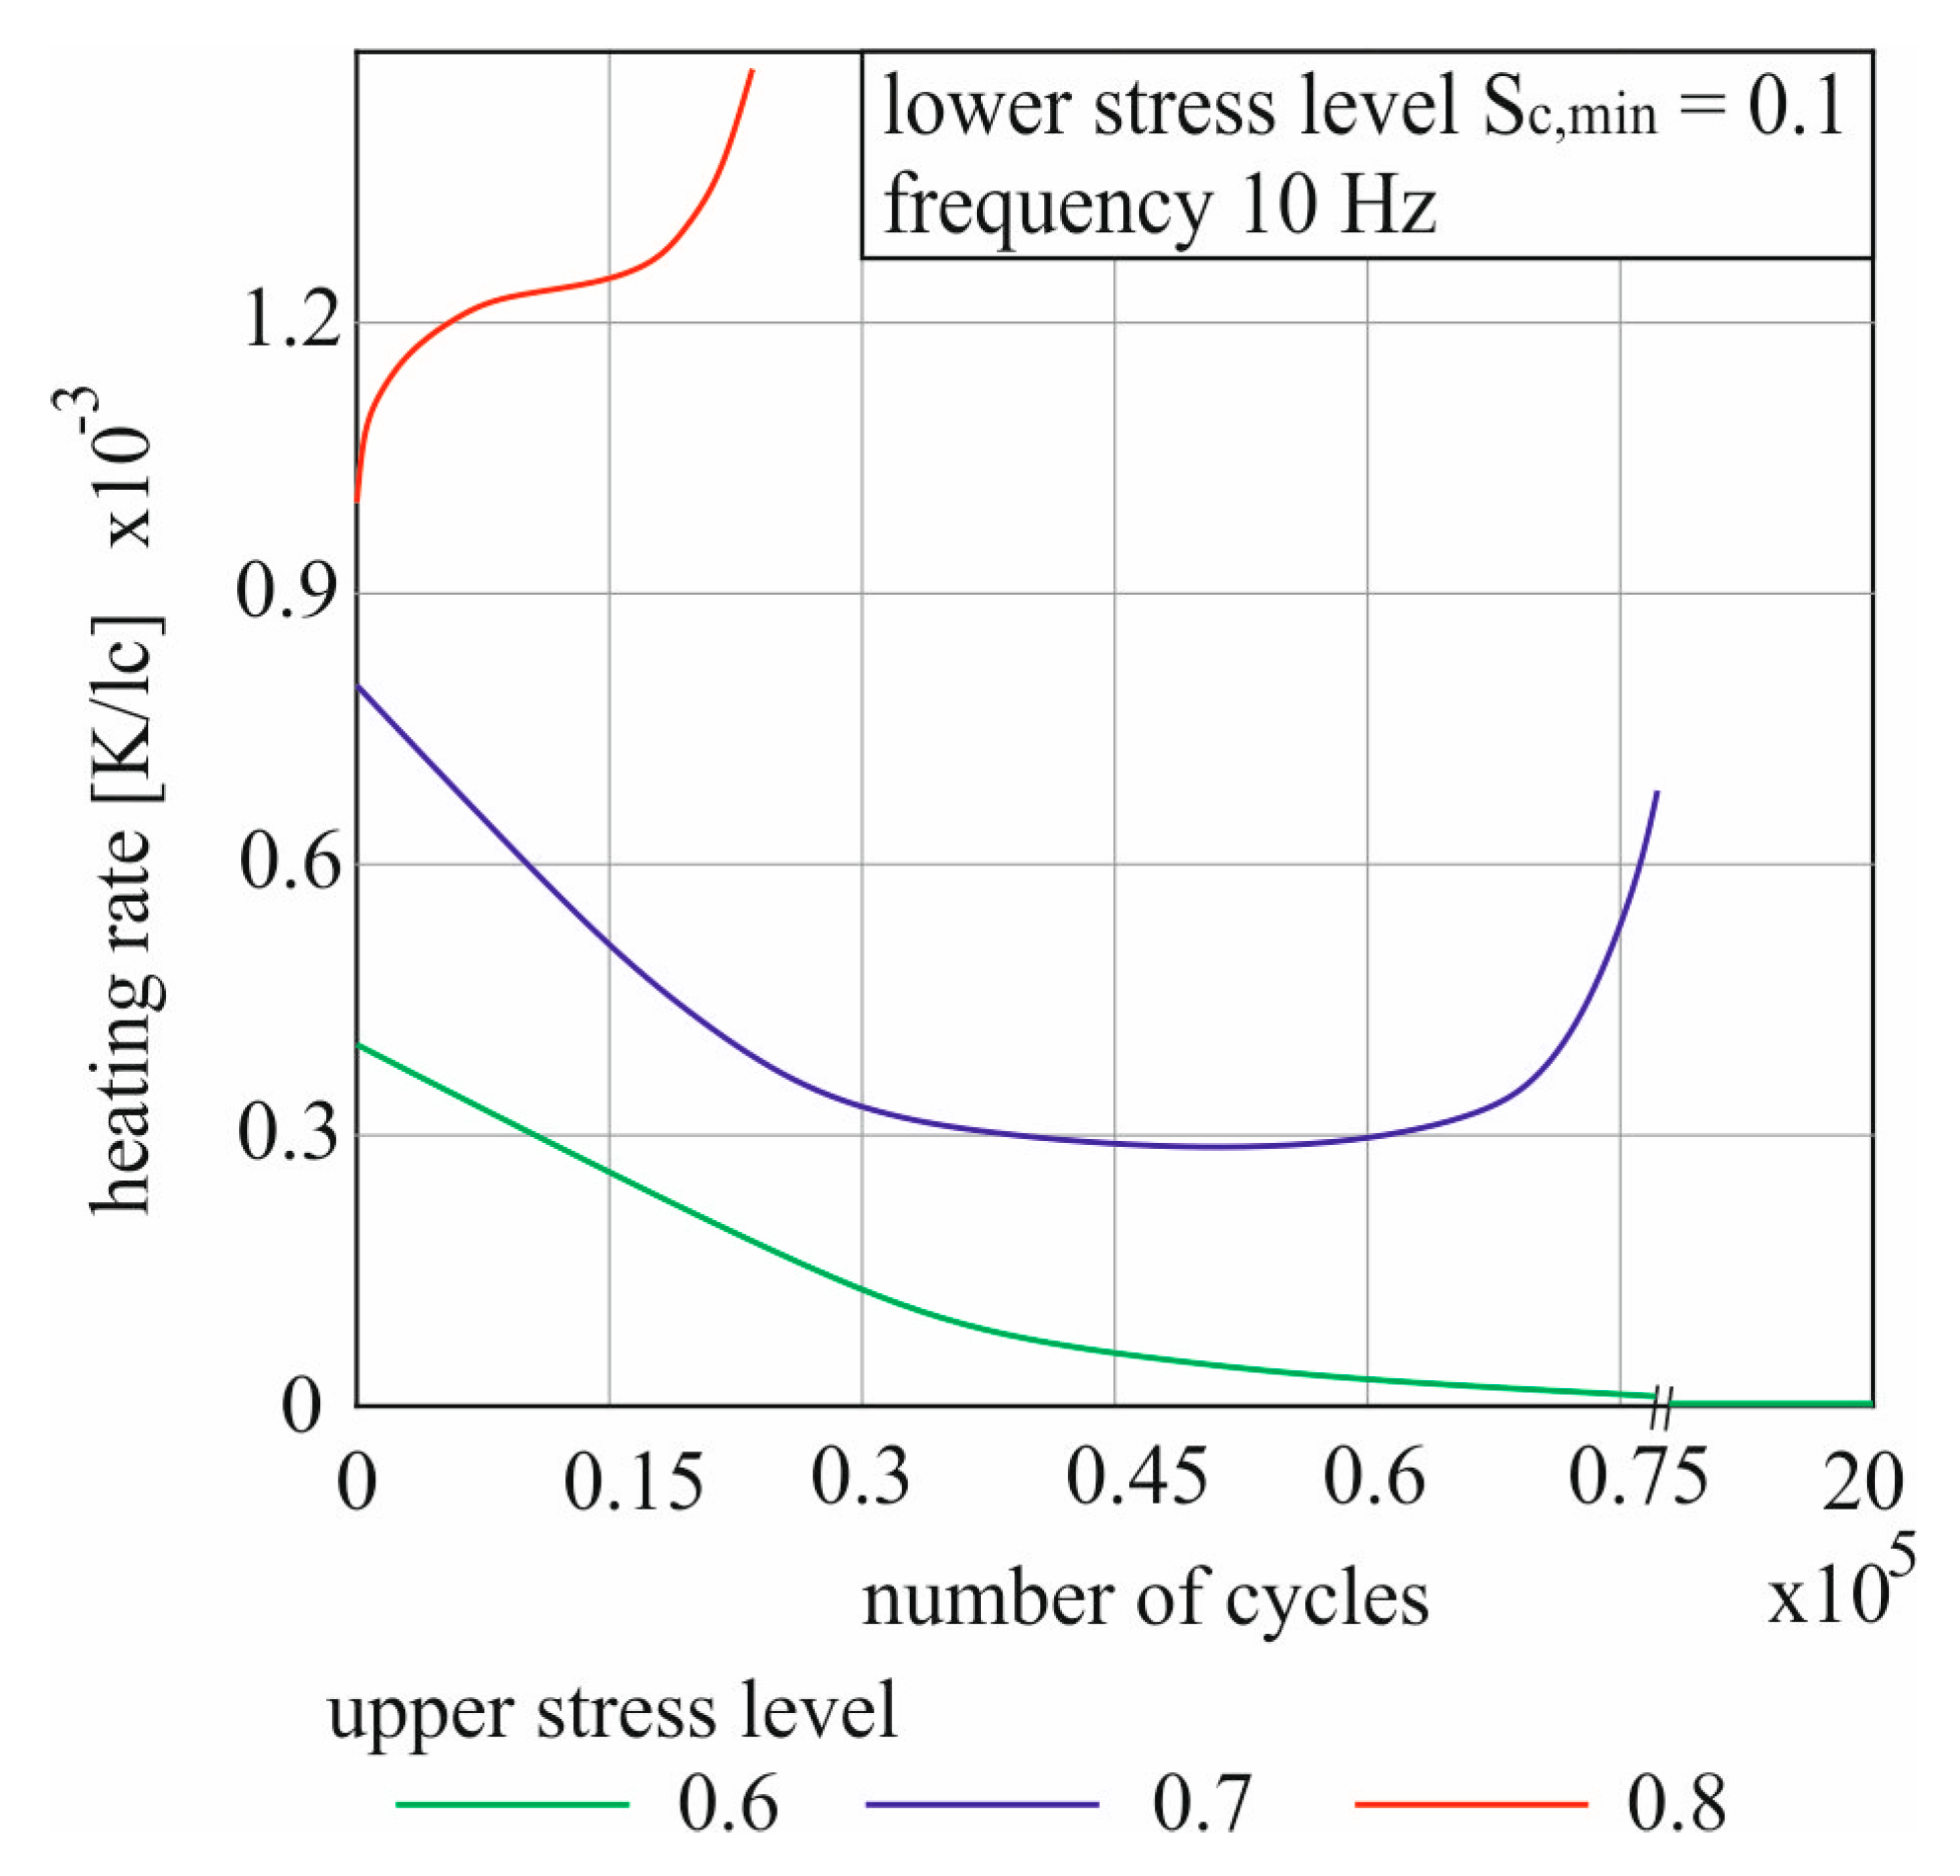
A last variant of a comparison of the heating rates is shown in
Figure 11. Using UHPC 1, the influence of the upper stress level on the heating rate for three attempts is shown here. An attempt can be seen for each stress cycle as a representative. All specimens were loaded with a test frequency of 10 Hz. The velocity of heating is again shown in relation to the load changes.
As expected, the lowest load cycle with s
c,max = 0.6 shows the lowest heating per load change. The starting value of 0.4·10
−3 K/lc is already the lowest. Then the speed decreases linearly and regressively until an increase of 0 is reached after 90 thousand load changes. From this point on, the heating curve has reached a constant value, compare
Figure 5b. The curve at s
c,max = 0.7 was already described in detail before, see
Figure 8,
Figure 9 and
Figure 10.
For s
c,max = 0.8 the highest starting heating velocity is obtained. After a starting value of 10
−3 K/lc, however, the warming further increased over the entire course. The maximum speed value was recorded with 1.49·10
−3 K/lc immediately before the failure occurred. As with all attempts that have achieved failure, there is again a progressive increase in the warming rate curve before failure. The seemingly linear courses of the heating in the tests with 80% of the mean concrete strength as upper stress level and a frequency of 10 Hz thus show an increase of the steepness over the whole test duration (
Figure 5). The degradation caused by the fatigue load also increased rapidly, which means that the sample failed after only 23.4 thousand load cycles. It can therefore be seen that a faster warming is achieved with a rising maximum stress level, because more energy and a larger plastic percentage in the load is also introduced via the compressive fatigue load per load change.


