Article

A Two-Stage Building Information Modeling Based Building Design Method to Improve Lighting Environment and Increase Energy Efficiency

1
Faculty of Infrastructure Engineering, Dalian University of Technology, Dalian 116024, Liaoning, China
2
School of Investment and Construction Management, Dongbei University of Finance and Economics, Dalian 116025, Liaoning, China
*
Author to whom correspondence should be addressed.
Appl. Sci. 2019, 9(19), 4076; https://doi.org/10.3390/app9194076
Submission received: 23 July 2019 / Revised: 29 August 2019 / Accepted: 25 September 2019 / Published: 29 September 2019
(This article belongs to the Special Issue BIM in the Construction Industry)

Abstract

:
Buildings are one of the largest energy consumers in the world, and have great energy saving potential. Thermal systems and lighting systems take most of the energy in a building. Comparing with the optimization solutions developed for a thermal system, the research of improving the lighting system is insufficient. This study aims to improve the lighting environment and reduce the energy by optimizing the building design, which has the largest potential for cutting energy economically compared with the other stages in the life cycle of a building. Although many approaches have been developed for building design optimization, there is still one big problem obstructing their successful practices, in that the designers who take the responsibility of making building designs are not experts in building physics, thus they are not capable of calculating the most appropriate parameters and operating the professional software to optimize their designs. Therefore, this study proposes a user-friendly method for designers to improve building designs. Firstly, Building Information Modeling (BIM) and particle swarm optimization algorithm are applied to build an intelligent optimal design search system. The optimized design from this system can largely use daylighting for internal illumination and save energy. Secondly, different types of lighting control systems are compared and the one which can save maximal energy is added to the selected optimal design. A case study demonstrates that optimized designs generated by the proposed design method can save large amounts of life cycle energy and costs, and is effective and efficient.

1. Introduction

Buildings ultimately account for 40% of the world’s energy [1]. To reduce the energy consumed by buildings has great impact on mitigating the greenhouse effect. Comparing with the other stages in the life cycle of a building, the design stage has the largest potential for energy conservation with the least extra expenses. Factors which have significant influences on building energy consumption, e.g., types and dimensions of building materials, building envelope, and structure, can all be carefully decided during building design. It has been estimated that the design stage determines about 70% of the environmental impacts of the entire life cycle [2]. Therefore, making a reasonable and sustainable building design is beneficial for both the project owners and the environment.

1.1. Daylight for Indoor Illumination

The Heating, Ventilation and Air Conditioning (HVAC) system and lighting system are the two largest energy consumers in a building [3,4,5]. Many efforts have been put into improving thermal performance of buildings for energy reduction. However, how to make a proper building design to optimize the indoor lighting environment and saving energy still needs to be discussed.
Daylight, which best matches the human visual response, is considered as the best substitution for artificial light in the indoor environment. It provides better color rendering and a visual environment in which occupants can properly see objects [6]. Apart from that, daylighting is a more environmentally-friendly approach compared to artificial lighting. Zain-Ahmed et al. [7] found that at least 10% of building energy can be saved using daylight alone. As such, using daylight to effectively create a comfortable indoor light environment is necessary for both occupant health [8,9] and building energy conservation [10].
A good building design, particularly the envelope design, is the basic solution for getting good use of daylight. By adjusting the parameters of design factors, sufficient daylight can be led into the room to take place for artificial light, thus that a part of the energy consumed by artificial lighting will be saved, and the indoor visual comfort will be improved as well [11]. Krarti et al. [12] developed a simplified energy estimation model to analyze the energy reduction by daylighting. The model considered four parameters: Building geometry, glazing types, window areas, and geographic locations. Results showed that glazing type and window area had more significant impacts on energy conservation. Ochoa et al. [13] investigated the thermal and visual performance of buildings with different window sizes, to search for a design that can achieve the objectives of low energy consumption and high visual comfort. Although the key design factors are confirmed, it is difficult to decide the parameter value of each factor to achieve the optimal lighting performance. The direct way is the trial-and-error method. Researchers tried every possible parameter value to search for the one which can take the best performance [14,15,16]. This type of methods performs well in the cases of small-scale buildings or in which only a few design factors are considered. When the building scale becomes larger, they cannot afford the large amount of computations. Then simulation tools are applied for lighting performance prediction to reduce the calculative burden [17,18,19,20]. Simulation tools can largely shorten the calculation time and improve the accuracy of the results, thus designers can quickly make a good design with an optimized lighting environment. Actually, a good design must be well performed on not only the lighting aspect, but also others such as the thermal environment and energy consumption. Besides, for the project owners, project cost is a crucial factor to be carefully controlled during the design. Therefore, some other methods are required to find a balance in the problems with multi-objectives. Mangkuto et al. [21] tried a graphic optimization method to search for the designs with the minimum annual lighting energy demand and to fulfill the indoor visual requirement. Evolutionary multi-objective optimization algorithms, such as NSGA-II and PSO-HJ, are more popularly applied to achieve the win-win goal of both the energy-efficiency and visual comfort of buildings [22,23,24]. These optimization methods are usually combined with thermal and lighting simulation engines, e.g., EnergyPlus, Radians, and Daysim, thus that the calculation speed and the result precision can be promoted to an all-time high.
A lighting control system is another way to improve the illumination environment. There are mainly three kinds of lighting control modes, i.e., manual light switching (MLS) (on/off), automatic light switching (ALS) (on/off), and automatic light dimming (ALD) (on/off) [25]. The lighting control systems can adjust the room illuminance as the lighting situation changes to avoid glare or light deficiency. Studies has proved that lighting control can provide a more comfortable visual environment [26] and save up to 70% of the energy of a lighting system [27,28,29,30].

1.2. Barriers of Making a Good Building Design

Making an energy-efficient design with good building performance is the most cost-effective way to keep the project sustainable over its entire life cycle. It requires the designers to put more effort into the building physics and structure during design. However, for the designers, it is difficult to achieve the objectives above. The barriers are as follows.
(1)
Most of the designers are not experts in the area of building physics, thus they are not able to calculate the quantity of energy consumption and the levels of thermal and lighting performance of their building designs [31]. To solve this problem, designers have to follow the standards of the green building handbooks, such as Leadership in Energy and Environmental Design (LEED) and Building Research Establishment Environmental Assessment Method (BREEAM). However, the standards in these handbooks are the minimum thresholds for general buildings, thus they cannot fulfill the requirements of each specific building, which leads to the incomplete optimization on building performance [32].
(2)
In order to procure reliable and accurate optimization results quickly, simulation tools for thermal performance and lighting performance are necessary. Since designers do not understand every parameters of building physics and structure, they do not know how to preset the reasonable parameter values and operate the software successfully [33,34]. In addition, it will take a long time for designers to learn how to operate the simulation software, which is not only a burden for them, but also slows down the design work.

1.3. Objectives

The aim of this study was to overcome the barriers stated above and propose a user-friendly building design method, which can take advantages of both building design optimization and lighting control system to save energy as well as improve the indoor lighting environment. The specific objectives of this study are as follows:
(1)
The first objective was to improve the lighting environment in buildings by fully using daylight instead of artificial lighting and by applying an appropriate lighting control system.
(2)
The second objective was maximizing energy savings by optimizing the initial building design.
This study can help designers make optimal building designs, which can fulfill the requirements of the environment, clients and occupants, and raise the design work efficiency, thus, to increase the success rate of sustainable building projects.

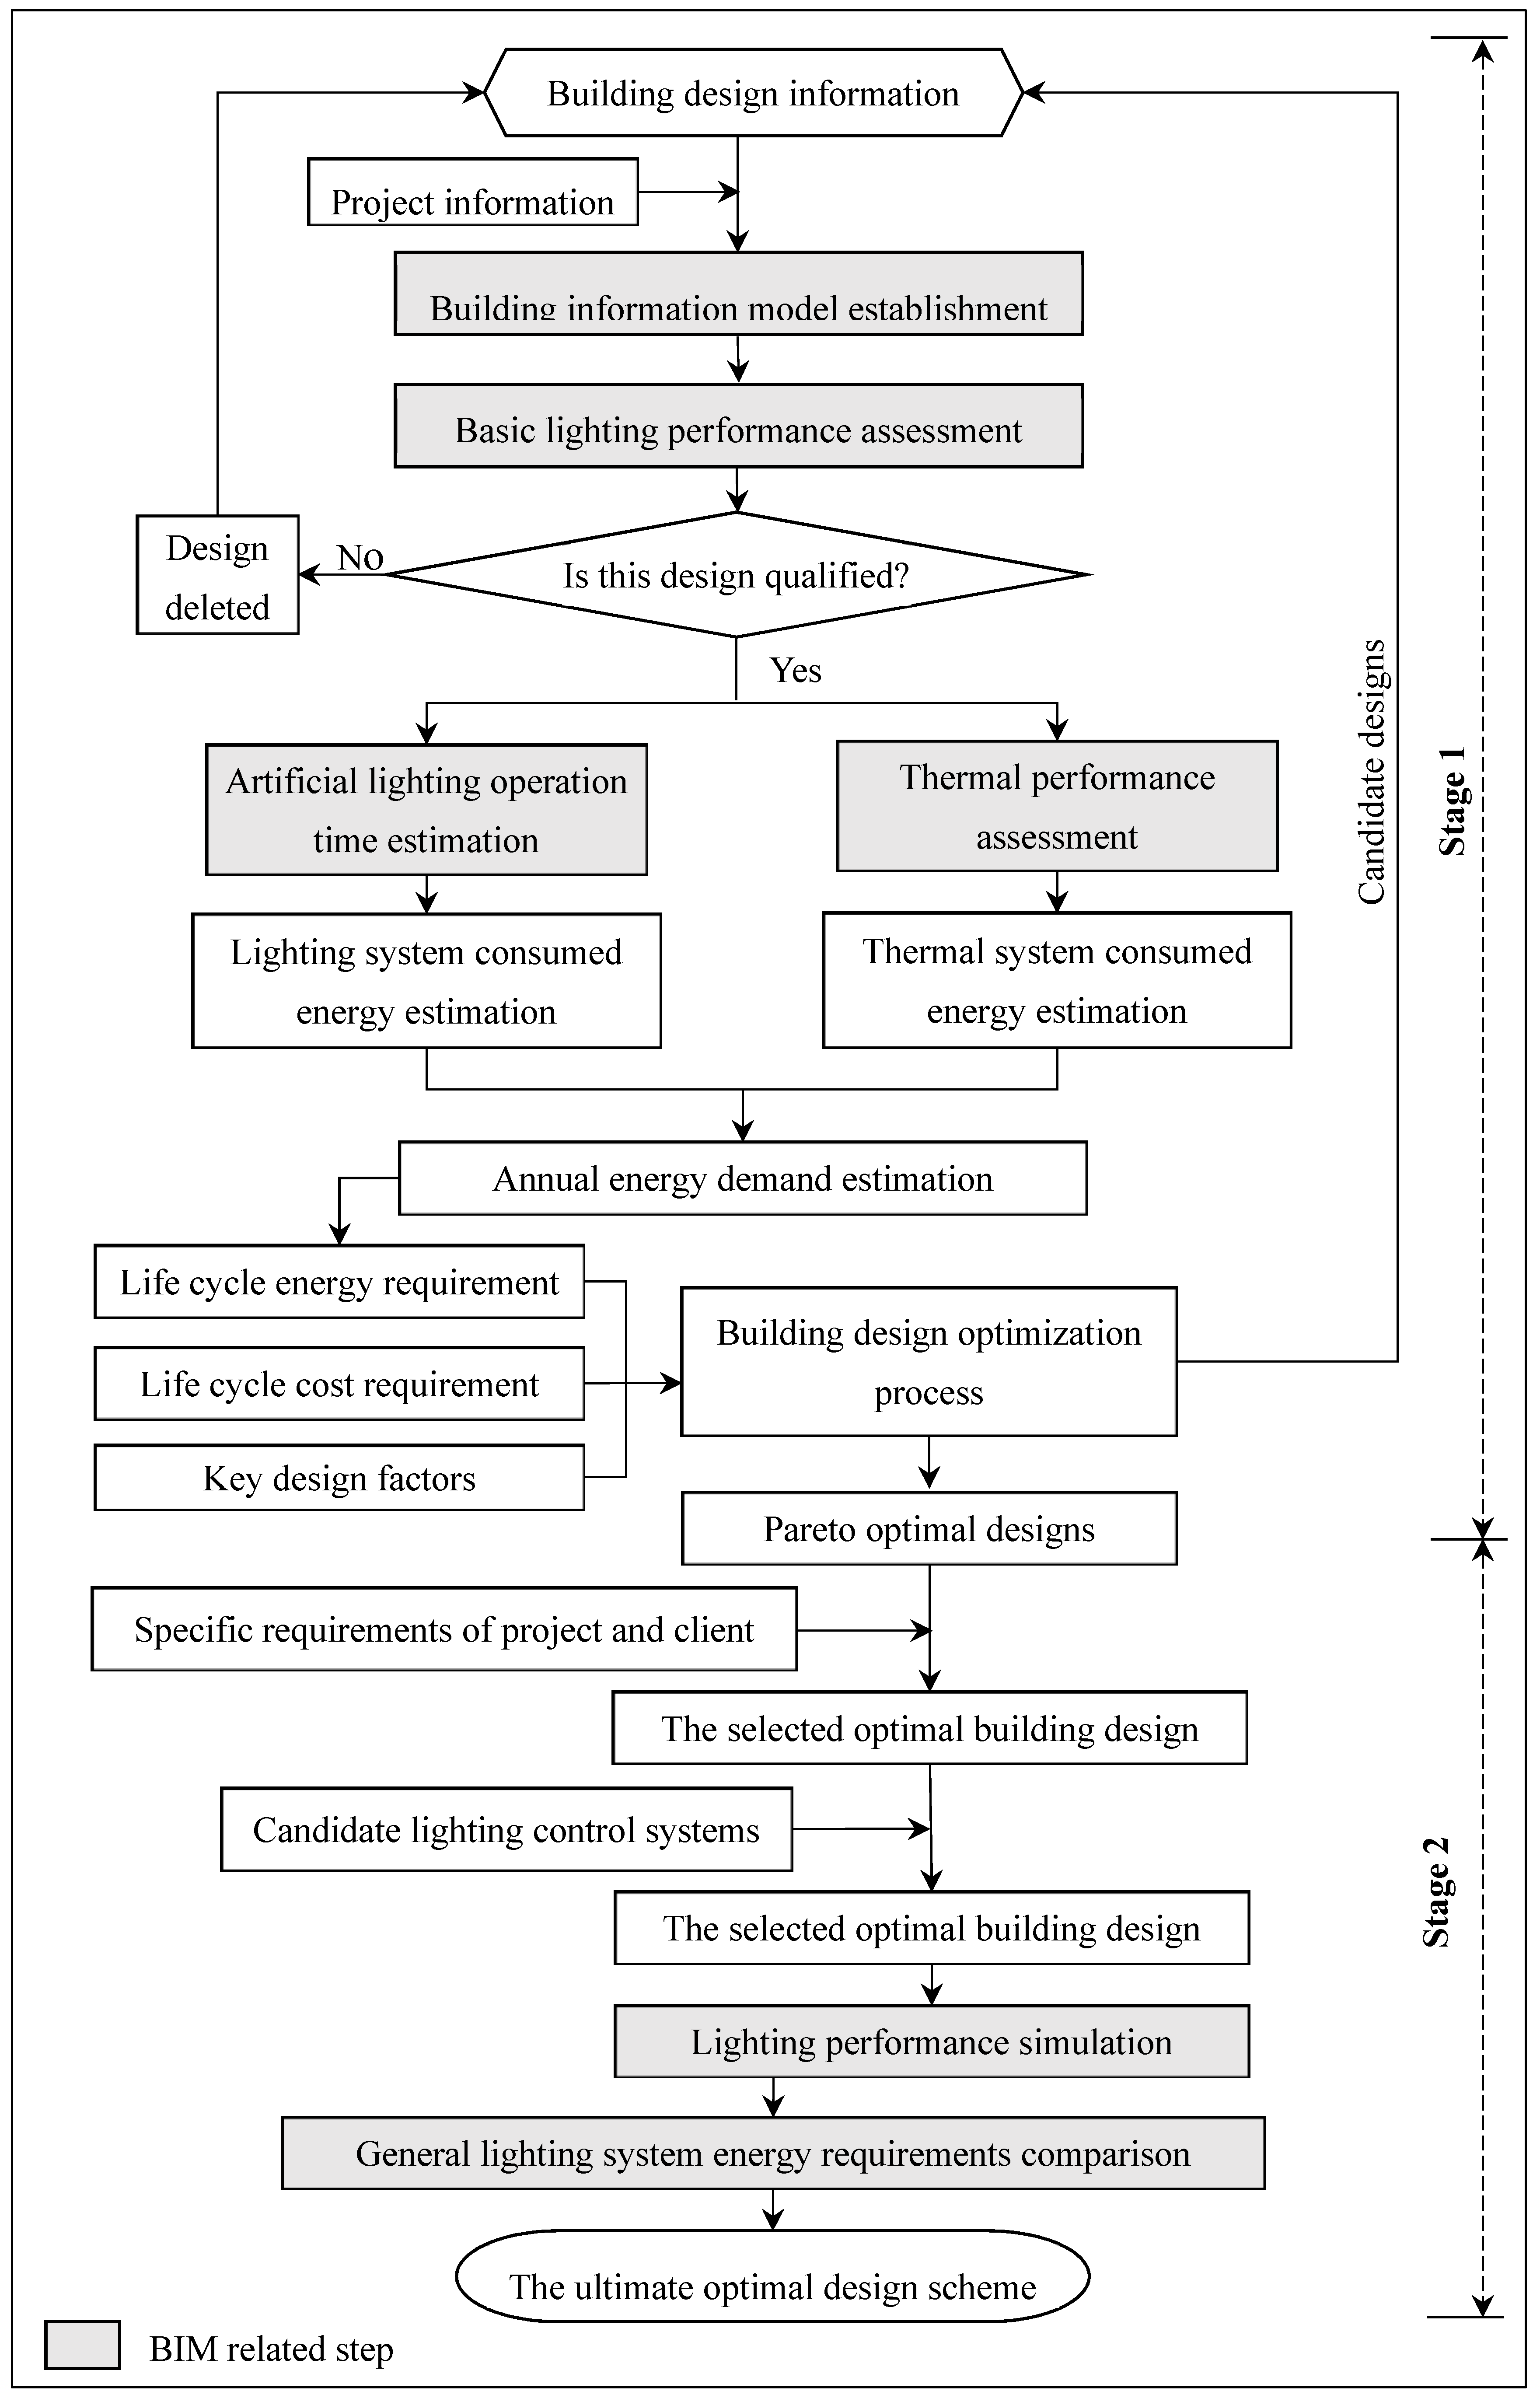
2. Two-Stage Building Information Modeling (BIM) Based Lighting Design Method

The proposed lighting design method consists of two stages: Building design optimization and lighting control system selection. To maximize the efficiency of the process, BIM was selected as a computing platform to integrate the database, simulation, and computation modules. Figure 1 illustrates the schematic structure of the proposed BIM based building design method.

2.1. Stage 1: Building Desing Optimziation

2.1.1. Building performance simulation

This proposed lighting design method was based on a completed initial building design scheme, which integrated specific client requirements and the project environment. Complete information about the initial design was entered into the BIM system to establish a three-dimensional (3D) building information model. Information related to the project, such as geographical coordinates and the project location’s climate, must also be entered into the model.
To ensure all candidate designs could qualify the minimum lighting standard, the first step was to do a basic lighting performance assessment. Lighting performance of a building envelope can be simulated using BIM, and the ones which cannot achieve the daylight factor of 2% will be eliminated.
Several studies have found that heating, ventilation and air conditioning (HVAC), and lighting systems consume the most energy in a building [35,36,37]. The goal of this study was to both improve lighting performance and save energy. As such, both thermal and lighting performance must be discussed. Therefore, when receiving the qualified design, the BIM simulation module was applied to generate the estimates of artificial lighting time and the assessments of thermal performance.
For a lighting system, the operation time of the lighting facilities was estimated based on daylight autonomy (DA) at a specific illumination level. An analysis grid with a specific dimension was generated to cover the test area; test points were simulated for DA within the workday. Considering that there were plenty of test points, thus the average DA ( D A ¯ ) of all these points was used at this step for the estimates. Consequently, the annual total operation time of lighting facilities ( T l i t ) can be calculated using Equation (1):
T l i t = ( 1 D A ¯ ) × t w r k
In this expression, t w r k is the annual total working time of the test area.
Based on T l i t , annual total energy required by the lighting system ( E l i t ) can be estimated using Equation (2):
E l i t = n = 1 N ( T l i t × P l i t ) n
In this expression, n = 1, 2, 3, … , N is the number of lighting facilities in the test area; and P l i t is the power of the lighting facilities.
For the thermal system, the thermal performance of the building envelope was evaluated based on the energy provided to the HVAC system to maintain thermal neutrality. Therefore, the monthly cooling load and heating load were estimated using the thermal simulation engine of the Ecotect Analysis, which was produced by Autodesk Inc. Then, the amount of energy consumed by the thermal system yearly ( E t e r ) could be computed using the coefficients of performance (COP) for the chiller and heating pump, as shown in Equation (3):
E t e r = k = 1 12 ( E c e c + E h e h ) k
In this expression, k = 1, 2, 3, … , 12 is the month number; E c and E h are the monthly loads for cooling and heating, respectively; and e c and e h are the COPs for the chiller and heat pump, respectively.
The annual total energy demand of the design ( E s u m ) is the sum of the energy consumed by the lighting system and thermal system; as such, it can be calculated using Equation (4):
E s u m = E l i t + E t e r
After the simulation process, the annual total energy demand of lighting and thermal systems are entered into the optimization module for further computation.

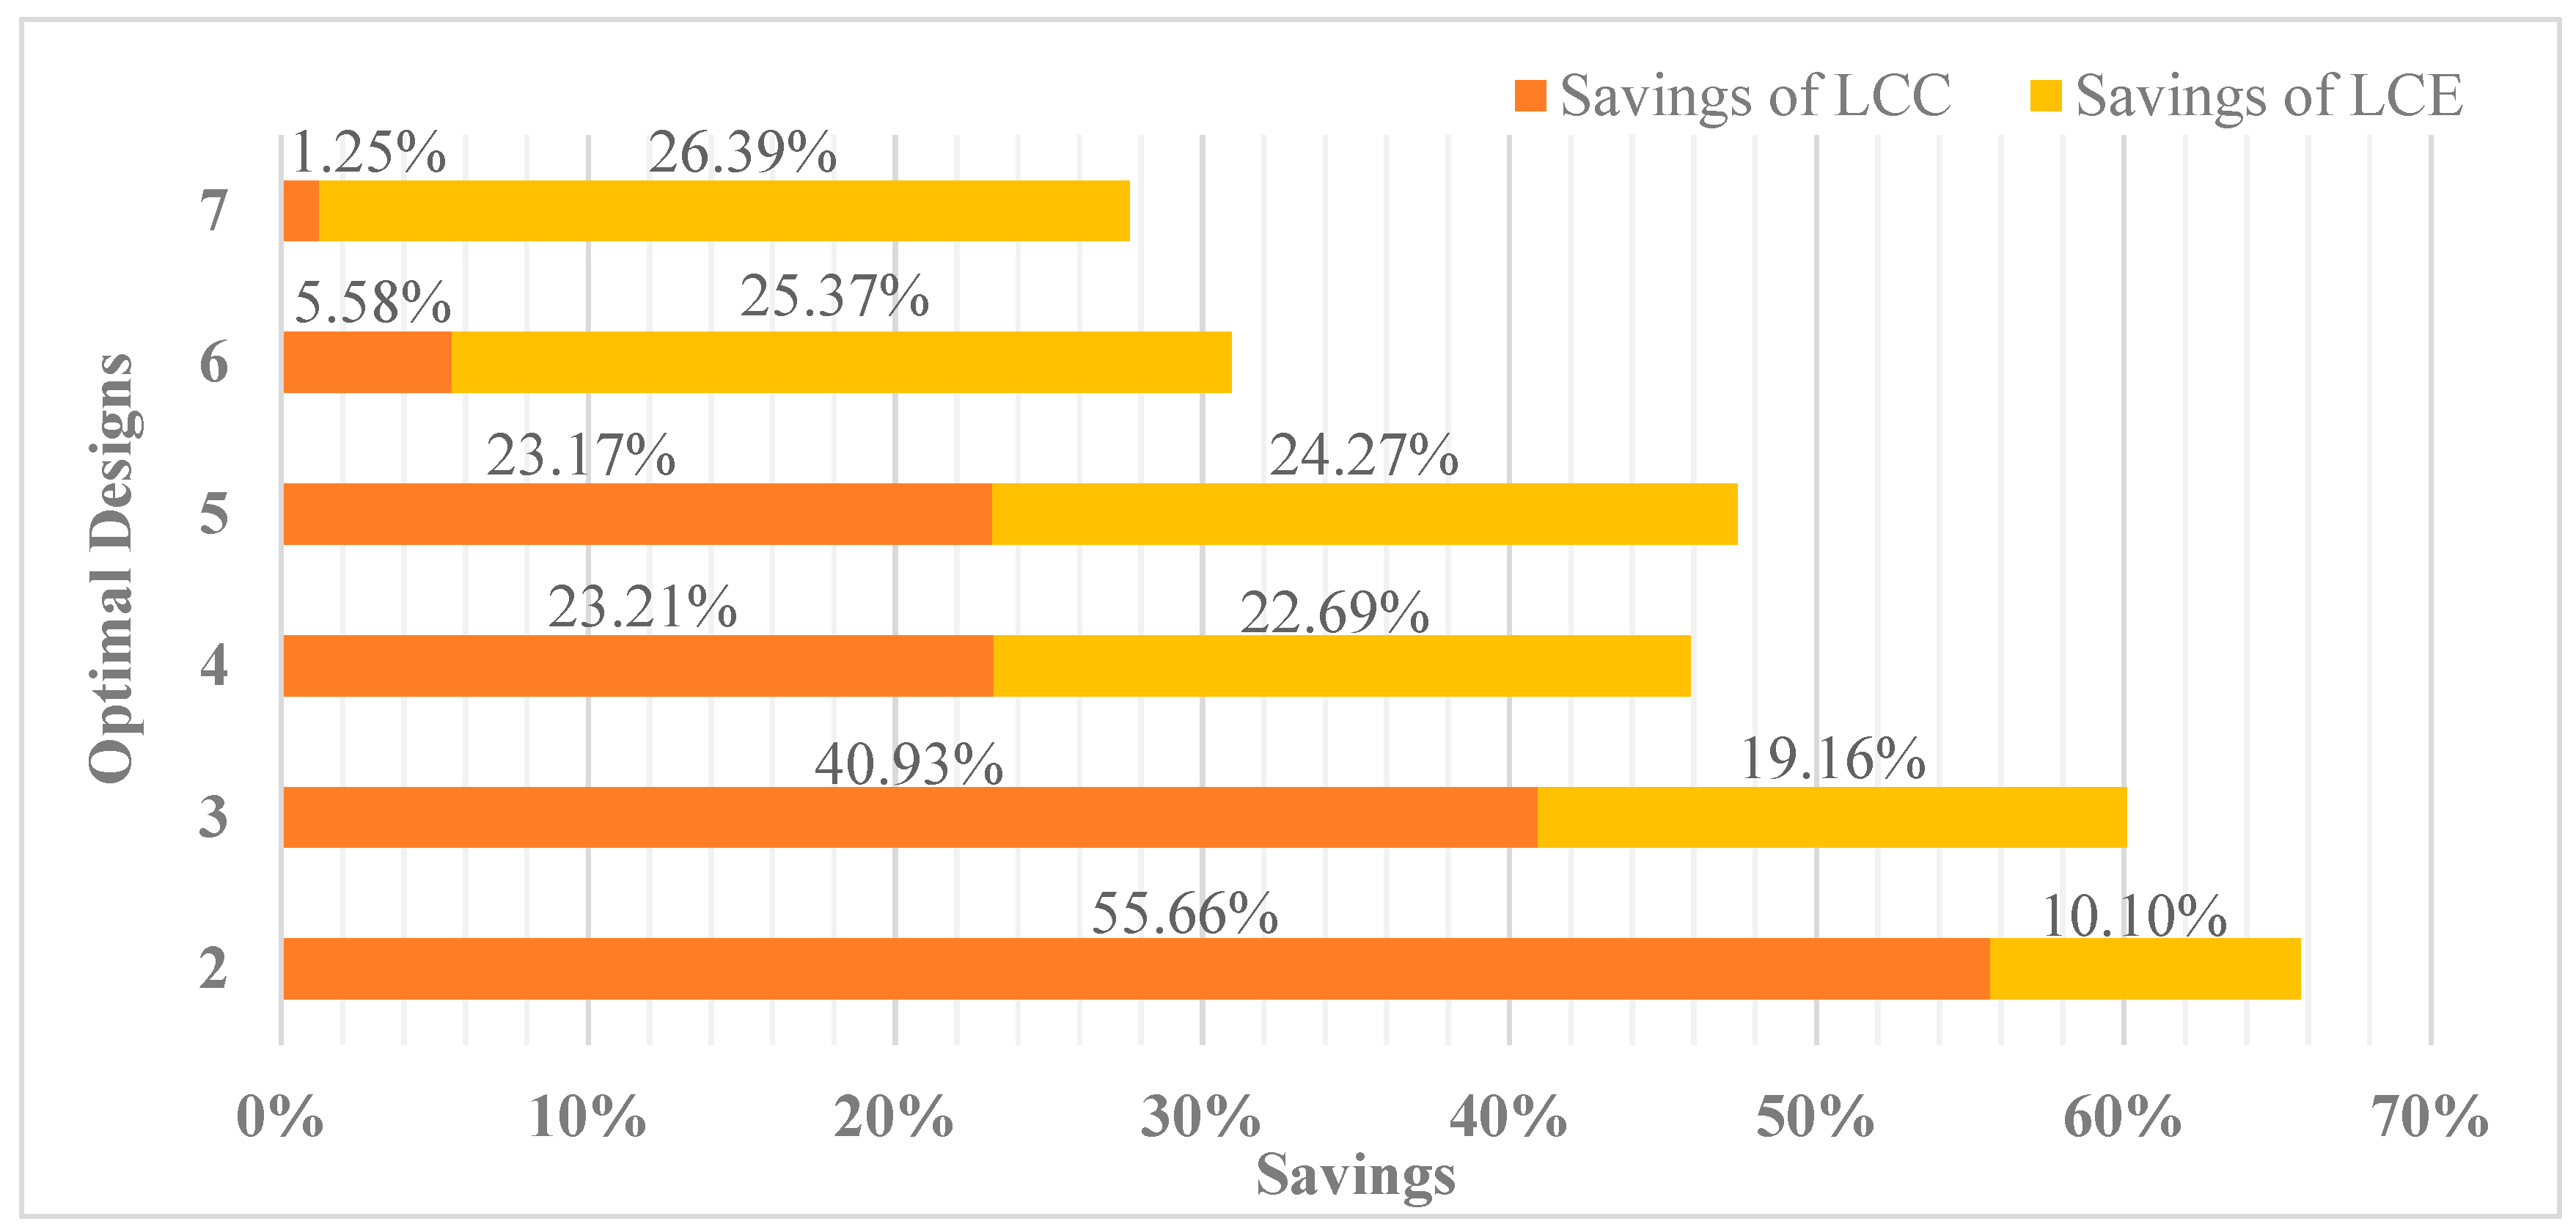
2.1.2. Building Design Optimization

In this study, a particle swarm optimization (PSO) algorithm was selected to generate the optimal design. This is because it has the advantages of evolutionary algorithms (i.e., inherent parallelism and the ability to exploit similarities in solutions through recombination [38]), and had the characteristics of directed mutation, population representation and operators, and others. The revised PSO algorithm used in this study ensures global convergence at a higher speed.
As mentioned above, the two objectives of the optimization module were to minimize the project’s life cycle energy (LCE) consumption and life cycle cost (LCC). The effects of the design and demolishment stages on the LCE and LCC were negligible, and data on these factors were difficult to obtain. As such, the life cycle of this study only included the construction and operation stages. Therefore, the LCE can be calculated using Equation (5):
L C E = E c o n + E o p r = j = 1 J Q j × f j + E s u m × M
In this expression, E c o n and E o p r represent the energy consumed at the construction stage and operation stage, respectively; j = 1, 2, 3, …, J is the number of building materials used in the design; Q j is the quantity of the jth material; f j is the energy intensity of the jth material; and M is the operation time for the project.
Similarly, the LCC was composed of the construction cost and the operation cost. The LCC reflects cash flows at different stages, requiring the calculation of the time value of money. Consequently, all LCC elements were converted to the present value. The actual LCC was computed using Equation (6):
LCC = C c o n + C o p r = j = 1 J ( Q j × p j ) + m = 1 M ( C o p r ) m × ( i + 1 ) m
In this expression, C c o n and C o p r are the costs of the construction stage and operation stage, respectively; p j is the price of the jth material; and i is the real interest rate for a compounding period, which considered the effect of inflation.
Decision variables were another important aspect of optimization. In this study, design factors, which significantly influenced lighting and thermal performances, were set as decision variables. Many studies have demonstrated that wall types, glazing types, and window-to-wall ratio were the most significant design factors [39,40,41,42]. Artificial lighting types was also an important factor in illumination and energy consumption [25,43]. Therefore, these 4 design factors were selected as the decision variables in the optimization module.
For clients, project costs were a crucial element impacting decisions. As such, the constraints set in the optimization module included both the construction cost and the design’s LCC, which cannot exceed their respective budgets.
The output of the proposed optimization system was a Pareto-optimal solution set, which contained several optimal design schemes. The solutions were non-dominated with each other; as such, the client must select the solution that can fulfill most of the project requirements for the following processes.

2.2. Stage 2: Lighting Control System Selection

The second stage of this study was to select an appropriate lighting control mode for the selected optimal building design. In this study, 3 popular lighting control modes were evaluated as candidates for improving lighting performance [44,45]. The first mode was a manual light switching (MLS), where people must manually turn the lights on/off, depending on indoor brightness preferences. The second mode was automatic light switching (ALS) with an occupancy sensor that automatically turns the lights on or off depending on whether someone is in the room. The third mode was an automatic light dimming with occupancy sensor (ALD). Similar was ALS, the occupancy sensor controlled the operating conditions, however, the lights dim instead of turning off when no one was in the room.
When receiving the selected optimal design scheme, the LCE and LCC of the design with 3 lighting control modes had to be estimated, respectively. The ultimate optimized design was generated by comparing the results of the 3 scenarios.

3. Case Study

The case study for this research was a lecture room in the east Teaching Building of Dalian Minzu University. The goal was to validate the effectiveness and efficiency of the proposed BIM based building design method. The room had an area of 126.36 mq and was located at the northeast of the building on the second floor. The distance from the floor to roof was 4.5 m; the ceiling height was 3.5 m. There were 8 windows in the east wall, one narrow window in the north wall, and two doors in the south wall. The narrow window in the north wall was mainly aesthetic, and as such, was not considered during the design optimization process. Figure 2 shows the room’s outline. There were a total of 20 lights in the room. Table 1 shows the detailed information about the initial design. To facilitate the application of the proposed design method, it was assumed that all the building materials were purchased in Liaoning Province. The building’s lifetime was calculated as 50 years.
The BIM software used in this study for the simulations was Ecotect Analysis 2011 (Autodesk Inc., San Rafael, Calif., the USA, 2011). The software established a 3D building information model, with the location and climate information. The workday schedule was set as 6:00 to 18:00. When calculating the total annual energy for the room, the year was set as 365 days, with no holidays during the year.
In the lighting performance simulation module, the analysis grid was set at a height of 750 mm above the floor, with 496 uniformly distributed points. The standard illumination at the workplace was 500 lux; as such, the artificial light operation time was be calculated based on D A ¯ 500, and the lights were controlled manually.
The city of Dalian in Liaoning Province of China, has a warm temperate continental monsoon climate. Therefore, both heating and cooling were required. In this case, a water-cooled chiller with a COP of 4.7 was used. The indoor design temperature was set at 26 °C in the summer and 18 °C in the winter, without night setback or setup.
Additional study design details were as follows. Based on the charging standard of electricity in Dalian, the electricity tariff was set at 0.8 CNY/kWh. The real interest rate was counted to be −6.45%, based on the inflation rate. The maximum construction cost and the maximum LCC were set at CNY ¥50,000 and CNY ¥15,000,000, respectively, based on interviews with project owners and project managers.
After a series of lighting performance and thermal performance simulations, simulation outputs were used to estimate the annual energy demand. This result was entered into the building design optimization system. Key parameters were set as follows: The cognitive parameter (c1) and social parameter (c2) were both set at 1.49445; the minimum inertia weight (wi) was 0.4; the maximum inertia weight (wa) was 0.9; the population size (N) was 50; the maximum iteration number (maxit) was 100; the maximum repository size (Anum) was 50; the grid inflation parameter (α) was 0.01; the leader selection pressure parameter (β) was 10; and the grid sum per dimension (gridnum) was 50.
Table 2 presents detailed information about the decision variables; these were also important design factors. Energy intensities of the materials were collected from [46] and determined based on [47,48,49,50,51].
After the iterations were completed, a Pareto frontier was generated (see Figure 3). Table 3 provides detailed information about the optimal designs. These design solutions are non-dominated with each other, making it difficult to distinguish the best one. The designer selects the optimum design, based on the client’s preferences and specific requirements. Of the solutions, although the first one was non-dominated with the initial design, it was not further considered because of its larger LCE. The fifth design in Table 3 was selected as the optimum solution for the process that follows.
As introduced in Section 2.2, the LCEs and LCCs of the fifth optimal design were estimated, using the 3 lighting control modes. The annual energy consumption of the fifth design with ALS can be calculated using Ecotect Analysis. Considering that the MLS had high randomness, and Ecotect cannot provide precise values based on the ALD, the values for these 2 modes were determined based off statistical results from experiments and related studies [44,45]. Table 4 provides the performances of the 3 modes.
When comparing the performances of the 3 lighting control modes, ALS had the lowest LCC and LCE. Consequently, the ultimate optimal design scheme was the fifth design with the automatic light switching with occupancy sensor.

4. Discussion

This study developed a method that can support significant savings in both energy and cost. The LCC and the LCE of the Pareto optimal designs (except the first design) generated at Stage 1 were compared with the LCC and LCE of the initial design; Figure 4 shows the results. This outcome illustrates that most designs performed better than the initial design: The LCC savings ranged from 1.25% to 55.66% and the LCE savings ranged from 10.10% to 26.39%. As a result, this proposed method can help achieve the goal of developing high-quality designs.
At Stage 2, the best fit lighting control mode was added to the selected optimal design. Table 5 shows that compared with the initial design, the ultimate optimal design can save 22.92% of the LCC and 24.26% of the LCE. The savings of the ultimate optimal design required a little more LCC and LCE than the fifth design. This is because in fifth design assumed that the occupancy can turn the lights on/off in time when the indoor illumination cannot/can be up to the standard of 500 lux. In contrast, for the ultimate optimal design, the lights were controlled using occupancy sensor switches, which have extra energy consumption and costs. The lighting control mode in the fifth design cannot be realistically achieved. As such, a lighting control mode is necessary in the proposed lighting design method.
In the proposed lighting design method, the computer generated most of the procedures. The computing time required 82 h, faster than with traditional design methods. Further, during the process, designers only needed to build the model into the simulation software, select the design factors, and enter the pre-set values into the program. This method required less professional knowledge of architectural physics, reducing the difficulty of selecting an excellent sustainable building design scheme. These factors demonstrated the efficient, precise, and user-friendly characteristics of this method.

5. Conclusion

This study provides a holistic building design method for improving the indoor lighting environment and saving energy. The approach has a goal of making full use of daylight to substitute for artificial light and reduce energy. This reduces energy and creates a comfortable indoor lighting environment for occupants. The proposed method can achieve these objectives by changing the key design factors of the initial design scheme to improve building performance. With the support of BIM and PSO, the optimal design procurement can be processed using the computer. This avoids the problems of heavy workloads, a narrow scope of optimal solutions, low accuracy, and other problems. When daylight cannot support enough brightness, an appropriate lighting control mode is selected to monitor the artificial lights working time and adjust the brightness. This improves energy efficiency and extends the lifetime of the lights.
This case study demonstrated the modeling approach that is easy for designers. Further, the results demonstrate that the proposed design method can largely save energy and costs within a building’s life cycle. The entire operation process is easy to conduct. Specific requirements of designers and clients can be set by changing the value range of corresponding parameters before running the program. Therefore, the two stage BIM-based building design method is user-friendly, effective, and efficient tool for both designers and clients to procure optimal designs. This yields both environmental and economic benefits.

Author Contributions

Conceptualization, S.L.; methodology, S.L.; software, X.N.; validation, S.L. and X.N.; formal analysis, S.L.; investigation, X.N.; resources, S.L.; data curation, S.L.; writing—original draft preparation, S.L.; writing—review and editing, X.N.; visualization, X.N.; supervision, X.N.; project administration, S.L. and X.N.; funding acquisition, S.L. and X.N.

Funding

This research was funded by National Natural Science Foundation of China (Grant Nos. 71801029, 71501029), Program for Innovative Talents in Liaoning Province of China 2018, and the Program for Excellent Talents in Dongbei University of Finance and Economics (Grant No. DUFE2017R11).

Conflicts of Interest

The authors declare no conflict of interest.

References

  1. Shaikh, P.H.; Nor, N.B.M.; Nallagownden, P.; Elamvazuthi, I.; Ibrahim, T. A review on optimized control systems for building energy and comfort management of smart sustainable buildings. Renew. Sustain. Energy Rev. 2014, 34, 409–429. [Google Scholar] [CrossRef]
  2. Rebitzer, G. Integrating life cycle costing and life cycle assessment for managing costs and environmental impacts in supply chains. In Cost Management in Supply Chains; Physica: Heidelberg, Germany, 2002; pp. 128–146. [Google Scholar]
  3. Wei, Y.; Zhang, X.; Shi, Y.; Xia, L.; Pan, S.; Wu, J.; Han, M. A review of data-driven approaches for prediction and classification of building energy consumption. Renew. Sustain. Energy Rev. 2018, 82, 1027–1047. [Google Scholar] [CrossRef]
  4. Futrell, B.J.; Ozelkan, E.C.; Brentrup, D. Bi-objective optimization of building enclosure design for thermal and lighting performance. Build. Environ. 2015, 92, 591–602. [Google Scholar] [CrossRef]
  5. Yoon, Y.R.; Moon, H.J. Energy consumption model with energy use factors of tenants in commercial buildings using Gaussian process regression. Energy Build. 2018, 168, 215–224. [Google Scholar] [CrossRef]
  6. Lim, Y.W.; Kandar, M.Z.; Ahmad, M.H.; Ossen, D.R.; Abdullah, A.M. Building façade design for daylighting quality in typical government office building. Build. Environ. 2012, 57, 194–204. [Google Scholar] [CrossRef]
  7. Zain-Ahmed, A.; Sopian, K.; Othman, M.Y.H.; Sayigh, A.A.M.; Surendran, P.N. Daylighting as a passive solar design strategy in tropical buildings: A case study of Malaysia. Energy Convers. Manag. 2002, 43, 1725–1736. [Google Scholar] [CrossRef]
  8. Hwang, T.; Kim, J.T. Effects of indoor lighting on occupants’ visual comfort and eye health in a green building. Indoor Built Environ. 2011, 20, 75–90. [Google Scholar] [CrossRef]
  9. Shishegar, N.; Boubekri, M. Natural light and productivity: Analyzing the impacts of daylighting on students’ and workers’ health and alertness. In Proceedings of the International Conference on Health, Biological and Life Science (HBLS-16), Istanbul, Turkey, 18–19 April 2016. [Google Scholar]
  10. Cammarano, S.; Pellegrino, A.; Lo Verso, V.R.M.; Aghemo, C. Dayligting design for energy saving in a building global energy simulation context. Energy Procedia 2015, 78, 364–369. [Google Scholar] [CrossRef]
  11. Al-Khatatbeh, B.J.; Ma’bdeh, S.N. Improving visual comfort and energy efficiency in existing classrooms using passive daylighting techniques. Energy Procedia 2017, 136, 102–108. [Google Scholar] [CrossRef]
  12. Krarti, M.; Erickson, P.M.; Hillman, T.C. A simplified method to estimate energy savings of artificial lighting use for daylighting. Build. Environ. 2005, 40, 747–754. [Google Scholar] [CrossRef]
  13. Ochoa, C.E.; Aries, M.B.C.; van Loenen, E.J.; Hensen, J.L.M. Considerations on design optimization criteria for windows providing low energy consumption and high visual comfort. Appl. Energy 2012, 95, 238–245. [Google Scholar] [CrossRef] [Green Version]
  14. Ashrafian, T.; Moazzen, N. The impact of glazing ratio and window configuration on occupants’ comfort and energy demand: The case study of a school building in Eskisehir, Turkey. Sustain. Cities Soc. 2019, 47, 1–14. [Google Scholar] [CrossRef]
  15. Reinhart, C.F.; Mardaljevic, J.; Rogers, Z. Dynamic daylight performance metrics for sustainable building design. Leukos 2006, 3, 7–31. [Google Scholar] [CrossRef]
  16. Hee, W.J.; Alghoul, M.A.; Bakhtyar, B.; Elayeb, O.K.; Shameri, M.A.; Alrubaih, M.S.; Sopian, K. The role of window glazing on daylighting and energy saving in buildings. Renew. Sustain. Energy Rev. 2015, 42, 323–343. [Google Scholar] [CrossRef]
  17. Huang, Y.C.; Lam, K.P.; Dobbs, G. A scalable lighting simulation tool for integrated building design. In Proceedings of the Third National Conference of IBPSA-USA, Berkeley, CA, USA, 30 July–1 August 2008. [Google Scholar]
  18. Lagios, K.; Niemasz, J.; Reinhart, G. Animated building performance simulation (ABPS)—Linking rhinoceros/Grasshopper with Radiance/Daysim. In Proceedings of the Forth National Conference of IBPSA-USA, New York, NY, USA, 11–13 August 2010. [Google Scholar]
  19. Kota, S.; Haberl, J.S.; Clayton, M.J.; Yan, W. Building information modeling (BIM)- based daylighting simulation and analysis. Energy Build. 2014, 81, 391–403. [Google Scholar] [CrossRef]
  20. Lee, J.W.; Jung, H.J.; Park, J.Y.; Lee, J.B.; Yoon, Y. Optimization of building window system in Asian regions by analyzing solar heat gain and daylighting elements. Renew. Energy 2013, 50, 522–531. [Google Scholar] [CrossRef]
  21. Mangkuto, R.A.; Rohmah, M.; Asri, A.D. Design optimization for window size, orientation, and wall reflectance with regard to various daylight metrics and lighting energy demand: A case study of buildings in the tropics. Appl. Energy 2016, 164, 211–219. [Google Scholar] [CrossRef]
  22. Zhai, Y.; Wang, Y.; Huang, Y.; Meng, X. A multi-objective optimization methodology for window design considering energy consumption, thermal environment and visual performance. Renew. Energy 2019, 134, 1190–1199. [Google Scholar] [CrossRef]
  23. Vera, S.; Uribe, D.; Bustamante, W.; Molina, G. Optimization of a fixed exterior complex fenestration system considering visual comfort and energy performance criteria. Build. Environ. 2017, 113, 163–174. [Google Scholar] [CrossRef]
  24. Zhang, A.; Bokel, R.; van den Dobbelsteen, A.; Sun, Y. Optimization of thermal and daylight performance of school buildings based on a multi-objective genetic algorithm in the cold climate of China. Energy Build. 2017, 139, 371–384. [Google Scholar] [CrossRef]
  25. Linhart, F.; Scartezzini, J. Minimizing lighting power density in office rooms equipped with Anidolic Daylighting Systems. Sol. Energy 2010, 84, 587–595. [Google Scholar] [CrossRef]
  26. Hua, Y.; Oswald, A.; Yang, X. Effectiveness of daylighting design and occupant visual satisfaction in a LEED Gold laboratory building. Build. Environ. 2011, 46, 54–64. [Google Scholar] [CrossRef]
  27. Li, D.H.W.; Lam, J.C. An investigation of daylighting performance and energy saving in a daylit corridor. Energy Build. 2003, 35, 365–373. [Google Scholar] [CrossRef]
  28. Yun, G.Y.; Kim, H.; Kim, J.T. Effects of occupancy and lighting use patterns on lighting energy consumption. Energy Build. 2012, 46, 152–158. [Google Scholar] [CrossRef]
  29. Li, D.H.W.; Lam, T.N.T.; Wong, S.L. Lighting and energy performance for an office using high frequency dimming controls. Energy Convers. Manag. 2006, 47, 1133–1145. [Google Scholar] [CrossRef]
  30. Doulos, L.; Tsangrassoulis, A.; Topalis, F. Quantifying energy savings in daylight responsive systems: The role of dimming electronic ballasts. Energy Build. 2008, 40, 36–50. [Google Scholar] [CrossRef]
  31. Geyer, P. Systems modelling for sustainable building design. Adv. Eng. Inform. 2012, 26, 656–668. [Google Scholar] [CrossRef]
  32. Chen, X.; Yang, H.; Lu, L. A comprehensive review on passive design approaches in green building rating tools. Renew. Sustain. Energy Rev. 2015, 50, 1425–1436. [Google Scholar] [CrossRef]
  33. Negendahl, K. Building performance simulation in the early design stage: An introduction to integrated dynamic models. Autom. Constr. 2015, 54, 39–53. [Google Scholar] [CrossRef]
  34. Loonen, R.C.G.M.; Favoino, F.; Hensen, J.L.M.; Overend, M. Review of current status, requirements and opportunities for building performance simulation of adaptive facades. J. Build. Perform. Simul. 2017, 10, 205–223. [Google Scholar] [CrossRef]
  35. Sun, B.; Luh, P.B.; Jia, Q.; Jiang, Z.; Wang, F.; Song, C. Building energy management: Integrated control of active and passive heating, cooling, lighting, shading, and ventilation systems. IEEE Trans. Autom. Sci. Eng. 2013, 10, 588–602. [Google Scholar] [CrossRef]
  36. Jeon, J.; Lee, J.; Seo, J. Application of PCM thermal energy storage system to reduce building energy consumption. J. Therm. Anal. Calorim. 2013, 111, 279–288. [Google Scholar] [CrossRef]
  37. Wong, S.L.; Wan, K.K.W.; Lam, T.N.T. Artificial neural networks for energy analysis of office buildings with daylighting. Appl. Energy 2010, 87, 551–557. [Google Scholar] [CrossRef]
  38. Zitzler, K.; Deb, K.; Thiele, L. Comparison of multiobjective evolutionary algorithms: Empirical results. Evol. Comput. 2000, 8, 173–195. [Google Scholar] [CrossRef]
  39. Yu, W.; Li, B.; Jia, H.; Zhang, M.; Wang, D. Application of multi-objective genetic algorithm to optimize energy efficiency and thermal comfort in building design. Energy Build. 2015, 88, 135–143. [Google Scholar] [CrossRef]
  40. Evins, R. Multi-level optimization of building design, energy system sizing and operation. Energy 2015, 90, 1775–1789. [Google Scholar] [CrossRef]
  41. Kim, H.; Stumpf, A.; Kim, W. Analysis of an energy efficient building design through data mining approach. Automat. Constr. 2011, 20, 37–43. [Google Scholar] [CrossRef]
  42. Attia, S.; Gratia, E.; Herde, A.D.; Hensen Jan, L.M. Simulation-based decision support tool for early stages of zero-energy building design. Energy Build. 2012, 49, 2–15. [Google Scholar] [CrossRef] [Green Version]
  43. Pan, Y.; Yin, R.; Huang, Z. Energy modeling of two office buildings with data center for green building design. Energy Build. 2008, 40, 1145–1152. [Google Scholar] [CrossRef]
  44. Roisin, B.; Bodart, M.; Deneyer, A.; D’Herdt, P. Lighting energy savings in office using different control systems and their real consumption. Energy Build. 2008, 40, 514–523. [Google Scholar] [CrossRef]
  45. Galasiu, A.D.; Newsham, G.R.; Suvagau, C.; Sander, D.M. Energy saving lighting control systems for open-plan offices: A field study. Leukos 2007, 4, 7–29. [Google Scholar] [CrossRef]
  46. Inventory of Carbon and Energy, 2nd ed.; University of Bath: Bath, UK, 2011.
  47. Asif, M.; Davidson, A.; Muneer, T. Embodied energy analysis of aluminium-clad windows. Build. Serv. Eng. Res. Technol. 2001, 22, 195–199. [Google Scholar] [CrossRef]
  48. Syrrakou, E.; Papaefthimiou, S.; Yianoulis, P. Eco-efficiency evaluation of a smart window prototype. Sci. Total Environ. 2006, 359, 267–282. [Google Scholar] [CrossRef] [PubMed]
  49. Prakash, O.; Kumar, A. Annual Performance of a modified greenhouse dryer under passive mode in no-load conditions. Int. J. Green Energy 2015, 12, 1091–1099. [Google Scholar] [CrossRef]
  50. Chen, T.Y.; Burnett, J.; Chau, C.K. Analysis of embodied energy use in the residential building of Hong Kong. Energy 2001, 26, 323–340. [Google Scholar] [CrossRef]
  51. Hammond, G.P.; Jones, C.I. Embodied energy and carbon in construction materials. Proc. Inst. Civ. Eng.-Energy 2008, 161, 87–98. [Google Scholar] [CrossRef] [Green Version]
Figure 1. Schematic structure of the proposed building information modelling (BIM) based building design method.
Applsci 09 04076 g001
Figure 2. Outline of the lecture room.
Applsci 09 04076 g002
Figure 3. Pareto frontier of case study.
Applsci 09 04076 g003
Figure 4. Life cycle cost (LCC) and life cycle energy (LCE) savings from the optimal designs compared with the initial design.
Applsci 09 04076 g004
Table 1. Initial design of the case.
Design FactorVariable Description
Window-to-wall ratio0.19
Glazing type6 mm double clear float glass with 6 mm air gap
Wall type300 mm reinforced concrete wall + 50 mm EPS board +30 mm cement and sand (1:3) screed + 10 mm plaster
Artificial light typeT8 fluorescent light, 30W
Table 2. Information of decision variables.
Decision VariableContentUnit Cost (CNY/mq)Energy Intensity (MJ/mq)
Window-to-wall ratioγ(0, 0.9)
Glazing typeG16 mm clear glass +12 mm argon gap +6 mm clear glass4001345.84
G26 mm low-e glass +12 mm argon gap +6 mm clear glass7001937.60
G36 mm tint glass +6 mm argon gap +6 mm clear glass5001549.60
Wall typeW1300 mm reinforced concrete wall +50 mm Polystyrene (EPS) board +10 mm cement and sand (1:3) screed +10 mm plaster143.67564.50
W2300 mm aerated concrete block wall +50 mm EPS board +10 mm cement and sand (1:3) screed +10 mm plaster125370.40
W3300 mm lightweight concrete block wall +50 mm EPS board +10 mm cement and sand (1:3) screed +10 mm plaster114.68370.70
Artificial light typeL1T8 fluorescent light, 30W50
L2T5 fluorescent light, 14W38
L3T8 LED light, 18W65
Table 3. Information about optimal designs.
No.Window-to-Wall RatioGlazing TypeWall TypeArtificial Light TypeLCC (CNY ¥)LCE (MJ)
10.9001124,158,961.075,624,928.382
20.7482214,811,119.354,765,746.660
30.2013326,410,224.774,285,789.883
40.1392328,332,691.864,098,387.582
50.1371328,336,950.974,014,879.593
60.10022210,245,469.863,956,413.052
70.08512210,716,024.163,902,559.339
Table 4. Information about the fifth design with three lighting control modes.
Lighting Control ModeLCC (CNY ¥)LCE (MJ)
MLS8,429,845.704,068,169.843
ALS8,364,098.084,015,142.393
ALD8,384,345.694,028,560.143
Table 5. Performances of the initial design and the ultimate optimal design.
Design SchemeLCC (CNY ¥)Saving of LCCLCE (MJ)Saving of LCE
Initial10,851,157.42-5,301,347.349-
Ultimate optimal8,364,098.0822.92%4,015,142.39324.26%

