Article

Mathematical Model and Numerical Simulation for Tissue Growth on Bioscaffolds

1
Department of Mathematics, Kwangwoon University, Seoul 01897, Korea
2
Department of Mathematics, Korea University, Seoul 02841, Korea
*
Author to whom correspondence should be addressed.
Appl. Sci. 2019, 9(19), 4058; https://doi.org/10.3390/app9194058
Submission received: 30 August 2019 / Revised: 22 September 2019 / Accepted: 25 September 2019 / Published: 28 September 2019
(This article belongs to the Section Applied Biosciences and Bioengineering)

Abstract

:
Tissue growth on bioscaffolds can be controlled using substrate geometry such as substrate curvature. In this study, we present a mathematical model and numerical simulation method for tissue growth on a bioscaffold to investigate the effect of local curvature on tissue growth. The mathematical model is based on the Allen–Cahn (AC) equation, which has been extensively used to model many problems involving motion by mean curvature. By solving the AC equation using the explicit Euler method, the proposed method is simple and fast. Numerical simulations on various geometries are presented to demonstrate the applicability of the proposed framework on tissue growth on a bioscaffold.

1. Introduction

In some fracture patients, the bone defects do not get well in the ordinary recuperation period or do not mend at all. In [1], the authors investigated the causes of impaired healing and proposed potential treatment strategies with the combined in silico–in vivo approach. In the field of tissue engineering, bioscaffolds are used as hosts for cell proliferation and extracellular matrix formation. There have been studies on the effects of materials of scaffold substrates [2]. Tissue growth is known to be controlled by substrate geometry such as roughness [3,4] and curvature [5,6,7] of the substrate. Curvature affects cell density because of the contraction or expansion of the local surface area [8]. In previous studies, simulations of tissue growth on scaffold have been performed [9,10,11,12] and applied in many fields [13,14,15,16,17]. Figure 1 shows new tissue formation on various scaffolds (triangular, square, and hexagonal shapes) [18].
The authors in [18] performed in vitro cell growth studies with osteogenic cells grown on biologically inductive substrate, hydroxylapatite. These cells, pre-osteoblastic mouse MC3T3-E1 cells, exhibit logarithmic growth when cultured in osteogenic conditions. In addition, the authors investigated the geometric features of tissue growth in aspects both the channel surface size and the shape.
The main purpose of this study is to present a mathematical model and numerical simulation for tissue growth on a bioscaffold in two-dimensional (2D) and three-dimensional (3D) space. The mathematical model is based on the Allen–Cahn (AC) equation [19]:
ϕ ( x , t ) t = μ ( x , t ) = F ( ϕ ( x , t ) ) ϵ 2 Δ ϕ ( x , t ) , x Ω , t > 0 ,
n · ϕ ( x , t ) = 0 , x Ω ,
where Ω R d ( d = 2 , 3 ) is a domain with an outer unit normal vector n to Ω . Note that Equation (2) can be replaced with other conditions such as the Dirichlet boundary condition or the periodic boundary condition. Here, ϕ ( x , t ) is the difference between the concentrations of the tissue and the ambient medium, μ ( x , t ) is the chemical potential, F ( ϕ ) = 0 . 25 ( ϕ 2 1 ) 2 , and ϵ is a positive constant. The AC equation was originally introduced as a mathematical model for antiphase domain coarsening in a binary alloy. The AC equation has been successfully used to model a class of problems such as crystal growth [20,21], image processing [22,23], mean curvature flows [24], and a mixture of two incompressible fluids [25]. We propose a simple mathematical model for tissue growth on scaffolds using features of the AC equation, that is, motion by mean curvature.
This paper is organized as follows. In Section 2, we propose the mathematical model for tissue growth on scaffolds. In Section 3, we describe a numerical solution for solving the mathematical model. We present the numerical results for several examples in Section 4. In Section 5, the conclusions are drawn.

2. Mathematical Model

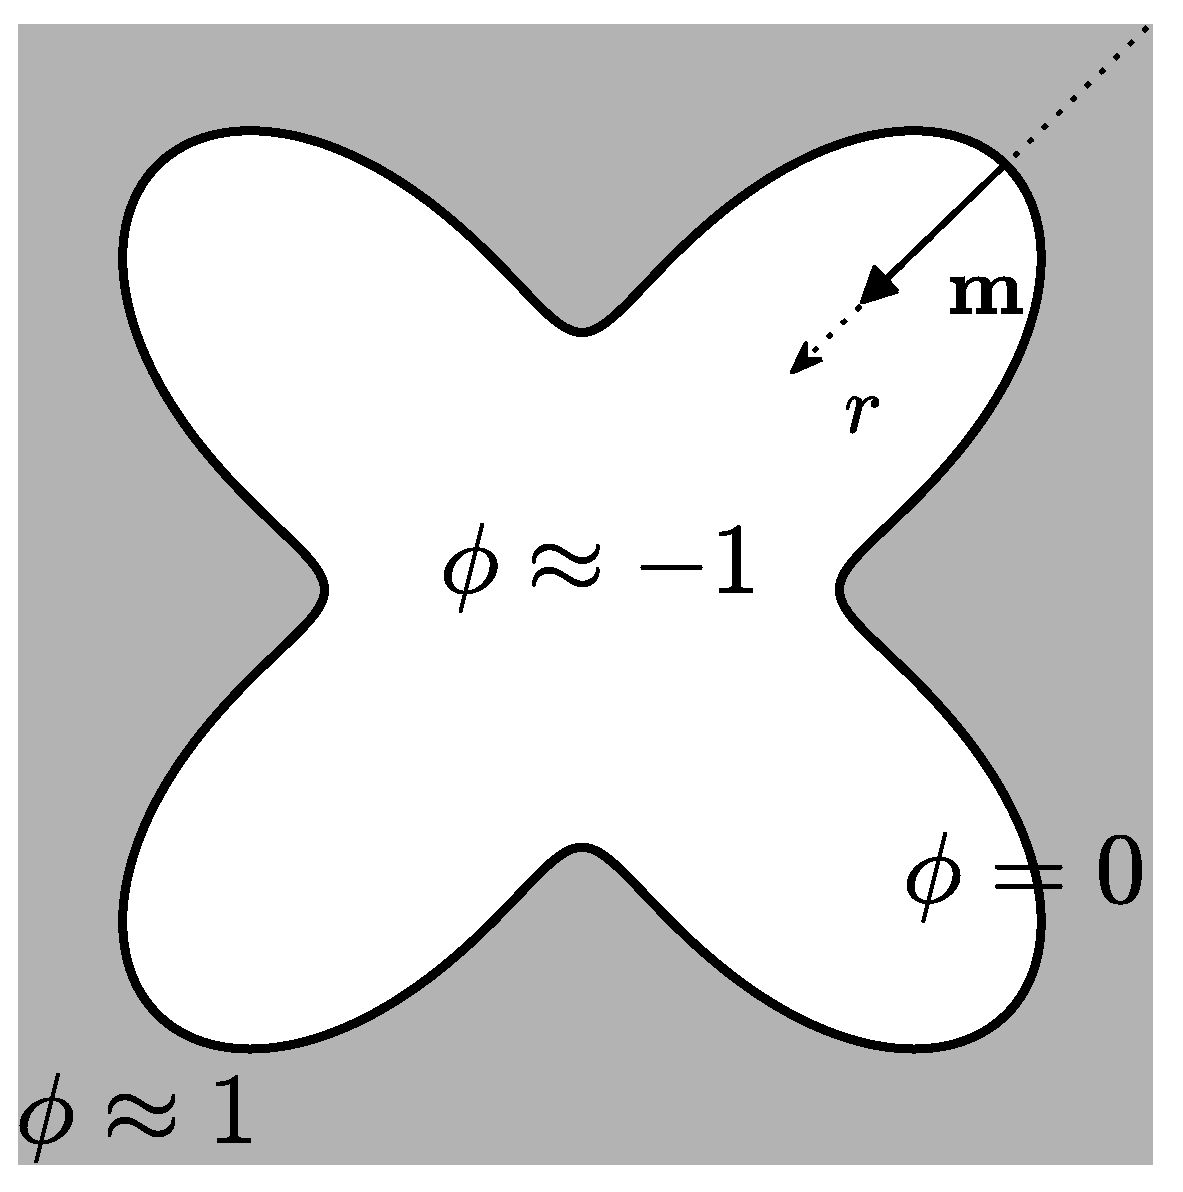
We briefly review motion by mean curvature of the AC equation [26]. The scalar field ϕ ( x , y , z , t ) can be represented by a local coordinate r ( x , y , z , t ) ; hence we can represent ϕ ( r ) near ϕ = 0 in terms of the local coordinate r. Figure 2 illustrates the interface between two phases with local coordinate r.
Let m = ϕ / | ϕ | and ϕ r = ϕ · m = | ϕ | be the directional derivative in the direction of the vector m ; then, we can rewrite Δ ϕ as a function of r:
Δ ϕ = · ϕ = · ( | ϕ | m ) = · ( ϕ r m ) = ϕ r · m + ϕ r · m = ( ϕ ) r · m + ϕ r · m = ( | ϕ | m ) r · m + ϕ r · m = ( ϕ r m ) r · m + ϕ r · m = ( ϕ r r m + ϕ r m r ) · m + ϕ r · m = ϕ r r κ ϕ r ,
where κ = · m = κ 1 + κ 2 is the mean curvature; and κ 1 and κ 2 are the principal curvatures of the surface. Using this result, Equation (1) becomes
ϕ t = F ( ϕ ) ϵ 2 + ϕ r r κ ϕ r .
When the interfacial transition layer is in the local equilibrium state, then F ( ϕ ) / ϵ 2 + ϕ r r 0 . Therefore, Equation (3) becomes
ϕ t = κ ϕ r .
Let Γ t = { ( x , y , z ) | ϕ ( x , y , z , t ) = 0 } be the interface at time t, then its velocity is given by
d ( ϕ ( r ) ) d t Γ t = 0 ,
which implies ϕ r r t + ϕ t = 0 and therefore r t = ϕ t / ϕ r = κ from Equation (4). From this result, we have V = κ , where V is the normal velocity of the surface. Because ϕ r 0 and Equations (1) and (4), both the signs of μ and κ are the same.
We propose the following governing equation for tissue growth under the mean curvature:
ϕ ( x , t ) t = μ ( x , t ) if μ ( x , t ) > 0 , 0 otherwise ,
where μ ( x , t ) = F ( ϕ ( x , t ) ) / ϵ 2 Δ ϕ ( x , t ) . That is, if a local mean curvature is positive, then a tissue grows, otherwise it does not [8,18].

3. Numerical Solution

We present an explicit numerical scheme for the AC equation in the 2D space Ω = ( a , b ) × ( c , d ) . Performing the numerical computation with the explicit method is efficient because the evolution depends on the a sign of curvature at each grid point. The 3D case is defined analogously. Let N x and N y be positive integers, h = ( b a ) / N x = ( d c ) / N y be the uniform mesh size, and Ω h = { ( x i , y j ) : x i = a + ( i 0 . 5 ) h , y j = c + ( j 0 . 5 ) h , 1 i N x , 1 j N y } be the discrete domain. Let ϕ i j n be an approximation of ϕ ( x i , y j , n Δ t ) , where Δ t is the time step. The explicit Euler scheme for 1 i N x , 1 j N y is given as
ϕ i j n + 1 ϕ i j n Δ t = μ i j n if μ i j n > 0 , 0 otherwise ,
where μ i j n = ( ( ϕ i j n ) 3 ϕ i j n ) / ϵ 2 Δ h ϕ i j n and Δ h ϕ i j = ( ϕ i 1 , j + ϕ i + 1 , j + ϕ i , j 1 + ϕ i , j + 1 4 ϕ i j ) / h 2 .
Because the governing equation is a second-order partial differential equation (PDE), solving the AC equation by the explicit Euler method gives not only accuracy by using a small enough time step size, but also simplicity. For more details about the reason for using the explicit scheme for the second-order PDE, please refer to the article of Jeong and Kim [27]. The advantages of using the scheme are consistent with our purpose for simulation of the tissue growth.
We use two kinds of boundary conditions in this study. One is the Neumann boundary condition,
ϕ 0 j = ϕ 1 j , ϕ N x + 1 , j = ϕ N x j , 1 j N y , ϕ i 0 = ϕ i 1 , ϕ i , N y + 1 = ϕ i N y , 1 i N x ,
and the other is the periodic boundary condition,
ϕ 0 j = ϕ N x j , ϕ N x + 1 , j = ϕ 1 j , 1 j N y , ϕ i 0 = ϕ i N y , ϕ i , N y + 1 = ϕ i 1 , 1 i N x .

4. Numerical Experiments

In this section, we perform several numerical tests using various bioscaffold geometries. First, we define the interfacial length parameter ϵ m = m h / [ 2 2 tanh 1 ( 0 . 9 ) ] 0 . 24015 m h , which implies that we have an approximately m h transition layer width [28]. For all tests, we use ϵ = ϵ m for some integer m, unless otherwise specified. In addition, unless otherwise noted, the zero Neumann boundary condition is used. We note that time-frames for the different simulations will be different because of the increased complexity of the volume component.

4.1. Simulation of Tissue Growth on Scaffold In 2D

First, we simulate tissue growth in 2D space to validate the proposed mathematical model although the real scaffolds are 3D. We consider a relatively simple 2D scaffold in the domain Ω = ( 0 , 1 ) × ( 0 , 1 ) . In all simulations below, the scaffold region is the region in which the value of a scalar field ψ is greater than zero. The simple 2D scaffold is written as follows:
ψ ( x , y ) = 1 if 0 < x < 0 . 2 or 0 . 8 < y < 1 , 1 otherwise ,
which is shown in Figure 3a as the dark region. The surface is initially seeded with tissue layer ϕ ( x , y , 0 ) :
ϕ ( x , y , 0 ) = 1 if 0 < x < 0 . 2 + 2 h or 0 . 8 2 h < y < 1 , 1 otherwise ,
which is shown in Figure 3a as the green region. Note that for computational simplicity, we set ϕ ( x , y , 0 ) 1 , where ψ ( x , y ) > 0 .
In Figure 3b,c, we show simulation results of tissue growth on the scaffold in 2D at t = 4000 Δ t and t = 8000 Δ t , respectively. Here, the space step h = 1 / 50 , the time step size Δ t = 0 . 1 h 2 , and ϵ = ϵ 4 are used. The simulation results agree well with the previous solutions [9].
Next, we perform a simulation on a 2D scaffold whose surface is given by a cosine curve which has concavity and convexity to verify the effect of curvature on tissue growth. The 2D scaffold in Ω = ( 0 , 1 ) × ( 0 . 4 , 0 . 4 ) is given by
ψ ( x , y ) = 1 if 0 . 4 < y < 0 . 3 cos ( 2 π x ) , 1 otherwise .
The surface is initially seeded with ϕ ( x , y , 0 ) :
ϕ ( x , y , 0 ) = 1 if 0 . 4 < y < 0 . 3 cos ( 2 π x ) + 3 h , 1 otherwise ,
and the initial cell layer is shown as a green region in Figure 4a. Here, h = 1 / 200 , Δ t = 0 . 1 h 2 , and ϵ = ϵ 4 are used. As shown in Figure 4, the tissue grows where the curvature is positive.
Furthermore, we present a simulation of tissue growth on a star-shaped scaffold which is more complex than the above cases. This simulation is carried out in the domain Ω = ( 0 . 5 , 0 . 5 ) × ( 0 . 5 , 0 . 5 ) with h = 1 / 128 , Δ t = 0 . 1 h 2 , and ϵ = ϵ 4 . An initial star-shaped scaffold is ψ > 0 , where ψ ( x , y ) is given by
ψ ( x , y ) = tanh x 2 + y 2 0 . 25 0 . 1 cos ( 6 θ ) 2 ϵ , where θ = tan 1 y x , if x > 0 , π + tan 1 y x , otherwise .
The initial cell layer is given by
ϕ ( x , y , 0 ) = tanh x 2 + y 2 0 . 25 0 . 1 cos ( 6 θ ) + 3 h 2 ϵ ,
where θ is defined as above. Figure 5 shows the temporal evolution of tissue on the star-shaped scaffold.

4.2. Simulation of Tissue Growth on Scaffold In 3D

We consider tissue growth on a 3D scaffold in Ω = ( 0 , 1 ) 3 . The numerical scheme is similar to the 2D case. The parameters used are h = 1 / 50 , Δ t = 0 . 1 h 2 , and ϵ = ϵ 4 . The solid scaffold structure is given as follows:
ψ ( x , y , z ) = 1 if ( x , y , z ) ( 0 , 0 . 5 ) × ( 0 , 1 ) × ( 0 , 0 . 5 ) ( 0 , 1 ) × ( 0 . 5 , 1 ) × ( 0 , 0 . 5 ) ( 0 , 0 . 5 ) × ( 0 . 5 , 1 ) × ( 0 , 1 ) , 1 otherwise ,
and is shown as a volume enclosed by the dark color surface in Figure 6a. The initial tissue layer is given by
ϕ ( x , y , z , 0 ) = 1 if ( x , y , z ) ( 0 , 0 . 5 + 2 h ) × ( 0 , 1 ) × ( 0 , 0 . 5 + 2 h ) ( 0 , 1 ) × ( 0 . 5 2 h , 1 ) × ( 0 , 0 . 5 + 2 h ) ( 0 , 0 . 5 + 2 h ) × ( 0 . 5 2 h , 1 ) × ( 0 , 1 ) , 1 otherwise ,
and is shown as a volume enclosed by the green colored surface on the scaffold in Figure 6a.
Snapshots of tissue growth simulation are shown in Figure 6b,c at t = 3200 Δ t and 6400 Δ t , respectively. The tissue growth on the scaffold according to the curvature shows the similar simulation results from the previous test [9].
We consider tissue growth simulations on more complex surfaces such as triply periodic minimal surface (TPMS) which has interconnected pores and high porosity to ensure cell penetration, vascular ingrowth, nutrient diffusion, and waste product elimination [29]. TPMSs are widely used for the scaffold model structure, especially in tissue engineering applications. Castro et al. [29] investigated the effect of the porous structure of TPMS scaffolds on the macroscopic permeability behavior using numerical and experimental methods. Simulations are conducted with Schwarz primitive (P), Schwartz diamond (D), and Schoen gyroid (G) surfaces, which are typical examples of TPMS. The approximated P, D, and G surfaces are given as follows, respectively:
P ( x , y , z ) = cos ( 2 π x ) + cos ( 2 π y ) + cos ( 2 π z ) , D ( x , y , z ) = cos ( 2 π x ) cos ( 2 π y ) cos ( 2 π z ) sin ( 2 π x ) sin ( 2 π y ) sin ( 2 π z ) , G ( x , y , z ) = sin ( 2 π x ) cos ( 2 π y ) + sin ( 2 π z ) cos ( 2 π x ) + sin ( 2 π y ) cos ( 2 π z ) .
The scaffold regions for the P, D, and G surfaces are defined by
ψ ( x , y , z ) = tanh P ( x , y , z ) 2 ϵ ,
ψ ( x , y , z ) = tanh D ( x , y , z ) 2 ϵ ,
ψ ( x , y , z ) = tanh G ( x , y , z ) 2 ϵ .
The initial cell layers for the P, D, and G surfaces are given as
ϕ ( x , y , z , 0 ) = tanh P ( x , y , z ) + 4 h 2 ϵ ,
ϕ ( x , y , z , 0 ) = tanh D ( x , y , z ) + 4 h 2 ϵ ,
ϕ ( x , y , z , 0 ) = tanh G ( x , y , z ) + 4 h 2 ϵ .
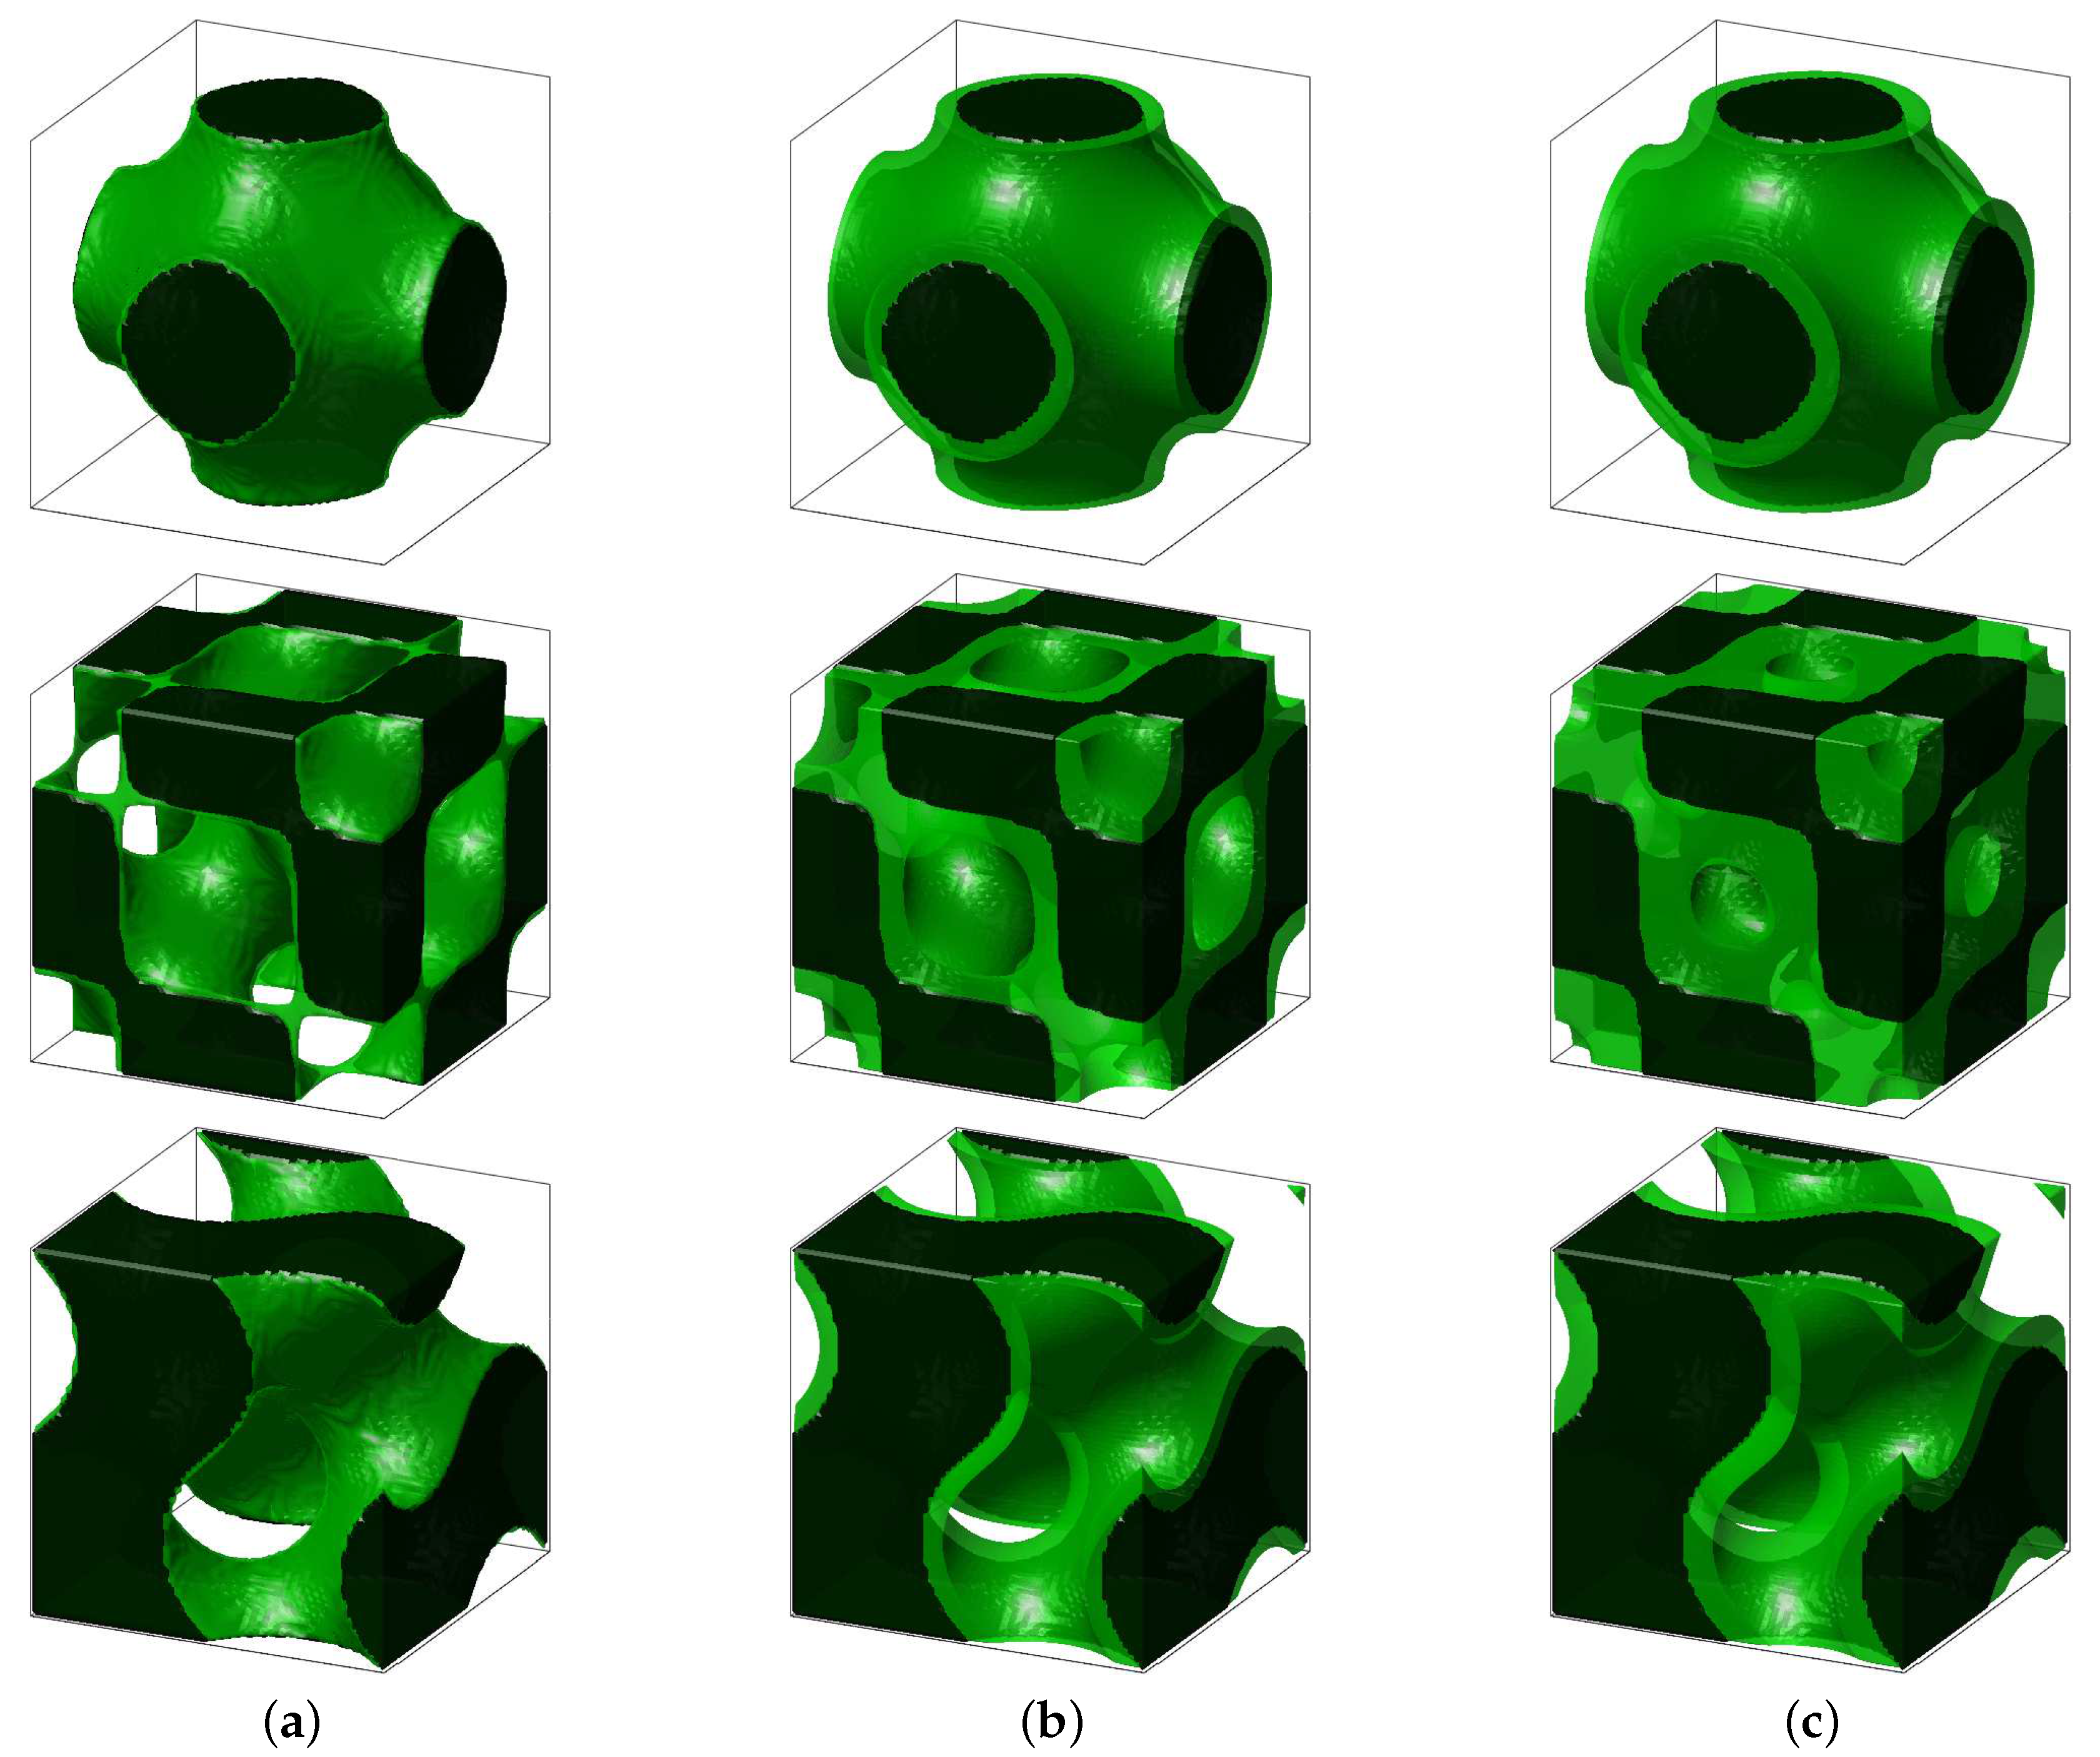
The simulation is performed in Ω = ( 0 . 5 , 0 . 5 ) 3 with h = 1 / 64 , Δ t = 0 . 1 h 2 , and ϵ = ϵ 4 . Furthermore, N x = N y = N z = 64 are used. We use the periodic boundary condition. Figure 7a–c show snapshots of the tissue growth simulation in 3D on the P, D, and G surface scaffolds (from top to bottom) at t = 0 , 500 Δ t , and 1000 Δ t , respectively.
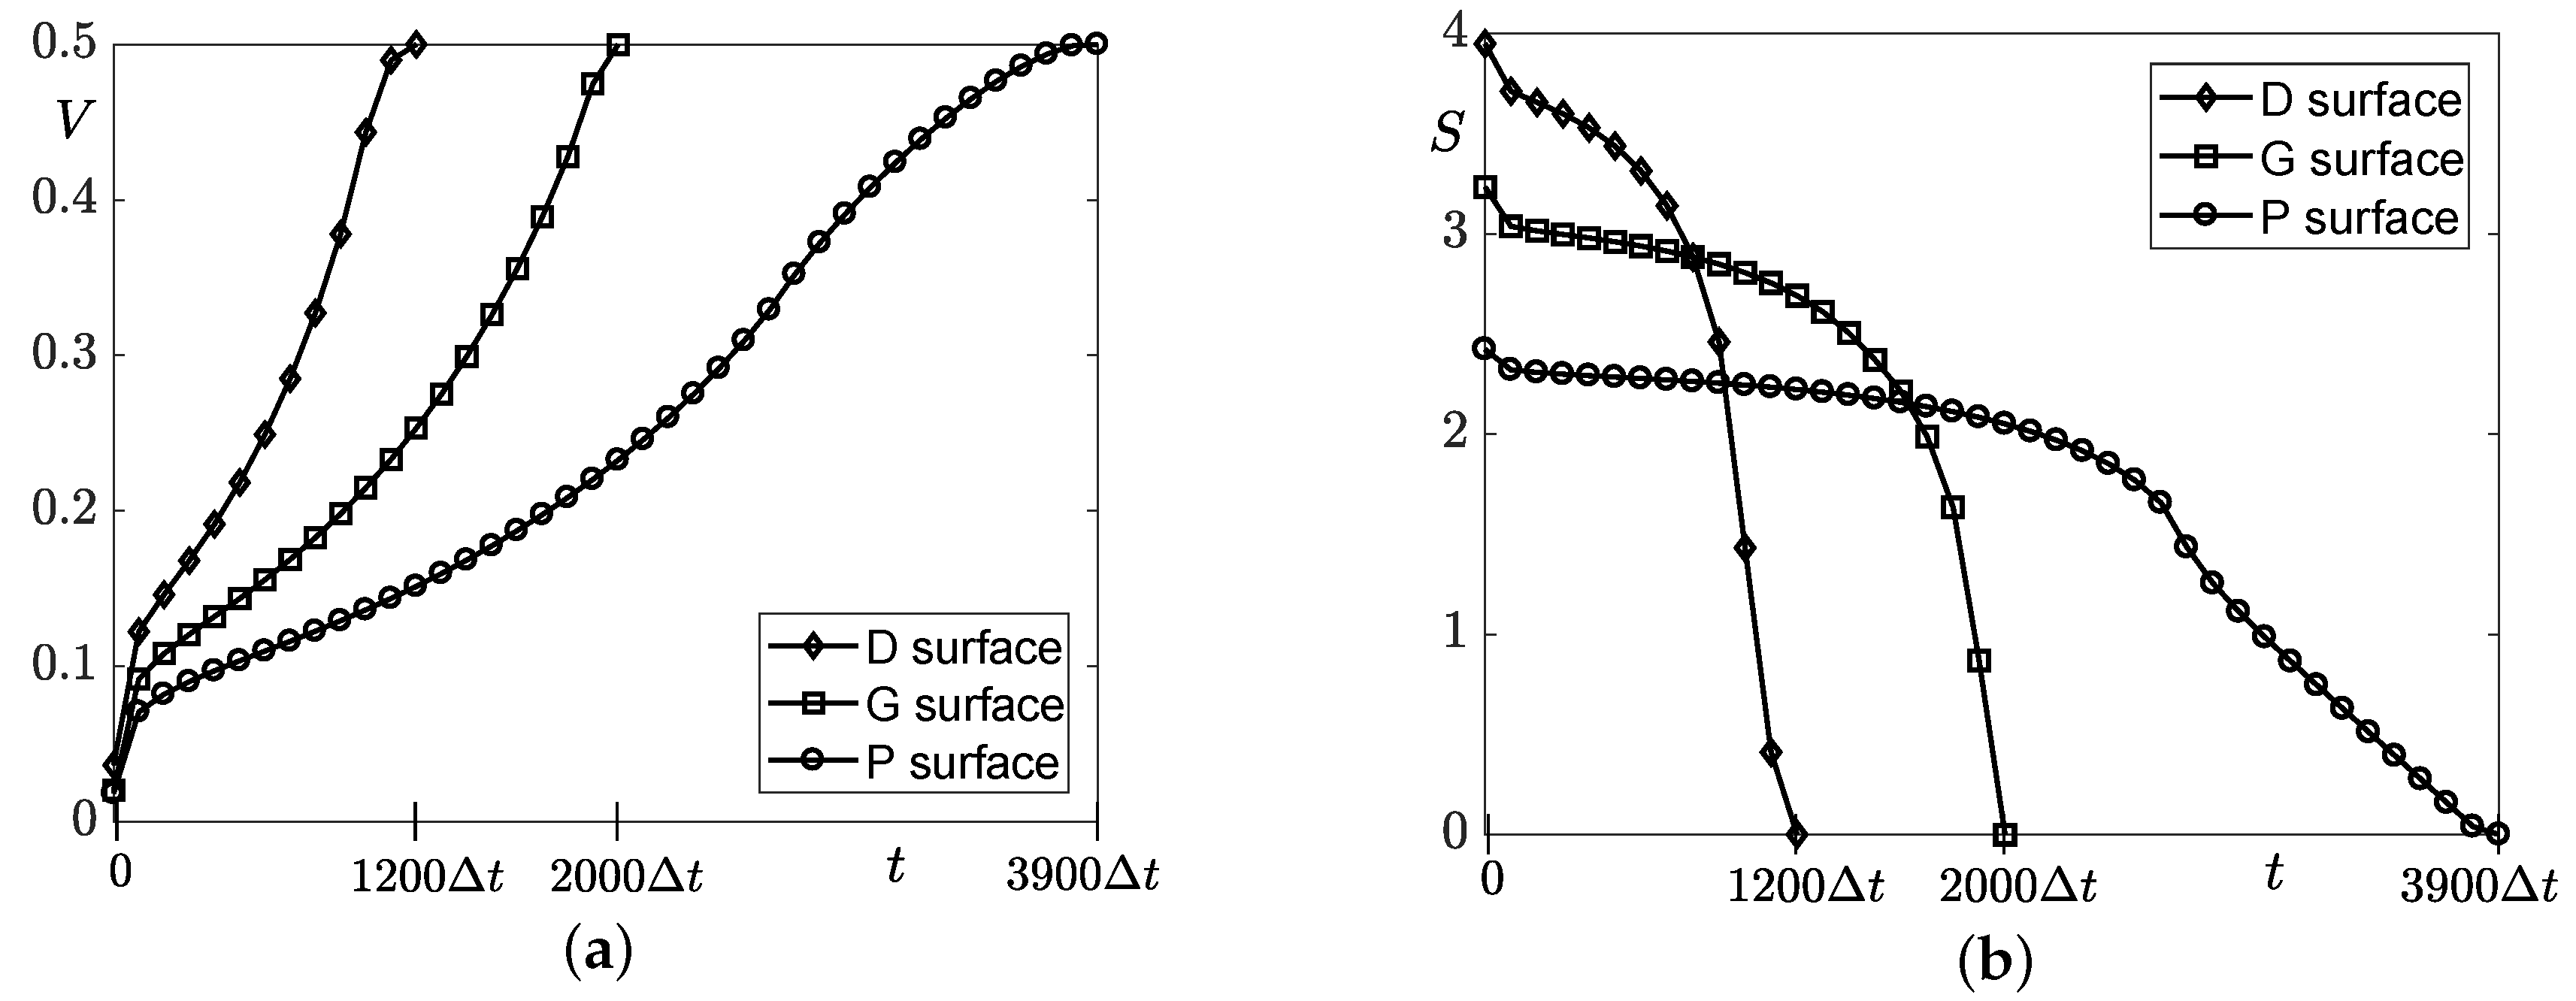
The temporal evolutions of the volume and those of the surface area, V and S, of cell layer over TPMSs are shown in Figure 8a,b, respectively. The volume and the surface area are defined as
V ( ϕ ) = i = 1 N x j = 1 N y k = 1 N z 1 + ϕ i j k 2 h 3 0 . 5   and   S ( ϕ ) = i = 1 N x j = 1 N y k = 1 N z δ i j k ( ϕ ) h 3 ,
respectively. Note that 0 . 5 is the volume of each scaffold. Here, a smoothed Dirac delta function δ i j k ( ϕ ) = | h ϕ i j k | is used [30], where | h ϕ | is defined as follows:
| h ϕ i j k | = ϕ x 2 + ϕ y 2 + ϕ z 2 , ϕ x = ϕ i + 1 , j k ϕ i 1 , j k 2 h for 2 i N x 1 , 1 j N y , 1 k N z , ϕ i + 1 , j k ϕ N x j k 2 h for i = 1 , ϕ 1 j k ϕ i 1 , j k 2 h for i = N x ,
and ϕ y , ϕ z are similarly defined.
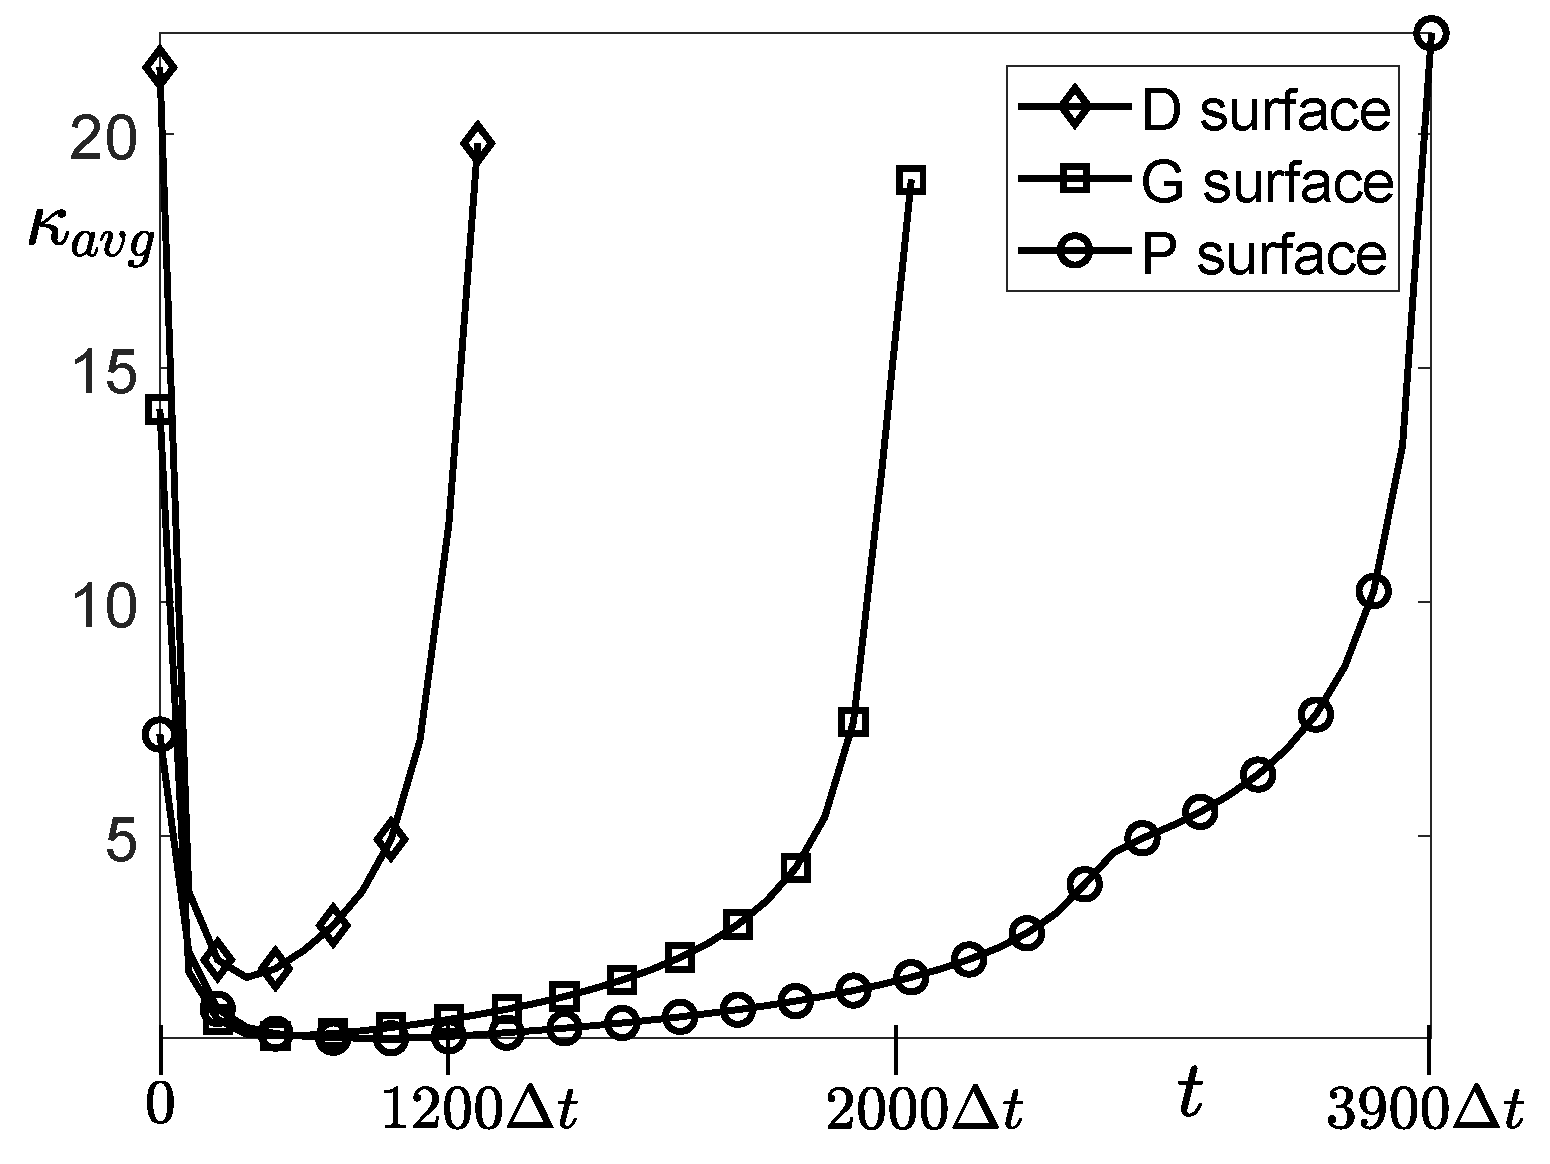
Furthermore, the temporal evolution of the averaged local curvature, κ a v g , is shown in Figure 9. The averaged local curvature is defined as
κ a v g = i , j , k | κ ( ϕ i j k ) | δ i j k h 3 S ( ϕ ) ,
where κ ( ϕ ) = ϕ t / ϕ r .
From the results in Figure 8 and Figure 9, we can observe that scaffolds with initially larger surface areas grow faster than scaffolds with smaller surface areas. Moreover, scaffolds with large surface areas have the larger value of the averaged local curvature than that of scaffolds with small surface areas. We consider the CPU time in seconds for tissue growth on TPMSs. The CPU time taken for the domain to fill up takes 131 s on P surface, 47 s on D surface, and 72 s on G surface. This CPU time results are consistent with the results in Figure 8a.

4.3. Comparison between Experiments and Simulations

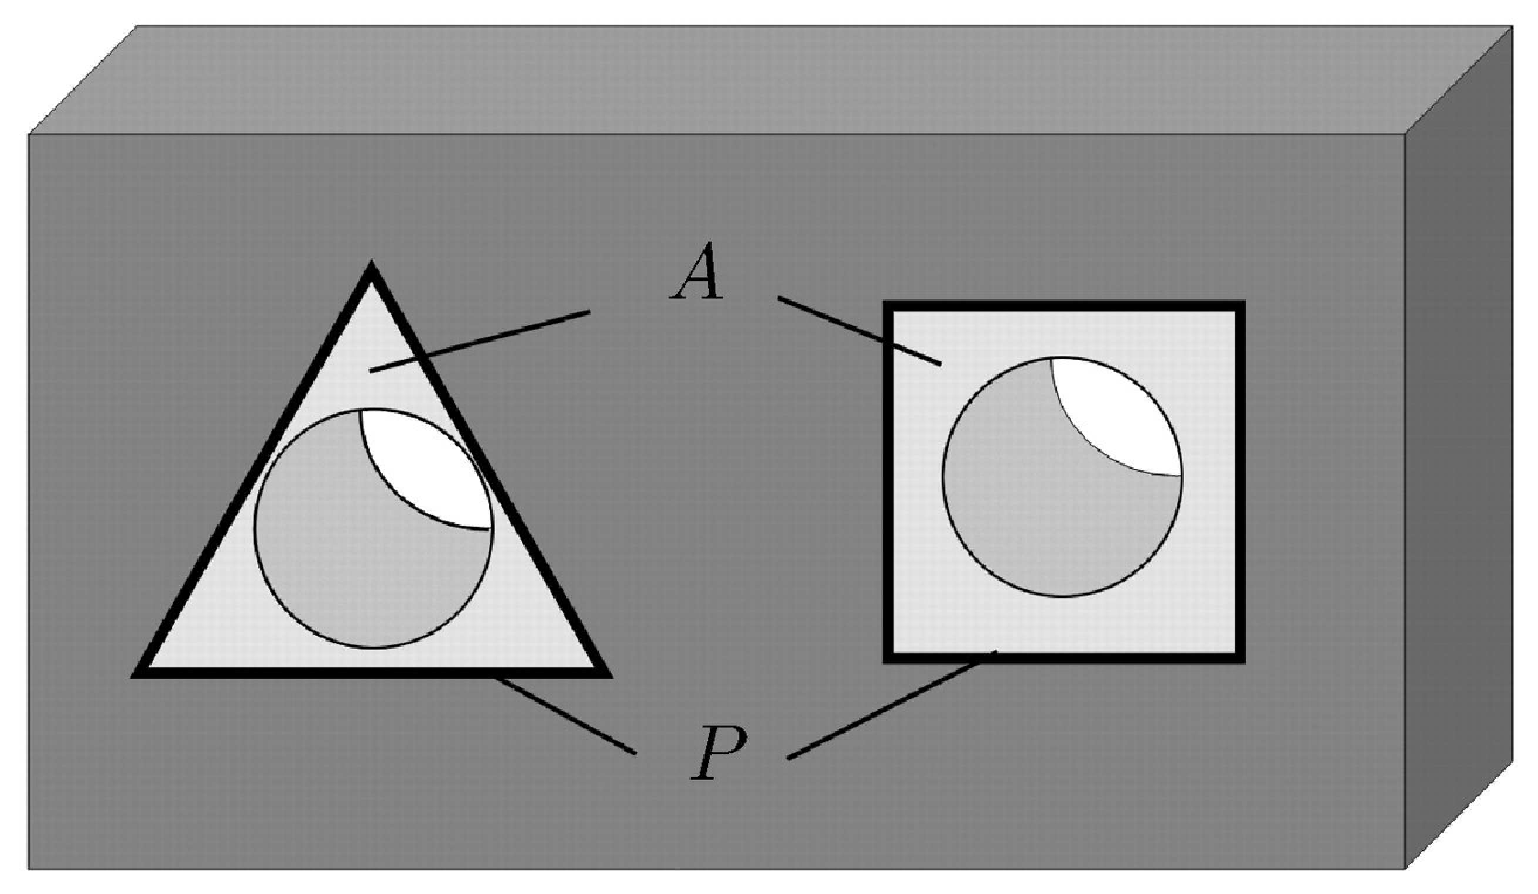
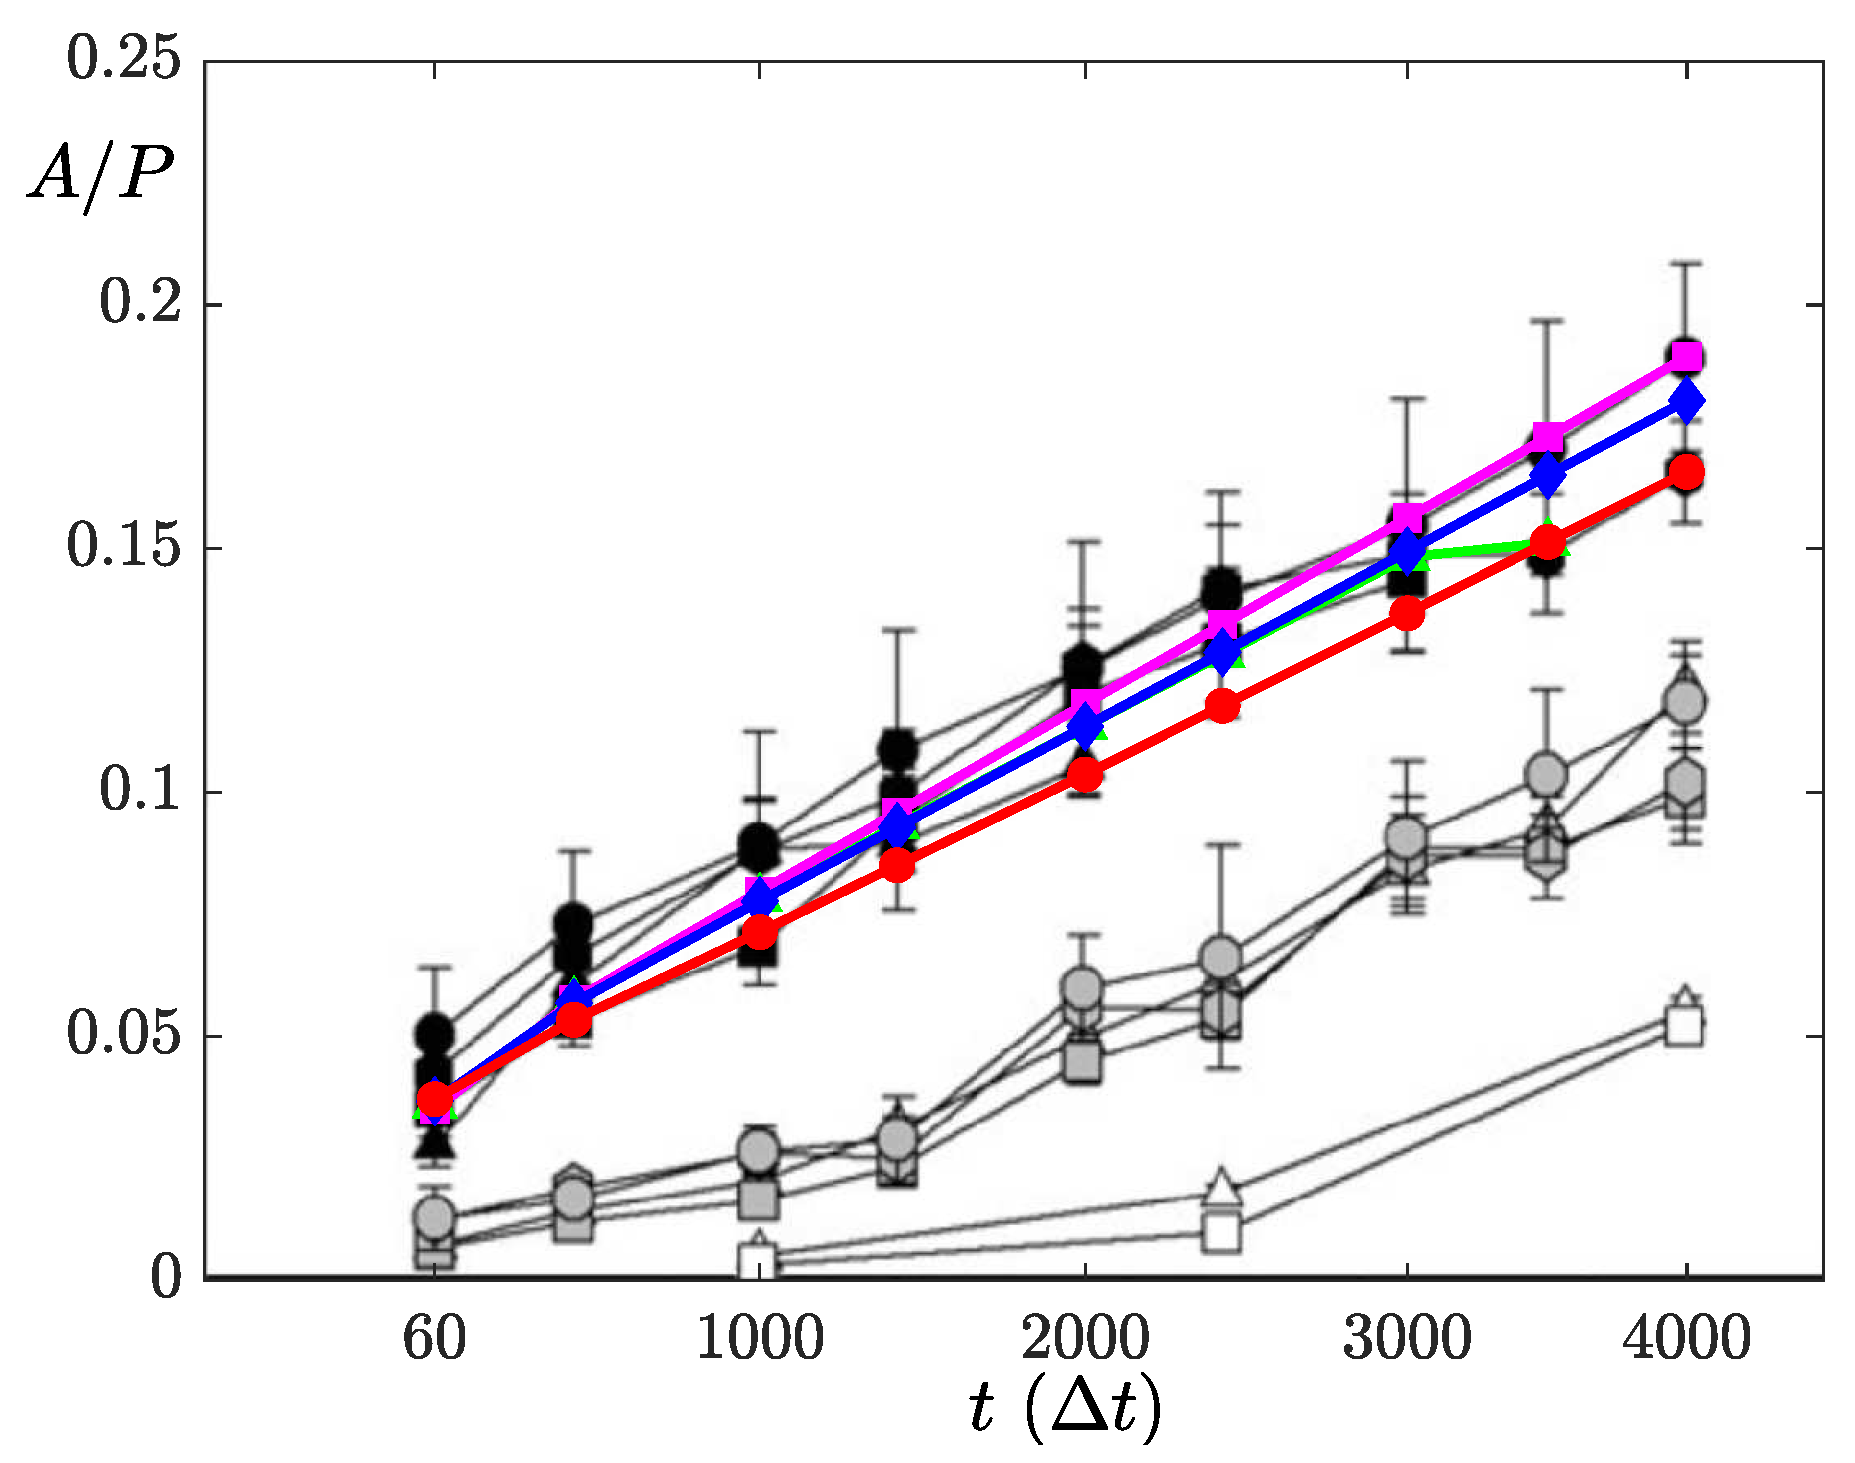
In this section, we conduct a comparative study with the actual experimental data to validate our numerical simulation. There is an actual experimental study on whether geometric features affect tissue growth by using four different cross-sectional shapes (triangle, square, hexagon, and circle) in [18]. Figure 10 illustrates the domain of experiment which consists of initial perimeter P and projected tissue area A. Because we do consider the effects of chemicals, we omit the description of substrate. The experiment is conducted by the assumption that any position of the tissue surface normally moves to the surface by distance d s during the time step d t . A simple 2D mathematical formulation is expressed as follows in [18]: d s / d t = λ κ , where λ is a constant of proportionality and κ is local curvature. We conduct a numerical simulation under the same conditions to match ours with the experiment, i.e., λ = 0 . 97 and P = 3 . 14 are taken for the numerical test. Note that we conduct the simulation only for P = 3 . 14 for simplicity of exposition. As shown in Figure 11, the average thickness of cell, A / P , is good agreement with the experimental result.

5. Conclusions

We proposed a mathematical model for tissue growth on a bioscaffold in 2D and 3D. The AC equation which has motion by mean curvature is a major base for this modeling. Because we solve the AC equation by the explicit Euler method, the proposed method is simple and accurate. We showed several numerical simulations in 2D and 3D by using our proposed modeling. Tissue on scaffolds grew according to the sign of curvature, and these simulations agree well with previous biological studies. In particular, simulations of tissue growth on TPMSs provide interesting results, and we investigate which kind of TPMSs is the most suitable for tissue growth on a bioscaffold. Therefore, we present a mathematical framework of tissue growth on various bioscaffolds using the AC equation. In future work, we will aim to model the chemistry on the substrate because the chemistry of the surface is important for the growth of a tissue on scaffold.

Author Contributions

All authors, H.G.L., J.P., S.Y., C.L., and J.K., contributed equally to this work and critically reviewed the manuscript.

Funding

The first author (H.G.L.) was supported by the Research Grant of Kwangwoon University in 2019 and by Basic Science Research Program through the National Research Foundation of Korea (NRF) funded by the Ministry of Education (NRF-2019R1C1C1011112). The corresponding author (J.K.) was supported by Basic Science Research Program through the National Research Foundation of Korea (NRF) funded by the Ministry of Education (NRF-2016R1D1A1B03933243).

Acknowledgments

The authors thank the reviewers for their constructive and helpful comments on the revision of this article.

Conflicts of Interest

The authors declare no conflict of interest.

References

  1. Carlier, A.; van Gastel, N.; Geris, L.; Carmeliet, G.; Van Oosterwyck, H. Size Does Matter: An Integrative In Vivo-In Silico Approach for the Treatment of Critical Size Bone Defects. PLoS Comput. Biol. 2014, 10, e1003888. [Google Scholar] [CrossRef] [PubMed]
  2. Castro, A.P.G.; Lacroix, D. Micromechanical study of the load transfer in a polycaprolactone-collagen hybrid scaffold when subjected to unconfined and confined compression. Biomech. Model. Mechanobiol. 2018, 17, 531–541. [Google Scholar] [CrossRef] [PubMed]
  3. Martin, J.Y.; Schwartz, Z.; Hummert, T.W.; Schraub, D.M.; Simpson, J.; Lankford, J., Jr.; Dean, D.D.; Cochran, D.L.; Boyan, B.D. Effect of titanium surface roughness on proliferation, differentiation, and protein synthesis of human osteoblast-like cells (MG63). J. Biomed. Mater. Res. 1995, 29, 389–401. [Google Scholar] [CrossRef] [PubMed]
  4. Deligianni, D.D.; Katsala, N.D.; Koutsoukos, P.G.; Missirlis, Y.F. Effect of surface roughness of hydroxyapatite on human bone marrow cell adhesion, proliferation, differentiation and detachment strength. Biomaterials 2000, 22, 87–96. [Google Scholar] [CrossRef]
  5. Guyot, Y.; Papantoniou, I.; Luyten, F.P.; Geris, L. Coupling curvature-dependent and shear stress-stimulated neotissue growth in dynamic bioreactor cultures: A 3D computational model of a complete scaffold. Biomech. Model. Mechanobiol. 2016, 15, 169–180. [Google Scholar] [CrossRef] [PubMed]
  6. Dunn, G.A.; Heath, J.P. A new hypothesis of contact guidance in tissue cells. Exp. Cell Res. 1976, 101, 1–14. [Google Scholar] [CrossRef]
  7. Curtis, A.S.G.; Varde, M. Control of cell behavior: Topological factors. J. Natl. Cancer Inst. 1964, 33, 15–26. [Google Scholar] [PubMed]
  8. Alias, M.A.; Buenzli, P.R. Modeling the effect of curvature on the collective behavior of cells growing new tissue. Biophys. J. 2017, 112, 193–204. [Google Scholar] [CrossRef]
  9. Egan, P.F.; Shea, K.A.; Ferguson, S.J. Simulated tissue growth for 3D printed scaffolds. Biomech. Model. Mechanobiol. 2018, 17, 1481–1495. [Google Scholar] [CrossRef]
  10. Egan, P.F.; Ferguson, S.J.; Shea, K. Design of hierarchical three-dimensional printed scaffolds considering mechanical and biological factors for bone tissue engineering. J. Mech. Des. 2017, 139, 061401. [Google Scholar] [CrossRef]
  11. Bidan, C.M.; Wang, F.M.; Dunlop, J.W.C. A three-dimensional model for tissue deposition on complex surfaces. Comput. Methods Biomech. Biomed. Eng. 2013, 16, 1056–1070. [Google Scholar] [CrossRef] [PubMed]
  12. Olivares, A.L.; Marsal, É.; Planell, J.A.; Lacroix, D. Finite element study of scaffold architecture design and culture conditions for tissue engineering. Biomaterials 2009, 30, 6142–6149. [Google Scholar] [CrossRef]
  13. Zadpoor, A.A. Bone tissue regeneration: The role of scaffold geometry. Biomater. Sci. 2015, 3, 231–245. [Google Scholar] [CrossRef] [PubMed]
  14. Paris, M.; Götz, A.; Hettrich, I.; Bidan, C.M.; Dunlop, J.W.C.; Razi, H.; Zizak, I.; Hutmacher, D.W.; Fratzl, P.; Duda, G.N.; et al. Scaffold curvature-mediated novel biomineralization process originates a continuous soft tissue-to-bone interface. Acta Biomater. 2017, 60, 64–80. [Google Scholar] [CrossRef] [PubMed]
  15. Vassaux, M.; Milan, J.L. Stem cell mechanical behaviour modelling: Substrate’s curvature influence during adhesion. Biomech. Model. Mechanobiol. 2017, 16, 1295–1308. [Google Scholar] [CrossRef]
  16. De Aza, P.; Rodriguez, M.; Gehrke, S.; Maté-Sánchez de Val, J.E.; Calvo-Guirado, J. A Si-αTCP Scaffold for Biomedical Applications: An Experimental Study Using the Rabbit Tibia Model. Appl. Sci. 2017, 7, 706. [Google Scholar] [CrossRef]
  17. Ishikawa, S.; Iijima, K.; Sasaki, K.; Hashizume, M.; Kawabe, M.; Otsuka, H. Cartilage Differentiation of Bone Marrow-Derived Mesenchymal Stem Cells in Three-Dimensional Silica Nonwoven Fabrics. Appl. Sci. 2018, 8, 1398. [Google Scholar] [CrossRef]
  18. Rumpler, M.; Woesz, A.; Dunlop, J.W.C.; van Dongen, J.T.; Fratzl, P. The effect of geometry on three-dimensional tissue growth. J. R. Soc. Interface. 2008, 5, 1173–1180. [Google Scholar] [CrossRef] [Green Version]
  19. Allen, S.M.; Cahn, J.W. A microscopic theory for antiphase boundary motion and its application to antiphase domain coarsening. Acta Mater. 1979, 27, 1085–1095. [Google Scholar] [CrossRef]
  20. Yang, X. Efficient linear, stabilized, second-order time marching schemes for an anisotropic phase field dendritic crystal growth model. Comput. Methods Appl. Mech. Eng. 2019, 347, 316–339. [Google Scholar] [CrossRef] [Green Version]
  21. Jing, X.; Wang, Q. Linear second order energy stable schemes of phase field model with nonlocal constraints for crystal growth. arXiv, 2018; arXiv:1812.04504. [Google Scholar]
  22. Li, Y.; Jeong, D.; Choi, J.; Lee, S.; Kim, J. Fast local image inpainting based on the Allen–Cahn model. Digit. Signal Process. 2015, 37, 65–74. [Google Scholar] [CrossRef]
  23. Li, Y.; Kim, J. An unconditionally stable hybrid method for image segmentation. Appl. Numer. Math. 2014, 82, 32–43. [Google Scholar] [CrossRef]
  24. Laux, T.; Simon, T.M. Convergence of the Allen–Cahn equation to multiphase mean curvature flow. Commun. Pure Appl. Math. 2018, 71, 1597–1647. [Google Scholar] [CrossRef]
  25. Liu, H.; Cheng, A.; Wang, H.; Zhao, J. Time-fractional Allen–Cahn and Cahn–Hilliard phase-field models and their numerical investigation. Comput. Math. Appl. 2018, 76, 1876–1892. [Google Scholar] [CrossRef]
  26. Lee, D.S.; Kim, J. Mean curvature flow by the Allen–Cahn equation. Eur. J. Appl. Math. 2015, 26, 535–559. [Google Scholar] [CrossRef]
  27. Jeong, D.; Kim, J. An explicit hybrid finited difference scheme for the Allen-Cahn equation. J. Comput. Appl. Math. 2018, 340, 247–255. [Google Scholar] [CrossRef]
  28. Kim, J. Phase-field models for multi-component fluid flows. Commun. Comput. Phys. 2012, 12, 613–661. [Google Scholar] [CrossRef]
  29. Castro, A.P.G.; Pires, T.; Santos, J.E.; Gouveia, B.P.; Fernandes, P.R. Permeability versus design in TPMS scaffolds. Materials 2019, 12, 1313. [Google Scholar] [CrossRef]
  30. Lee, H.G.; Kim, J. Regularized Dirac delta functions for phase field models. Int. J. Numer. Methods Eng. 2012, 91, 269–288. [Google Scholar] [CrossRef]
Figure 1. Formation of new tissue on triangular, square, and hexagonal shaped scaffolds. Reprinted from Rumpler et al. [18], with permission from The Royal Society.
Applsci 09 04058 g001
Figure 2. Illustration of the interface between two phases and a local coordinate r.
Applsci 09 04058 g002
Figure 3. (ac) are snapshots of tissue growth on scaffold in the 2D plane at t = 0 , 4000 Δ t , and 8000 Δ t , respectively. The green region is the tissue layer on the given scaffold which is represented by the dark region. For interpretation of the references to color in the figure, the reader is referred to the web version of the article.
Applsci 09 04058 g003
Figure 4. (ac) are snapshots of tissue growth simulation at t = 0 , 4000 Δ t , and 8000 Δ t , respectively. The green region is the tissue layer on the given scaffold which is represented by the dark region. For interpretation of the references to color in the figure, the reader is referred to the web version of the article.
Applsci 09 04058 g004
Figure 5. (ac) are snapshots of tissue growth simulation with the star-shaped scaffold in 2D at t = 0 , 600 Δ t , and 1200 Δ t , respectively. The green region is the tissue layer on the given scaffold which is represented by the dark region. For interpretation of the references to color in the figure, the reader is referred to the web version of the article.
Applsci 09 04058 g005
Figure 6. (ac) are snapshots of tissue growth simulation in 3D on the scaffold at t = 0 , 3200 Δ t , and 6400 Δ t , respectively. The green region is the tissue layer on the given scaffold which is represented by the dark region. For interpretation of the references to color in the figure, the reader is referred to the web version of the article.
Applsci 09 04058 g006
Figure 7. (ac) are snapshots of tissue growth simulation in 3D on the P, D, and G surface scaffolds (from top to bottom) at t = 0 , t = 500 Δ t , and t = 1000 Δ t , respectively. The green region is the tissue layer on the given scaffold which is represented by the dark region. For interpretation of the references to color in the figure, the reader is referred to the web version of the article.
Applsci 09 04058 g007
Figure 8. Temporal evolutions of the volume and those of the surface area of cell layer over TPMS. (a) is the volume of the cell layer over each TPMS and (b) is the surface area of the cell layer over each TPMS. Note that the horizontal spacing between each marker is 100 Δ t .
Applsci 09 04058 g008
Figure 9. Temporal evolution of the averaged local curvature of cell layer over TPMS. Note that the horizontal spacing between each marker is 170 Δ t .
Applsci 09 04058 g009
Figure 10. P is the initial perimeter of the channel cross-section and A is the projected tissue area. Reprinted from Rumpler et al. [18], with permission from The Royal Society.
Applsci 09 04058 g010
Figure 11. Comparison of numerical simulation and experiment in [18] with P = 3 . 14 . Four different channel shapes (square, hexagon, triangle, and circle) are represented by colored marker-line (magenta, blue, green, and red) from top to bottom, respectively. Reprinted from Rumpler et al. [18] with permission from The Royal Society.
Applsci 09 04058 g011