Article

Probabilistic Characteristics of Moment Capacity and Rotational Stiffness of Wedge Joints Used in Support Systems Reflecting Reused Members

1
Cheongju Technopolis Industrial Estate Site, DAEWOO E&C, Chungbuk 28358, Korea
2
Korea Institute of Civil Engineering and Building Technology, Gyeonggi 10223, Korea
3
School of Civil, Architectural, and Environmental Engineering, Korea University, Seoul 02841, Korea
4
Department of Civil Engineering, Hoseo University, Chungnam 31499, Korea
5
National Crisis & Emergency Management Research Institute, Chungbuk National University, Chungbuk 28644, Korea
6
Department of Safety Engineering, Chungbuk National University, Chungbuk 28644, Korea
*
Author to whom correspondence should be addressed.
Appl. Sci. 2019, 9(19), 4056; https://doi.org/10.3390/app9194056
Submission received: 13 June 2019 / Revised: 15 September 2019 / Accepted: 18 September 2019 / Published: 27 September 2019
(This article belongs to the Section Civil Engineering)

Abstract

:
The moment capacity and rotational stiffness of wedge joints, which connect vertical and horizontal members of assembled support systems, were evaluated experimentally considering the characteristics of reused members. Since temporary structures, such as supports, tend to be reused, experiments were conducted with reused members, and the normality of the measured data was assessed. The lower and upper limits of the 95% confidence intervals of the moment capacity and rotational stiffness of wedge joints with reused members were determined. Experiments were also conducted on a joint system with new members to analyze the influence of reused members. In integrating both new and reused members, the maximum moments of wedge joints were observed to be normally distributed. The lower limit of the 95% confidence interval of the maximum moment of joints was 0.997 kNm, and the upper limit was 1.074 kNm. The rotational stiffness of the wedge joint was evaluated using a trilinear model. The initial rotational stiffness decreased with continued use of the joint. The average rotational stiffness of the joint, analyzed by combining the results for new and reused members, was found to be 22.475 kNm/rad for the first interval, 4.705 kNm/rad for the second interval, and 1.577 kNm/rad for the third interval. The lower limit of the 95% confidence interval of the initial rotational stiffness was 20.688 kNm/rad, and the upper limit was 24.262 kNm/rad.

Graphical Abstract

1. Introduction

The construction is known as the killing industry with a high risk for workers. One of the reasons causing a high risk is that the temporary structures are widely used in construction sites for working. The representative example of the temporary structure is a scaffolding, which has the biggest potential for fall accident and each year a significant number of fatalities and there were many concerns about the bearing capacities of scaffoldings [1,2,3,4]. In addition, support system is a temporary structure frequently used. A support system used during the construction of a permanent structure provides strong resistance to dead load because vertical, horizontal, and bracing members are installed at regular intervals.
Assembled support systems connected by wedge joint between the vertical and horizontal members are easier to install and dismantle than conventional supports, and as a result, their use has been gradually increasing in high-rise and large-scale construction projects, given their structural safety and ease of use. To prevent support collapse accidents, South Korean law stipulates that structural safety should be ensured through expert review when supports are installed at a site. In addition, a safety certification system for the minimum required performance exists to make producers and sellers of supports produce and sell only products that exceed the performance required by the relevant law [5]. A support system will not collapse if it is designed so that its performance will exceed the minimum performance required by law and if it is constructed in accordance with approved design drawings. Although the standards related to the performance and installation of support systems ensure that a safety factor sufficient to prevent collapse accidents is considered, such accidents still occur [6].
Although the performance required of support systems is based on new products, both new and reused products are used on construction sites together. Probabilistic approaches exist for quantifying the performance of a member in terms of the influence of the reuse of temporary materials, and the minimum safety factor required can be determined through probabilistic approaches. Various probabilistic studies on the performance of structures have been conducted [7,8,9,10]. In addition, various studies have been conducted using probabilistic theories for the analysis of the performance of temporary structures, even though these studies have been limited to new products [11,12,13,14].
Zhang et al. [11] performed an experiment to determine the ultimate strength of a multi-story steel support scaffold frame and the rotational stiffness of the joints. They suggested values for the average ultimate strength and COV of a steel support scaffold frame based on probabilistic analysis of the measured data, and they conducted a reliability analysis based on the statistical data. They also conducted a reliability analysis of the performance of steel scaffold shoring structures used during concrete construction [12]. Chandrangsu and Rasmussen [13] measured the geometric defects of a scaffolding system with cuplock-type joints at a construction site. The measured geometric defect data included 302 out-of-straightness instances, 80 out-of-plumb instances, and 74 loading eccentricity instances. Probability values were suggested by normalizing the measured geometric defect data. However, there has not been sufficient probabilistic analysis of temporary structures to suggest design values for the predominant type of support systems with wedge-type joints. Therefore, to evaluate the performance of support systems mainly used in actual construction sites in South Korea, a study involving experimental data for both new and used members, as well as a probabilistic analysis of the results, is required.
There are various causes of the support system collapse, such as eccentricity of the load, defective installation of the joint, and geometric defects [14,15]. The rotational stiffness and moment capacity of the joints have been studied in various parts [16,17,18]. In addition, many studies have been conducted on temporary structures, including support systems and scaffolds. Yuan et al. [19] derived the rotational stiffness of fastener-type joints of tubular steel formwork support (FTSF) systems to obtain data on the semi-rigid behavior of the joints and the initial geometric imperfections of FTSF systems. Zhang et al. [20] performed an experiment in which the joints for the main types of steel scaffolds used in China were classified into rigid and semi-rigid types. They found that the behavior of the semi-rigid joint type was similar to the actual behavior of the scaffold. Chandrangsu and Rasmussen [13] studied the stiffness of the joints of cuplock-type with various joint configurations and loading directions (up, down, left, and right). The initial rotational stiffness of the joint was found to be the highest when the load was applied in the upward direction, and the stiffness increased as the number of horizontal members connected to the joint increased. Parabhakaran et al. [15] compared rotational stiffness values from various analytical models for the rotational stiffness of clamp-type joints and suggested initial values of the rotational stiffness of clamp-type joints. Peng et al. [21] studied the behavior of wedge-type support system joints by considering the presence of bracing, the height of the ground, and the number of floors in the support as variables. They also studied the critical load of the assembly and the rotational stiffness of the joint between members with respect to each variable. Zhu et al. [22] analyzed the moment–rotation curve for the orthogonal couplers of circular steel pipe scaffolds and found that the relationship between the moment and the rotational angle was nonlinear when the coupler connection rotated in the vertical plane, whereas it was linear in the horizontal plane. Liu et al. [23] tested the rotational stiffness of wedge-type joints with plug-in connectors while other researches about the rotational stiffness studied wedge-type joints with disc (or rosette) connectors. By vision-based measurement, Lie et al. studied the mechanical properties of wedge-type joints. Pieńko and Błazik-Borowa [24] studied the numerical model of wedge-type joints with the disc. By comparing experimental and numerical results, the friction coefficient between contact surfaces and wedge insertion depths were proposed to apply the numerical model.
In South Korea, Kim et al. [25] suggested an equivalent linear form for the rotational stiffness of the joint between vertical and horizontal members of a specimen through an overall shape comparison between experimental and analytical values for wedge-type joints commonly used in South Korea. Won et al. [26] suggested a trilinear model for the rotational stiffness of the wedge-type joint between vertical and horizontal members in a support system and conducted research on the moment capacity of such a system.
Various probabilistic studies have been conducted on the rotational stiffness and moment capacity of the joints of temporary structures, but the valuable data for wedge joint in support systems considering reused members is insufficient to apply for design process. Moreover, as the boundary condition of the joint between vertical and horizontal members is generally assumed to be a simple hinge in design standards and the safety of a structure is considered to depend on its elastic behavior within the allowable stress range, there are limitations on accurately predicting the ultimate behavior of support systems.
Therefore, in this study, experiments reflecting the characteristics of reused members were performed for wedge joints connecting vertical and horizontal members of assembled support systems, and the moment capacity and rotational stiffness of wedge joints were analyzed to predict the ultimate behavior of such support systems on actual sites. Based on the results, the 95% confidence intervals of the moment capacity and initial rotational stiffness of wedge-type joints were determined by conducting a probabilistic analysis.

2. Rotational Stiffness of Joint According to Joint Type

The results of studies on the rotational stiffness of the joints of temporary structures are summarized in Table 1. The initial rotational stiffness of clamp-type joints, which are called right-angle couplers, ranged from 10.65 kNm/rad to 25.00 kNm/rad. For wedge-type joints, which consist of a joint ring (rosette) and insert pins, the suggested initial rotational stiffness were between 26.315 kNm/rad and 38.92 kNm/rad. In the case of cuplock-type joints, the initial rotational stiffness was greater than that of the clamp-type joint the wedge-type joint. The rotational stiffness of joints could be affected by the number of connected horizontal members as shown in the research of Chandrangsu and Rasmussen [13]. As the number of connected horizontal members increased, the initial rotational stiffness was increased since the displacement was restricted.

3. Experimental Program

3.1. Specimen

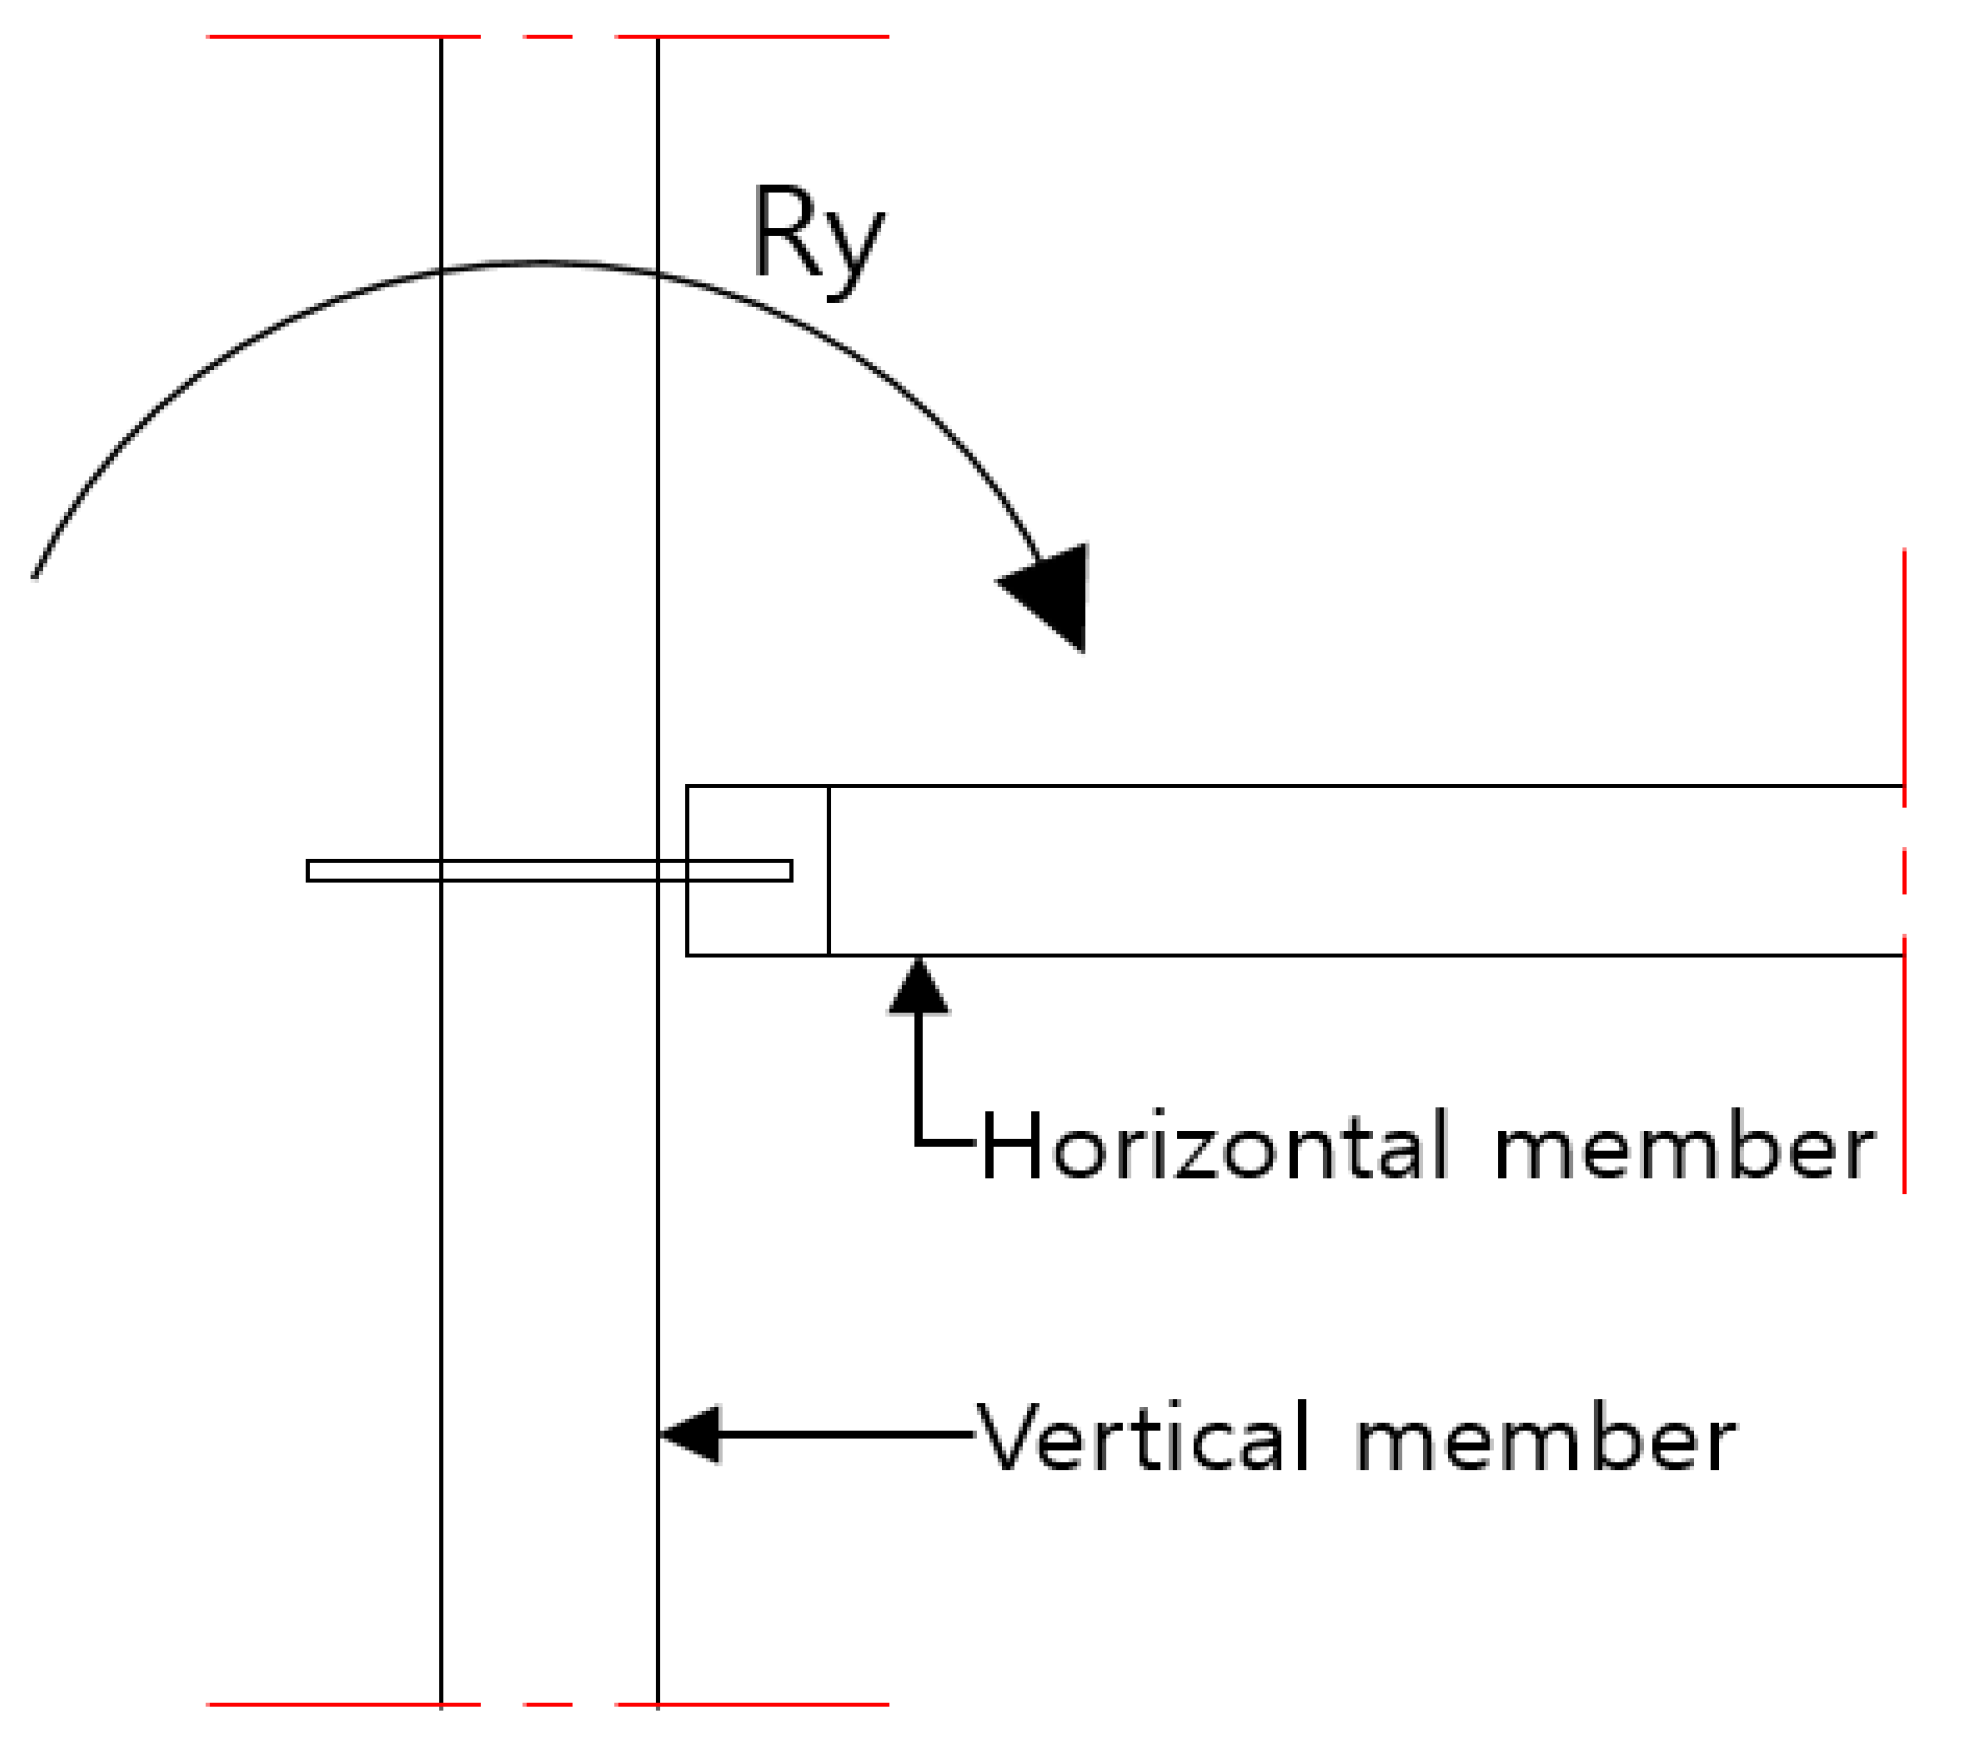
For the rotational stiffness of a joint, the rotational stiffness of the vertical axis (Ry) of the vertical member and horizontal member plane was considered among the three-directional rotations of the joint, as shown in Figure 1. In the tests conducted in this study, a specimen consisted of one vertical member, one horizontal member, and a joint at which a pin at the end of the horizontal member was inserted into a ring attached to the vertical member to connect the two members. The load was applied to the horizontal member in the cantilever state. The opposite moment (-Ry) was not considered in this study. It is noted that the rotational stiffness of the joint in the opposite direction could be different than that of the joint in the tested direction since the end of a horizontal member is not symmetric.
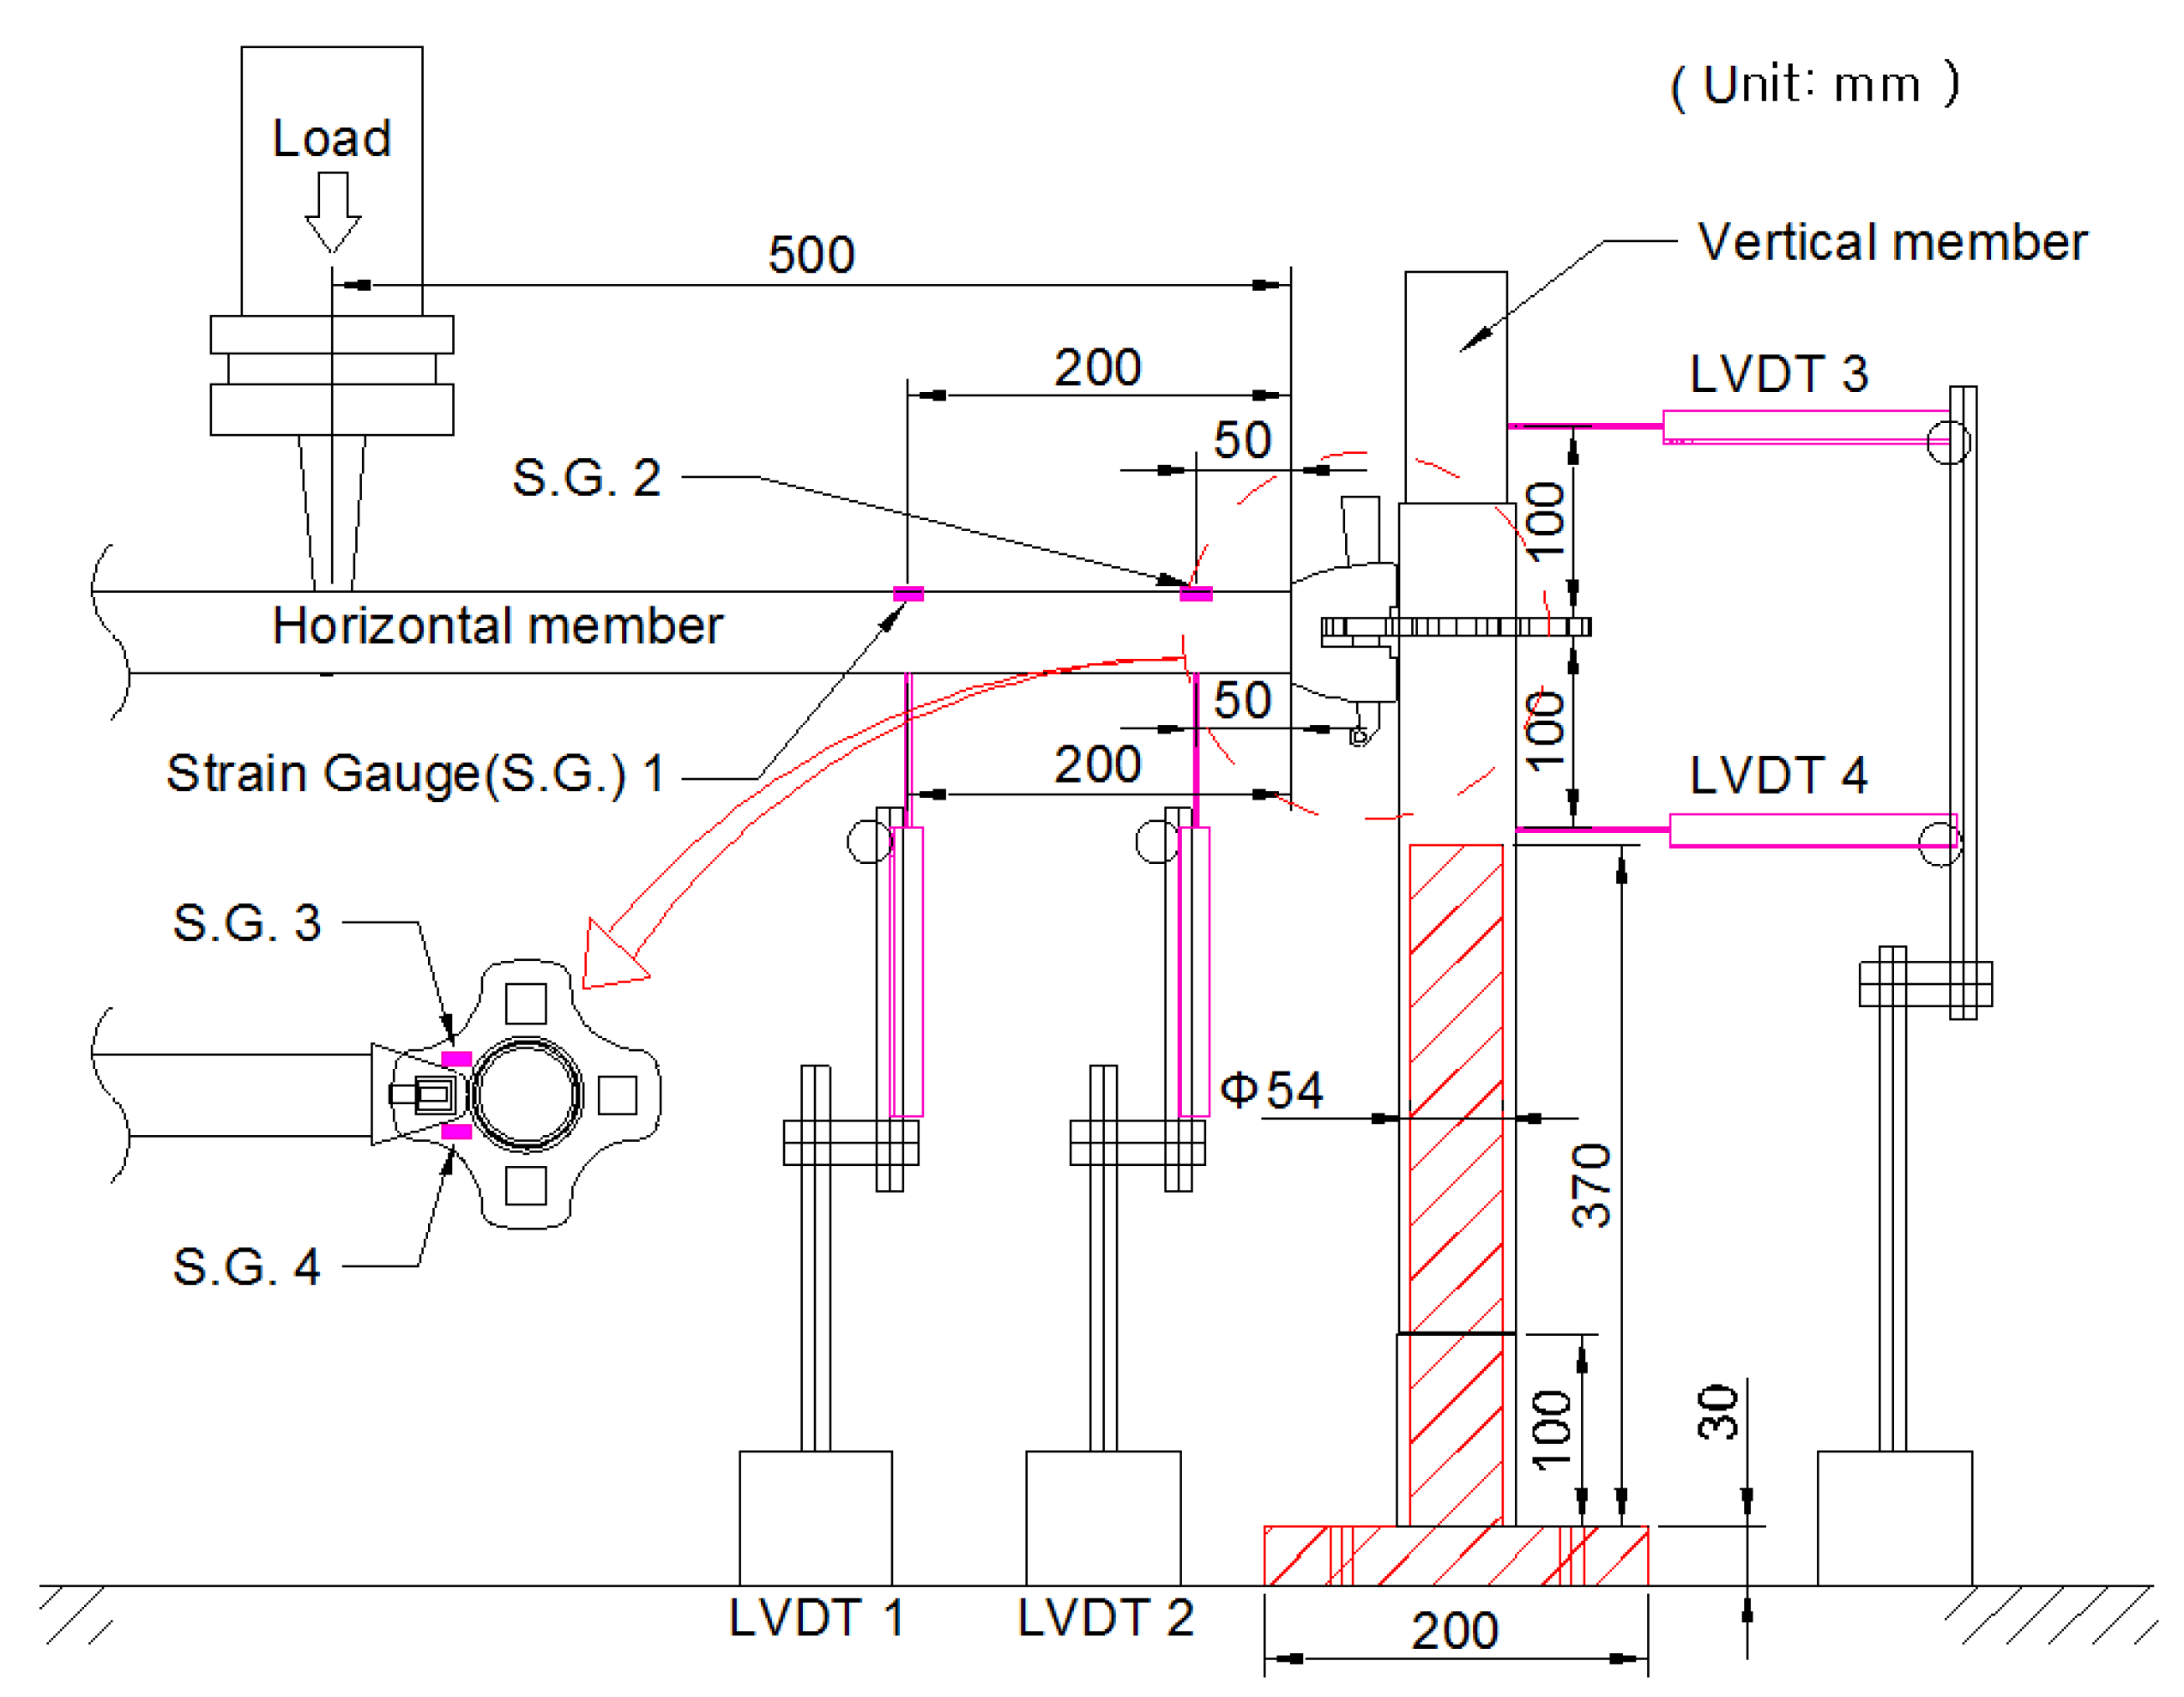
A jig attached to the floor was fabricated to fix the vertical member. The jig consisted of a floor plate and a round steel bar, and the vertical member was fixed by inserting it into the round steel bar. The material of the jig was SS400, and the dimensions of the floor plate were 30 mm (height) × 200 mm (width) × 200 mm (depth). The round steel bar welded to the floor plate was 370 mm in length and 54 mm in diameter (Figure 2).
To measure the displacement and angle that varied as the load was applied to each specimen, linear variable differential transformers (LVDTs) were installed on the vertical and horizontal members, as shown in Figure 2. In addition, strain gauges were installed on the joint ring and on the horizontal member to determine the stress in the joint ring and in the horizontal member. Two LVDTs were installed on the bottom of the horizontal member. LVDT1 was installed 200 mm from the joint, and LVDT2 was installed 50 mm from the joint. Strain gauges (S.G.1 and S.G.2) were installed on the top of the horizontal member at the same positions as those of LVDT1 and LVDT2. In the case of the vertical member, two LVDTs were installed 100 mm above and below the connection pin, and two strain gauges were installed (S.G.3 and S.G.4) on the joint ring.
To reflect the reuse characteristics of temporary materials, experiments on joints were performed using the vertical and horizontal members that had been used before. Specimens must be prepared based on the number of uses to obtain accurate data, but it is practically difficult to prepare specimens based on the number of uses because the history of temporary materials is not managed. Therefore, specimens were constructed by randomly purchasing products made by the same manufacturer from a large leasing company, based on the period of use. Eleven sets of products used for one year, eleven sets of products used for four years, and eleven sets of products used for seven years were purchased. Specimens composed of a vertical member, a horizontal member, and a joint were constructed for the experiments, and a wedge-type joint was employed for all of the specimens. Experiments were also performed with thirteen sets of new members to compare and analyze changes in the moment capacity and rotational stiffness of the joint due to reuse. The specimens considered in this study are listed in Table 2. The New-S-3 and Reused-7-6 specimens were excluded from the analysis because measurement mistakes occurred during the experiment and appropriate data could not be obtained for them.

3.2. Material Properties

Table 3 shows the specifications of the vertical and horizontal members used in the experiments. The vertical member was made of SGH 490 steel with a yield strength of 365 MPa, and it had a 432-mm length, a 60.5-mm diameter, and a 2.6-mm thickness. In selecting the size of the vertical member, the major consideration is the frequently used size and test condition. The diameter of the vertical member was selected as 60.5 mm adopted frequently in practice. The vertical member should be fixed at the top or bottom in order to measure the displacement of the joint system (LVDT1–4). In this study, the bottom of the vertical member was fixed, as shown in Figure 2, and the vertical member with 432-mm length (excluding vertical connection part) was selected from the existed products. The horizontal member was made of STK 400 steel with a yield strength of 235 MPa, and it had a 1468-mm length, a 42.7-mm diameter, and a 2.2-mm thickness.

3.3. Test Set-Up

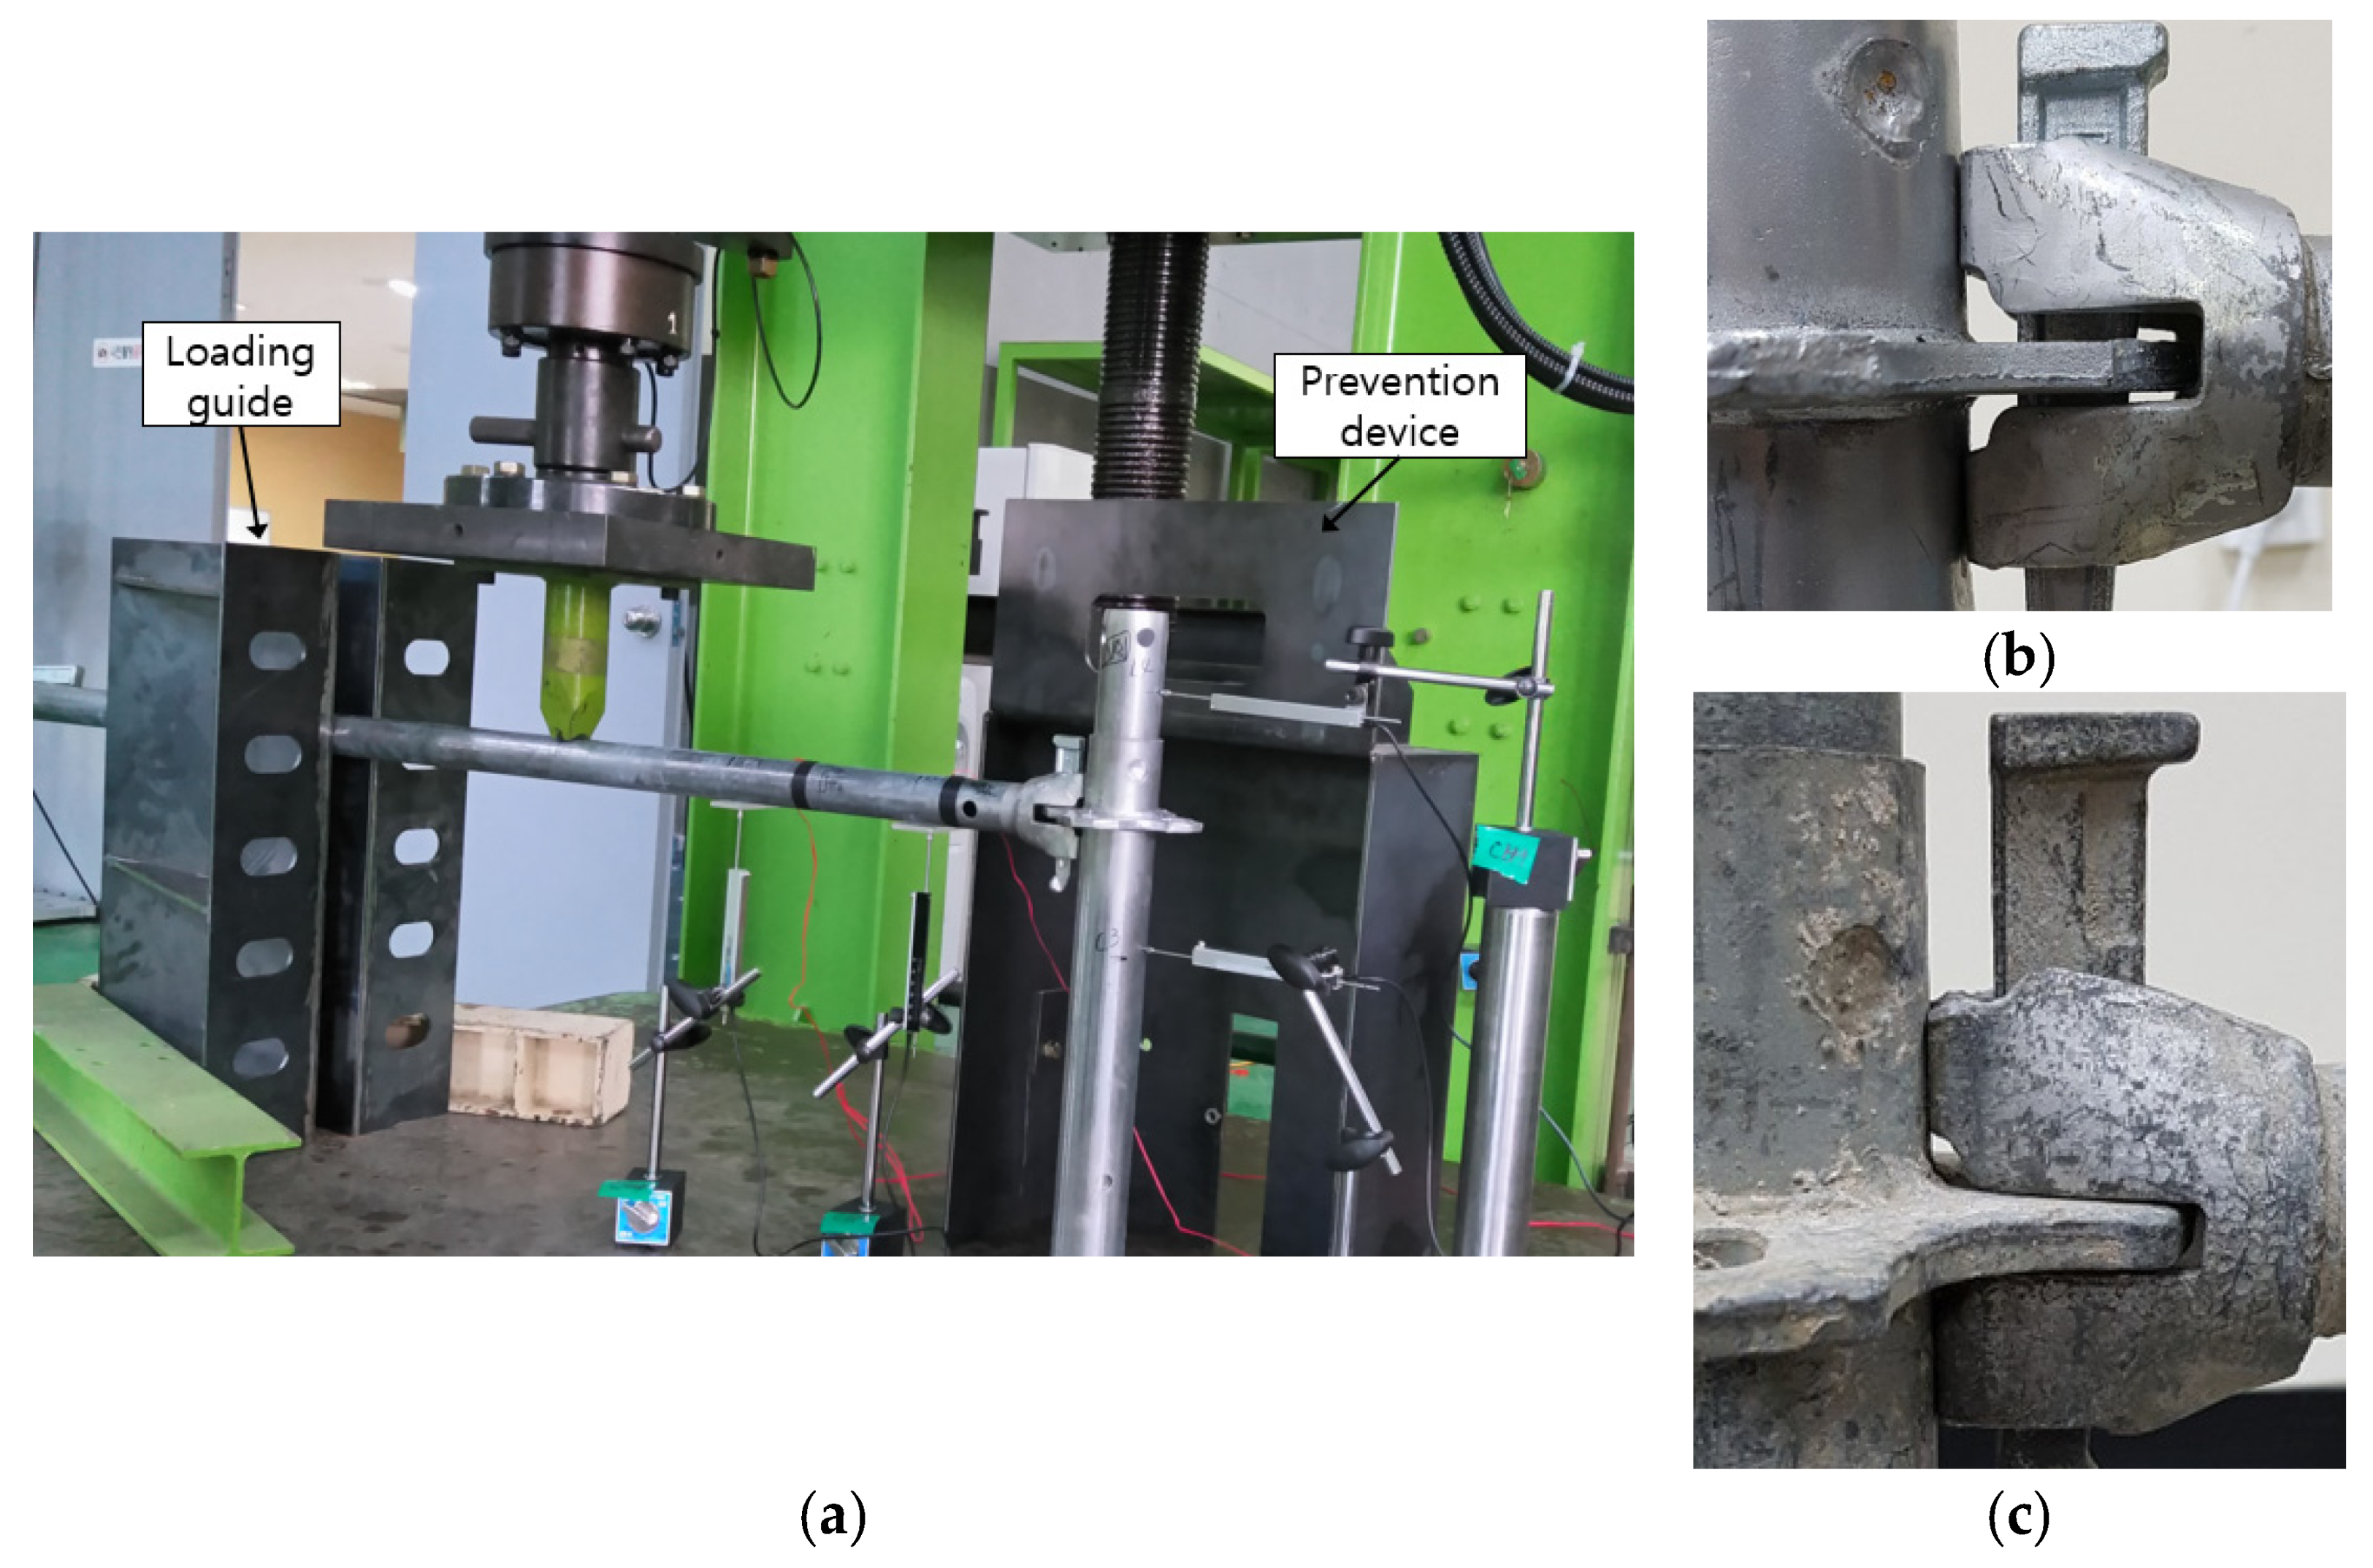
The load was applied at a rate of 10 mm per minute using a universal testing machine (UTM) with a capacity of 200 kN. Out-of-plane motion may occur to the joint because the horizontal and vertical members are connected using a simple pin. To prevent the occurrence of out-of-plane motion, a loading guide was installed behind the loading point, as shown in Figure 3a, and the forcing jig at the end of the UTM was machined to match the curvature of the horizontal member. In addition, the pin or joint ring can be destroyed as a result of deformation of the joint. Therefore, a prevention guide made of steel was placed around the joint to prevent accidents caused by debris. To insert a pin into a joint ring, the pin was hit 3–5 times by a hammer which can ensure the sufficient wedge insertion depth.
As previously mentioned in 3.1, specimens were made by the same manufacturer from a large leasing company, based on the period of use. Even though the same joint configuration was selected, there was one difference. The grove size at the end of the horizontal member, which the joint ring passed to, was different in seven-year used specimens and some four-year used specimens. In these specimens, the grove size was similar to the thickness of the joint ring (Figure 3c). However, the grove size was somewhat enlarged in recent products such as new specimens, one-year used specimens, and some four-year used specimens in order to install the joint ring easily (Figure 3b).

3.4. Estimation of Rotational Stiffness

The moment–rotation angle relationship for the joint must be calculated to obtain the rotational stiffness of the joint. The rotation angle can be obtained using the displacements measured by the LVDTs installed on each specimen, as shown in Equation (1) (see Figure 2).
θ = tan 1 ( Δ 1 Δ 2 d 1 2 ) tan 1 ( Δ 3 Δ 4 d 3 + d 4 )
where Δ1 is the displacement of LVDT1, Δ2 is the displacement of LVDT2, Δ3 is the displacement of LVDT3, and Δ4 is the displacement of LVDT4. d1-2 is the distance between LVDT1 and LVDT2, d3 is the distance between LVDT3 and the joint, and d4 is the distance between LVDT4 and the joint (see Figure 2).
To obtain the joint stiffness from the moment–rotation angle relationship, the rotational stiffness was evaluated using a trilinear model to predict the actual rotational stiffness of the structure and its behavior under ultimate conditions (Figure 4).

4. Results

4.1. Failure Mode

Figure 5 shows the shape of the vertical and horizontal member joint system at failure. As seen from the figure, the joint ring was deformed in the loading direction for both the new and reused specimens. It was found that the end of the horizontal member contacted and gradually deformed the vertical member, leading to a failure. Thus, the moment capacity of joints can be increased by reinforcing the contact surface or attaching the plate at the end of the horizontal members, as shown in Fink et al. [27]. The deformation of the vertical member was relatively larger when the reuse period of the members of the specimen was longer.
The detailed failure mode showed slightly different results according to the grove size at the end of the horizontal member, as shown in Figure 6. In the case of sufficient space in the grove as mentioned in Figure 3b, the failure was mainly contributed by the strength of the vertical member where the horizontal member was contacted (Figure 6a–c). However, the system with the seven-year reused members, which had little space in the grove (see Figure 3c), showed that the additional resistance occurred by the contact between the joint ring and grove surface at the horizontal member (Figure 6d). After the end of the horizontal member was contacted to the vertical member, the joint ring was also contacted to the grove surface as a loading increased due to the little space in the grove, resulting in occurring the additional resistance in joint and increasing the vertical displacement of the joint ring.
Moreover, the connection pin was destroyed in a specimen with a reuse period of seven years, as shown in Figure 7 (Reused-7-2 specimen), indicating that the strength of the connection pin of a product with a long reuse period may not be sufficient. This phenomenon is undesirable since wedges are usually made of steel with higher strength than the other elements of the node. Among all specimens, only one specimen in seven years reused member showed destruction of the connection pin. It was thought that the quality control system had a problem at that time. To prevent accident from this destruction in the experimental test, the prevention device should be installed as shown in Figure 3a.
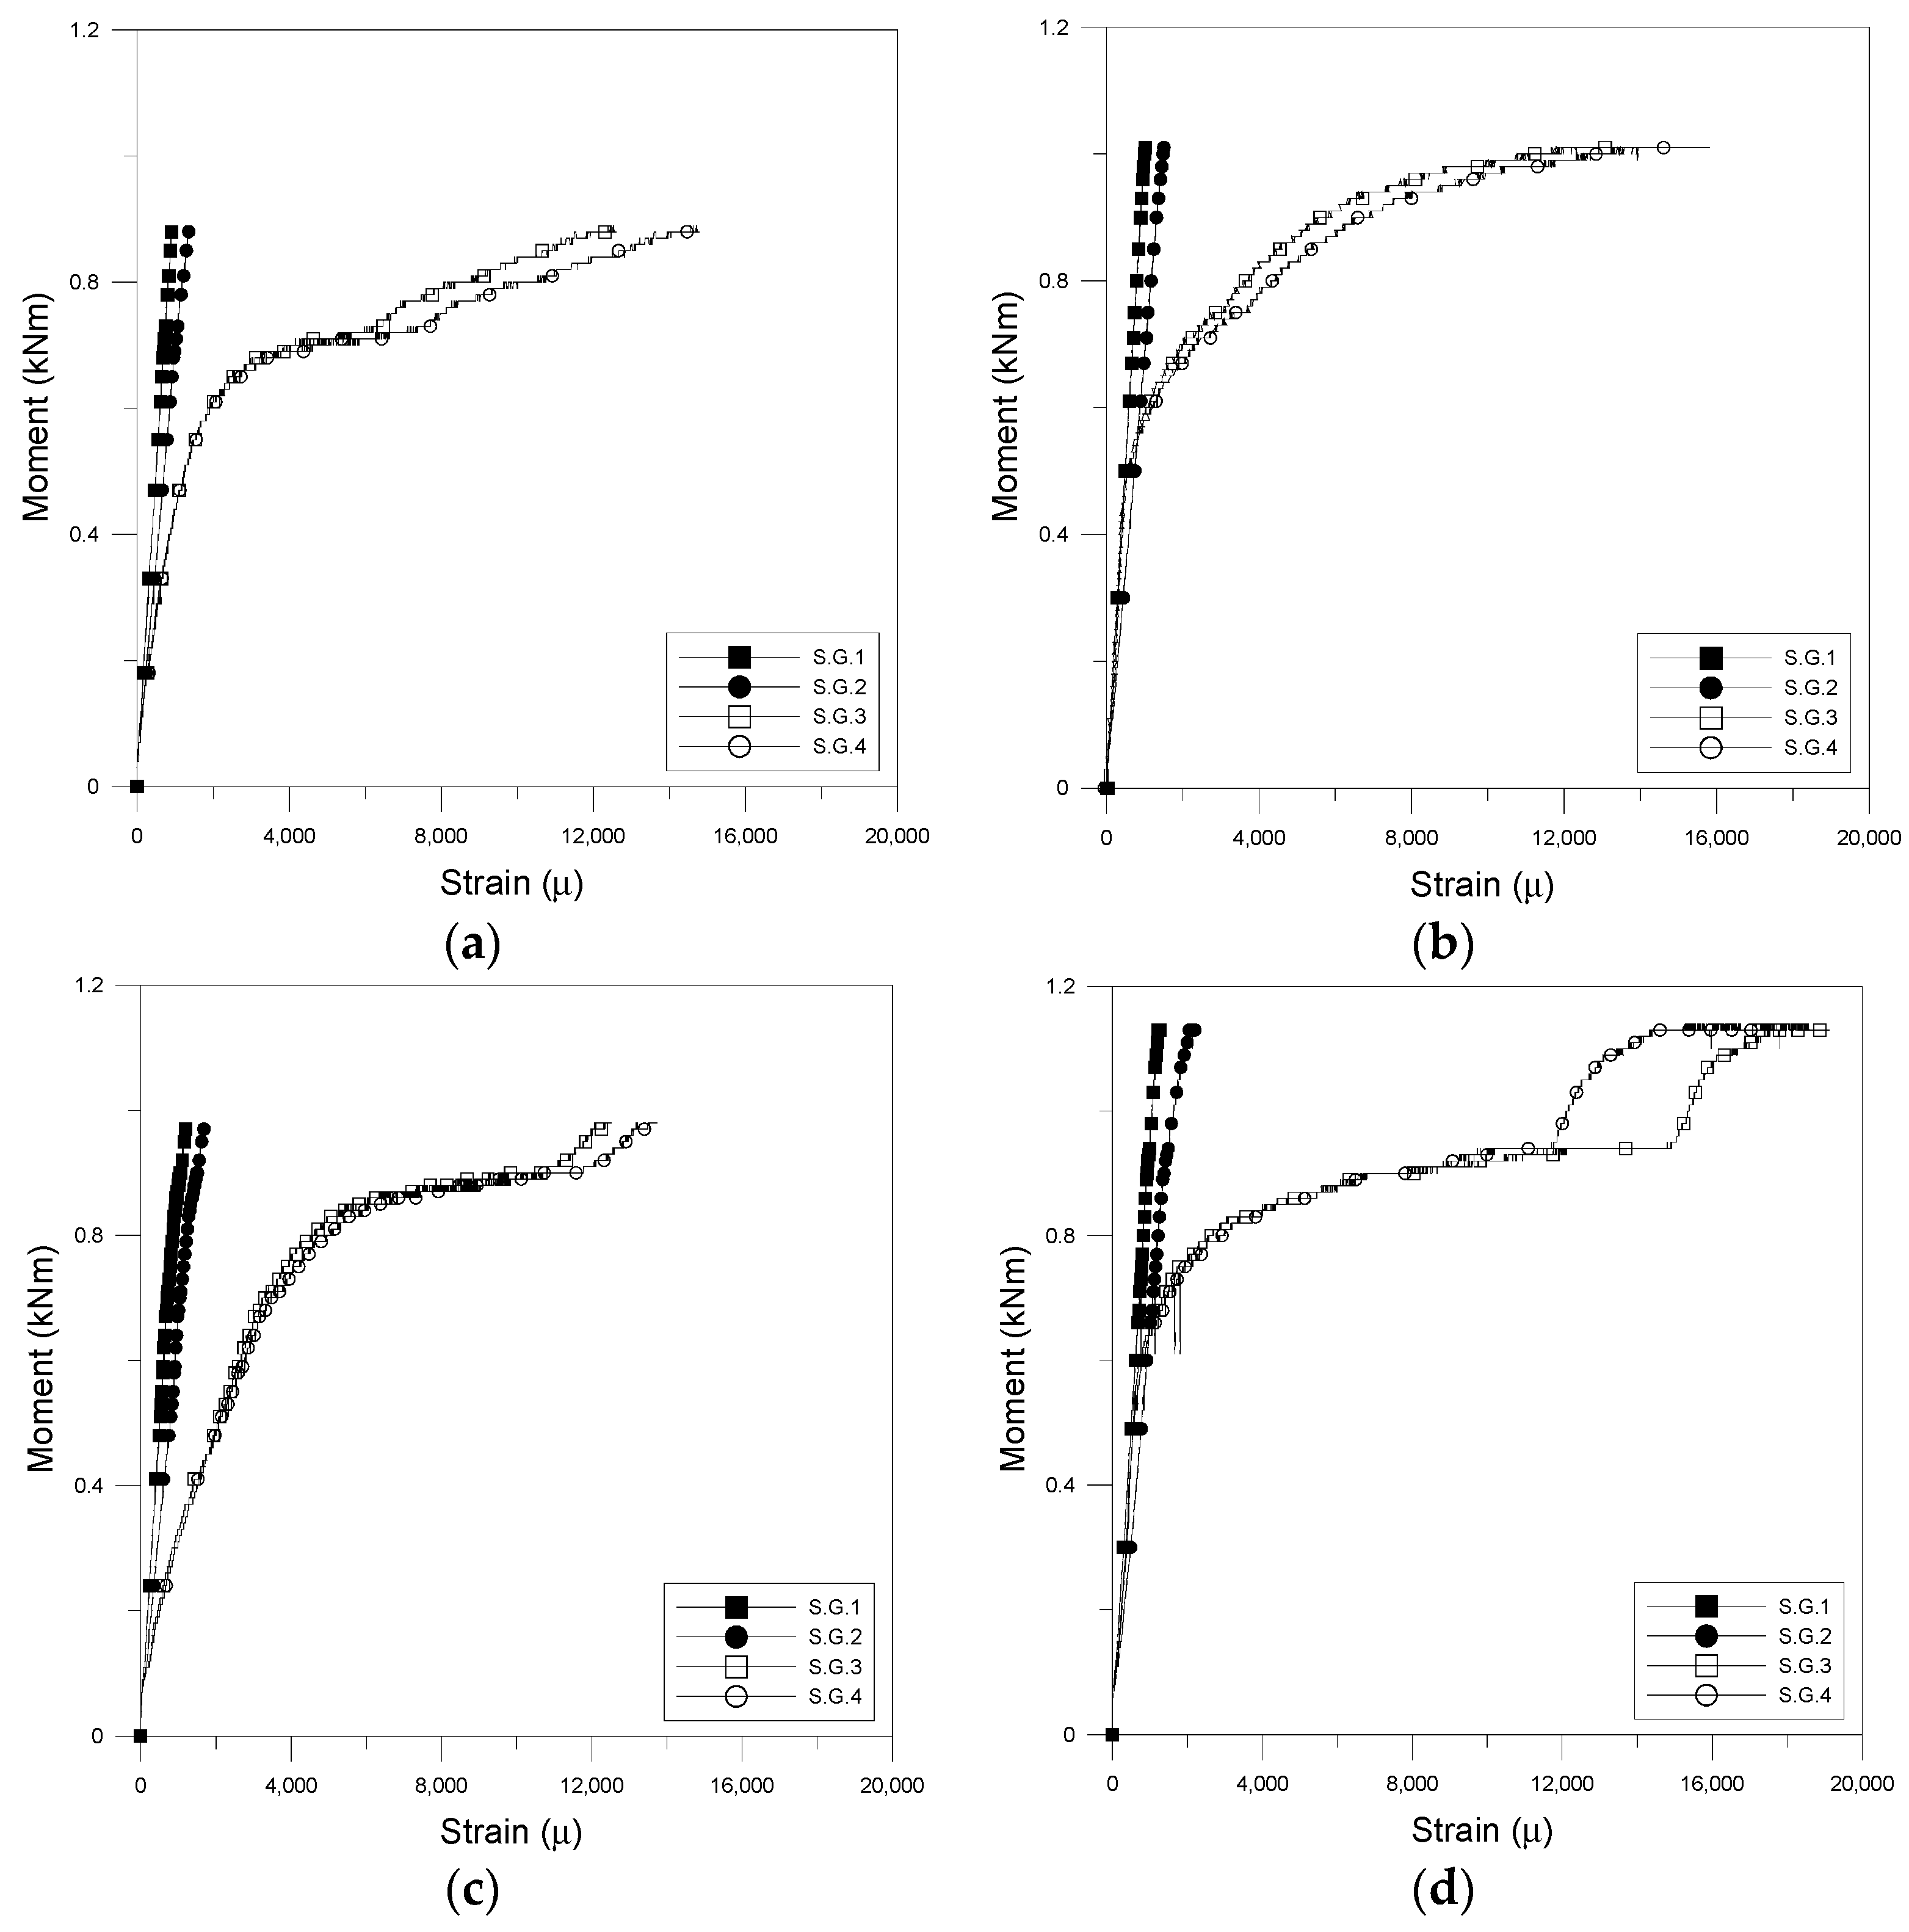
The strains in the joint ring and the horizontal member were analyzed as a function of the load. The strain analysis results for New-S-9, Reused-1-7, Reused-4-5, and Reused-7-10 are shown in Figure 8. As the Figure shows, the maximum horizontal member strain values (from S.G.1 and S.G.2) were small for all of the specimens, and the strains were linear and did not exceed the yield strain. In the case of the joint ring, however, nonlinear behavior was observed after yielding for all of the specimens (based on measurements from S.G.3 and S.G.4). This indicates that the failure of the joint system is caused by the ultimate behavior of the joint ring, regardless of the reuse period. In the case of little space in grooves, the moment in joint rings were additionally increased after yielding due to the contribution of the contact between the joint ring and the grove surface at the end of the horizontal member as explained in failure mode (Figure 8c,d).

4.2. Probabilistic Value of Moment Resistant Capacity

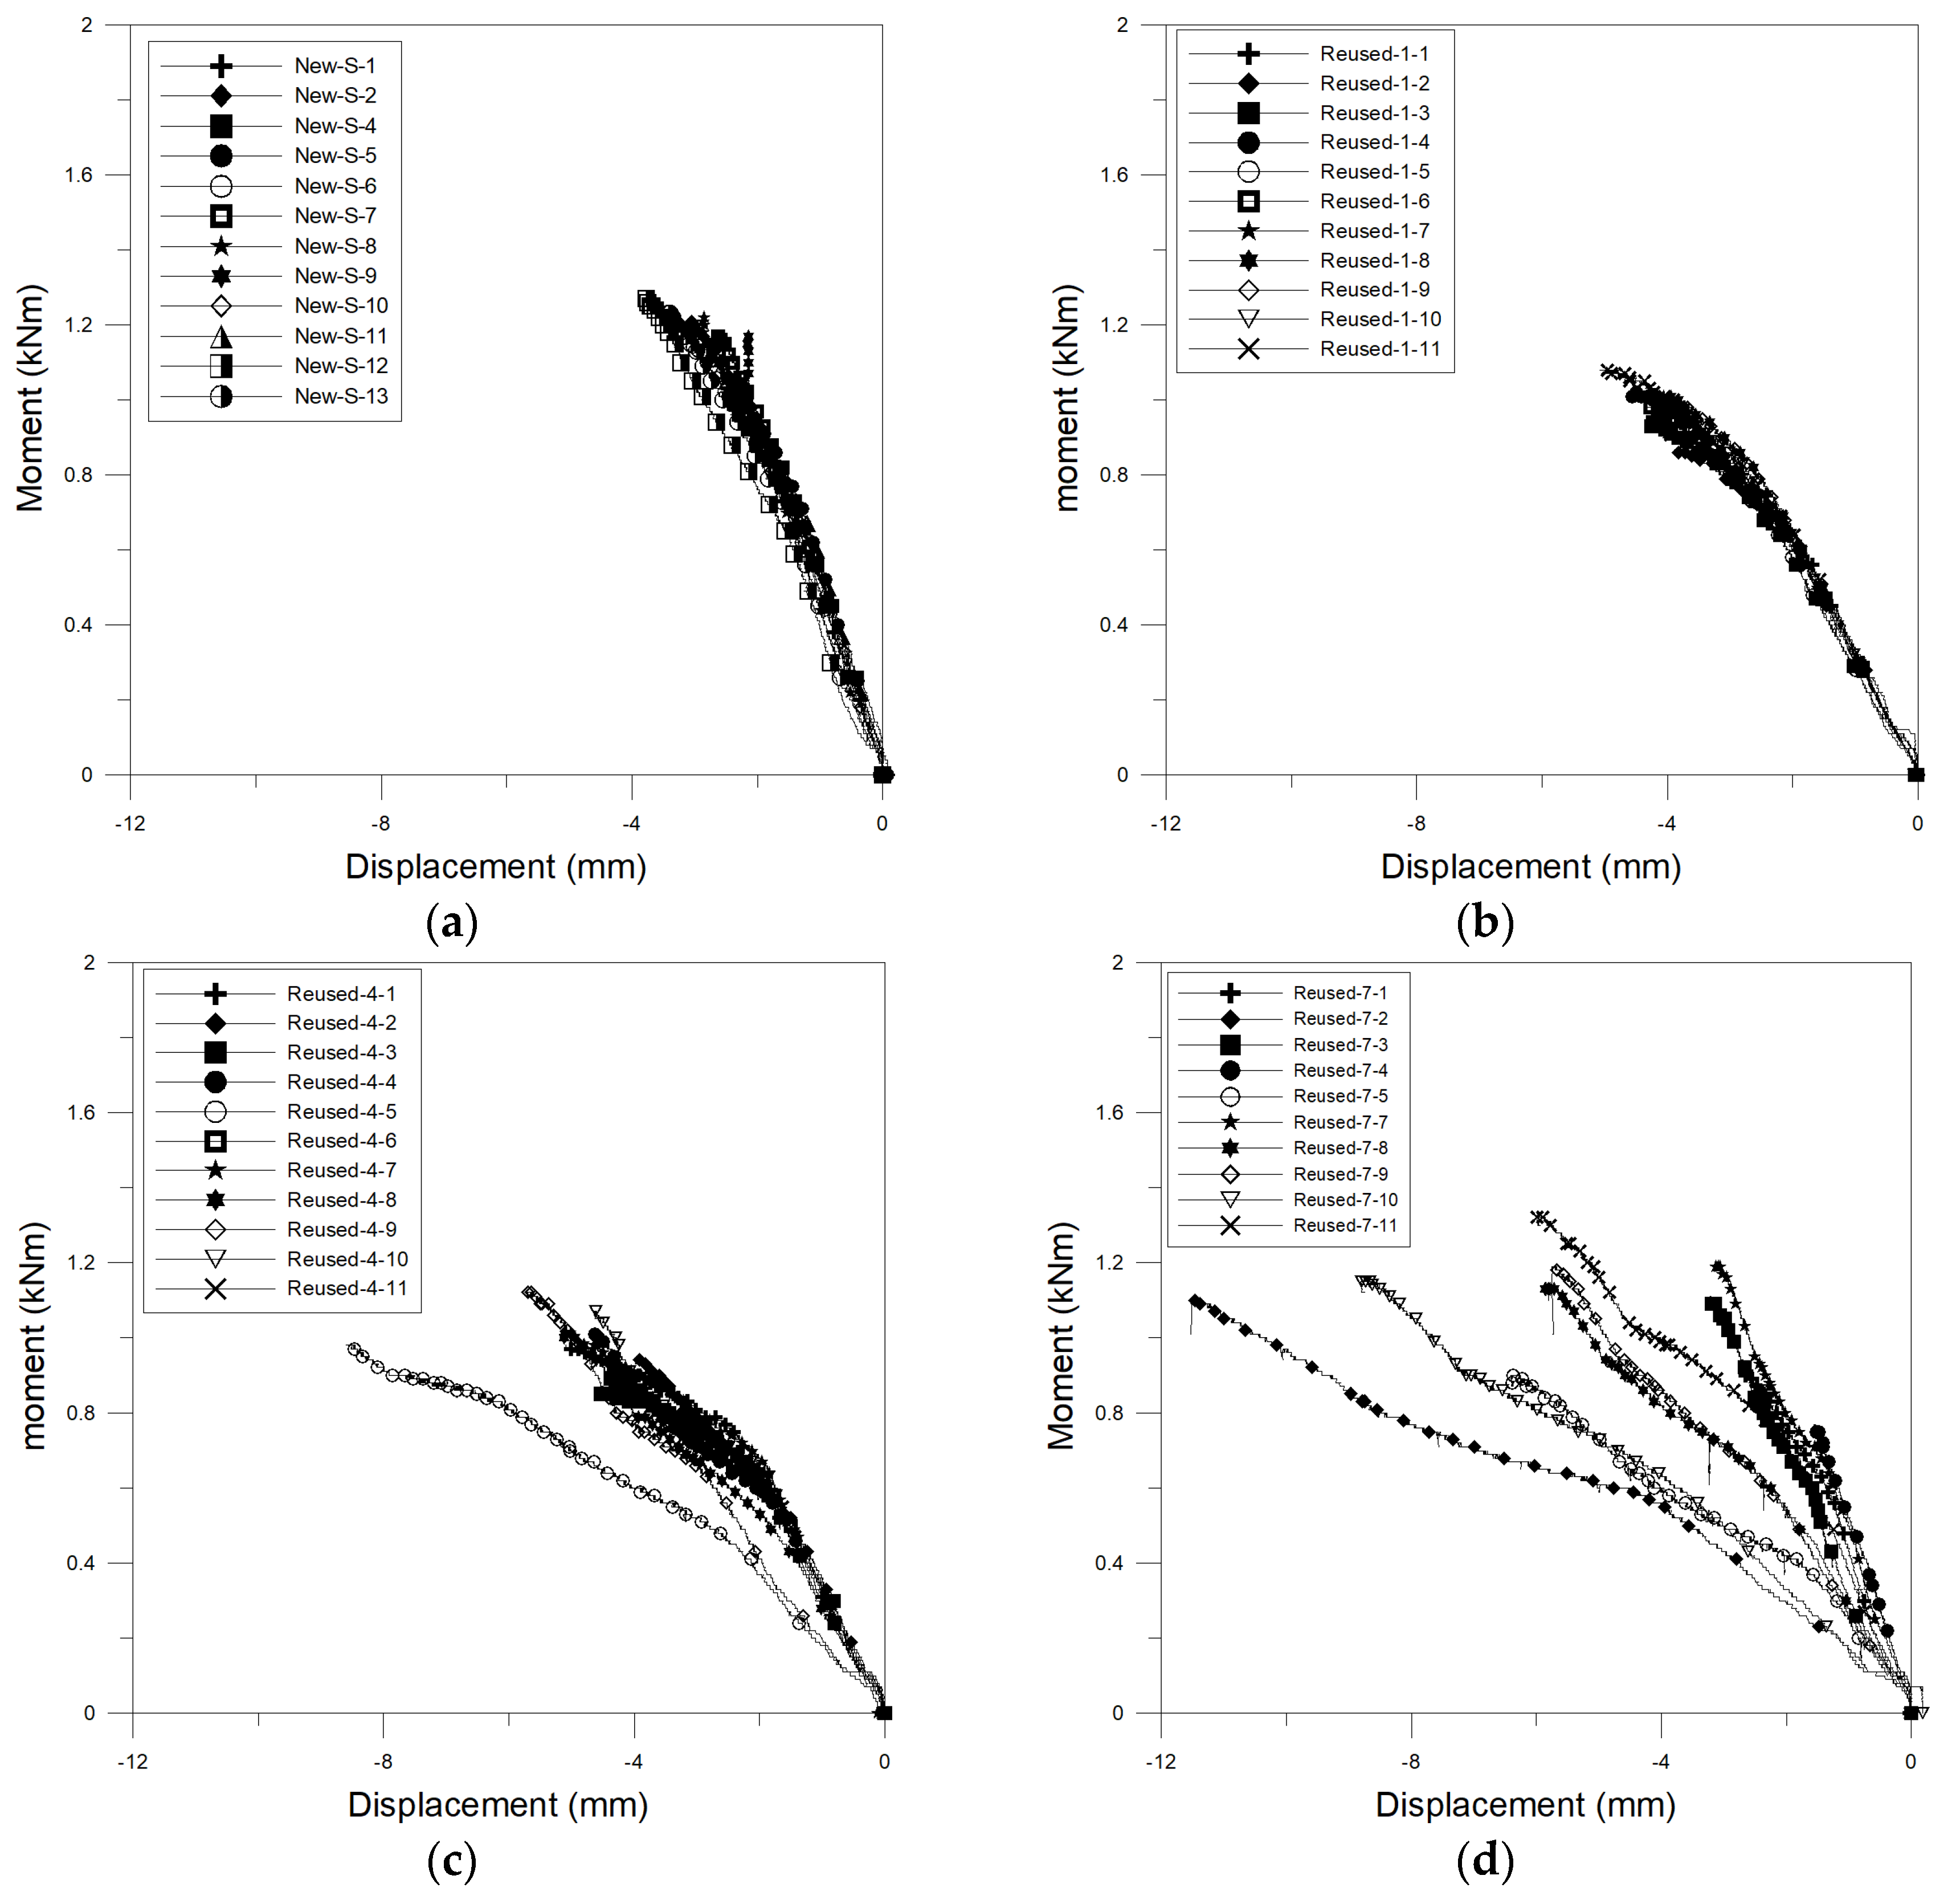
To evaluate the resistance moment capacity of the joint, the relationship between the moment, which was calculated by multiplying the distance from the loading point to the joint (500 mm as shown in Figure 2) by the load value, and the displacement measured by each LVDT was analyzed, as shown in Figure 9, Figure 10, Figure 11 and Figure 12. The maximum moment in each specimen is summarized in Table 4.
From Figure 9 and Figure 10, which show the time history relationship between the resistance moment at the joint and the displacements measured by LVDT1 and LVDT2 installed on the horizontal members, it was found that the resistance moments of specimens with new members were higher than those of specimens with reused members. As the reuse period increased, the magnitude of the displacement increased for a given moment, and the deviation of the moment–displacement curves of the specimens also increased. Moreover, for longer reuse periods, some specimens yielded at relatively low moment values. However, it must be noted that the displacements shown in the figures for the new specimens are small because the capacity of the LVDTs used for displacement measurement was 50 mm, and thus displacements larger than 50 mm could not be measured. LVDTs with a capacity of 100 mm were used for measurement of the displacements of the reused specimens. For new specimens, the maximum displacement will be higher than the measured data. However, it is anticipated that the difference will be small by viewing the trend of moment–displacement curves of specimens with a one-year reuse period. In the specimens with a seven-year reuse period and some specimens with a four-year reuse period, the additional increase of moment was occurred after the yielding. This phenomenon derived from the contact between the joint ring and grove surface. As explained in the failure mode (Figure 6), little space in the grove at the end of horizontal members, where the joint ring was passed, developed the additional resistance in the joint system after yielding the system.
Figure 11 and Figure 12, which illustrate the time history relationships between the resistance moment at the joint and the displacements measured by LVDT3 and LVDT4, installed on the vertical member, show that the vertical member exhibited linear behavior until the specimens reached failure and that the slope decreased as the reuse period increased. Moreover, as the reuse period increased, the displacement increased for a given moment, and the deviation of the moment–displacement curves of the specimens also increased. In other words, it appears that an increase in the reuse period decreases the moment capacity and increases the quality deviation. In particular, as the deviation increase of the specimens leads to an increase in the member failure probability, it appears that uneven performance of the joint due to an increase in the reuse period can be a potential cause of the collapse of a support system.
Table 4 shows the maximum moment of each specimen. The maximum moment of the specimens with new members ranged from 0.88 to 1.26 kNm, with an average value of 1.13 kNm (standard deviation: 0.11 kNm, coefficient of variance: 0.097). For the specimens with a one-year reuse period, the maximum moment of the joint ranged from 0.86 to 1.08 kNm, with an average of 0.97 kNm and a standard deviation of 0.07 kNm (coefficient of variance: 0.068). The average maximum moment was 0.98 kNm (standard deviation: 0.08 kNm, coefficient of variance: 0.077) for the specimens with a four-year reuse period and 1.07 kNm (standard deviation: 0.17 kNm, coefficient of variance: 0.160) for the specimens with a seven-year reuse period.
The average maximum moment of the specimens with new members was the highest. It was 1.16 times higher than that of the specimens with a one-year reuse period, 1.15 times higher than that of the specimens with a four-year reuse period, and 1.06 times higher than that of the specimens with a seven-year reuse period. The correlation between the increase in the reuse period and the average maximum moment was not clear since the additional increase of moment was occurred after the yielding in some reuse specimens due to the contact between the joint ring and grove surface. However, it was clear that the standard deviation of the maximum moment increased as the reuse period increased. In other words, the moment capacity of the joint exhibited a larger deviation as the reuse period increased, even though the products were made by the same company using the same materials. This appears to have occurred for various reasons, such as careless handling during installation and dismantling and the aging of materials that occurs in the reuse process.
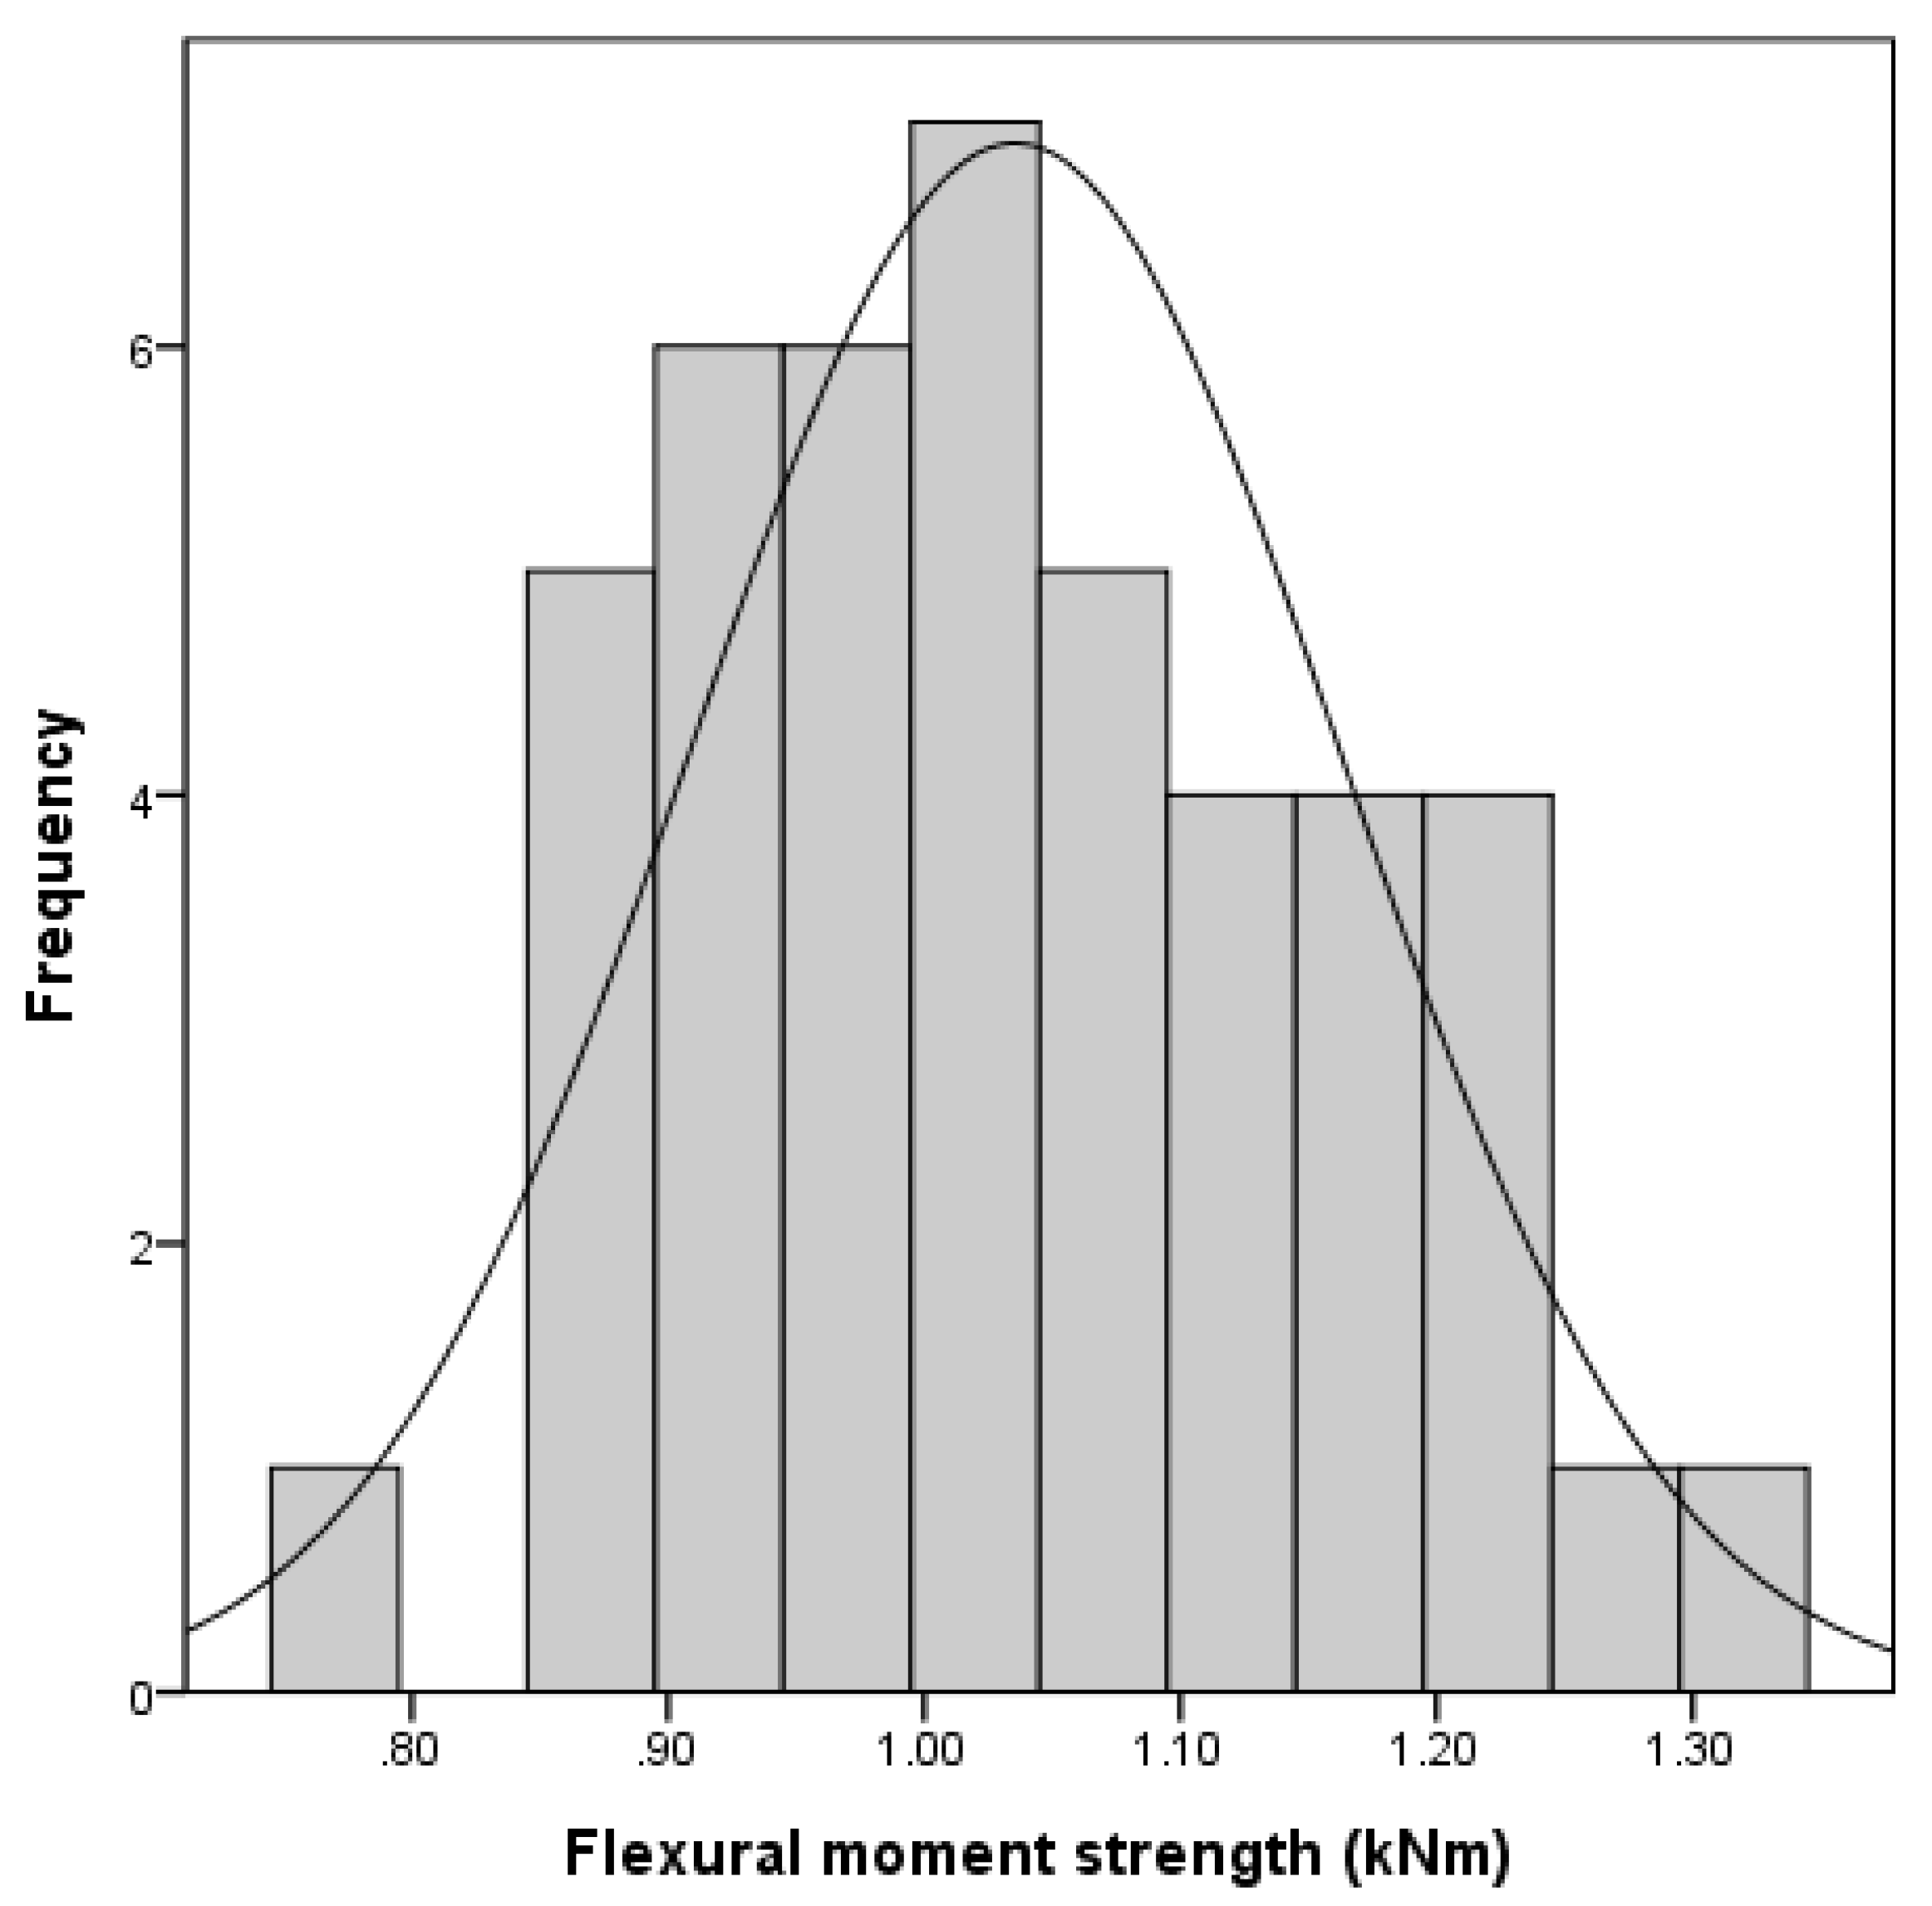
To probabilistically estimate the moment capacity of the wedge joints used on actual construction sites, statistical analyses were conducted using the maximum moment values of the new and reused specimens tested (Table 5). SPSS Ver. 24 (IBM) was used for the statistical analyses. Kolmogorov–Smirnov and Shapiro–Wilk normality tests were conducted for 44 experimental values, excluding the values for New-S-3 and Reused-7-6, which had measurement errors, to determine whether the measured maximum moment values were normally distributed. The significance probabilities obtained from the Kolmogorov–Smirnov and Shapiro–Wilk tests exceeded a significance level of 0.05. This indicates that the maximum moments obtained from the experiments were normally distributed. Figure 13 shows the estimated normality graph. The lower and upper limits of the 95% confidence interval of the maximum moment were 0.997 kNm and 1.074 kNm, respectively (Table 6).

4.3. Suggestion of Nonlinear Rotational Stiffness

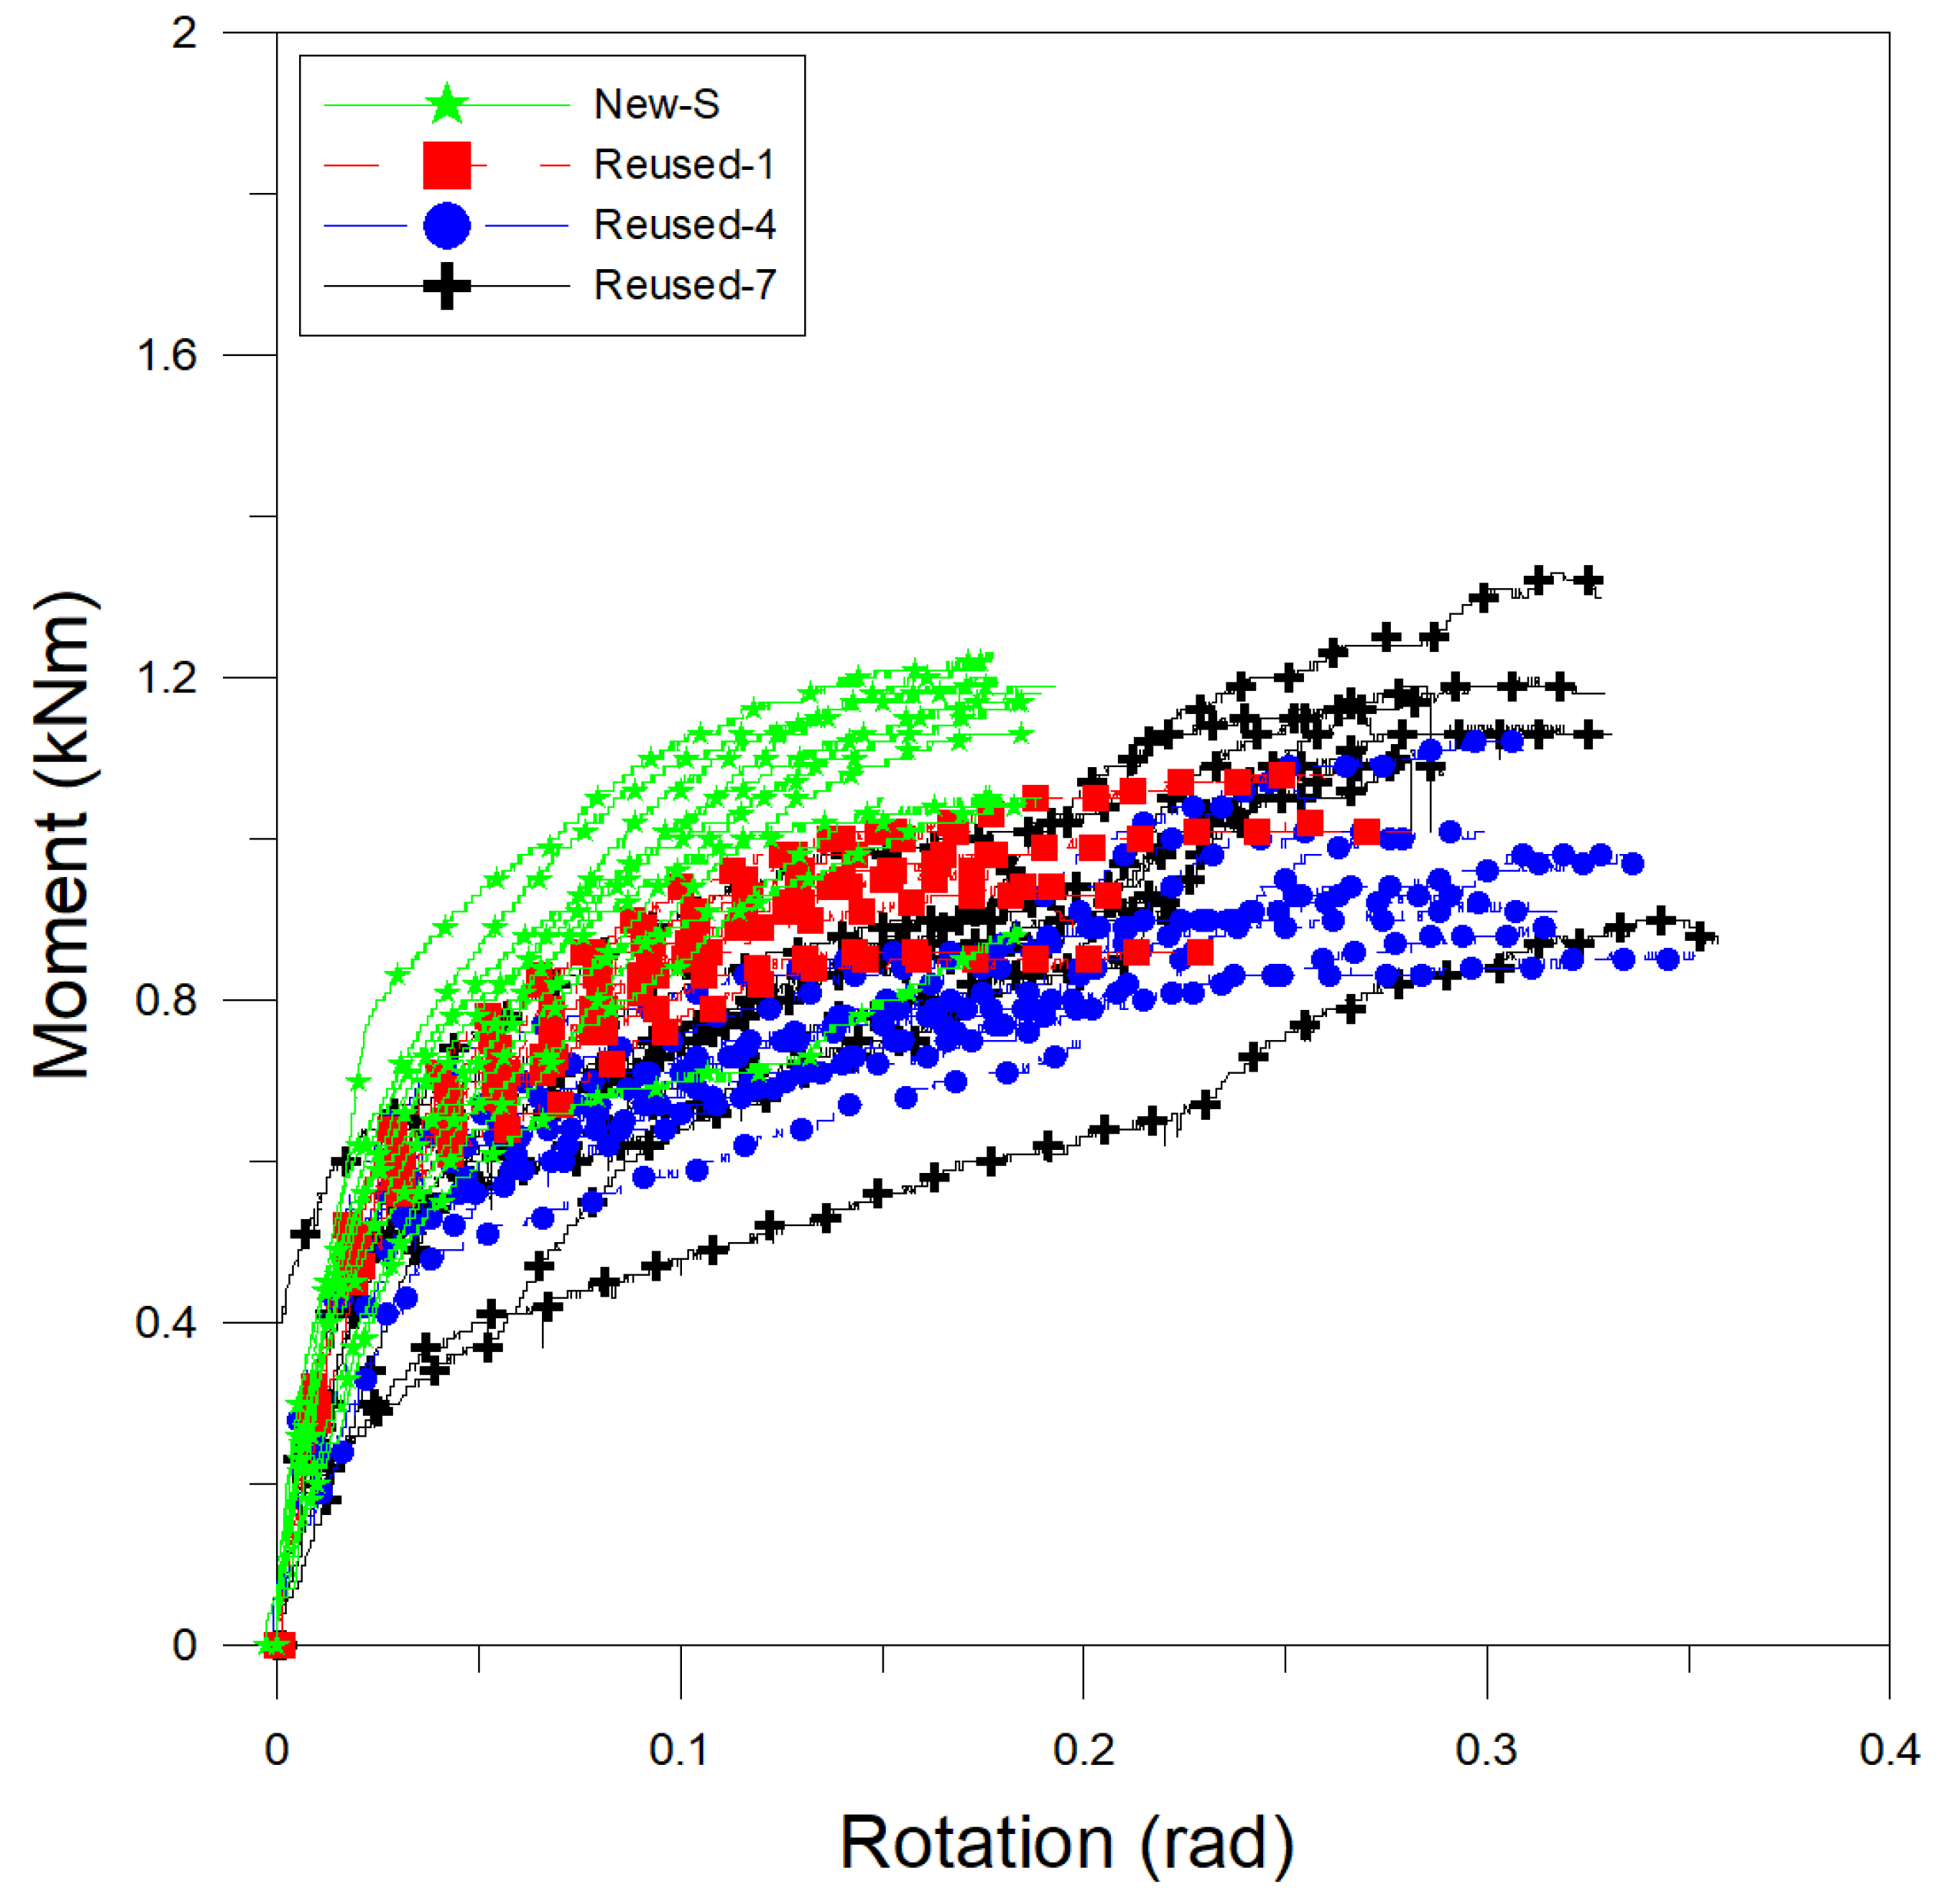
The rotation angle as a function of the load was calculated using the measured displacement and Equation (1). Figure 14 shows the moment–rotation curve of each specimen. As the slope of the moment–rotation curve represents the rotational stiffness, the Figure shows that the specimens with new members exhibited the highest initial rotational stiffness and that they generally exhibited higher moment–rotation curves than the reused specimens. As the reuse period increased, the moment–rotation curves were found to be lower. However, the moment–rotation curves of the specimens with a seven-year reuse period showed that these specimens exhibited higher stiffness than the specimens with a four-year reuse period. It is noted that the results of the specimens with seven-year reuse period shows considerable variability among the specimens.
It was assumed that the moment–rotation curves in Figure 14 could be described by a trilinear model (see Figure 4), and the stiffness values (K1, K2, and K3) and rotation angles (β1, β2, and β3) of the trilinear model were estimated by interval for each specimen, as summarized in Table 7. Each moment–rotation curve was simplified by the third interval where the first interval means the initial linear behavior and the second interval includes the moment increase immediately after yielding. For the third interval, the overall behavior after yielding was assumed as a linear by excluding the moment increase after yielding, even though the additional moment increment was shown in all specimens with a seven-year reuse period and some specimens with a four-year reuse period. In the case of Reused-4-5, however, the experimental data obtained until the LVDTs broke away from the horizontal member were only sufficient to evaluate the initial rotational stiffness. Therefore, only the initial rotational stiffness according the trilinear model was evaluated for this specimen.
For the wedge joints with new materials, the initial rotational stiffness (K1) ranged from 14.375 to 35.725 kNm/rad, the rotational stiffness of the second interval (K2) ranged from 5.501 to 8.206 kNm/rad, and the rotational stiffness of the third interval (K3) ranged from 1.302 to 3.885 kNm/rad. For the specimens with a one-year reuse period, K1 ranged from 18.443 to 27.71 kNm/rad, K2 ranged from 3.166 to 6.481 kNm/rad, and K3 ranged from 0.289 to 2.570 kNm/rad. For the specimens with a four-year reuse period, the ranges of K1, K2, and K3 were 12.783–27.618 kNm/rad, 3.093–6.509 kNm/rad, and 0.510–1.812 kNm/rad, respectively. For the specimens with a seven-year reuse period, the ranges of K1, K2, and K3 were 10.428–25.424 kNm/rad, 2.715–7.041 kNm/rad, and 0.821–2.150 kNm/rad, respectively.
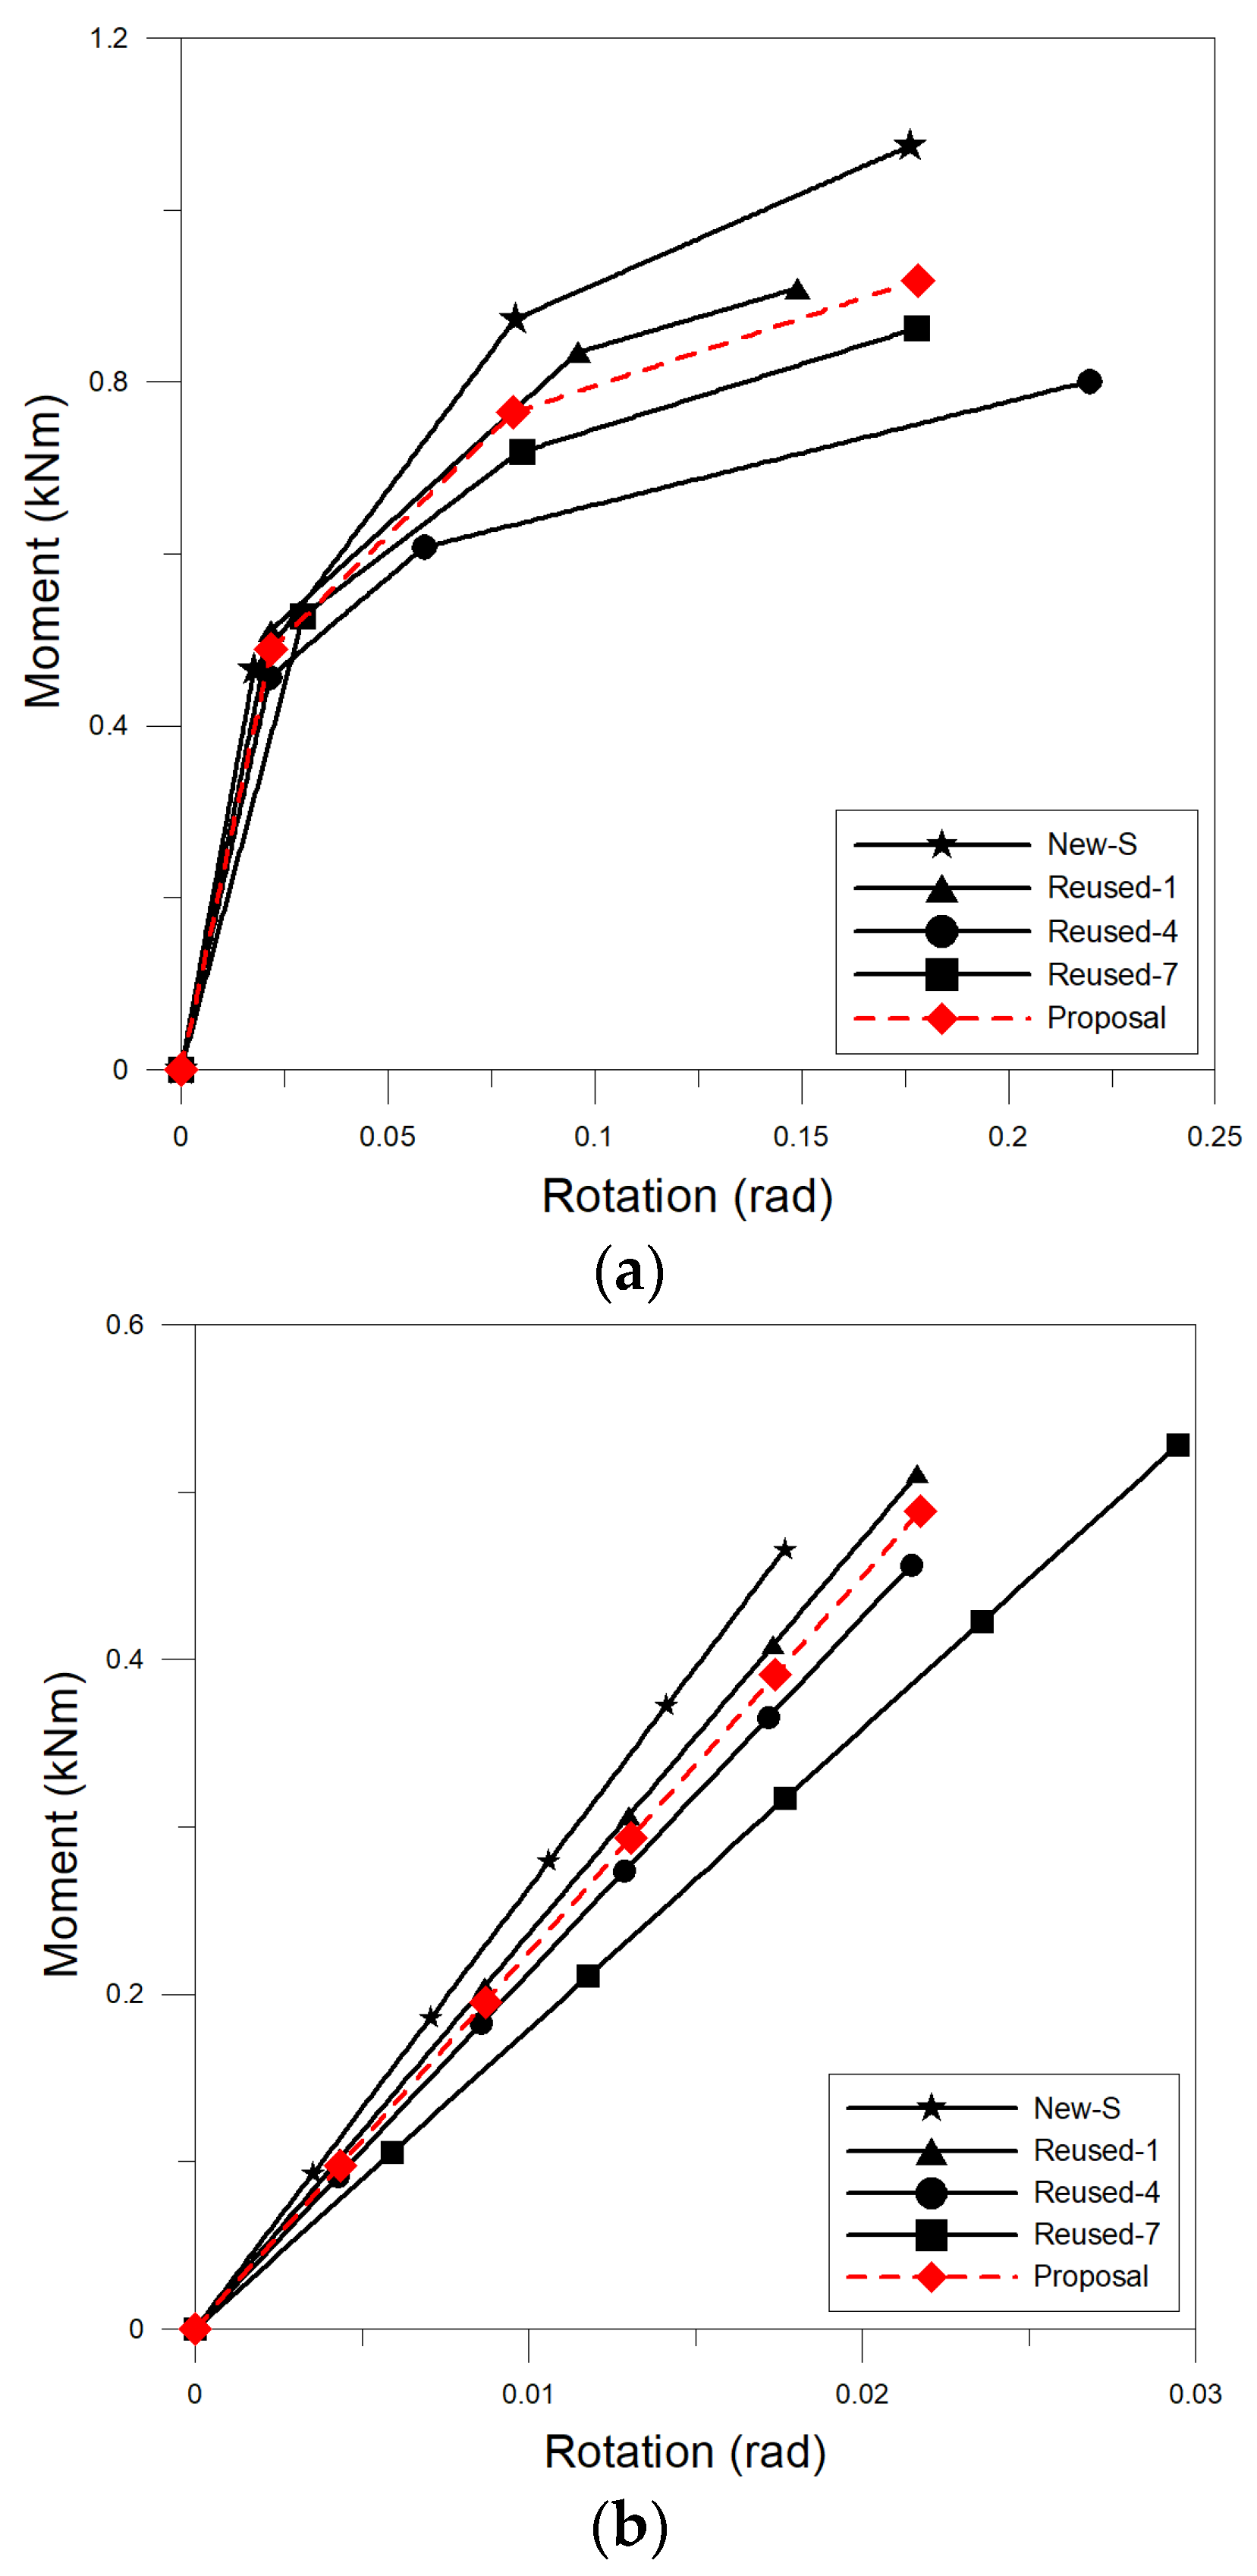
The average rotational stiffness values, standard deviations, coefficients of variation, and rotation angle limit values of the joints of the new and reused specimens are shown in Table 8, and the results are compared in Figure 15. When the average rotational stiffness values of the two models were analyzed by interval, it was observed that the stiffness changed significantly depending on the beta value, which is the basis of the stiffness change. Therefore, the rotational stiffness was calculated as the average for each specimen, whereas the rotation angle limit value was calculated as a weighted arithmetic mean, with the rotational stiffness used for weighting, as shown in Equation (2):
β = k n β n Σ k n
where β is the rotation angle limit value evaluated as a weighted arithmetic mean, Kn is the rotational stiffness of each specimen, and βn is the rotational stiffness limit value of each specimen.
According to Table 8, which lists the rotational stiffnesses in the trilinear model for the wedge joint stiffnesses by interval and by reuse period, the initial rotational stiffness of the new specimens was approximately 26.354 kNm/rad (rotation angle limit value: 0.018), but the initial rotational stiffness decreased to 23.594 kNm/rad (rotation angle limit value: 0.022), 21.263 kNm/rad (rotation angle limit value: 0.022), and 17.922 kNm/rad (rotation angle limit value: 0.022) as the reuse period increased to one, four, and seven years, respectively. In the second interval, the average rotational stiffness was the highest for the new specimens (6.453 kNm/rad), followed by the average rotational stiffnesses for the specimens with a one-year reuse period (4.350 kNm/rad), a four-year reuse period (4.060 kNm/rad), and a seven-year reuse period (3.643 kNm/rad). In the third interval, the average rotational stiffness was the highest for the new specimens (2.110 kNm/rad), followed by the average rotational stiffnesses for the specimens with a seven-year reuse period (1.506 kNm/rad), a one-year reuse period (1.402 kNm/rad), and a four-year reuse period (1.200 kNm/rad).
In the case of a trilinear model of the wedge joint based on combining and averaging the results for the new and reused specimens, the initial rotational stiffness was 22.475 kNm/rad (rotation angle limit value: 0.022 rad), the rotational stiffness of the second interval was 4.705 kNm/rad (rotation angle limit value: 0.080 rad), and the rotational stiffness of the third interval was 1.577 kNm/rad (rotation angle limit value: 0.178 rad).
The trilinear model of the new and reused specimens was compared with the trilinear model with the average values shown in Figure 15. It was found that the initial rotational stiffness of the wedge joint decreased as the reuse period increased. Compared to the initial rotational stiffness of the new specimens, the initial rotational stiffness was 89.5% for the specimens with a one-year reuse period, 80.7% for the specimens with a four-year reuse period, and 68% for the specimens with a seven-year reuse period. The trilinear model parameters calculated using the average values differed from those for the specimens with increasing reuse periods in the second and third intervals.
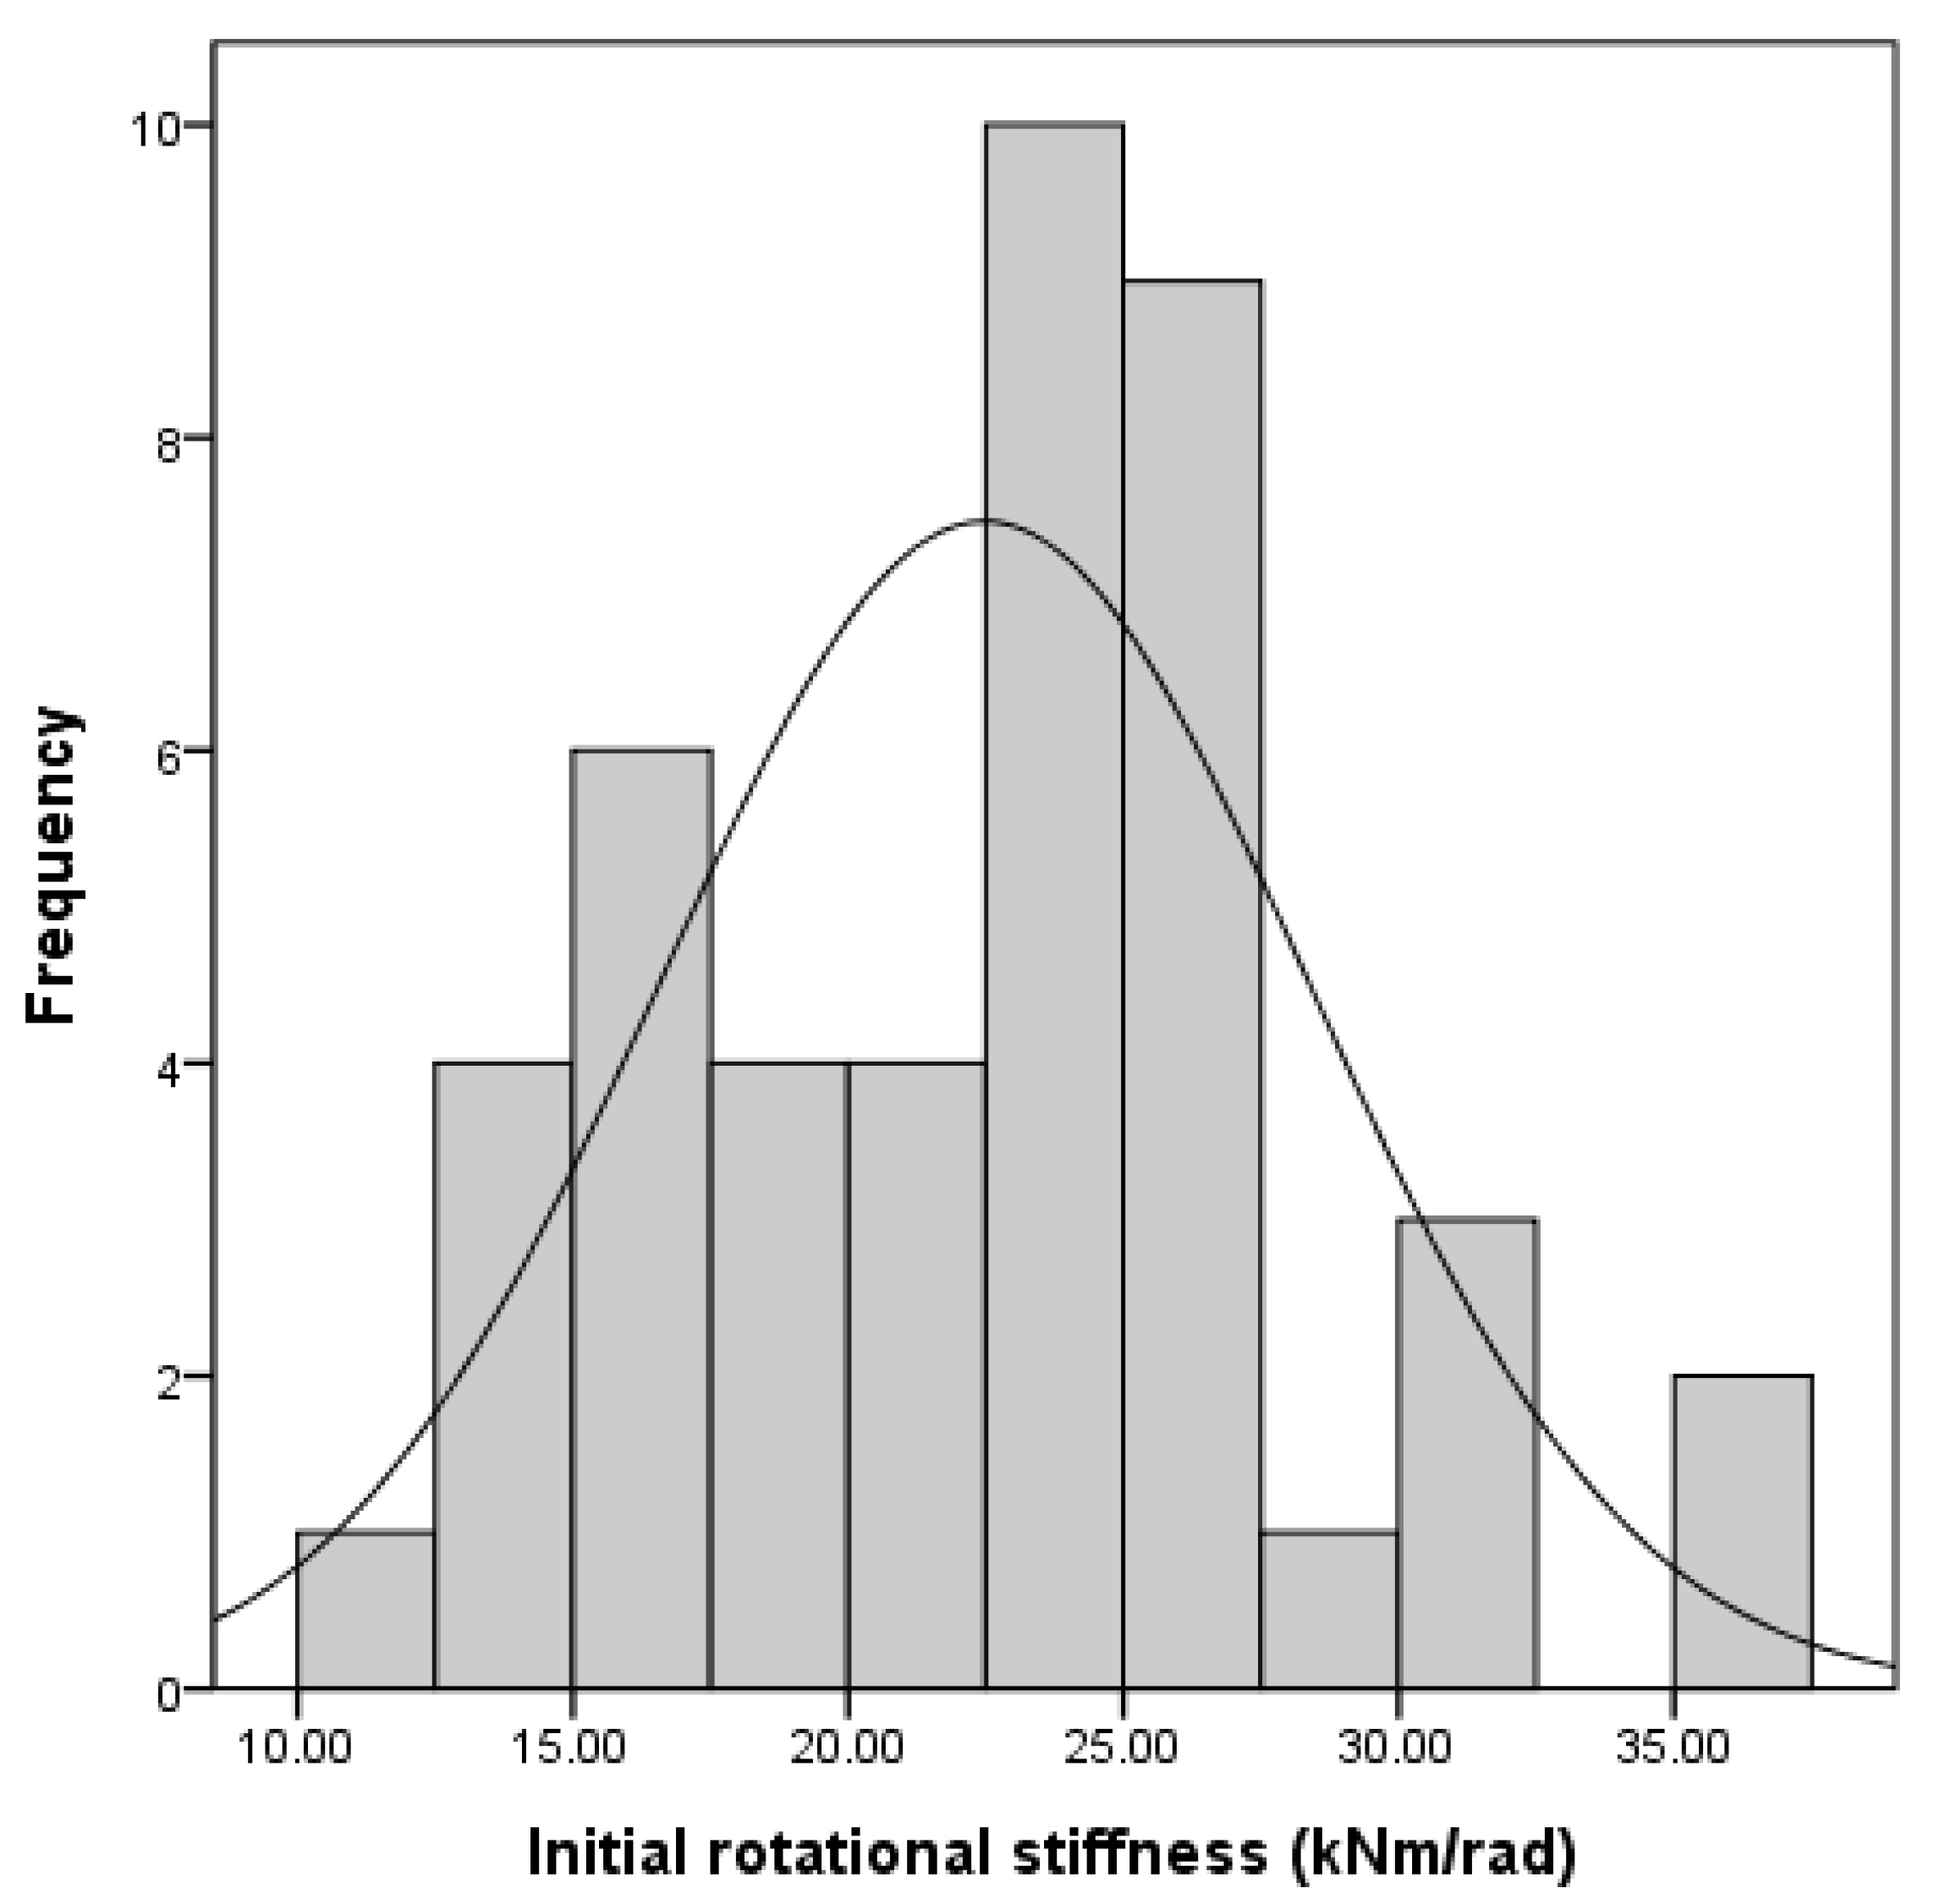
To estimate the initial rotational stiffness of the joints used on actual construction sites as a probabilistic value, a statistical analysis was conducted using the data for all the news and reused specimens, except for New-S-3 and Reused-7-6, which were excluded because of measurement errors. The data for 44 specimens were used. The normality of the initial rotational stiffness values was assessed using Kolmogorov–Smirnov and Shapiro–Wilk normality tests. As the significance probabilities obtained from the Kolmogorov–Smirnov and Shapiro–Wilk tests were higher than the significance level of 0.05, the initial rotational stiffness values were judged to be normally distributed (Table 9). Figure 16 shows the normality graph of the estimated initial rotational stiffness. The lower and upper limits of the 95% confidence interval of the initial rotational stiffness were 20.688 kNm/rad and 24.262 kNm/rad, respectively (Table 10).

5. Conclusions

The moment capacity and nonlinear rotational stiffness of wedge joints, which are the predominant type of joint used for the connection of the vertical and horizontal members of assembled support systems, were evaluated by examining the characteristics of new and reused members. Loading tests were conducted with new and reused specimens, and the behavior, moment capacity, and initial rotational stiffness of the joints were probabilistically analyzed by reuse period (new versus one, four, or seven years). The conclusions drawn from the results of this study are as follows.
The failure of joint system was mainly contributed by the strength of the vertical member since the end of the horizontal member contacted and gradually deformed the vertical member, leading to a failure. In addition, the specimens with little space in the grove where the joint ring passed showed the additional resistance occurred by the contact between the joint ring and grove surface at the horizontal member after joint yielding.
The average maximum moment of the specimens with new members was 1.16 times higher than that of the specimens with a one-year reuse period, 1.15 times higher than that of the specimens with a four-year reuse period, and 1.06 times higher than that of the specimens with a seven-year reuse period. The correlation between the increase in the reuse period and the average maximum moment of the joint was not clear due to the moment increment in all specimens with seven-year reuse period and some specimens with four-year reuse period, resulting from the little groove surface. However, it was clear that the variation in the moment–displacement curves of the specimens increased as the reuse period increased, indicating that an increase in the reuse period lowered the moment capacity and increased the quality variation. In particular, as the increase in variation of the joint resistance performance reflects an increase in the probability of member failure, it appears that the increasingly inconsistent performance of wedge joints with increasing reuse period is a potential cause of the collapse of support systems.
As a result of probabilistically estimating the moment capacity of wedge joints using the maximum moment values of the new and reused specimens tested, the maximum moments obtained from the experiments were confirmed to be normally distributed. The lower and upper limits of the 95% confidence interval of the maximum moment were 0.997 kNm and 1.074 kNm, respectively.
As a result of estimating the joint stiffness by assuming that the rotational stiffness of the joint could be described by a trilinear model, the average rotational stiffnesses (for both new and reused specimens) were found to be 22.475 kNm/rad (rotation angle limit value: 0.022 rad) for the first interval, 4.705 kNm/rad (rotation angle limit value: 0.080 rad) for the second interval, and 1.577 kNm/rad (rotation angle limit value: 0.178 rad) for the third interval. The specimens with a one-, four- and seven-year reuse periods exhibited initial rotational stiffnesses that were 89.5%, 80.7%, and 68% of the initial rotational stiffness of new specimens, respectively. A probabilistic analysis of the initial rotational stiffness for all of the specimens showed that, the lower and upper limits of the 95% confidence interval of the initial rotational stiffness were 20.688 kNm/rad and 24.262 kNm/rad, respectively.

Author Contributions

J.-H.W. designed experiments and analyzed results. J.K.B. and H.D.L. performed experimental tests. S.K. analyzed experimental results, and H.-S.M. and D.-K.Y. performed the statistical program. All authors have contributed in writing and proofreading the paper.

Funding

This research was funded by the National Research Foundation of Korea.

Acknowledgments

This study has been supported by the National Research Foundation of Korea (Grant No. 2016R1A2B4016327). In addition, this study has been partially supported by the Ministry of Education of the Republic of Korea and the National Research Foundation of Korea (NRF-2017S1A5B8059946).

Conflicts of Interest

The authors declare no conflict of interest.

References

  1. Holam, A.; Sawicki, M.; Szóstak, M. Occupational accidents involving construction scaffolding using Pareto-Lorenz snalysis. Appl. Sci. 2018, 8, 48. [Google Scholar]
  2. López Arquillos, A.; Rubio Romero, J.; Gibb, A. Analysis of construction accidents in Spain, 2003–2008. J. Saf. Res. 2012, 43, 381–388. [Google Scholar] [CrossRef] [PubMed]
  3. Penj, J.L.; Yen, T.; Kuo, C.C.; Chan, S.L. Analytical and experimental bearing capacities of system scaffolds. J. Zhejiang Univ. 2009, 10, 82–92. [Google Scholar] [CrossRef]
  4. Błazik-Borowa, E.; Szer, J.; Borowa, A.; Robak, A.; Pieńko, M. Modelling of load-displacement curves obtained from scaffold components tests. Bull. Pol. Acad. Sci. Tech. Sci. 2019, 67, 317–327. [Google Scholar]
  5. MOEL. Industrial Safety and Health Act; Ministry of Employment and Labor: Sejong City, Korea, 2016. (In Korean)
  6. Park, M.S.; Choi, B.J.; Han, M.H.; Lim, H.T.; Cho, T.G. A study on the improvements of assembling methods of system support for enhancing economic safety. J. Disaster Saf. 2017, 1, 9–18. (In Korean) [Google Scholar]
  7. Rosowsky, D.V.; Stewart, M.G. Probabilistic construction load model for multistory reinforced-concrete buildings. J. Perform. Constr. Fac. ASCE 2001, 15, 145–152. [Google Scholar] [CrossRef]
  8. Imai, K.; Frangopol, D.M. System reliability of suspension bridges. Struct Saf. 2002, 24, 219–259. [Google Scholar] [CrossRef]
  9. Sakurai, S.; Ellingwood, B.R.; Kushiyama, S. Probabilistic study of the behaviour of steel frames with partially restrained connections. Eng. Struct. 2001, 23, 1410–1417. [Google Scholar] [CrossRef]
  10. Li, J.J.; Li, G.Q. Reliability-based integrated design of steel portal frames with tapered members. Struct. Saf. 2004, 26, 221–239. [Google Scholar] [CrossRef]
  11. Zhang, H.; Chandrangsu, T.; Rasmussen, K.J.R. Probabilistic study of the strength of steel scaffold systems. Struct Saf. 2010, 32, 393–401. [Google Scholar] [CrossRef]
  12. Zhang, H.; Rasmussen, K.J.R.; Ellingwood, B.R. Reliability assessment of steel scaffold shoring structures for concrete formwork. Eng. Struct. 2012, 36, 81–89. [Google Scholar] [CrossRef]
  13. Chandrangsu, T.; Rasmussen, K.J.R. Investigation of geometric imperfections and joint stiffness of support scaffold systems. J. Constr. Steel Res. 2011, 67, 576–584. [Google Scholar] [CrossRef]
  14. Chandrangsu, T.; Rasmussen, K.J.R. Scaffold Cuplock Joint Tests; Research report No. R893; Centre for Advanced Structural Engineering, School of Civil Engineering, University of Sydney: Sydnay, Australia, 2008. [Google Scholar]
  15. Prabhakaran, U.; Beale, R.G.; Godley, M.H.R. Analysis of scaffolds with connections containing looseness. Comput. Struct. 2011, 89, 1944–1955. [Google Scholar] [CrossRef] [Green Version]
  16. Davison, J.B.; Kirby, P.A.; Nethercot, D.A. Rotational stiffness characteristics of steel beam-to-column connections. J. Constr. Steel Res. 1987, 8, 17–54. [Google Scholar] [CrossRef]
  17. France, J.E.; Davison, J.B.; Kirby, P.A. Moment-capacity and rotational stiffness of endplate connections to concrete-filled tubular columns with flowdrilled connectors. J. Constr. Steel Res. 1999, 50, 35–48. [Google Scholar] [CrossRef]
  18. Chan, S.L.; Kitipornchai, S. Geometric nonlinear analysis of asymmetric thin-walled beam-columns. Eng. Struct. 1987, 9, 243–254. [Google Scholar] [CrossRef]
  19. Yuan, X.X.; Wu, W.X.; Yu, F.Y. Investigation of joint rotational stiffness and initial geometric imperfections of fastener-style tubular steel formwork-support. In Advances in Engineering Research (AER), Proceedings of the 2nd International Conference on Civil, Transportation and Environmental Engineering (ICCTE 2017), Shenzhen, China, 10–11 May 2017; Atlantis Press: Paris, France, 2017; pp. 278–282. [Google Scholar]
  20. Zhang, W.H.; Liu, Z.M.; Zhu, G.W. A semi-rigid node calculation method for steel tubular scaffold with complete based on back-analysis of scaffold load-bearing experiments results. J. Shandong Jianzhu Univ. 2009, 1, 010. [Google Scholar]
  21. Peng, J.L.; Wu, C.W.; Chan, S.L.; Huang, C.H. Experimental and numerical studies of practical system scaffolds. J. Constr. Steel Res. 2013, 91, 64–75. [Google Scholar] [CrossRef]
  22. Zhu, Q.X.; Wan, Y.C.; Zhang, Q.L. Rotational stiffness test and calculation model of steel scaffolds’ coupler connections. J. Shandong Jianzhu Univ. 2010, 5, 007. [Google Scholar]
  23. Lin, C.; He, L.; Wu, Z.; Yuan, J. Experimental study on joint stiffness with vision-based system and geometric imperfections of temporary member structure. J. Civ. Eng. Manag. 2018, 24, 43–52. [Google Scholar] [Green Version]
  24. Pieńko, M.; Błazik-Borowa, E. Verification of the numerical model of insert-type joint of scaffolding in relation to experimental research. In Proceedings of the AIP Conference Proceedings, Computer Methods in Mechanics (CMM2017), Lublin, Poland, 13–16 September 2017; AIP: College Park, MD, USA, 2018; Volume 1922, pp. 1–6. [Google Scholar]
  25. Kim, G.Y.; Won, J.H.; Kim, S.H. Structural behavior analysis of system supports according to boundary condition of joints between vertical and horizontal members. J. Korean Soc. Saf. 2017, 32, 60–65. (In Korean) [Google Scholar]
  26. Won, J.H.; Lee, H.D.; Choi, M.K.; Park, M.C. Flexural strength and rotational stiffness estimation of joint between vertical and horizontal members in system support. J. Korean Soc. Saf. 2018, 33, 46–53. (In Korean) [Google Scholar]
  27. Fink, J.; Rubin, D.; Hollmann, K. Anwendung des Innsbrucker komponentenmodells bei der optimierung eines modernen deckenschaltischs. Stahlbau 2003, 72, 1–9. [Google Scholar] [CrossRef]
Figure 1. Estimated direction of joint rotational stiffness.
Applsci 09 04056 g001
Figure 2. Test configuration and gauge locations.
Applsci 09 04056 g002
Figure 3. Test set-up and joint configuration: (a) Test set-up; (b) wedge joint in new specimens, one-year used specimens, and some four-year used specimens; (c) wedge joint in seven-year used specimens and some four-year used specimens.
Applsci 09 04056 g003
Figure 4. Trilinear moment–rotation model.
Applsci 09 04056 g004
Figure 5. Failure configuration: (a) System with new products (New-S-9); (b) system with members used for one year (Reused-1-11); (c) system with members used for four years (Reused-4-11); (d) system with members used for seven years (Reused-7-2).
Applsci 09 04056 g005
Figure 6. Detailed failure configuration at joint: (a) System with new products (New-S-9); (b) system with members used for one year (Reused-1-11); (c) system with members used for four years (Reused-4-11); (d) system with members used for seven years (Reused-7-2).
Applsci 09 04056 g006
Figure 7. Pin failure caused in Reused-7-2 specimen.
Applsci 09 04056 g007
Figure 8. Strain curves of joint ring and horizontal member: (a) New-S-9 (new product); (b) reused-1-7 (one year of use); (c) reused-4-5 (four years of use); (d) reused-7-10 (seven years of use).
Applsci 09 04056 g008
Figure 9. Moment–displacement curve (LVDT1): (a) New product; (b) reused system (one year of use); (c) reused system (four years of use); (d) reused system (seven years of use).
Applsci 09 04056 g009
Figure 10. Moment–displacement curve (LVDT2): (a) New product; (b) reused system (one year of use); (c) reused system (four years of use); (d) reused system (seven years of use).
Applsci 09 04056 g010aApplsci 09 04056 g010b
Figure 11. Moment–displacement curve (LVDT3): (a) New product; (b) reused system (one year of use); (c) reused system (four years of use); (d) reused system (seven years of use).
Applsci 09 04056 g011
Figure 12. Moment–displacement curve (LVDT4): (a) New product; (b) reused system (one year of use); (c) reused system (four years of use); (d) reused system (seven years of use).
Applsci 09 04056 g012
Figure 13. Frequency distribution and normal curve of maximum moment data.
Applsci 09 04056 g013
Figure 14. Moment–rotation curves of all specimens.
Applsci 09 04056 g014
Figure 15. Calculated moment–rotation model according to years of reuse: (a) Trilinear moment–rotation model; (b) initial interval of trilinear model.
Applsci 09 04056 g015
Figure 16. Frequency distribution and normal distribution curve of initial rotational stiffness data.
Applsci 09 04056 g016
Table 1. Results of previous studies of joint stiffness.
ClassificationJoint TypeInitial Rotational Stiffness (kNm/rad)
Yuan et al. [19]Clamp19.95
Zhang et al. [20]Clamp25.00
Parabhakaran et al. [15]Clamp10.65
Chandrangsu and Rasmussen [13]Cuplock108.54 (four horizontal members connected)
88.99 (three horizontal members connected)
83.07 (two horizontal members connected)
Peng et al. [21]Wedge34.34
Pieńko and Błazik-Borowa [24]Wedge38.92
Won et al. [26]Wedge71.892 (welded)
26.315 (pin)
Table 2. Classification of test specimens.
SpecimenReused YearsSpecimenReused Years
New-S-1NewReused-4-14 years
New-S-2Reused-4-2
New-S-3Reused-4-3
New-S-4Reused-4-4
New-S-5Reused-4-5
New-S-6Reused-4-6
New-S-7Reused-4-7
New-S-8Reused-4-8
New-S-9Reused-4-9
New-S-10Reused-4-10
New-S-11Reused-4-11
New-S-12
New-S-13
Reused-1-11 yearReused-7-17 years
Reused-1-2Reused-7-2
Reused-1-3Reused-7-3
Reused-1-4Reused-7-4
Reused-1-5Reused-7-5
Reused-1-6Reused-7-6
Reused-1-7Reused-7-7
Reused-1-8Reused-7-8
Reused-1-9Reused-7-9
Reused-1-10Reused-7-10
Reused-1-11Reused-7-11
Table 3. Material properties.
ClassificationVertical MemberHorizontal Member
Steel gradeSGH 490STK 400
Yield strength (MPa)365235
Length (mm)4321468
Diameter (mm) × Thickness (mm)60.5 × 2.642.7 × 2.2
Table 4. Maximum moments of specimens.
SpecimenMaximum Moment (kNm)SpecimenMaximum Moment (kNm)
New-S-11.05Reused-4-10.97
New-S-21.17Reused-4-20.94
New-S-3Not measuredReused-4-30.86
New-S-41.02Reused-4-41.01
New-S-51.05Reused-4-50.98
New-S-61.20Reused-4-60.89
New-S-71.13Reused-4-70.98
New-S-81.22Reused-4-81.01
New-S-91.17Reused-4-91.12
New-S-100.88Reused-4-101.07
New-S-111.13Reused-4-110.92
New-S-121.26Average0.98
New-S-131.23
Average1.13
Reused-1-10.86Reused-7-10.90
Reused-1-20.86Reused-7-21.01
Reused-1-30.93Reused-7-31.08
Reused-1-41.01Reused-7-40.77
Reused-1-50.96Reused-7-50.90
Reused-1-60.98Reused-7-6Not measured
Reused-1-71.01Reused-7-71.20
Reused-1-81.01Reused-7-81.14
Reused-1-90.98Reused-7-91.19
Reused-1-100.94Reused-7-101.16
Reused-1-111.08Reused-7-111.33
Average0.97Average1.07
Table 5. Tests of normality of maximum moment.
Kolmogorov–SmirnovShapiro–Wilk
StatisticdfSig.StatisticdfSig.
Maximum moment 0.125440.0830.978440.560
Table 6. Probabilistic bending capacity of wedge joint.
Mean1.036 kNm
95% confidence interval for meanUpper bound1.074 kNm
Lower bound0.997 kNm
Table 7. K and β values in trilinear model for all specimens.
ClassificationK Value (kNm/rad)β Value (rad)
K1K2K3β1β2β3
New-S-114.3755.5013.8850.0390.0570.15
New-S-225.9555.5231.3020.020.1080.178
New-S-3Not measured
New-S-432.0926.8452.1140.0130.0640.154
New-S-526.8167.8201.9860.0130.0620.189
New-S-631.8177.0261.6530.0180.0790.178
New-S-730.4818.2062.3250.0140.0690.189
New-S-835.7254.7301.5940.0210.0810.177
New-S-924.3787.1952.3760.0170.0710.184
New-S-1015.6666.8051.9010.0220.0520.185
New-S-1118.1345.7151.6740.0240.1250.186
New-S-1235.2366.2612.4910.0110.1030.177
New-S-1325.5765.8132.0150.0160.1210.193
Reuesd-1-124.4673.1660.2890.0220.1140.202
Reuesd-1-222.5016.3402.4720.0180.0530.124
Reuesd-1-319.8753.8290.9470.0240.1130.180
Reuesd-1-425.4683.3981.1480.020.1270.190
Reuesd-1-524.7134.1660.9590.0200.1100.173
Reuesd-1-618.4433.8601.3530.0270.1180.175
Reuesd-1-724.0073.7161.4180.0230.1230.170
Reuesd-1-824.7595.9532.5700.0200.0800.123
Reuesd-1-923.1323.2660.710.0230.1080.174
Reuesd-1-1027.0716.4812.4260.0200.0580.101
Reuesd-1-1125.0983.6741.1310.0230.1250.190
Reused-4-125.7883.0930.7440.0230.0720.317
Reused-4-212.7833.4641.4240.0300.1120.261
Reused-4-315.9603.2380.5100.0280.0940.353
Reused-4-422.0963.2471.3940.0200.0450.200
Reused-4-513.498--0.027--
Reused-4-624.2343.9691.1040.0200.050.293
Reused-4-723.7553.0150.9040.0210.0890.287
Reused-4-827.6184.2301.8120.0140.0350.158
Reused-4-920.7616.5091.3210.0250.0380.15
Reused-4-1021.2013.7961.6160.0240.0520.191
Reused-4-1126.2036.0391.1700.0150.0440.166
Reused-7-119.0162.7150.8210.0250.1400.210
Reused-7-216.8973.9501.6780.1000.040.157
Reused-7-325.4242.8721.3910.0150.1010.197
Reused-7-415.7095.0301.4740.0100.1080.160
Reused-7-510.4283.6361.5390.0230.0570.238
Reused-7-6Not measured
Reused-7-716.6522.7502.1500.0250.0510.160
Reused-7-822.8577.0412.0650.0200.0430.158
Reused-7-914.2373.4451.6020.0280.1200.199
Reused-7-1020.6332.2161.5170.0180.1010.151
Reused-7-1117.3682.7720.8270.0400.1230.180
Table 8. Suggested rotational stiffness parameter values in trilinear model for wedge joints.
ClassificationStatisticsK Value (kNm/rad)β Value (rad)
K1K2K3β1β2β3
New-SAverage26.3546.4532.1100.0180.0810.176
Std. D7.2411.0370.661---
CV0.2750.1610.313---
Reused-1Average23.5944.3501.4020.0220.0960.149
Std. D2.5141.2630.763---
CV0.1070.2900.544---
Reused-4Average21.2634.0601.2000.0210.0590.220
Std. D5.1141.2360.399---
CV0.2410.3040.332---
Reused-7Average17.9223.6431.5060.0290.0820.178
Std. D4.3051.4400.436---
CV0.2400.3950.290---
ProposalAverage22.4754.7051.5770.0220.0800.178
Std. D5.8791.6450.672---
CV0.2620.3500.426---
Table 9. Tests of normality of initial rotational stiffness.
Kolmogorov–SmirnovShapiro–Wilk
StatisticdfSig.StatisticdfSig.
Initial rotational stiffness 0.086440.2000.976440.488
Table 10. Probabilistic initial rotational stiffness of wedge joint.
Mean Value22.475 kNm/rad
95% Confidence Interval for MeanUpper bound24.262 kNm/rad
Lower bound20.688 kNm/rad