Article

Physiological Driver Monitoring Using Capacitively Coupled and Radar Sensors

1
KU Leuven, Department of Electrical Engineering - ESAT, 3001 Leuven, Belgium
2
imec Belgium, 3001 Leuven, Belgium
3
imec The Netherlands/Holst Centre, 5656 AE Eindhoven, The Netherlands
*
Author to whom correspondence should be addressed.
Appl. Sci. 2019, 9(19), 3994; https://doi.org/10.3390/app9193994
Submission received: 30 August 2019 / Revised: 13 September 2019 / Accepted: 18 September 2019 / Published: 24 September 2019
(This article belongs to the Special Issue Contactless Vital Signs Monitoring)

Abstract

:

Featured Application

Physiological parameters of drivers, including the electrocardiogram (ECG), heart rate and heart rate variability, respiration activity and rate, can be measured in a contactless way using capacitively coupled and radar sensors. This potentially enables applications to monitor the driver’s physical and emotional status and well-being and contribute to preventing accidents and provide health-related services.

Abstract

Unobtrusive monitoring of drivers’ physiological parameters is a topic gaining interest, potentially allowing to improve the performance of safety systems to prevent accidents, as well as to improve the driver’s experience or provide health-related services. In this article, two unobtrusive sensing techniques are evaluated: capacitively coupled sensing of the electrocardiogram and respiration, and radar-based sensing of heartbeat and respiration. A challenge for use of these techniques in vehicles are the vibrations and other disturbances that occur in vehicles to which they are inherently more sensitive than contact-based sensors. In this work, optimized sensor architectures and signal processing techniques are proposed that significantly improve the robustness to artefacts. Experimental results, conducted under real driving conditions on public roads, demonstrate the feasibility of the proposed approach. R peak sensitivities and positive predictivities higher than 98% both in highway and city traffic, heart rate mean absolute error of 1.02 bpm resp. 2.06 bpm in highway and city traffic and individual beat R-R interval 95% percentile error within ±27.3 ms are demonstrated. The radar experimental results show that respiration can be measured while driving and heartbeat can be recovered from vibration noise using an accelerometer-based motion reduction algorithm.

1. Introduction

The monitoring of physiological parameters of drivers is becoming an important topic that is attracting the attention of many researchers and companies worldwide. By monitoring cardiac and respiratory parameters (e.g., heart rate, heart rate variability, ECG waveform, respiration rate) it is possible to gain insight in the physical and emotional state of the drivers, such as for example drowsiness [1], stress [2], emotional state [3], epileptic seizures [4], cardiovascular conditions such as ischemic stroke [5], myocardial infarction [6], heart failure [7], etc.
When such physiological sensors are combined with complementary non-physiological sensing systems inside a vehicle (e.g., steering wheel and pedal sensors, speed, lane-keeping, collision avoidance, etc.) it potentially allows to improve the performance of safety systems to prevent accidents, as well as to improve the driver’s experience and well-being or provide new services such as for example daily health check-ups during commuting.
For such a system to be successfully adopted and used it is essential that the sensors are unobtrusive, i.e., the driver should not have to take any action to connect any sensors to their body. Two sensing techniques that meet this requirement are capacitive-based sensors, which can measure physiological signals through clothing, and radar-based sensors, which can measure remotely. As will be shown below, these sensors have complementary characteristics. They do not rely on a driver-facing camera, avoiding what may be considered a potential privacy concern for some users.
The main challenge for the use of such unobtrusive sensors in vehicles is that the weak physiological signals need to be accurately detected while being reliably distinguished from motion artefacts due to unavoidable vibrations of the car while driving as well as the driver’s body motions.
The capacitive-based sensing system considered in this work can measure capacitively coupled ECG (ccECG) and capacitively coupled bioimpedance (ccBioZ). The ccECG measures the electrical signals generated by the heart (ECG) coupled capacitively through clothing to a conducting sensor plate. The ccBioZ is measured by capacitively (through the clothing) injecting a small a.c. current into the body from two conducting plates and measuring the corresponding voltage signal (also capacitively) through the clothing using two conducting sensor plates. The bio-impedance obtained in this way measures the respiration using the principle of impedance pneumography [8]. The ccECG can be measured through multiple layers of clothing [9] but not through e.g., thick jackets. The ccBioZ can be measured through very thick clothing layers or even small air gaps due to its 4-point measurement principle and due to the high frequency of the injected signal.
Radar-based sensing allows to measure the vital signs heartbeat and respiration through remote measurement (up to several meters) of small mechanical motions of the body surface. Remote radar-based vital signs sensing has been intensively investigated in the last two decades. The attention has been focused mainly on contactless vital signs monitoring in indoor environments [10,11,12,13,14,15,16,17,18]. Considerable research on multi-people vital signs sensing and tracking has been performed by imec [19,20,21,22,23,24], which also presented recently a Frequency-Modulated Continuous Wave (FMCW) integrated chip (IC) radar capable of detecting the vital signs up to a distance of 15 m while achieving a low-power consumption record of only 680 µW [24]. Radar has also been used for driver monitoring. In [25], the radar was placed inside the seat and the back of subject was directly in contact with the antennas. The conclusions of this work were that static measurements showed outstanding accuracy in detecting the vital signs while during the dynamic tests (i.e., while driving) the results were not robust enough to be used as input for medical or emergency prevention systems. In this work, a radar sensor, which integrates an accelerometer to measure the vibrations, was placed behind the driver’s seat.
These two sensor techniques are complementary: capacitive-based sensors can provide a complete ECG waveform which permits the most accurate determination of heart rate variability (HRV), but they only work through a number of clothing layers. On the other hand, radar-based sensors provide true remote sensing, but can only provide heartbeat information, not a complete ECG. Both techniques can provide respiration information. Hence, there is potential for sensor fusion combining these two techniques to improve overall performance under varying conditions. Initial work on sensor fusion of capacitively-coupled ECG and radar in an indoor environment was published by the Authors in [26].
In this work, both techniques are evaluated in real-world driving tests. In addition, signal processing techniques are presented that improve the robustness of these unobtrusive sensors to motion artefacts. For the ccECG, signal quality indicator (SQI) based motion artefact removal algorithms are implemented for this purpose. For the radar signals, a signal processing technique which correlates the radar signal to the accelerometer signal in order to remove the contribution of the vibrations from the vital signs information is presented.
This paper is organized as follows. In Section 2, the capacitively-coupled and radar systems and their physical positioning in the car are detailed together with the signal processing techniques. The experimental results are shown in Section 3, while the discussion and the conclusions are drawn in Section 4.

2. Materials and Methods

2.1. Capacitively-Coupled ECG and Bio-Impedance System and Positioning in the Car Seat

The capacitive sensor system that was evaluated is shown in Figure 1 and is described in detail in [27]. For this evaluation, the system was implemented on a seat-covering pillow for easy transfer between vehicles, but it can also be integrated directly into a car seat in case of a permanent installation. It consists of an array of ccECG sensing plates, implemented in this case using 15 rigid sensing plates in the back side, and 2 conductive textile sensing plates at the legs. This array configuration permits to pick up ECG signals for different driver body sizes, shapes and seating positions. Also 4 ccBioZ plates (2 for current injection and 2 for voltage sensing) are included in the back side, together with one unused plate in the center. In the bottom side a larger conductive textile plate is used for capacitive Driven Right Leg (DRL) feedback to reduce common mode interference.

2.2. Signal Processing on Capacitively-Coupled Signals

Figure 2a shows the signal processing steps performed on the capacitively coupled ECG. Besides standard processing steps such as bandpass filtering, alignment, beat detection etc., the lower branch indicates the specific additional quality-based steps for motion artefact handling applied in this work:
  • A method to discard from the set of 4 ECG channels the channels with no potential valuable information. This uses a classifier described in more detail in [28];
  • The identification of artefacts using a template-based signal quality metric previously evaluated by the authors [29], in combination with an amplitude-based metric calculated as the percentage of 0.5-s sub-windows that have data within [0.05–3] mV range;
  • The selection of the channel. This selection uses the same signal quality metric as in step 2;
  • The extraction of features from the signal parts with useful information. The parts of the signal that have been identified as containing artefacts in step 2 are omitted from the feature calculation.
Figure 2b shows the signal processing path for the capacitively coupled bioimpedance signal towards respiration metrics. No motion artefact algorithms have been included for respiration at this point.

2.3. Radar Sensor System and Positioning in the Car Seat

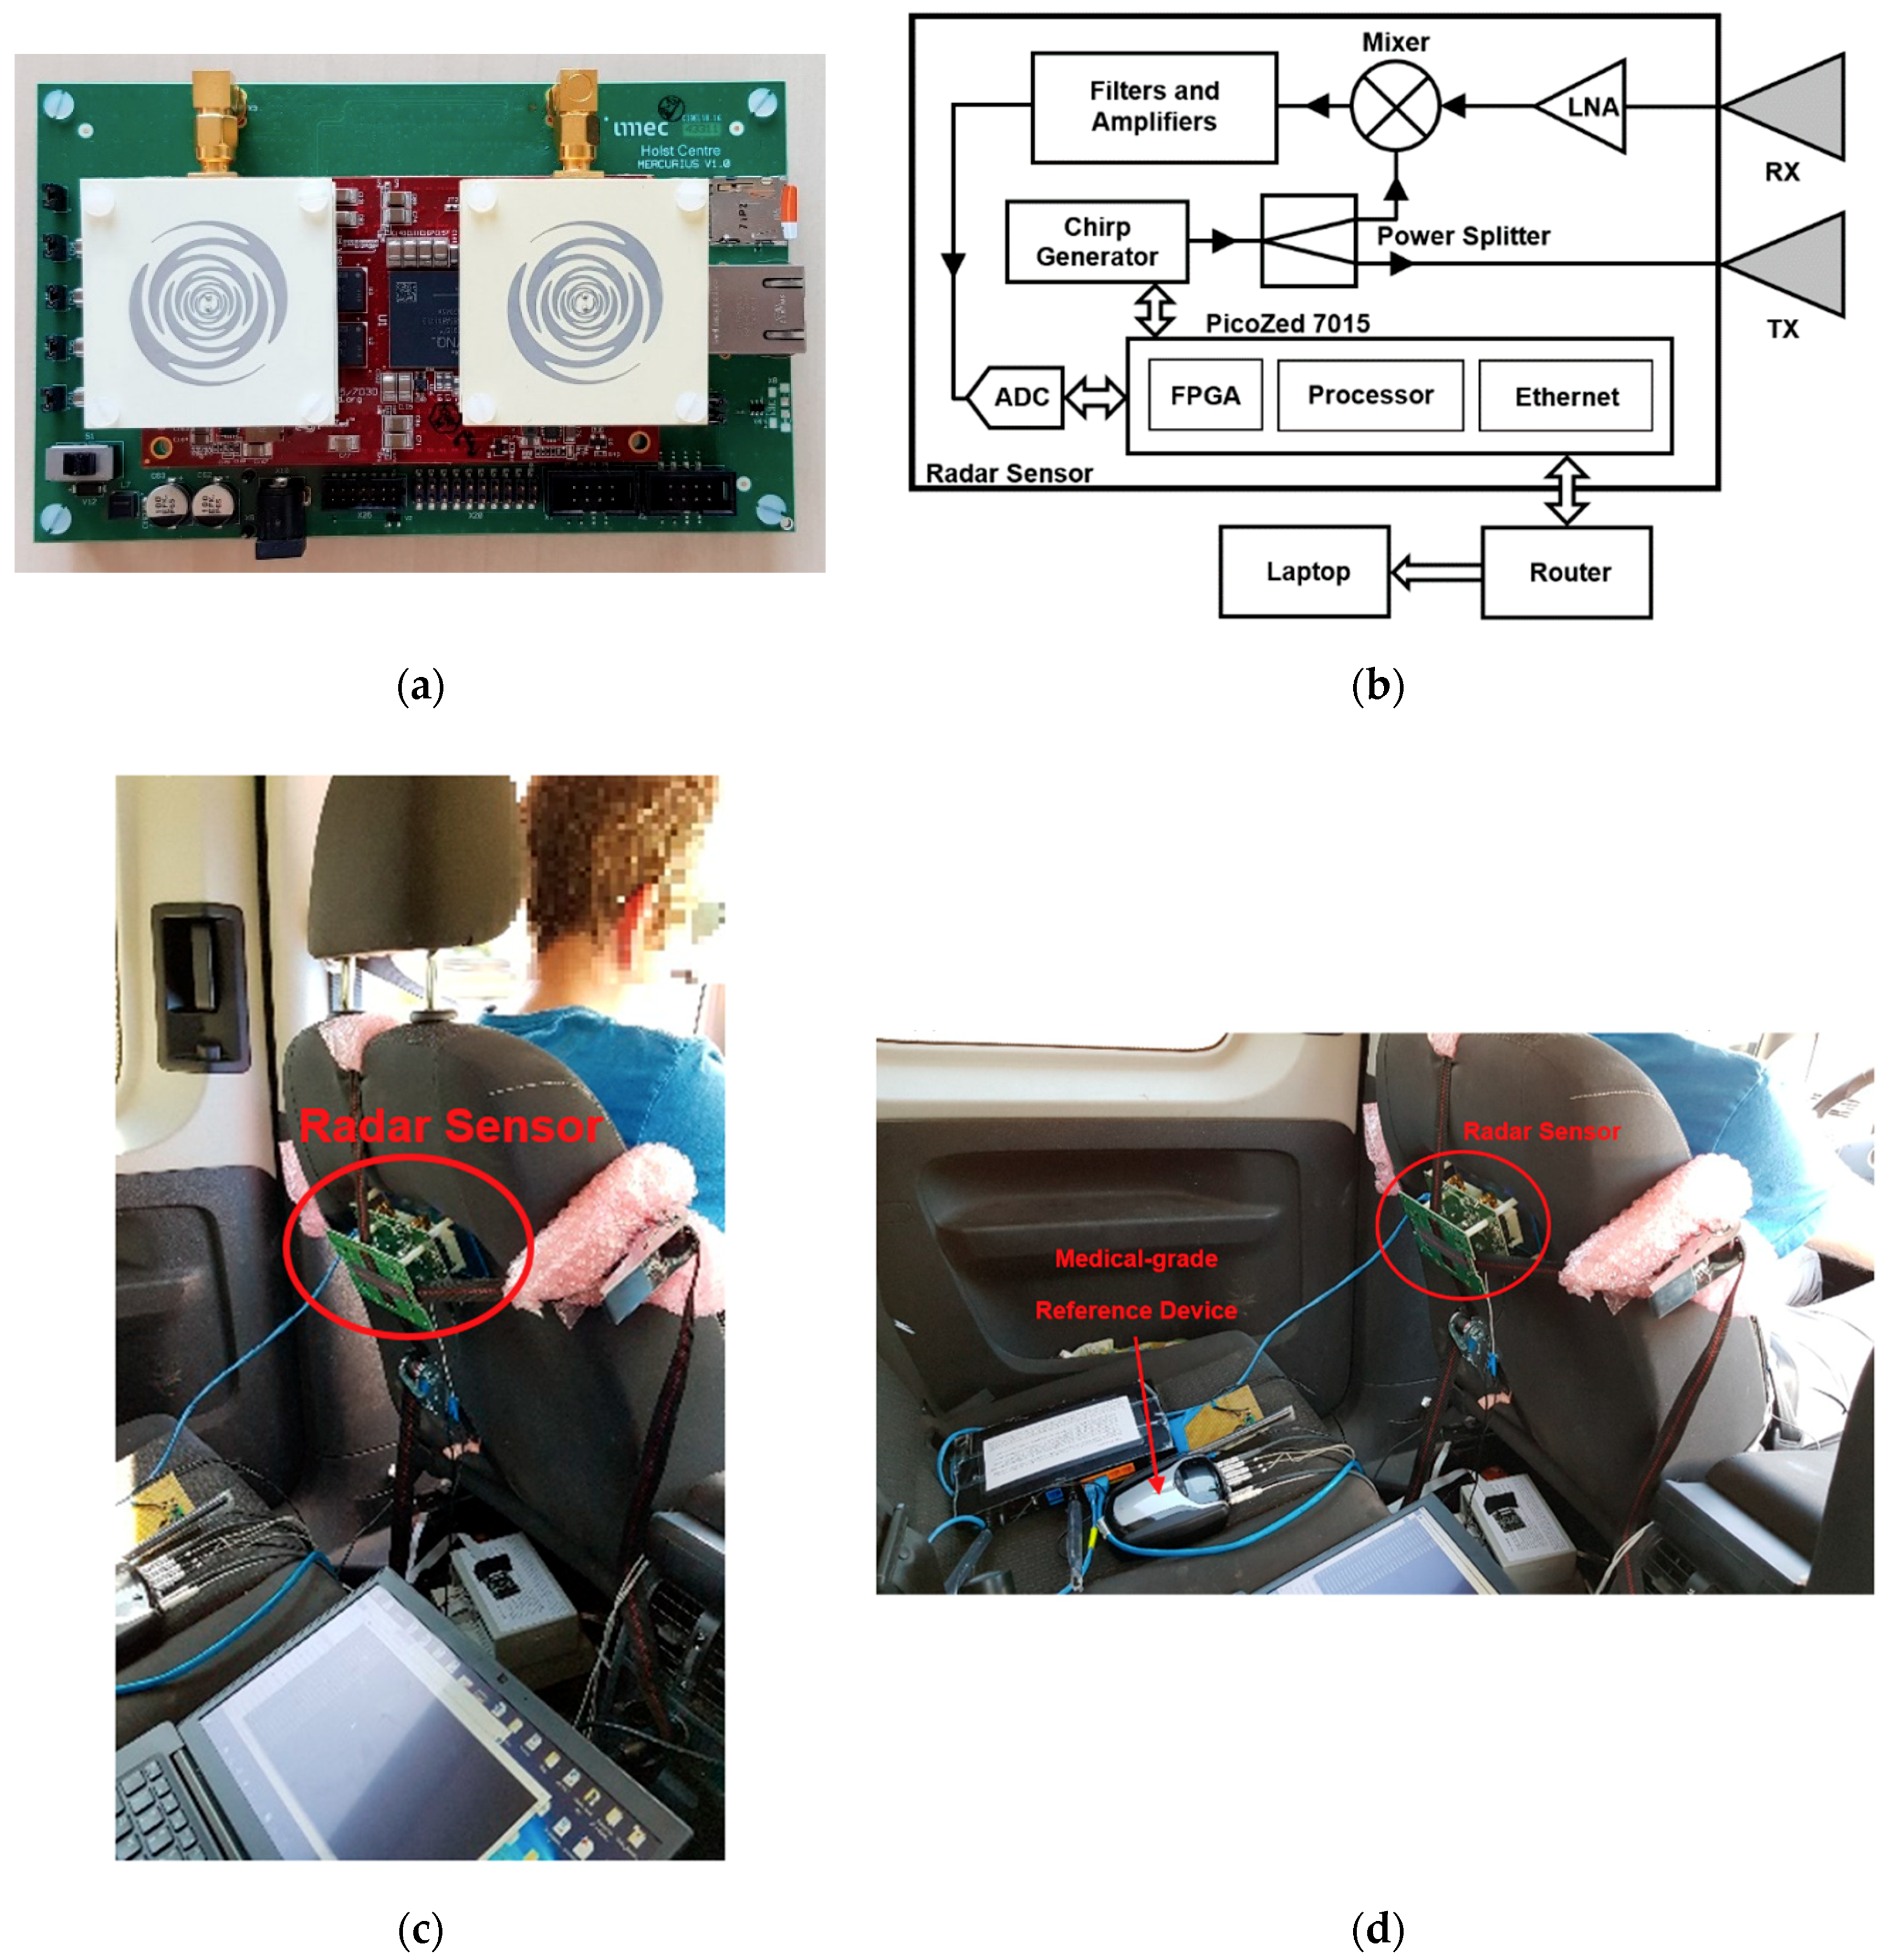
The radar sensor, shown in Figure 3a, consists of a radar unit, two 6 dBi antennas, and the Avnet PicoZed 7015 module which integrates a dual-core processor and a Field Programmable Gate Array (FPGA). The radar unit is based on an FMCW architecture and transmits series of FMCW signals, called chirps, whose instantaneous frequency increases linearly over time. The chirps have a total bandwidth B of 750 MHz, in the 7.3–8.05 GHz frequency range, involving a radar range resolution of 20 cm. Moreover, they are T = 102.4 µs long and are transmitted with a pulse repetition interval (PRI) of 3.072 ms, ensuring a sampling rate of the Doppler (vital signs) signal of 1/PRI = 325.52 Hz. The transmitted power is −6 dBm. Details on the radar-based vital signs sensing and on the FMCW theory can be found in the authors’ prior art [23,24].
The block diagram of the radar sensor system is show in Figure 3b. The chirp generator was designed through an analog Voltage-Controlled Oscillator (VCO) and a Fractional-N Phase Locked Loop (PLL). Each chirp is divided in two branches by a power splitter. One output feeds the transmitter antenna while the other output is connected to the mixer. The received chirps, which are reflected from the driver, are picked up by the receiver antenna, amplified by a low noise amplifier (LNA), and then mixed with the copies of the transmitted chirps. The resulting baseband signals are filtered and amplified before being acquired and digitized by an analog-to-digital converter (ADC). The latter are preprocessed in the FPGA which performs digital filtering, windowing function, Fast Fourier Transform (FFT), and then sends the resulting complex samples to the laptop by Ethernet.
The radar was placed behind the driver’s seat (Figure 3c,d). In order to maximize the heartbeat detection and to be able to monitor the respiration, the radar was positioned such that its line of sight (LoS) was in the middle of the back at the height of the chest. One advantage of operating at this frequency range is that the seat material does not obstruct the propagation of the electromagnetic waves. An accelerometer is integrated in the radar board to measure vibration of the radar caused by the car motion. It is fairly assumed that this vibration is very similar to the vibration of the driver’s back due to the motion of the car when he/she leans against the seat. The z-axis of the accelerometer coincides with the radar LoS, which gives the highest contribution in the Doppler shift.

2.4. Signal Processing on Radar Signals

Due to its ultra-wideband (UWB) nature, the FMCW radar is able to resolve temporally the reflections and, therefore, it is able to isolate the Doppler signals (i.e., phase shift) caused by the cardiopulmonary activity of the driver from the unwanted phase shifts present in the car generated by the vibrations of objects (e.g., dashboard, driving mirror, wipers) and/or other passengers.
The first step is to individuate the range bin wherein the subject’s back lies. Considering that each range bin (i.e., range resolution) is 20 cm and that the seat is about 10 cm thick, the vital signs information can be retrieved extracting the phase shift from the FFT’s complex samples which belong to the first range bin.
The second step is to extract and optimize the Doppler (phase) signal. In fact, static reflectors (e.g., seat, static body parts of the driver) in the range bin yield phase distortion. In order to overcome this issue, the linear demodulation technique, described in [23], is applied to recover phase signal.
In the car and with the radar positioned to the back of the seat, the Doppler signal is mainly a contribution of two sources: (1) The displacement of the back surface due to the cardiopulmonary activity; (2) the vibration of the subject’s back due to the car movement. An estimate of the latter vibration is measured by the accelerometer. The result of the linear demodulation is a signal that can be fairly considered directly proportional to the Doppler signal. Since the two sources are non-Gaussian distributed, statistically independent, and linearly combined, the independent component analysis (ICA) algorithm can be used to separate the two sources. The ICA takes as input the linear demodulation output and the acceleration in the z direction and provides two outputs: (1) The phase shift caused by the vibration; (2) the phase shift due to the vital signs. The latter can be further processed by Wavelet Transform to separate the heartbeat from the respiration and to remove the noise.

3. Results

The experimental tests were conducted on healthy volunteer drivers on public roads (i.e., city center, highway) under real conditions. The drivers were instructed to only pay attention to the driving task. Two additional passengers were always present in the car to collect the capacitive sensor and radar signals. In addition, a reference (FDA approved and CE class IIa conform) device was used (NeXus-10 MkII, MindMedia, 6049 CD Roermond, The Netherlands), which recorded contact ECG signals (Lead I) from the driver’s shoulders, as well as respiration signals using a strapped belt around the abdomen.
The experimental protocol was approved by imec-nl’s internal investigation approval board with approval reference IA-18-WATS-TIP2-041.

3.1. Experimental Results from Capacitively-Coupled ECG and Bio-Impedance

5 subjects were recorded. Each subject drove approximately 30 min in city traffic and 30 min in highway traffic (one subject only did the highway traffic driving). 2 subjects wore two layers of clothing, and 3 subjects wore a single layer of clothing. See Table 1 for details.
Table 2 shows the performance for R peak detection and heart rate on each of the subjects together with the percentage of removed signal (as a result of the quality-based processing described in Section 2.2). The motion artefact algorithms improve the median R peak detection sensitivity from 92.74% to 98.28% and the median positive predictive value (PPV) from 92.34% to 99.03%, city and highway combined. This compares favorably to [30] (average sensitivity 91.75%, PPV 84.47%) and [31] (average sensitivity 88.02%, PPV 95.17%). The overall mean absolute error on the heart rate when compared to the reference system is 1.48 bpm, calculated over 60 s windows. The motion artefact algorithms removed 10.29% resp. 20.41% (medians) of the signal in highway resp. city traffic.
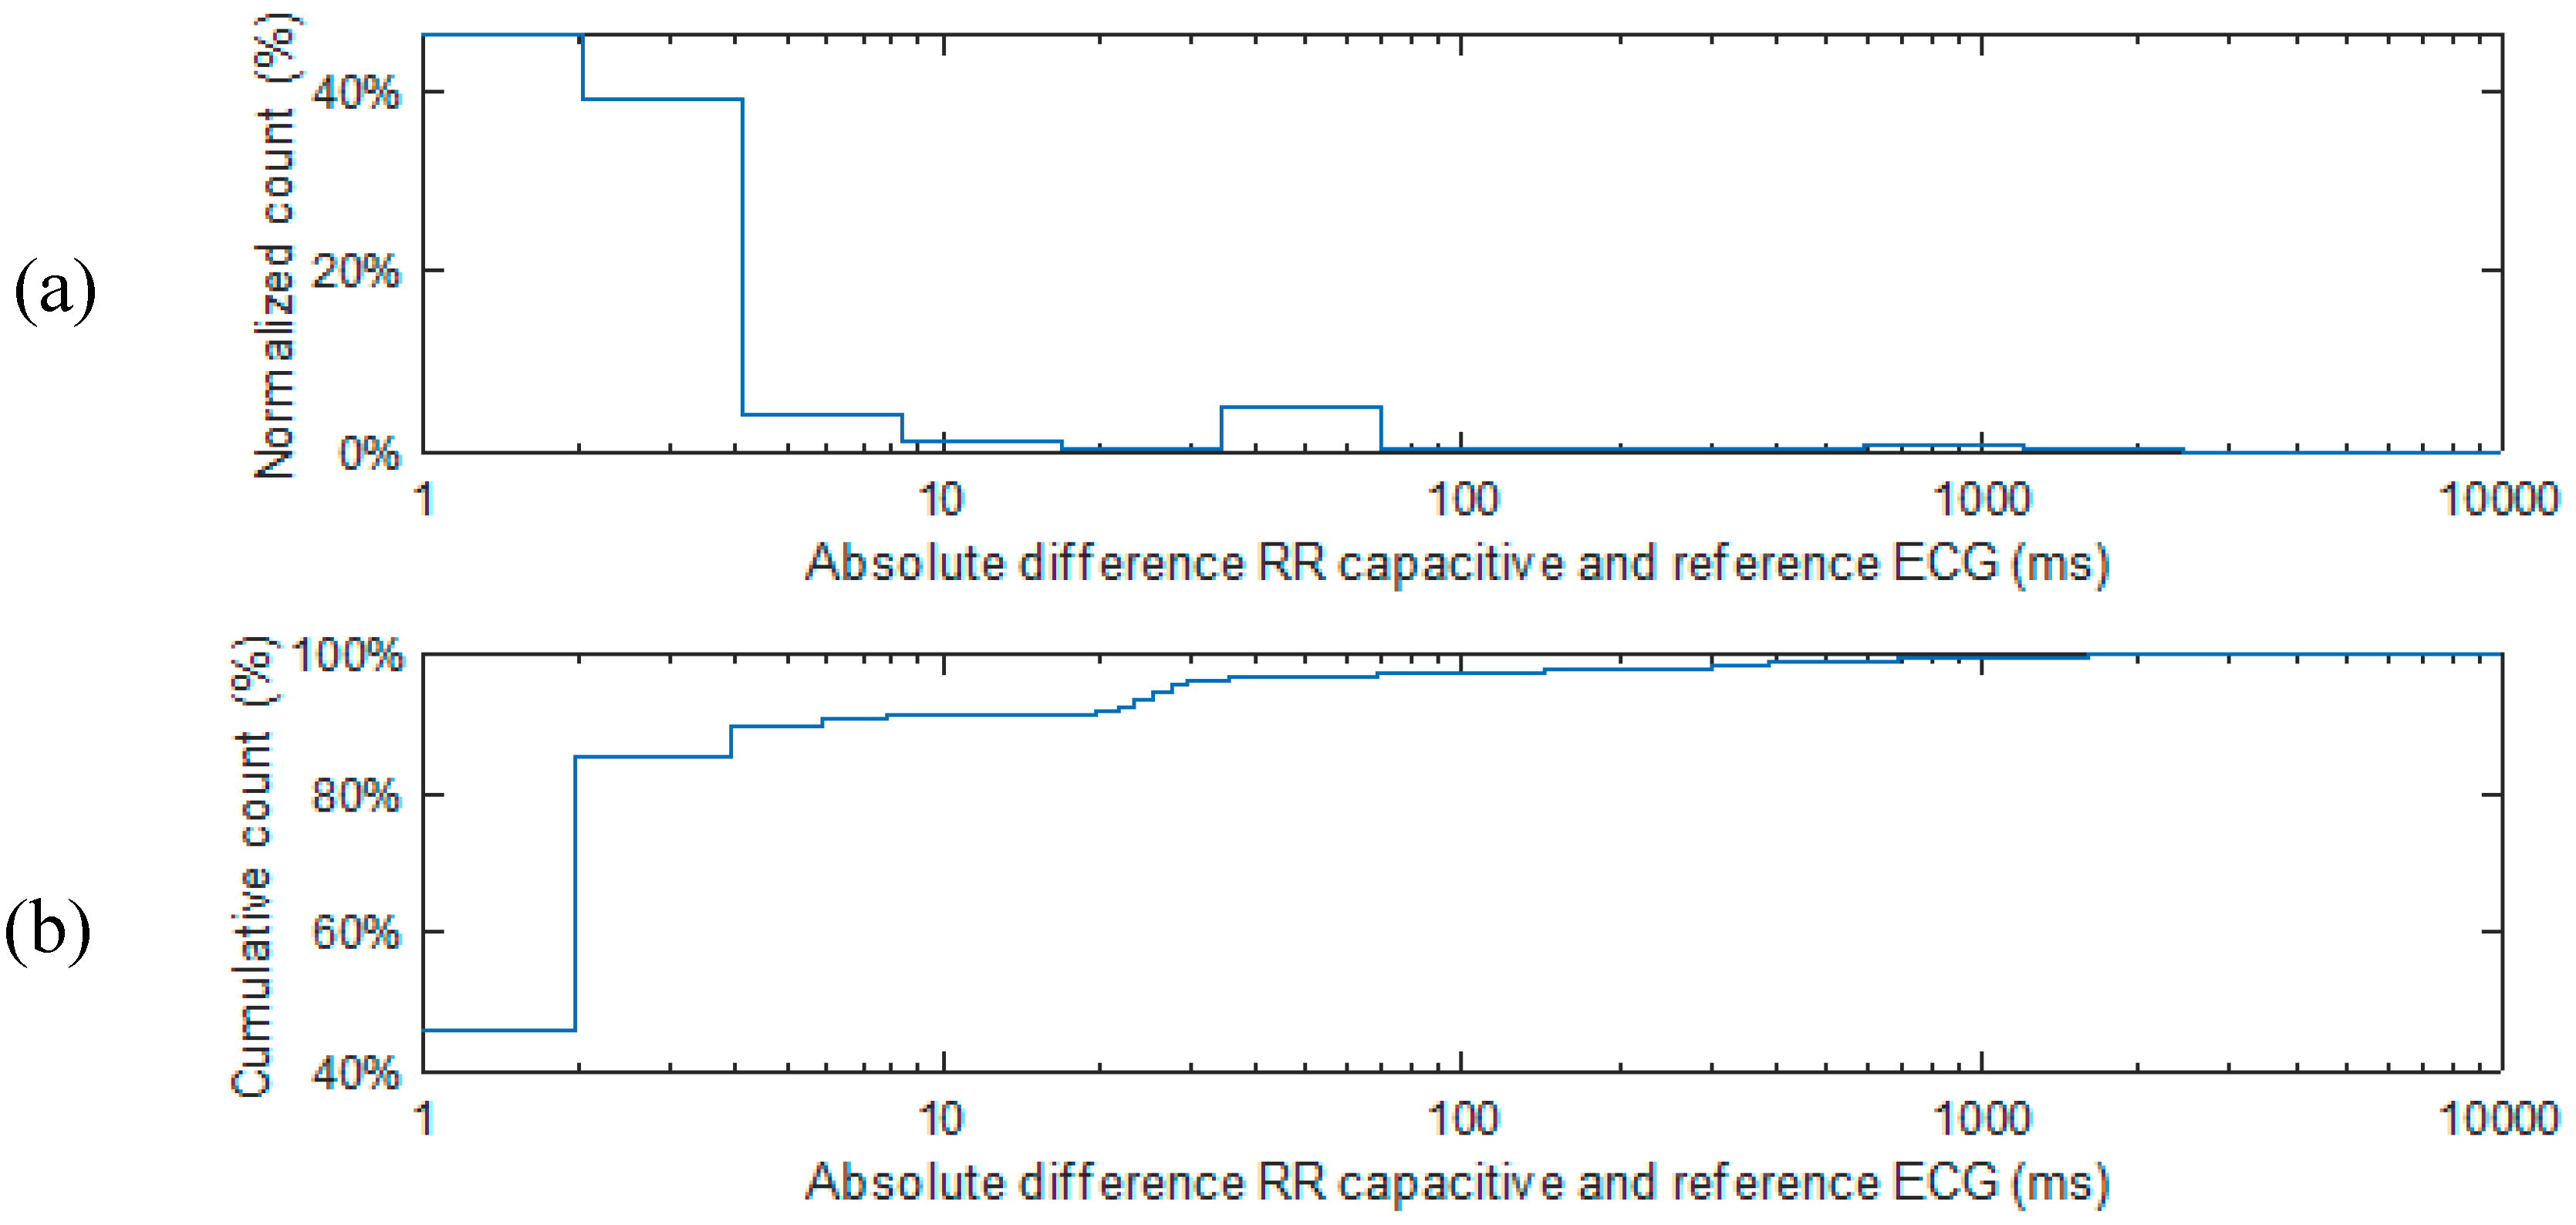
For applications where information regarding heart rate variability is desired, it is necessary to evaluate the performance on the detection of individual beat-to-beat R-R intervals. Table 3 shows performance metrics for all subjects. The mean absolute error on the R-R intervals is 34.22 ms. This is skewed by subject 5 where the reference contact ECG was noisy due to a poorly connected ground lead. If subject 5 is excluded, the mean absolute error on the R-R intervals reduces to 15.7 ms. Figure 4 shows the distribution of the R-R interval absolute error across the entire dataset, which is highly non-Gaussian. The 95th percentile of the absolute error is 27.3 ms. If subject 5 is excluded this reduces to 5.9 ms.
Table 3 also shows the coverage defined as the percentage of time that the respiration rate as calculated using an FFT-based method on 60-s windows from the ccBioZ signal has an error of 3 breaths per minute or less. The median coverage is 61%. This is significantly lower than the coverage numbers obtained for the ECG (median 93.85% coverage with R-R intervals within 5 ms), which can be explained by the facts that no signal quality based motion artefact reduction algorithm was yet included for the ccBioZ signals, and that only one, fixed ccBioZ measurement location was used, compared to an array for the ccECG measurements.
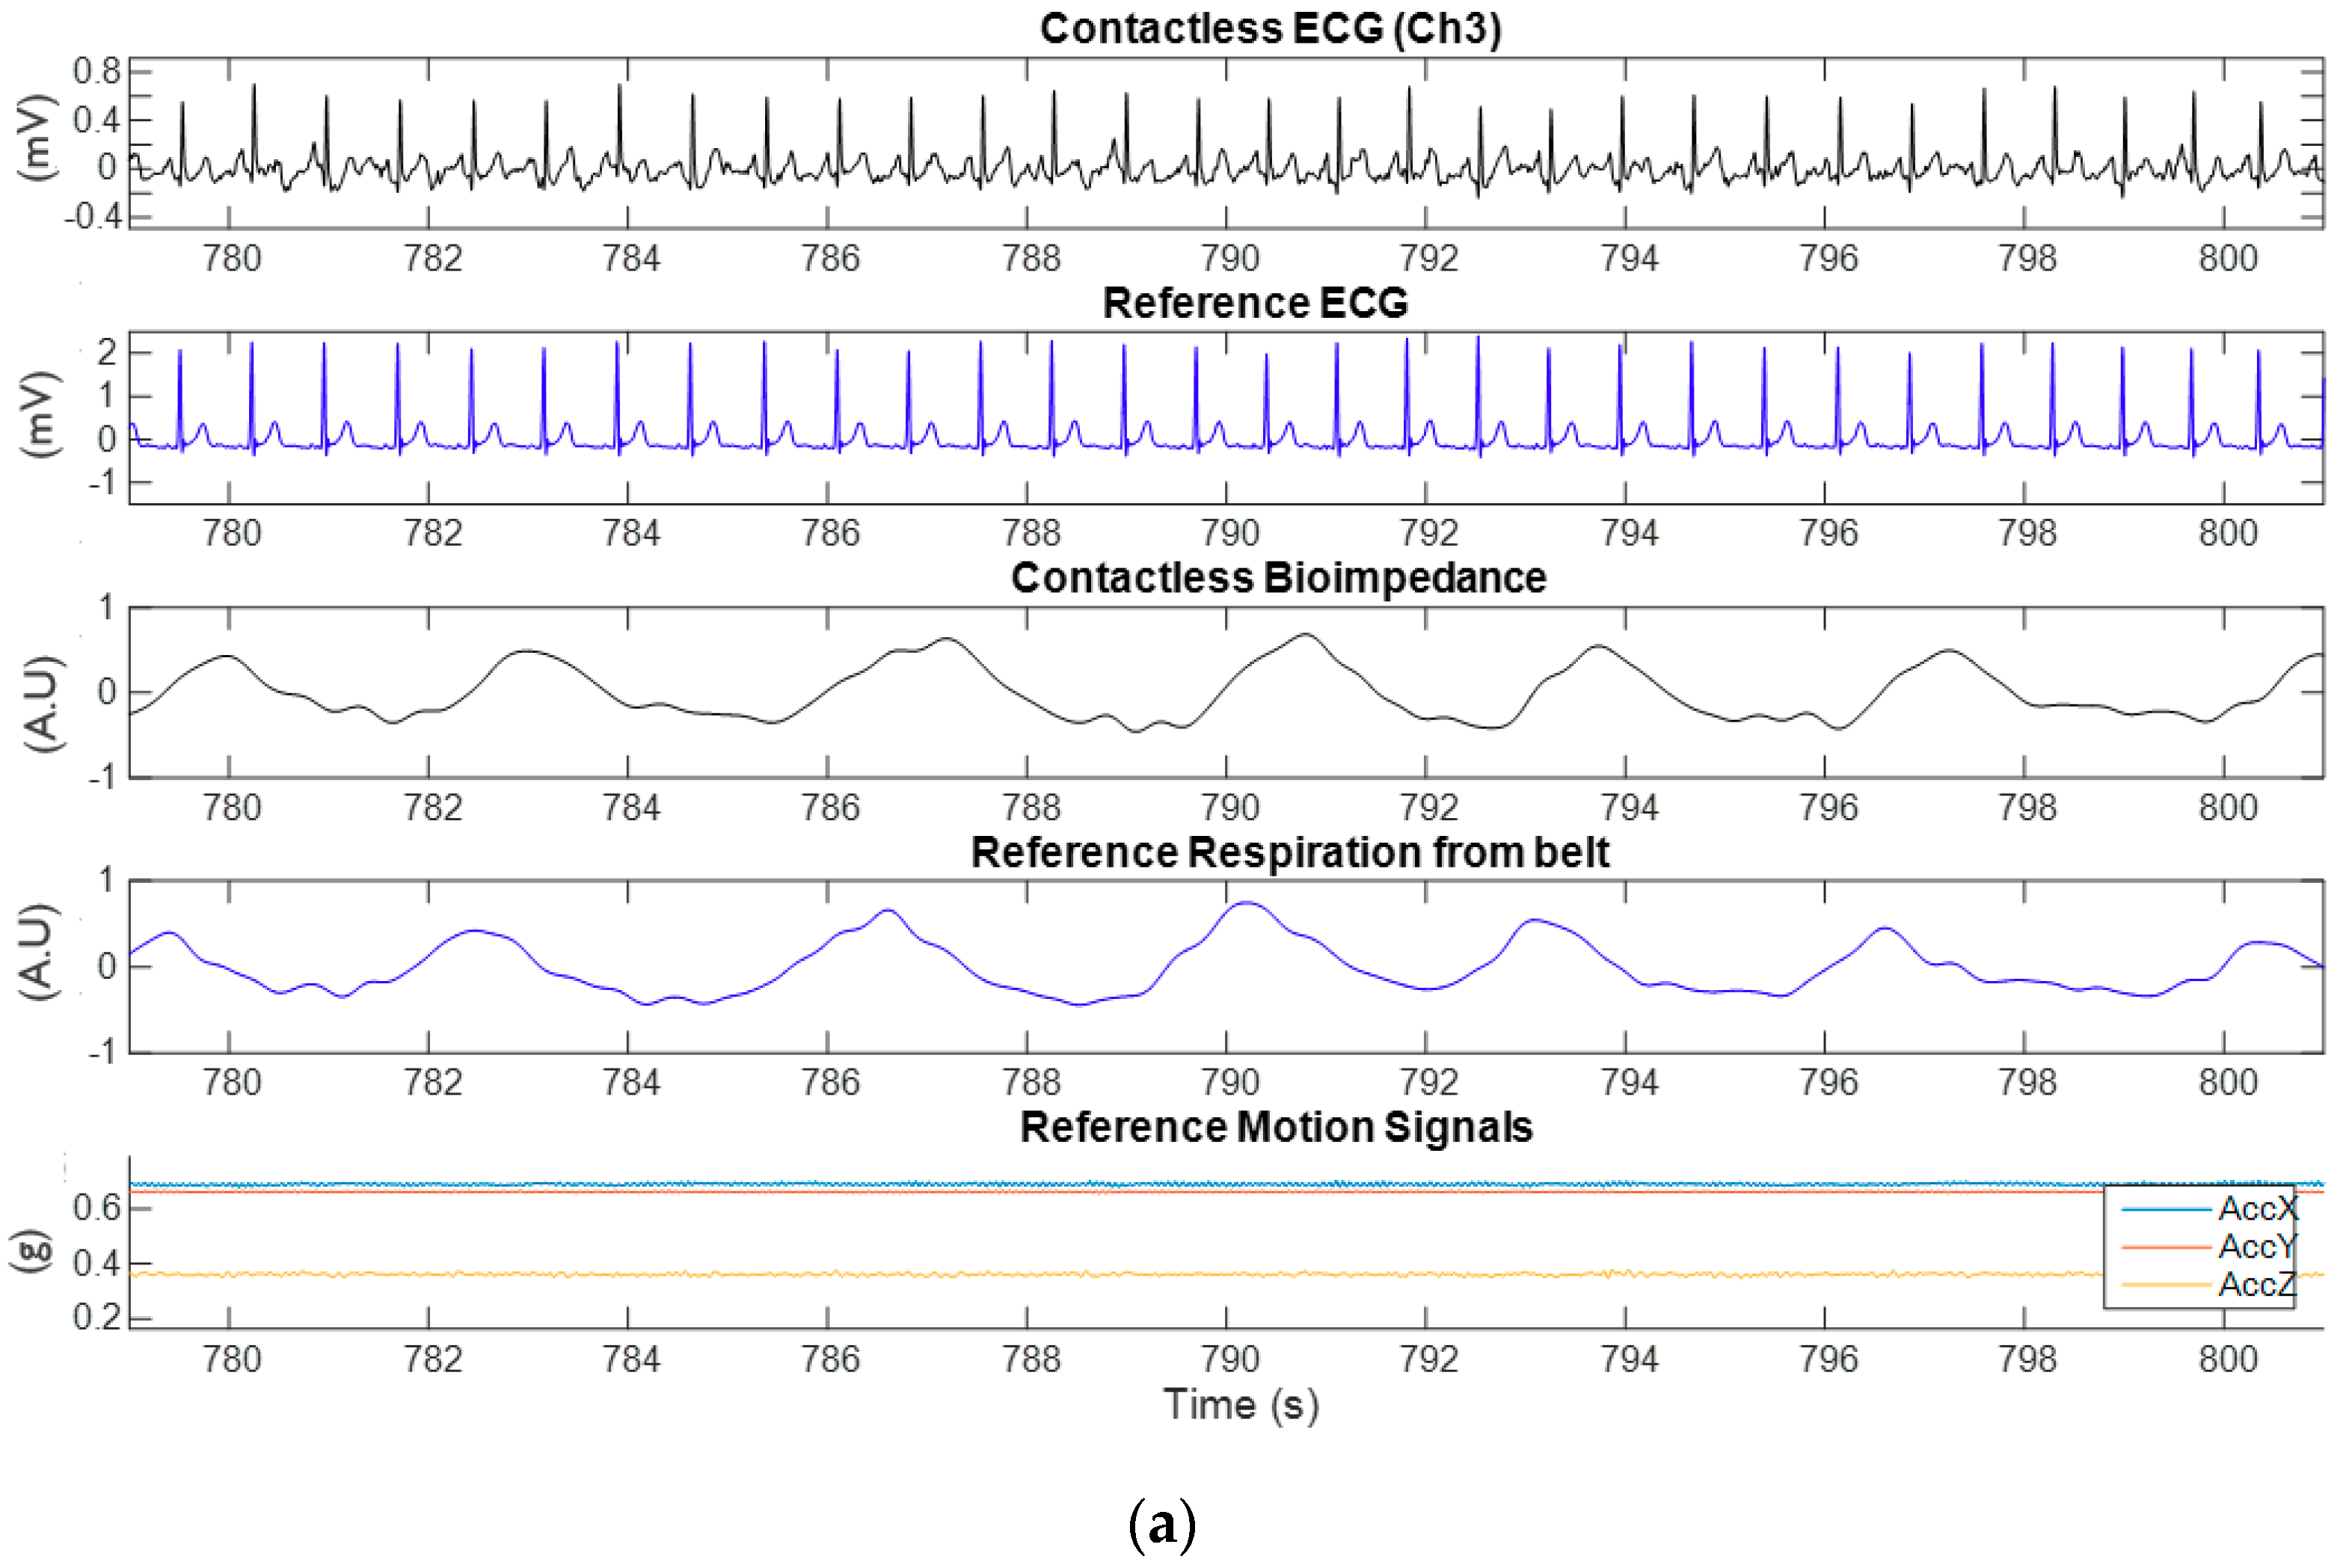
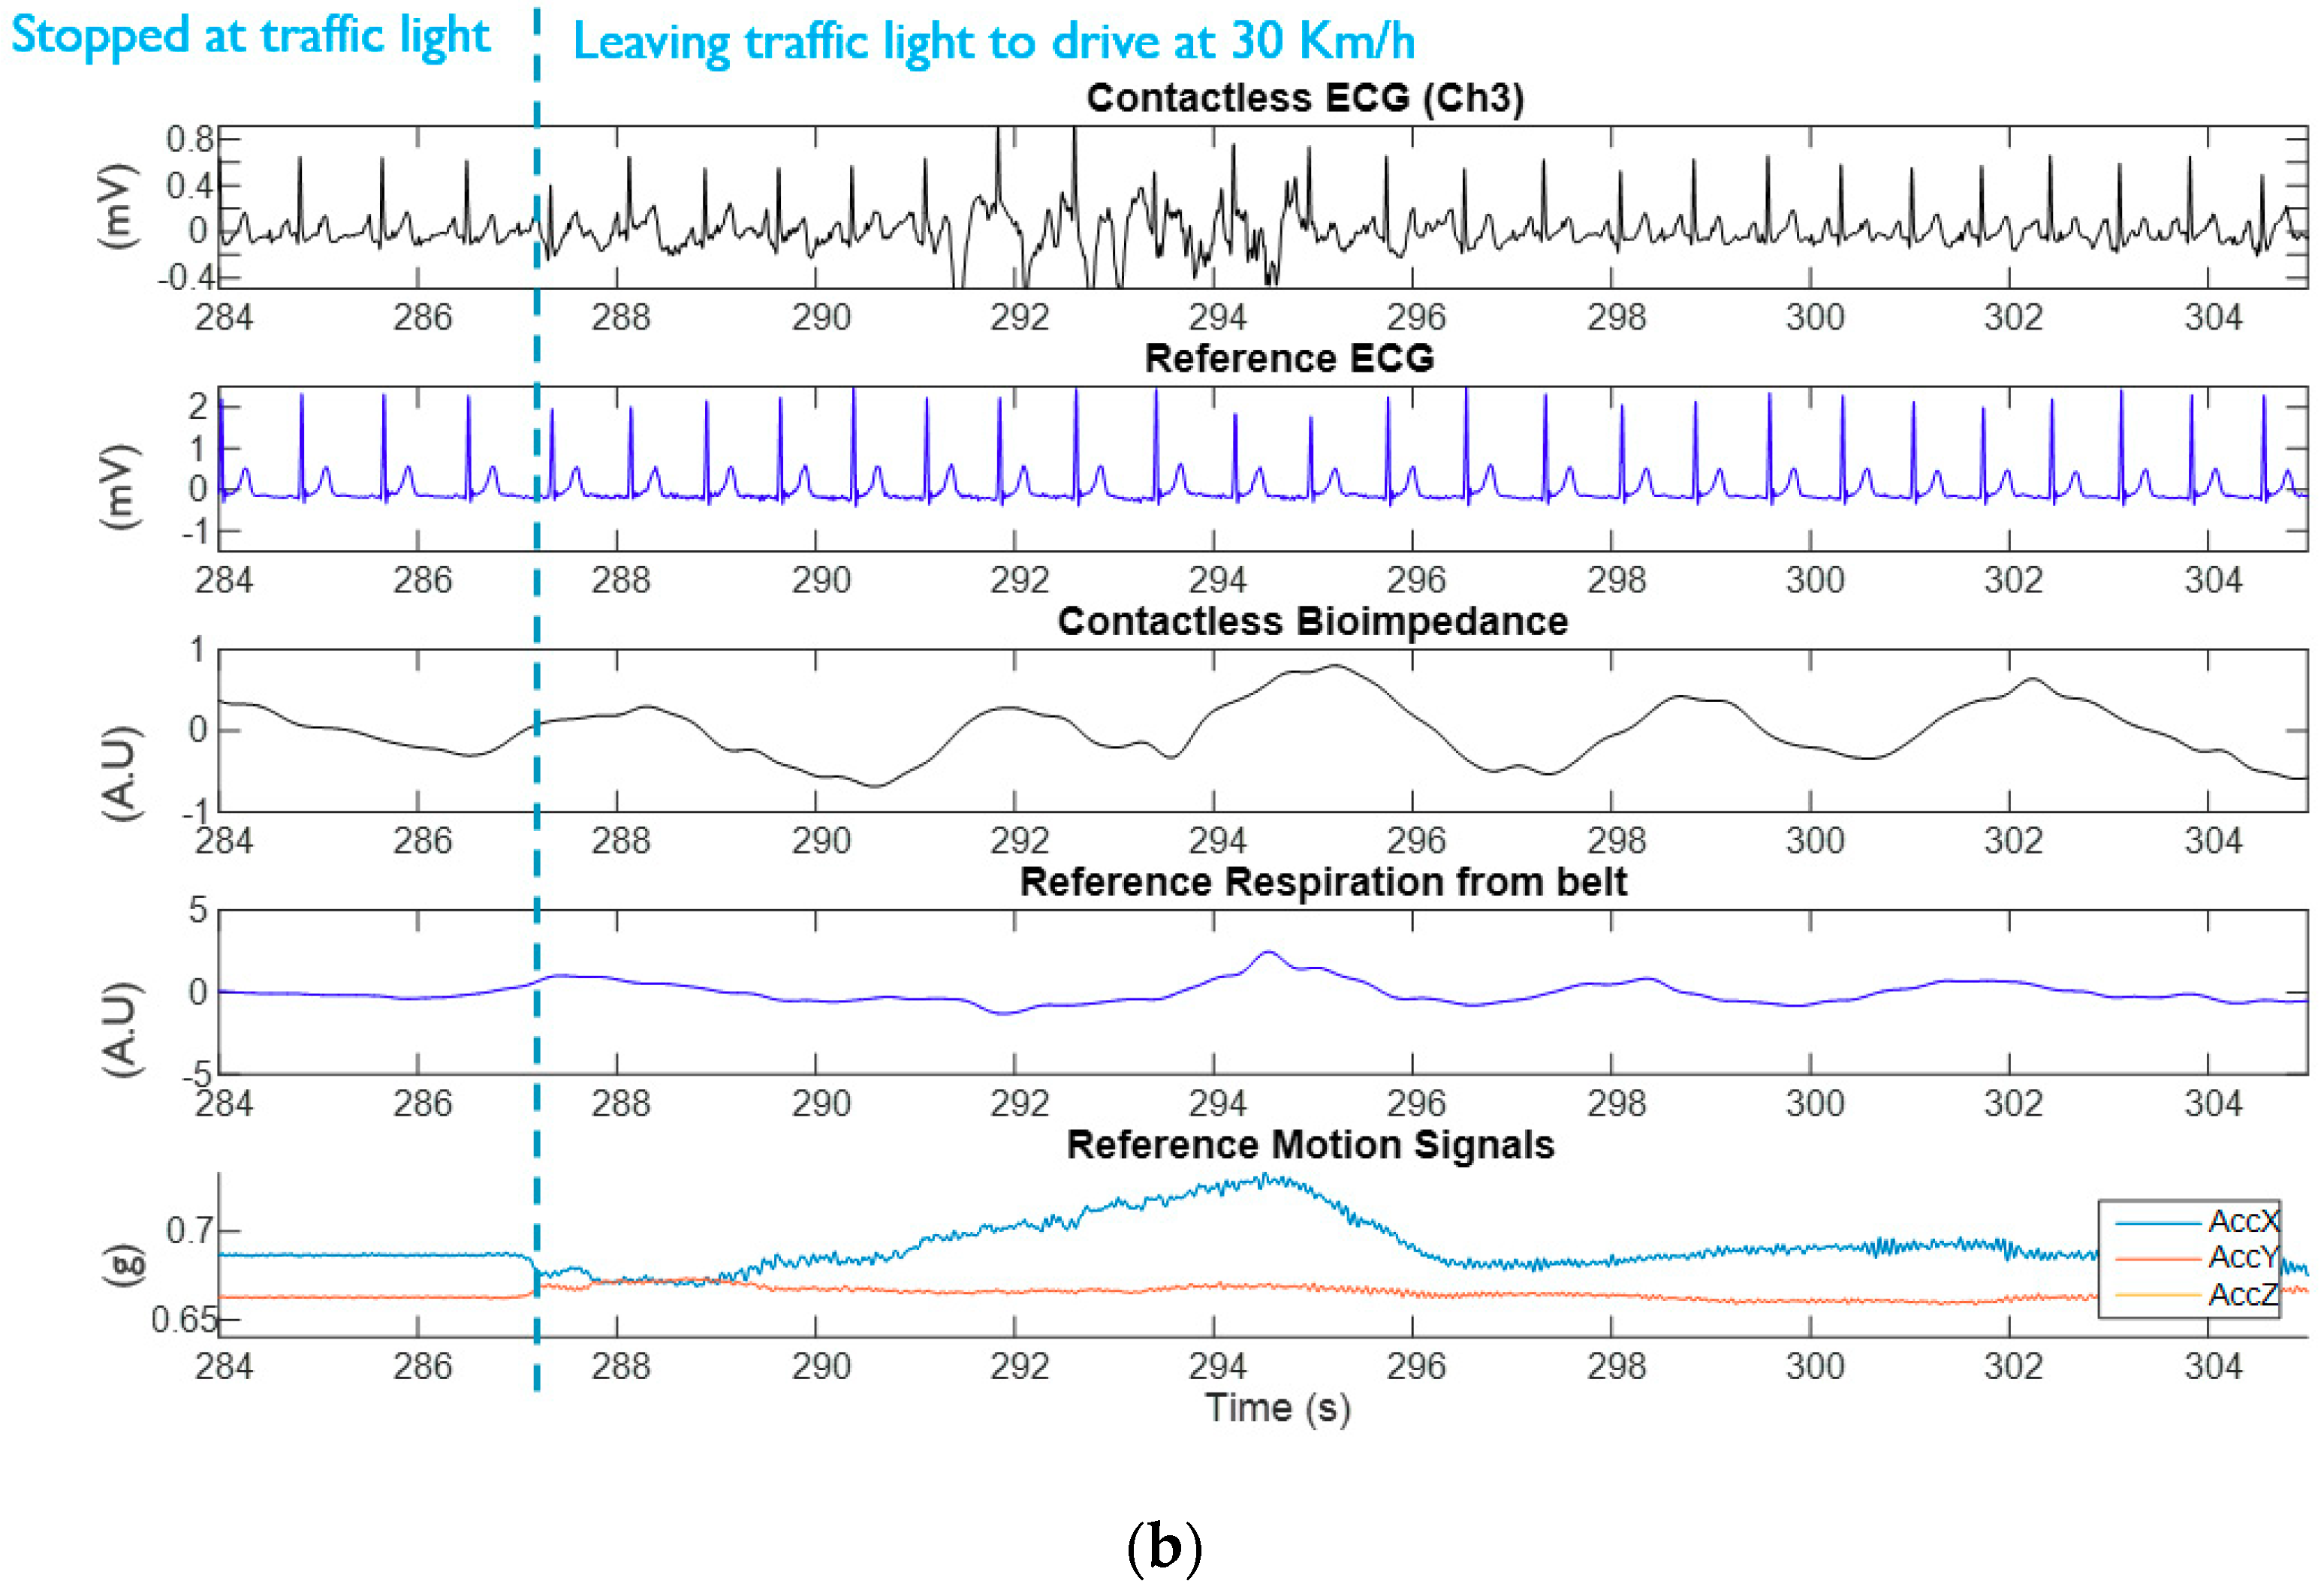
Figure 5 shows example signals from the capacitive ECG and respiration and reference signals while driving. It can be observed that the signals are robust to vibration noise from driving, both at high speed (120 km/h) and low speed (30 km/h) as well as during acceleration. Only when the driver’s body moves during the acceleration phase (in this case being ‘pushed’ back against the seat and hence generating electrode interface changes), motion artefacts are visible in the ECG signal. Similar behavior was observed in sudden deceleration as a cause of the back of the driver moving forward relative to the seat.

3.2. Experimental Results from Radar

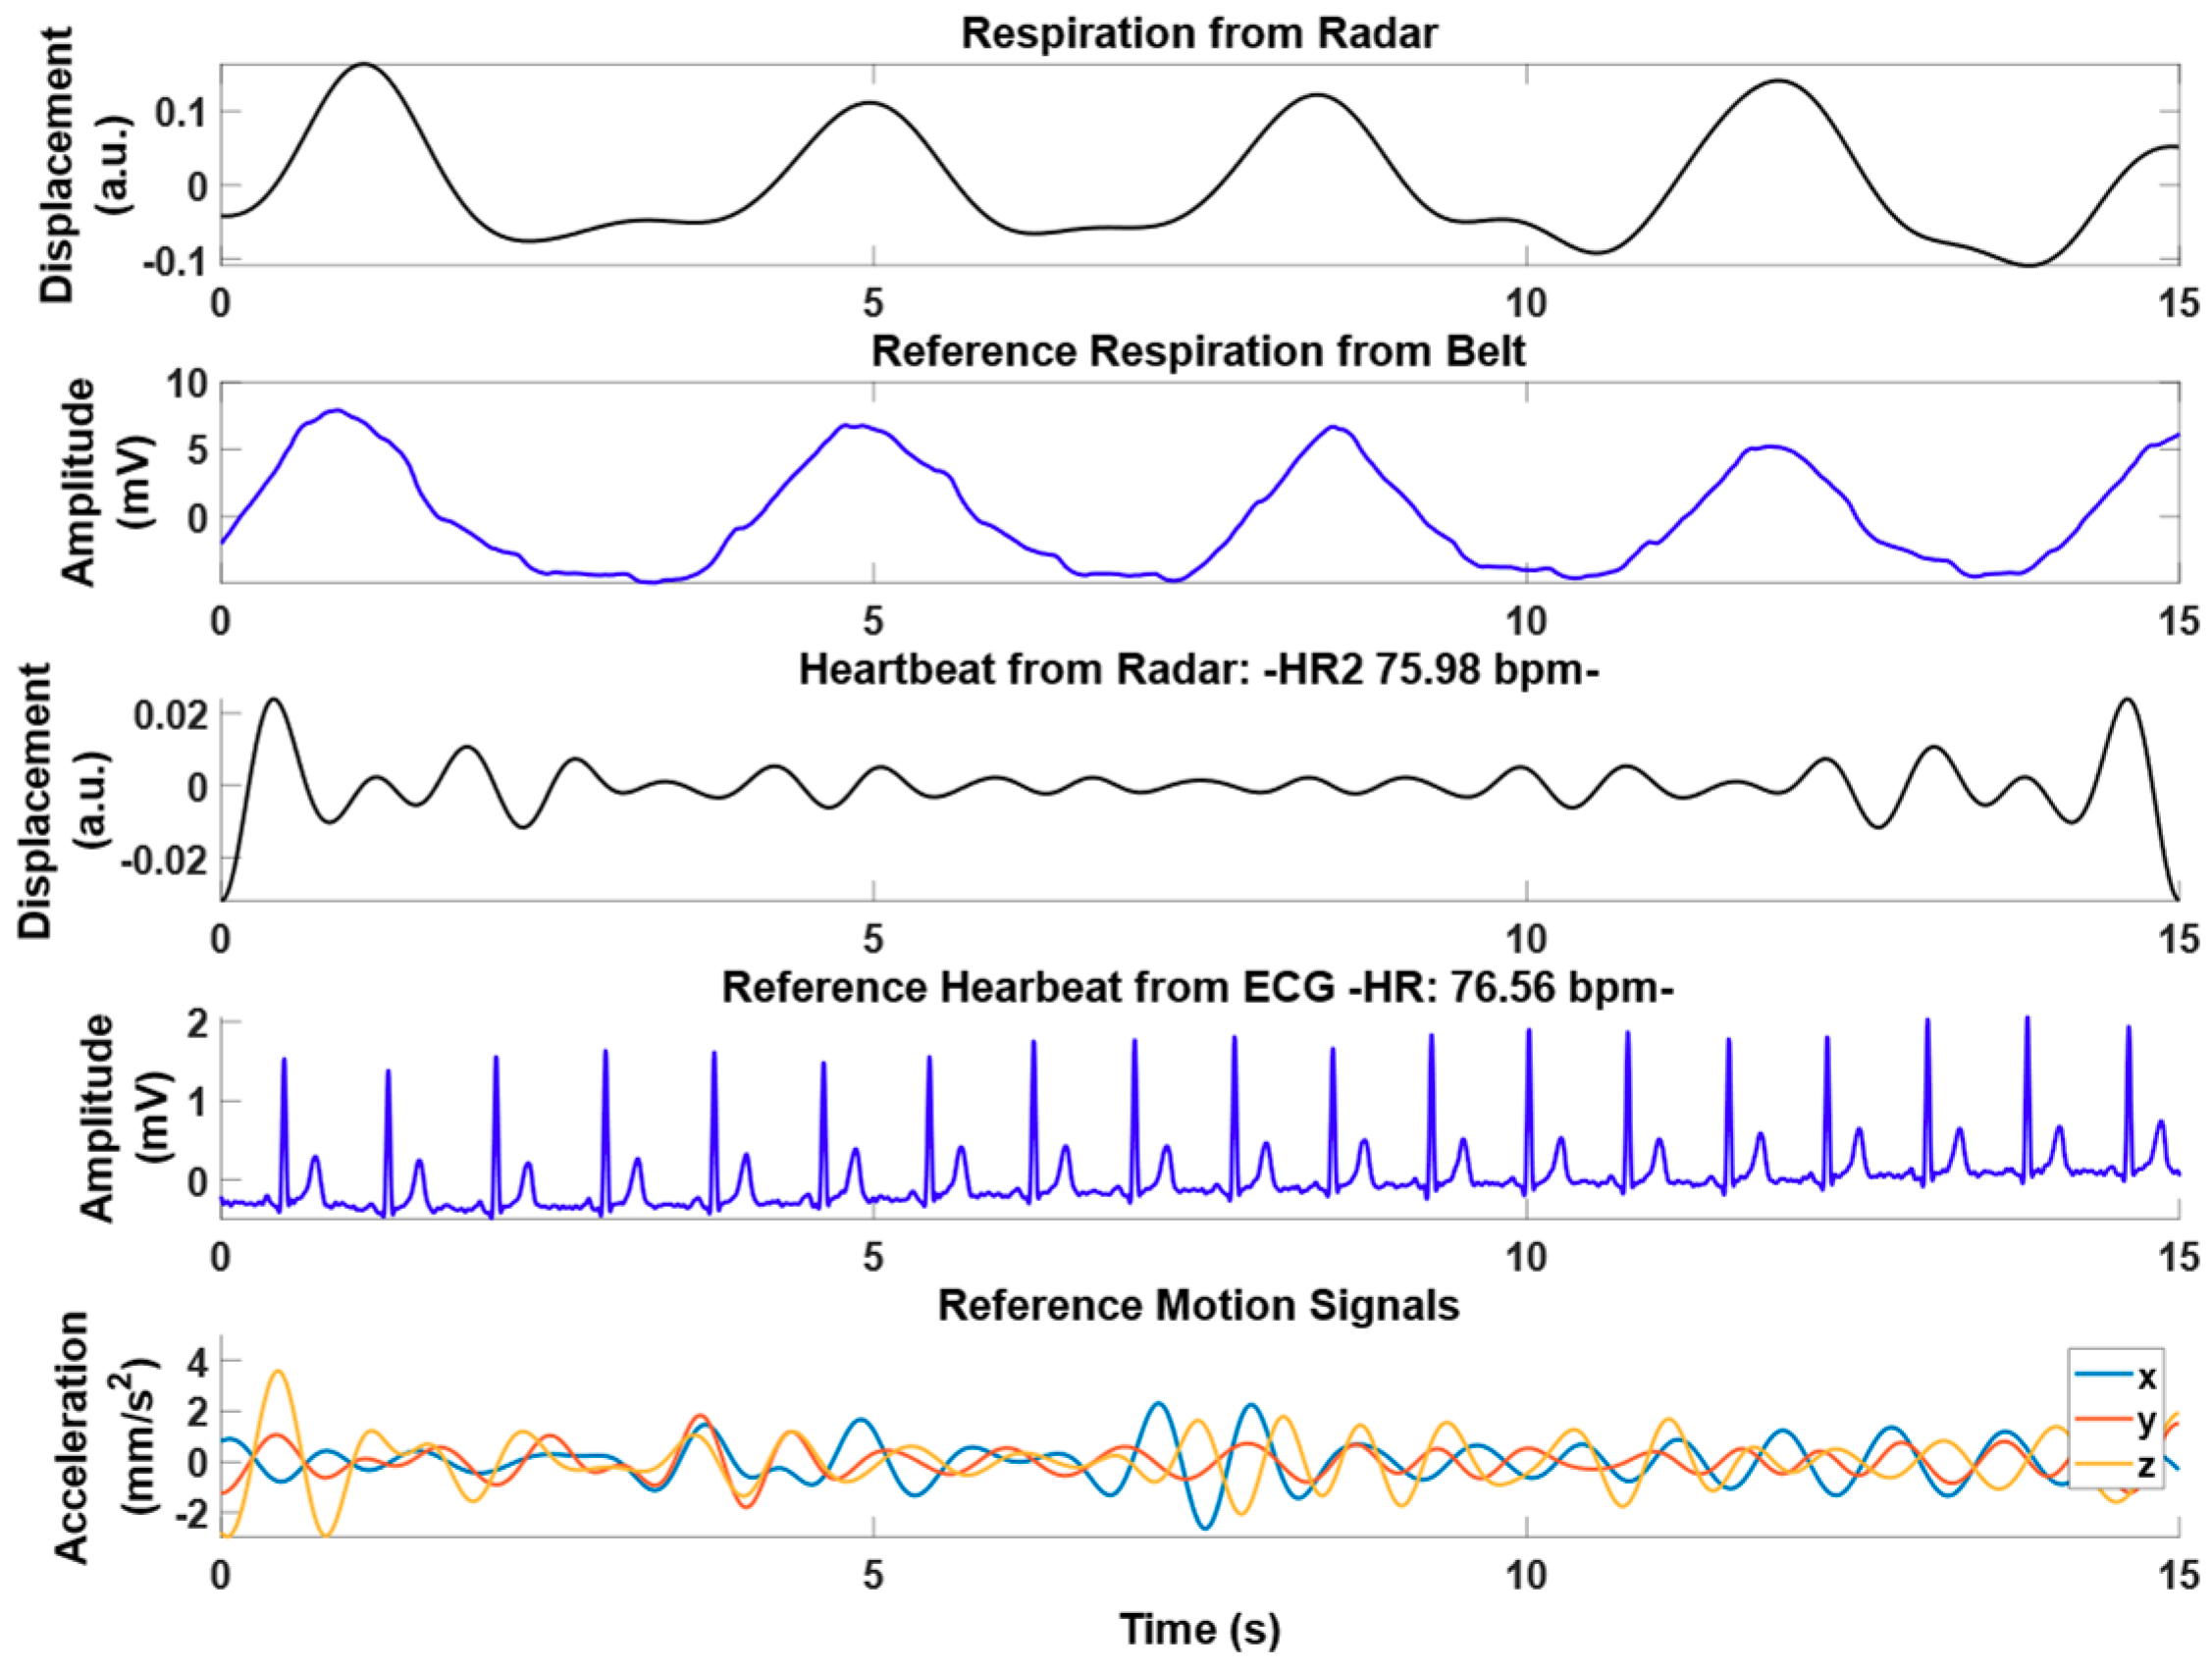
In order to verify that the radar can monitor the vital signs from the back and through the seat, an initial test was performed with the car put in neutral with the engine on. The driver was invited to breathe normally. Figure 6 shows the results of this experiment. The respiration and heartbeat signals extracted with the radar and the references (i.e., belt and ECG) are in agreement. Moreover, in this static condition, as it can be seen from the small acceleration values, the vibrations from the car are negligible so no vibration removal algorithm is necessary.
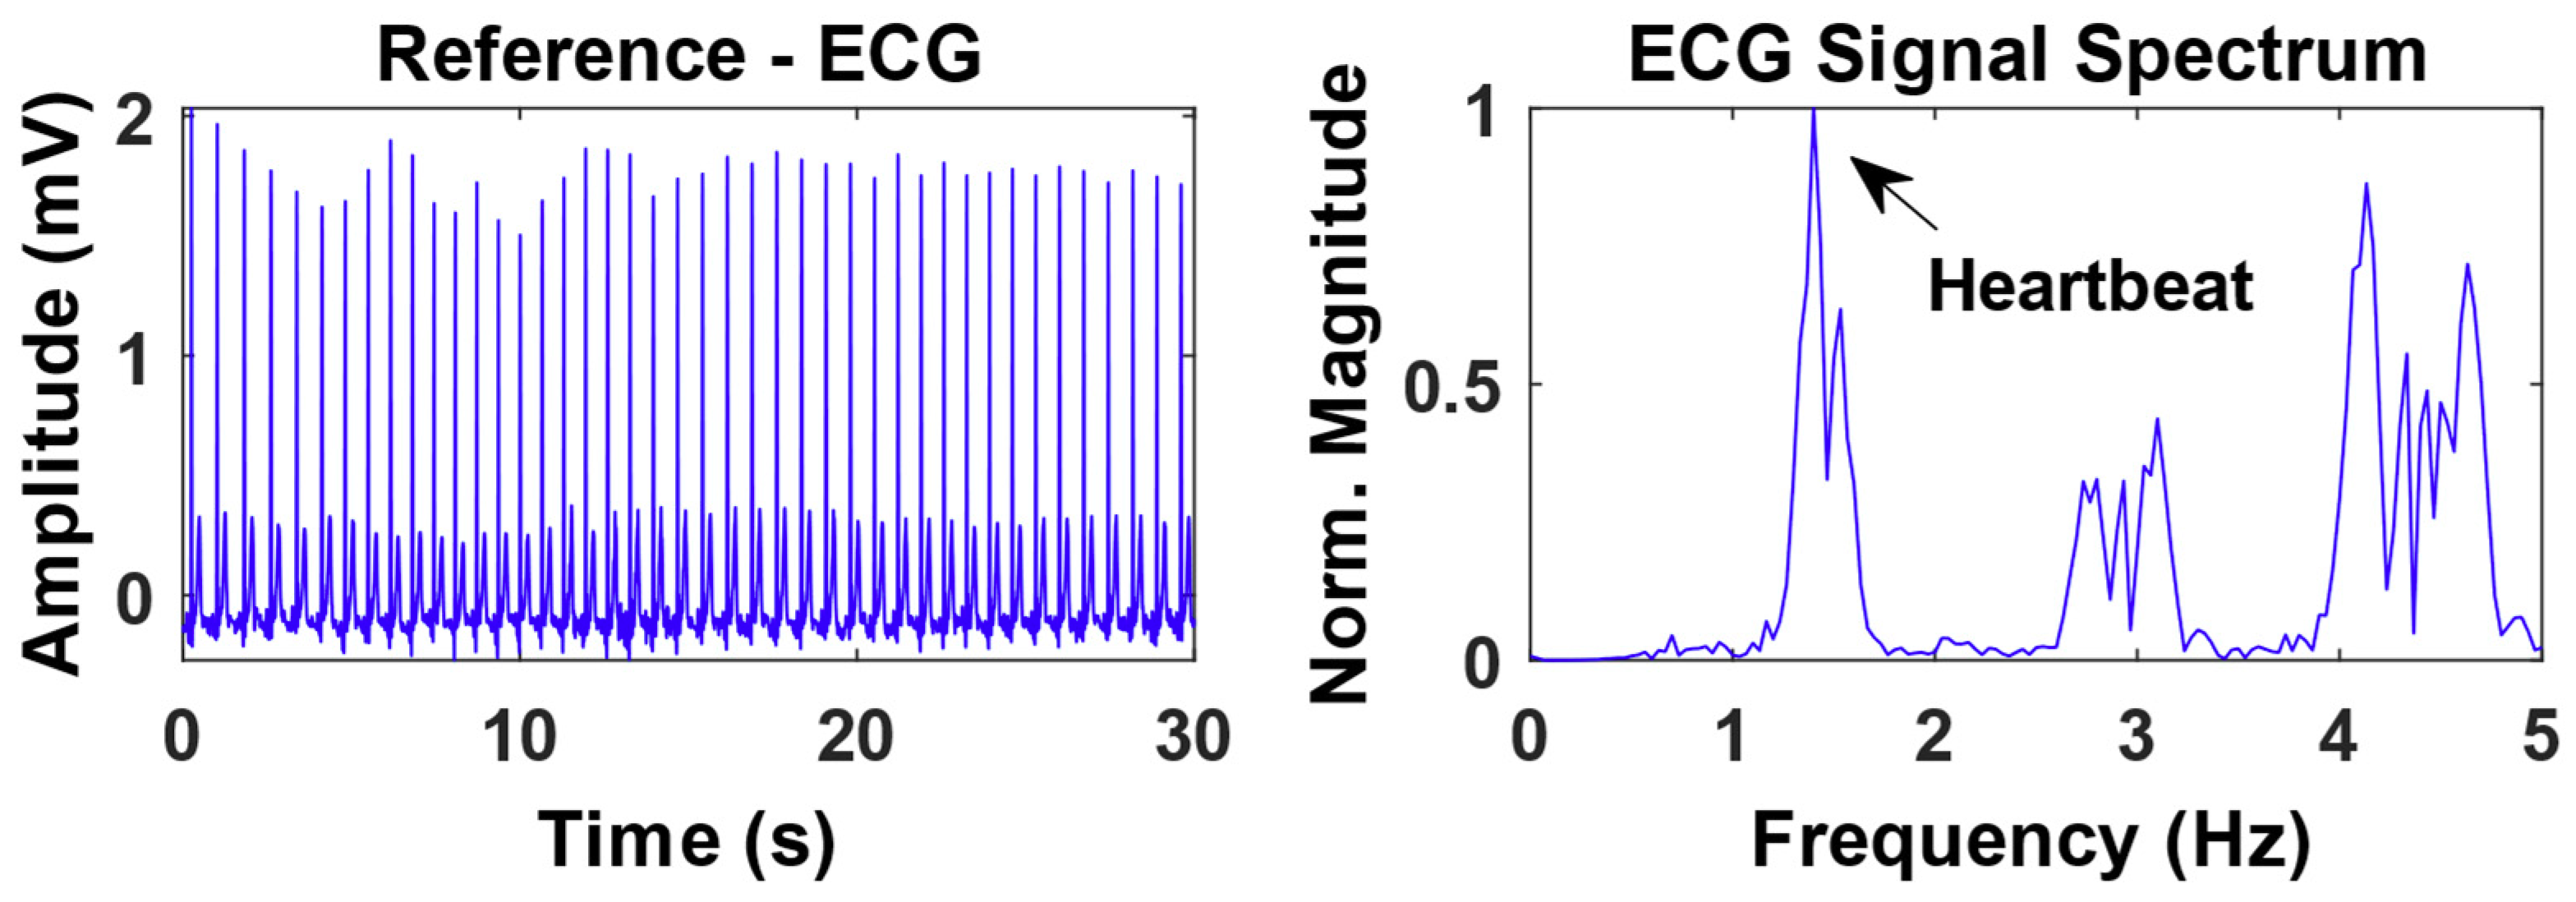
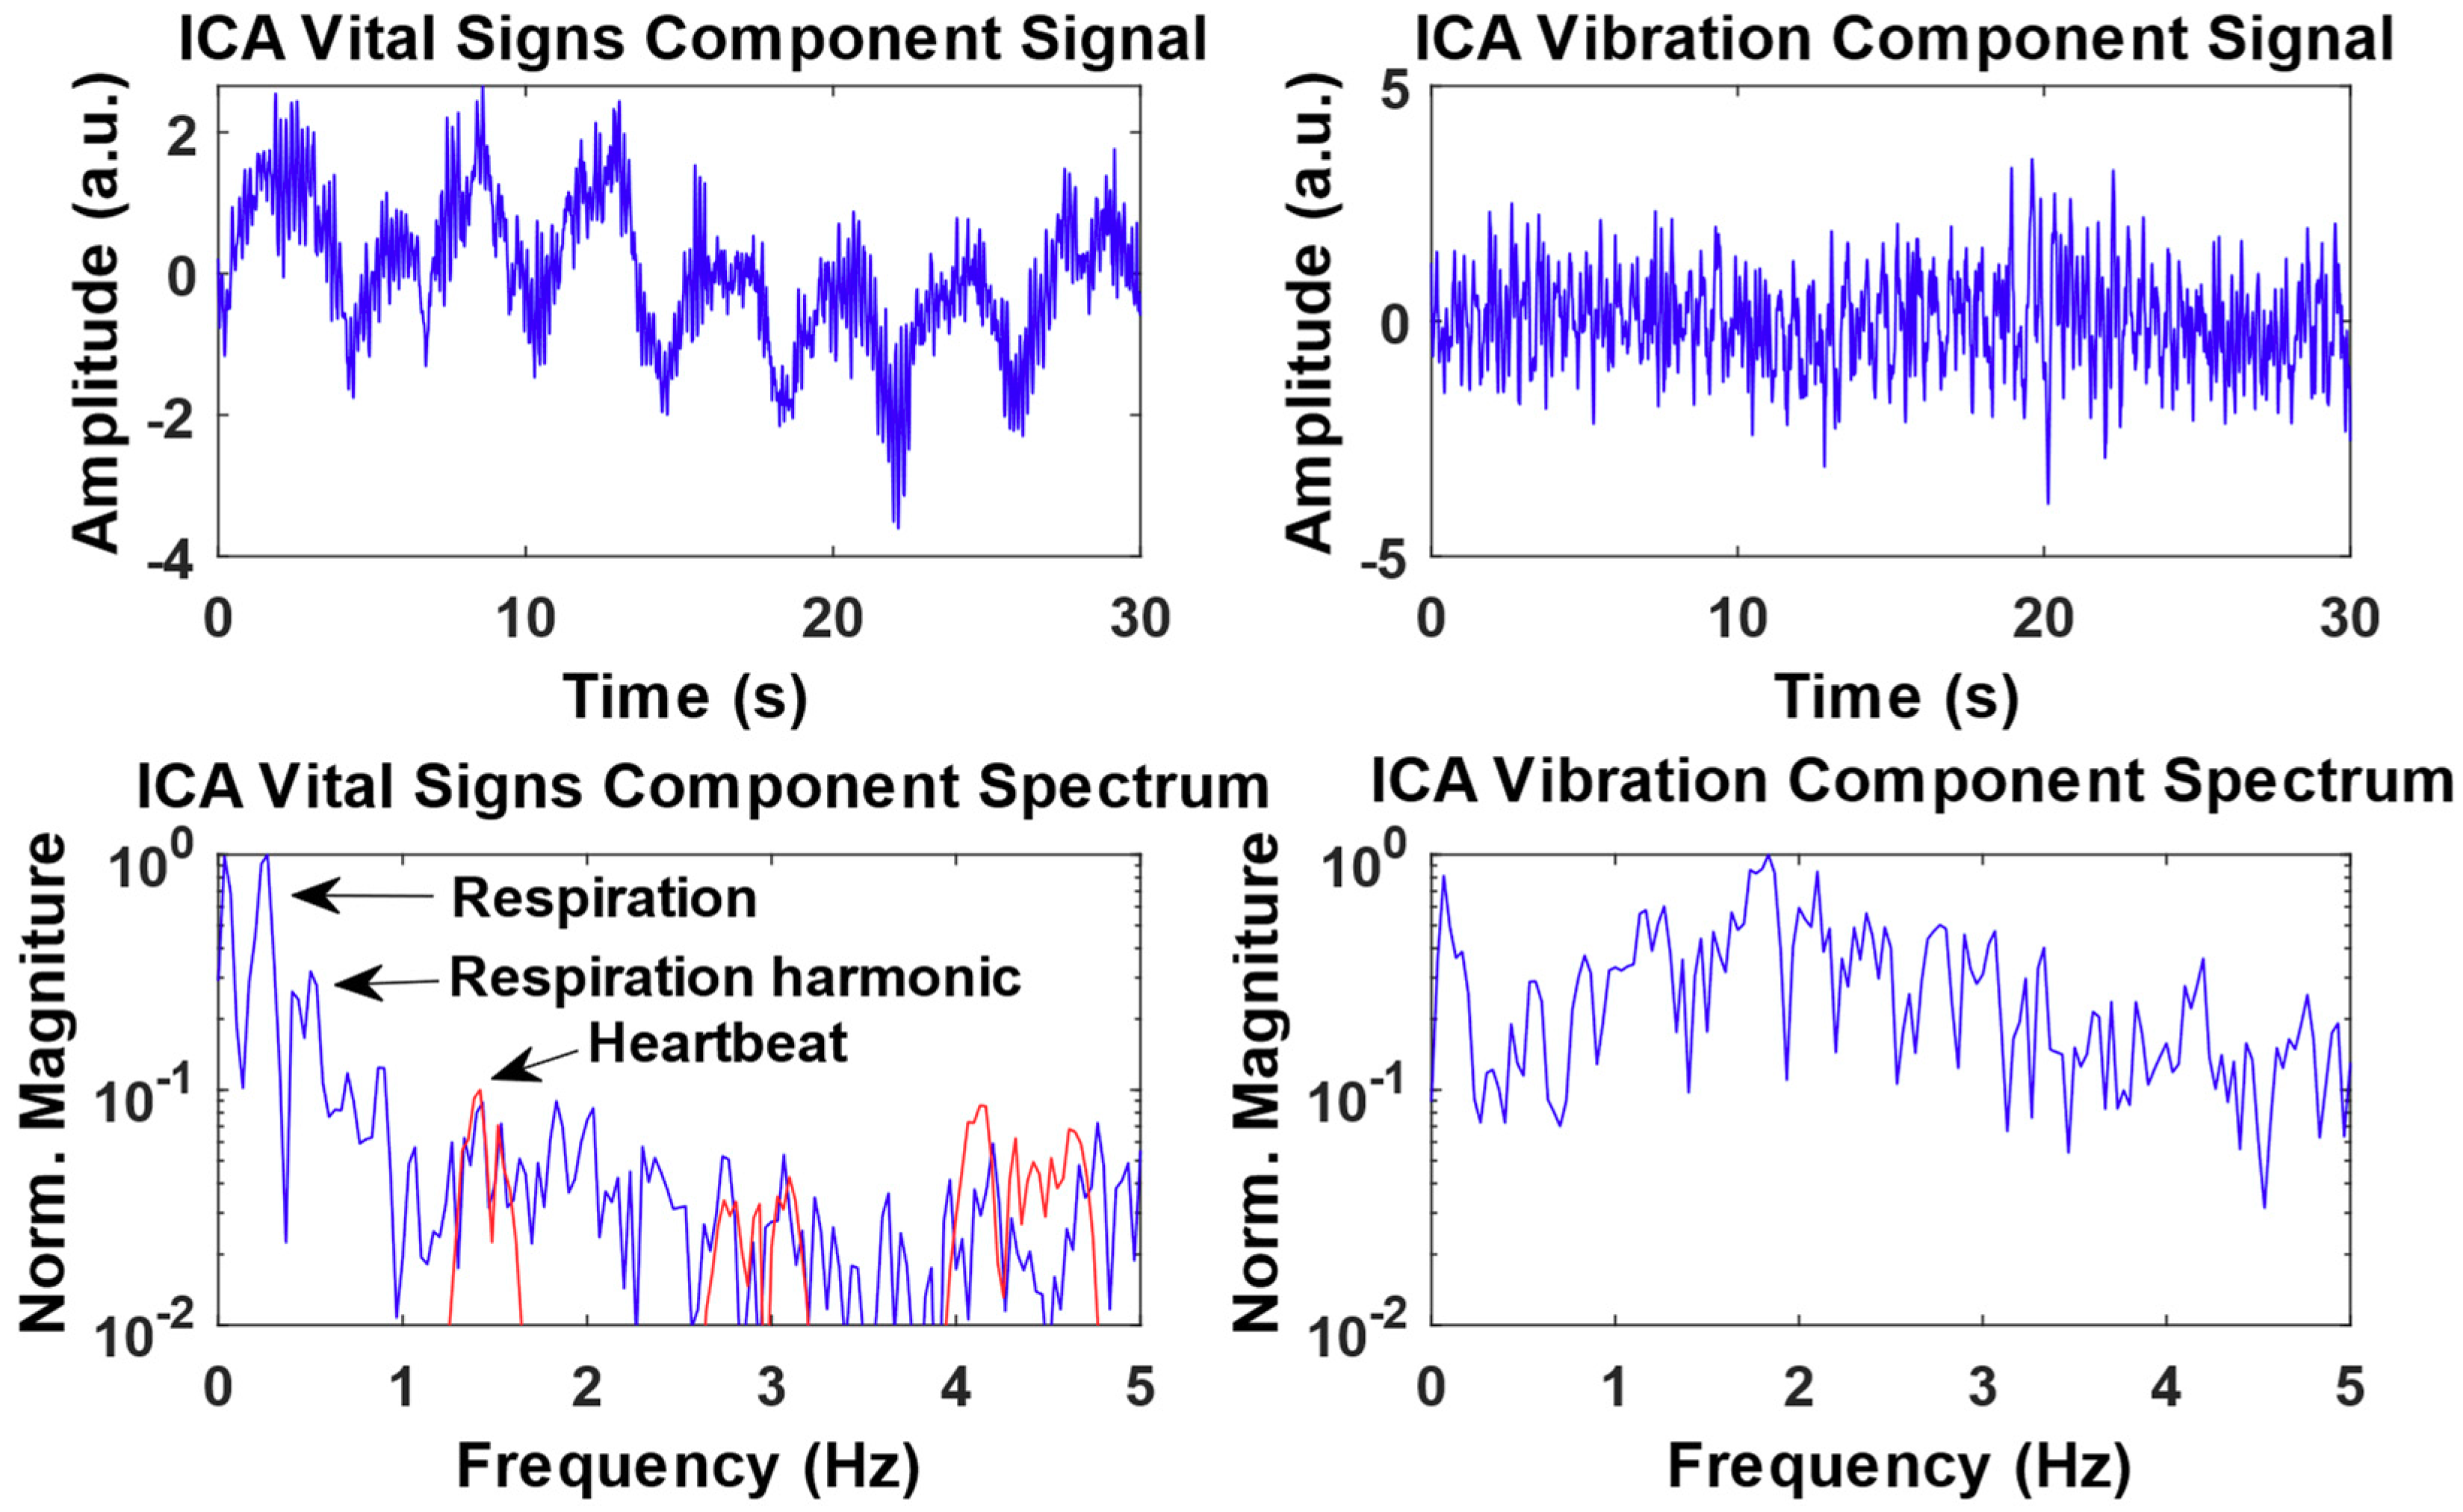
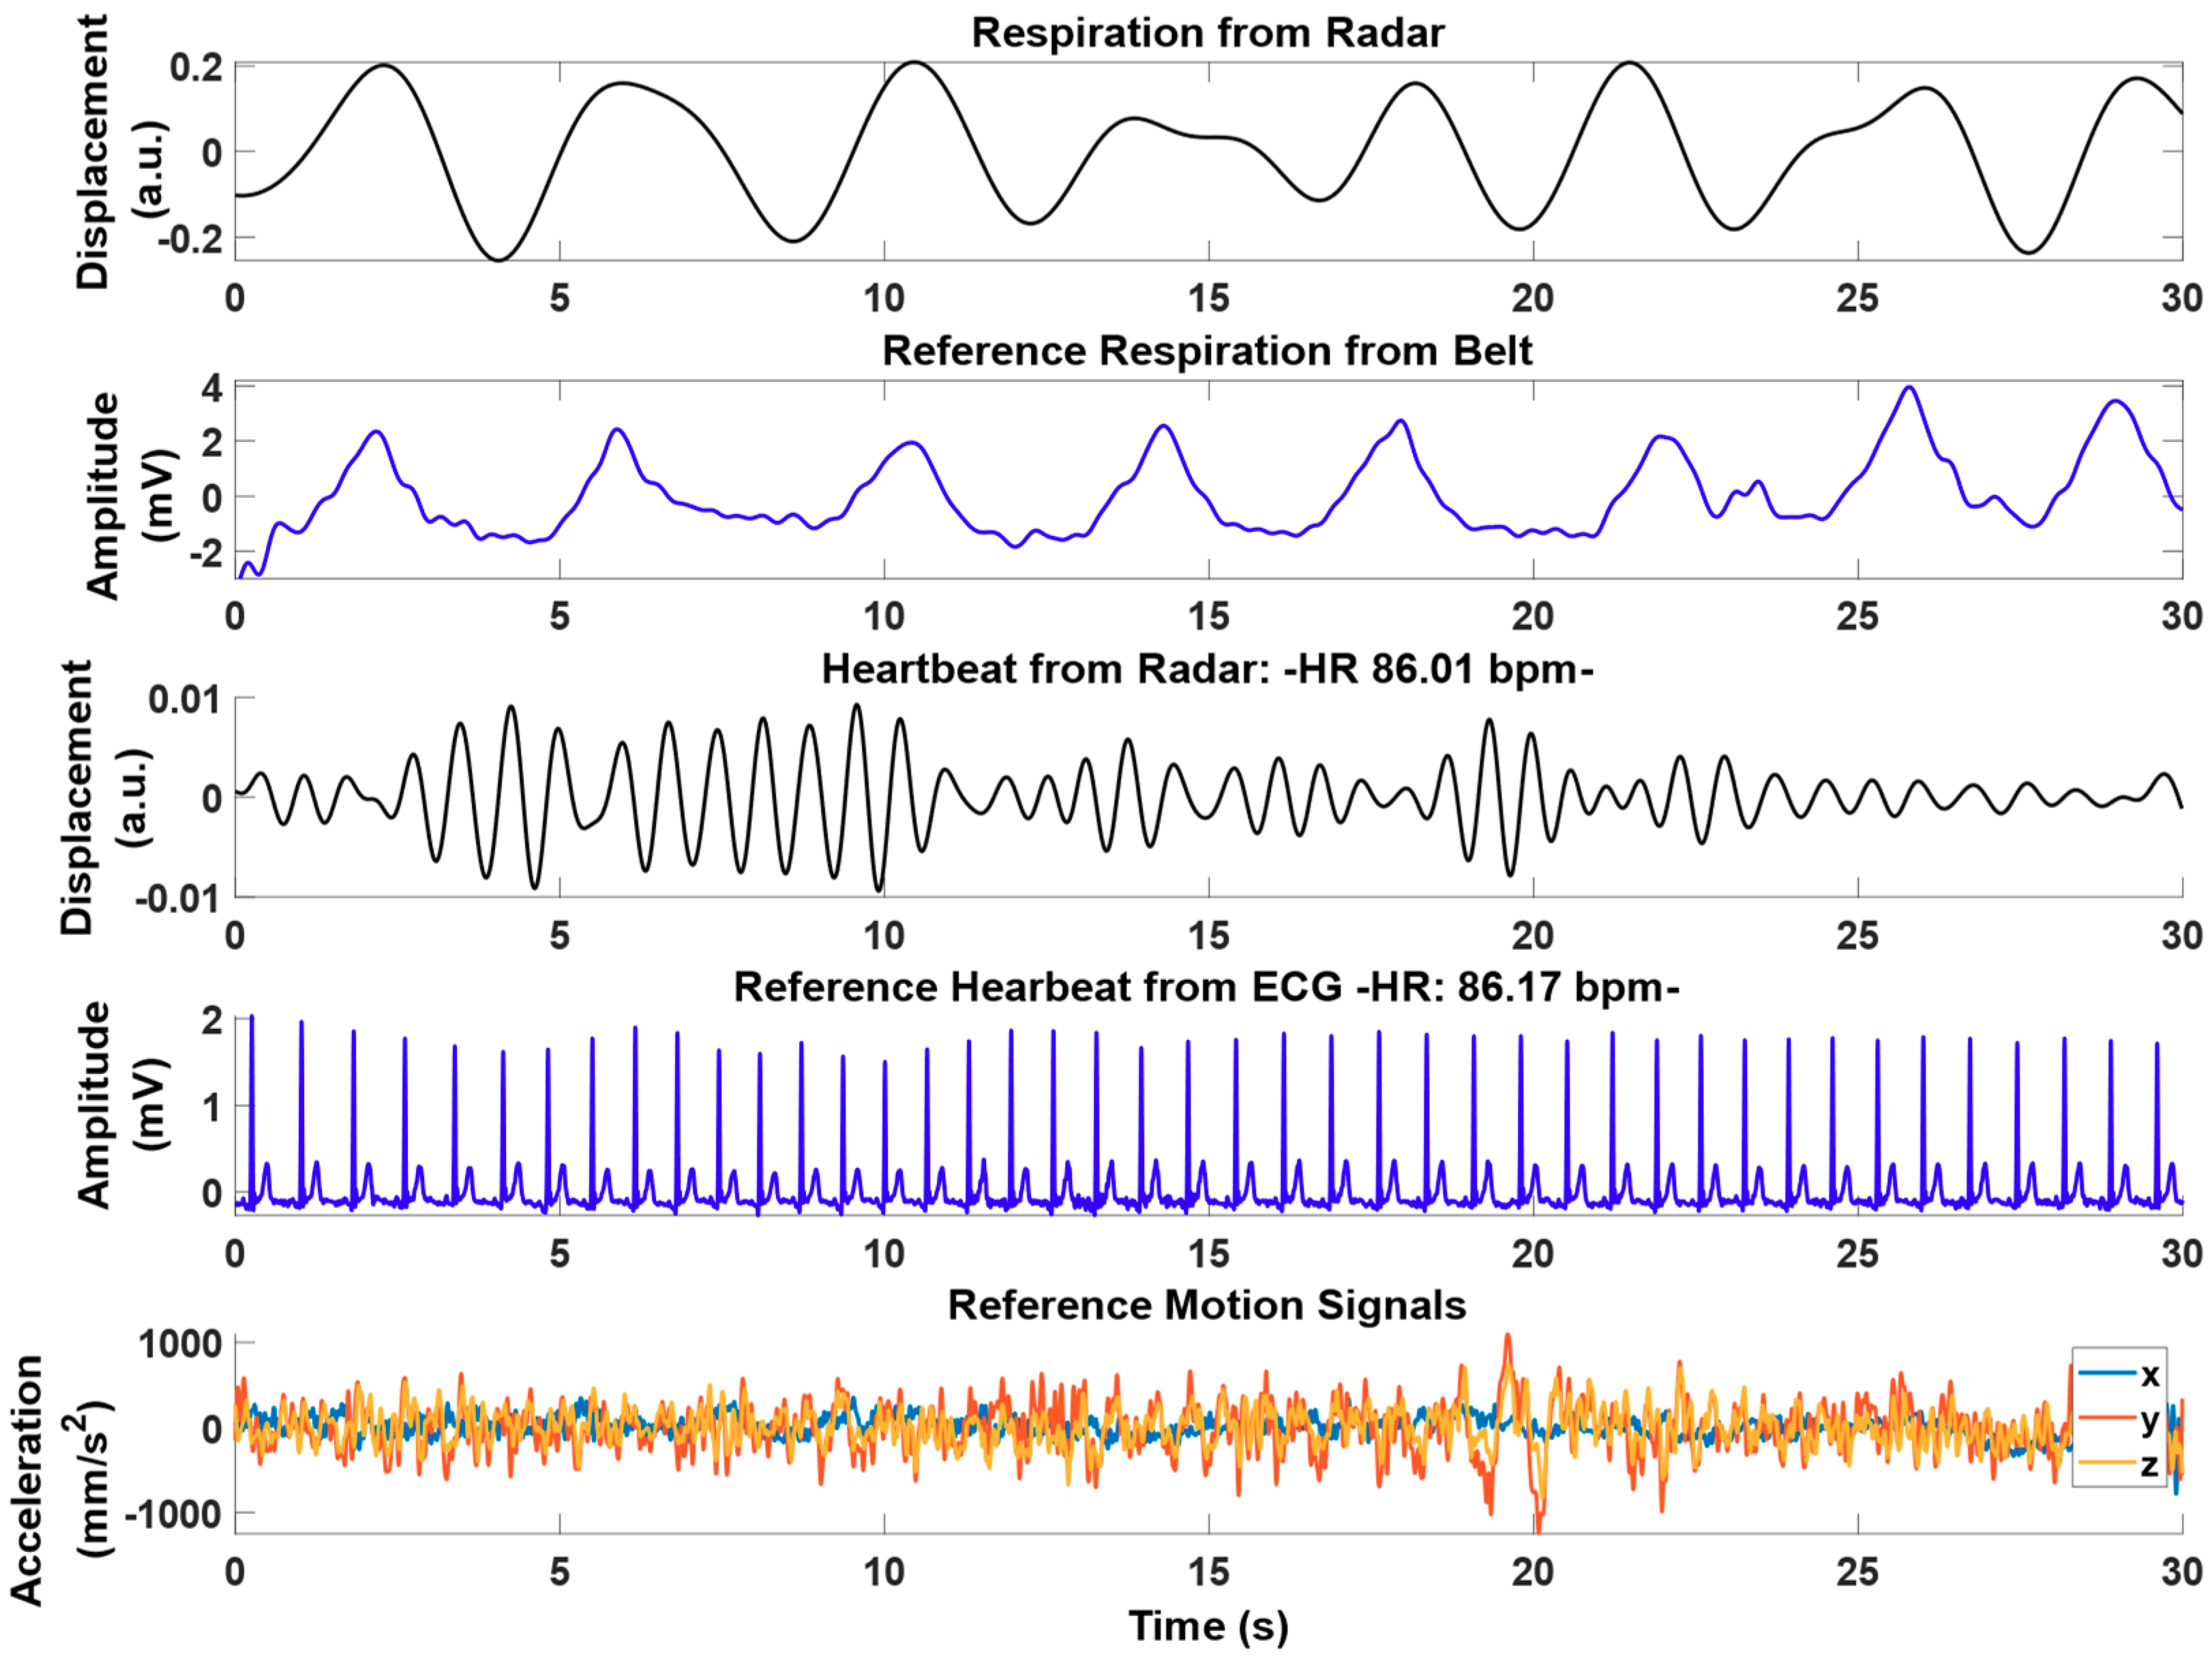
Figure 7, Figure 8, Figure 9 and Figure 10 show a proof-of-concept result of vital signs monitoring while driving at 120 km/h on the highway. Figure 7 shows the time domain ECG signal from the reference and its relative spectrum. The heartbeat peak is clearly visible at 1.43 Hz in the ECG spectrum. Figure 8 shows the radar Doppler Signal after the linear demodulation, the z-acceleration, and their relative spectra. In the Doppler signal, the vital signs contribution is corrupted by the vibration. In fact, although the respiration signal is visible, the heartbeat is buried into the vibration. This is confirmed by the fact that there is no peak at 1.43 Hz in the Doppler signal spectrum while there is an in-band peak at about 1.17 Hz. Figure 9 is the result of the ICA and it shows the separated phase contributions of the vital signs and of the vibration. In the spectrum of the vital signs output of the ICA the 1.43 Hz heartbeat peak is clearly visible. Finally, Figure 10 shows the time domain signals of the extracted vital signs, of the reference, and the x-y-z accelerations. The average heart rate measured with the radar and with the ECG agree.
As seen in Figure 10, this proof-of-concept experiment shows that the radar is able to correctly measure the respiration signal and, after applying the proposed motion artefact algorithms, also the average heartbeat during driving. Further validation will be performed, and further improvements to both the signal processing algorithms and radar integration inside the car are expected to improve the performance further, including the measurement of individual beat-to-beat intervals during driving conditions.

4. Discussion

It was shown, in a study on 5 subjects in highway and city driving conditions, that the proposed capacitive ECG system can provide accurate beat detection, heart rate and individual R-R intervals, as well as full ECG waveforms, through clothing. By applying the proposed motion artefact algorithms, a real-world performance was achieved better than the previous state of the art. If desired for a specific application, the accuracy can be further improved by using a stricter classifier for the motion artefact algorithms, at the expense of discarding a higher fraction of the data. Further work is needed to permit capacitive ECG measurement also when thicker clothing (e.g., winter jacket) is worn.
Capacitive respiration measurement was also demonstrated, but with a lower coverage than for ECG. In future work, its performance is expected to benefit from signal quality algorithms and a multi-electrode array approach similar to ECG.
Proof-of-concept experiments have shown that the proposed radar sensor can provide respiration and, through the application of the proposed motion reduction algorithms, average heart rate during driving. Radar-based measurement of individual beat to beat intervals for heart rate variability remains a challenge during driving conditions. Further work on motion reduction algorithms as well as radar integration into the vehicle is needed to address those challenges.
It is expected that in the end a sensor fusion of both methods will provide the most robust results.

Author Contributions

Conceptualization, methodology, investigation, analysis of the capacitive sensor experiments: I.D.C., A.P., T.T. Conceptualization, methodology, investigation, analysis of the radar sensor experiments: M.M., T.T. Writing—original draft: M.M., T.T. Writing—review and editing: all authors. Supervision: R.P., C.V.H., T.T.

Funding

This research received no external funding.

Acknowledgments

Authors wish to thank Fokko Wieringa for his assistance in the investigation approval procedure and the ANWB driving school in Eindhoven, the Netherlands, for their support in the execution of the experiments.

Conflicts of Interest

The authors declare no conflict of interest.

References

  1. Vicente, J.; Laguna, P.; Bartra, A.; Bailón, R. Drowsiness detection using heart rate variability. Med. Biol. Eng. Comput. 2016, 54, 927–937. [Google Scholar] [CrossRef] [PubMed]
  2. Taelman, J.; Vandeput, S.; Spaepen, A.; van Huffel, S. Influence of Mental Stress on Heart Rate and Heart Rate Variability. IFMBE Proc. 2009, 22, 1366–1369. [Google Scholar]
  3. Valderas, M.T.; Bolea, J.; Laguna, P.; Vallverdú, M.; Bailón, R. Human emotion recognition using heart rate variability analysis with spectral bands based on respiration. In Proceedings of the 2015 37th Annual International Conference of the IEEE Engineering in Medicine and Biology Society (EMBC), Milan, Italy, 25–29 August 2015; pp. 6134–6137. [Google Scholar]
  4. Vandecasteele, K.; De Cooman, T.; Gu, Y.; Cleeren, E.; Claes, K.; Paesschen, W.V.; Huffel, S.V.; Hunyadi, B. Automated epileptic seizure detection based on wearable ECG and PPG in a hospital environment. Sensors 2017, 17, 2338. [Google Scholar] [CrossRef] [PubMed]
  5. Orlandi, G.; Fanucchi, S.; Strata, G.; Pataleo, L.; Landucci Pellegrini, L.; Prontera, C.; Martini, A.; Murri, L. Transient autonomic nervous system dysfunction during hyperacute stroke. Acta Neurol. Scand. 2000, 102, 317–321. [Google Scholar] [CrossRef] [PubMed]
  6. Thygesen, K.; Alpert, J.S.; Jaffe, A.S.; Simoons, M.L.; Chaitman, B.R.; White, H.D. Third universal definition of myocardial infarction. Glob. Heart 2012, 7, 275–295. [Google Scholar] [CrossRef] [PubMed]
  7. Patel, S.; Park, H.; Bonato, P.; Chan, L.; Rodgers, M. A review of wearable sensors and systems with application in rehabilitation. J. Neuroeng. Rehabil. 2012, 9, 21. [Google Scholar] [CrossRef]
  8. Pacela, A.F. Impedance pneumography—A survey of instrumentation techniques. Med. Biol. Eng. 1966, 4, 1–15. [Google Scholar] [CrossRef]
  9. Castro, I.D.; Morariu, R.; Torfs, T.; van Hoof, C.; Puers, R. Robust wireless capacitive ECG system with adaptive signal quality and motion artifact reduction. In Proceedings of the 2016 IEEE International Symposium on Medical Measurements and Applications (MeMeA), Benevento, Italy, 15–18 May 2016; pp. 1–6. [Google Scholar]
  10. Obeid, D.; Zaharia, G.; Sadek, S.; Zein, G. Microwave doppler radar for heartbeat detection vs electrocardiogram. Microw. Opt. Technol. Lett. 2012, 54, 2610–2617. [Google Scholar] [CrossRef] [Green Version]
  11. Li, C.; Peng, Z.; Huang, T.; Fan, T.; Wang, F.; Horng, T.; Muñoz-Ferreras, J.; Gómez-García, R.; Ran, L.; Lin, J. A Review on recent progress of portable short range noncontact microwave radar systems. IEEE Trans. Microw. Theory Tech. 2017, 65, 1692–1706. [Google Scholar] [CrossRef]
  12. Mercuri, M.; Soh, P.J.; Pandey, G.; Karsmakers, P.; Vandenbosch, G.A.E.; Leroux, P.; Schreurs, D. Analysis of an indoor biomedical radar based system for health monitoring. IEEE Trans. Microw. Theory Tech. 2013, 61, 2061–2068. [Google Scholar] [CrossRef]
  13. Wang, F.K.; Chou, Y.R.; Chiu, Y.C.; Horng, T.S. Chest-worn health monitor based on a bistatic self injection-locked radar. IEEE Trans. Biomed. Eng. 2015, 62, 2931–2940. [Google Scholar] [CrossRef] [PubMed]
  14. Morgan, D.R.; Zierdt, M.G. Novel signal processing techniques for Doppler radar cardiopulmonary sensing. Signal Process. 2009, 89, 45–66. [Google Scholar] [CrossRef]
  15. Mikhelson, I.V.; Bakhtiari, S.; Elmer, T.W., II; Sahakian, A.V. Email author Remote sensing of patterns of cardiac activity on an ambulatory subject using millimeter-wave interferometry and statistical methods. Med. Biol. Eng. Comput. 2013, 51, 135–142. [Google Scholar] [CrossRef] [PubMed]
  16. Li, C.; Jenshan, L. Random Body Movement Cancellation in Doppler Radar Vital Sign Detection. IEEE Trans. Microw. Theory Tech. 2008, 56, 3143–3152. [Google Scholar]
  17. Peng, Z.; Muñoz-Ferreras, J.M.; Tang, Y.; Liu, C.; Gómez-García, R.; Ran, L.; Li, C. A portable FMCW interferometry radar with programmable low-IF architecture for localization, ISAR imaging, and vital sign tracking. IEEE Trans. Microw. Theory Tech. 2017, 65, 1334–1344. [Google Scholar] [CrossRef]
  18. Hui, X.; Kan, E.C. Monitoring vital signs over multiplexed radio by near-field coherent sensing. Nat. Electron. 2018, 1, 74–78. [Google Scholar] [CrossRef]
  19. Mercuri, M.; Liu, Y.-H.; Lorato, I.; Torfs, T.; Bourdoux, A.; Van Hoof, C. Frequency-Tracking CW Doppler Radar Solving Small-Angle Approximation and Null Point Issues in Non-Contact Vital Signs Monitoring. IEEE Trans. Biomed. Circuits Syst. 2017, 11, 671–680. [Google Scholar] [CrossRef]
  20. Mercuri, M.; Liu, Y.-H.; Young, A.; Torfs, T.; Bourdoux, A.; Van Hoof, C.C. Digital Phase-Tracking Doppler Radar for Accurate Displacement Measurements and Vital Signs Monitoring. In Proceedings of the 2017 IEEE MTT-S International Microwave Symposium (IMS), Honolulu, HI, USA, 4–9 June 2017; pp. 1–4. [Google Scholar]
  21. Mercuri, M.; Liu, Y.-H.; Lorato, I.; Torfs, T.; Wieringa, F.; Bourdoux, A.; Van Hoof, C. A Direct Phase-Tracking Doppler Radar Using Wavelet Independent Component Analysis for Non-Contact Respiratory and Heart Rate Monitoring. IEEE Trans. Biomed. Circuits Syst. 2018, 12, 632–643. [Google Scholar] [CrossRef]
  22. Mercuri, M.; Liu, Y.-H.; Sheelavant, S.; Polito, S.; Torfs, T.; Van Hoof, C. Digital Linear Discrete FMCW Radar for Healthcare Application. In Proceedings of the 2019 IEEE MTT-S International Microwave Symposium (IMS), Boston, MA, USA, 2–7 June 2019; pp. 1–3. [Google Scholar]
  23. Mercuri, M.; Lorato, I.; Liu, Y.-H.; Wieringa, F.; Van Hoof, C.; Torfs, T. Vital-sign monitoring and spatial tracking of multiple people using a contactless radar-based sensor. Nat. Electron. 2019, 2, 252–262. [Google Scholar] [CrossRef]
  24. Liu, Y.-H.; Sheelavant, S.; Mercuri, M.; Mateman, P.; Dijkhuis, J.; Zomagboguelou, W.; Breeschoten, A.; Traferro, S.; Zhan, Y.; Torfs, T. 9.3 A680 μW Burst-Chirp UWB Radar Transceiver for Vital Signs and Occupancy Sensing up to 15m Distance. In Proceedings of the 2019 IEEE International Solid- State Circuits Conference—(ISSCC), San Francisco, CA, USA, 17–21 February 2019; pp. 166–167. [Google Scholar]
  25. Schires, E.; Georgiou, P.; Lande, T.S. Vital Sign Monitoring Through the Back Using an UWB Impulse Radar With Body Coupled Antennas. IEEE Trans. Biomed. Circuits Syst. 2018, 12, 292–302. [Google Scholar] [CrossRef]
  26. Castro, I.D.; Mercuri, M.; Torfs, T.; Lorato, I.; Puers, R.; van Hoof, C. Sensor Fusion of Capacitively Coupled ECG and Continuous-Wave Doppler Radar for Improved Unobtrusive Heart Rate Measurements. IEEE J. Emerg. Sel. Top. Circuits Syst. 2018, 8, 316–328. [Google Scholar] [CrossRef]
  27. Castro, I.D.; Patel, A.; Torfs, T.; Puers, R.; van Hoof, C. Capacitive multi-electrode array with real-time electrode selection for unobtrusive ECG & BIOZ monitoring. In Proceedings of the 2019 41st Annual International Conference of the IEEE Engineering in Medicine & Biology Society (EMBC), Berlin, Germany, 23–27 July 2019. [Google Scholar]
  28. Castro, I.D.; Varon, C.; Moeyersons, J.; Gomez, A.V.; Morales, J.; Deviaene, M.; Torfs, T.; van Huffel, S.; Puers, R.; van Hoof, C. Data Quality Assessment of Capacitively-coupled ECG signals. In Proceedings of the 2019 Computing in Cardiology Conference (CinC), Singapore, 8–11 September 2019. [Google Scholar]
  29. Castro, I.D.; Varon, C.; Torfs, T.; van Huffel, S.; Puers, R.; van Hoof, C. Evaluation of a multichannel non-contact ECG system and signal quality algorithms for sleep apnea detection and monitoring. Sensors 2018, 18, 577. [Google Scholar] [CrossRef] [PubMed]
  30. Choi, M.; Jeong, J.J.; Kim, S.H.; Kim, S.W. Reduction of motion artifacts and improvement of R peak detecting accuracy using adjacent non-intrusive ECG sensors. Sensors 2016, 16, 715. [Google Scholar] [CrossRef] [PubMed]
  31. Antink, C.H.; Breuer, E.; Uguz, D.U.; Leonhardt, S. Signal-Level Fusion With Convolutional Neural Networks for Capacitively Coupled ECG in the Car. In Proceedings of the 2018 Computing in Cardiology Conference (CinC), Maastricht, The Netherlands, 23–26 September 2018. [Google Scholar]
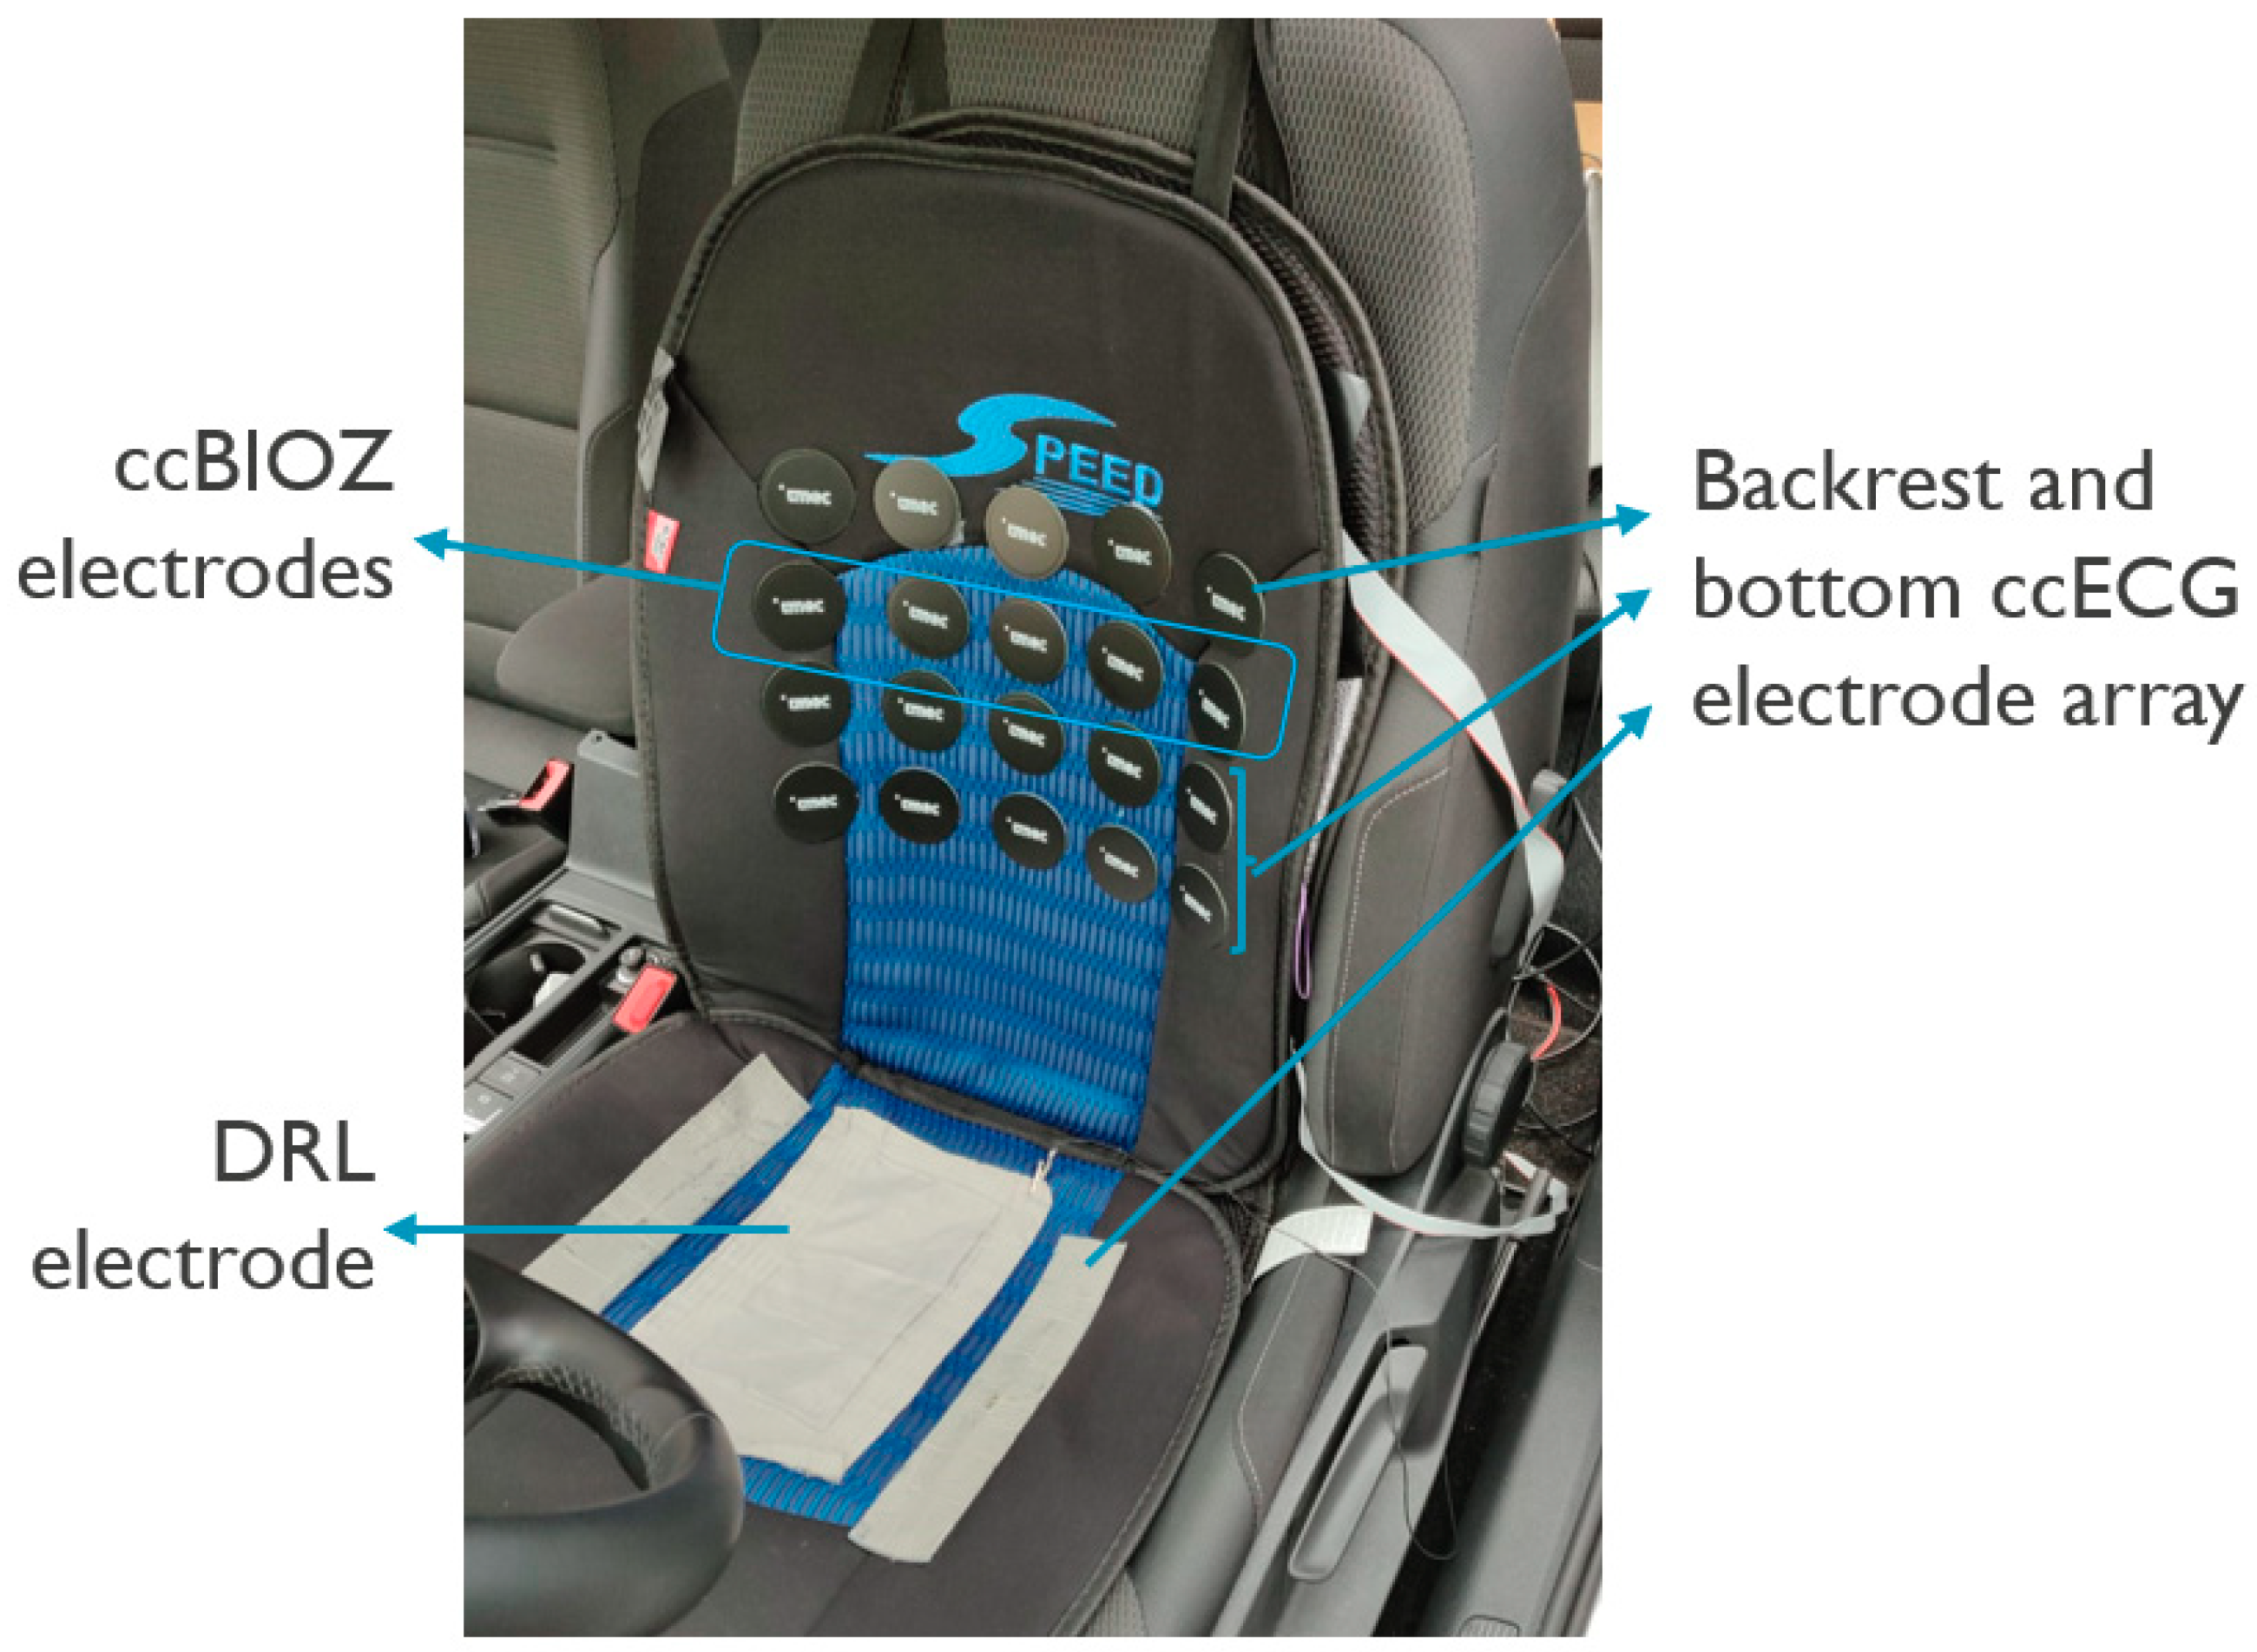
Figure 1. Capacitive sensor system installed in a car used for the on-road evaluation. It includes a 17-electrode array for ccECG measurement, 4 electrodes for ccBioZ measurement (plus one unused electrode), and a capacitive Driven Right Leg (DRL) plate to reduce common mode interference.
Applsci 09 03994 g001
Figure 2. Signal processing path applied to the capacitive sensor data including ccECG and reference ECG (a) and ccBIOZ and reference respiration signals from a strapped belt (b). The signal processing for ccECG and reference ECG in (a) includes performance evaluation of the signals without applying artefact handling algorithms (upper path) as well as the result of these algorithms (lower path branch).
Applsci 09 03994 g002
Figure 3. (a) Photo of the radar sensor; (b) Block diagram of the radar sensor system; (c,d) Experimental set-up and physical positioning of the radar sensor in the car.
Applsci 09 03994 g003
Figure 4. (a) Histogram of the absolute difference between R-R intervals extracted from the capacitive ECG and from the reference ECG over all 5 subjects and all driving scenarios (n = 13,148 heartbeats). (b) Cumulative distribution of the absolute difference. Note the horizontal axes in both graphs are logarithmic for clarity.
Applsci 09 03994 g004
Figure 5. Example of ccECG and ccBIOZ signals acquired from a driver (a) driving at constant speed of 120 km/h and (b) starting from stationary position from a traffic light to a speed of 30 km/h. It is seen that slight distortion is caused by the transition between stationary and the constant speed as a consequence of the back of the driver moving in relation to the seat backrest. Reference motion signals from the car confirm the abrupt speed change.
Applsci 09 03994 g005aApplsci 09 03994 g005b
Figure 6. Comparison between the vital signs extracted with the radar and the reference when the driver is normally breathing on the seat with the car put in neutral with the engine on. In this test, the vibrations of the car are negligible as indicated by the very small acceleration values. Due to the signal processing methods used, the displacement is expressed in arbitrary units and not in radians.
Applsci 09 03994 g006
Figure 7. Time domain ECG signal from the reference and its relative spectrum. The subject was driving at 120 km/h on the highway.
Applsci 09 03994 g007
Figure 8. Doppler Signal extracted using the linear demodulation technique (expressed in mV instead of radians due to the signal processing method used), the z-acceleration, and their relative spectra. The subject was driving at 120 km/h on the highway. The respiration signal is clearly visible both in the time domain Doppler signal as well as in the spectrum, but the heartbeat signal is buried in the noise. The reference ECG signal (normalized to the Doppler signal level to facilitate comparison) is superimposed in red.
Applsci 09 03994 g008
Figure 9. Result of the ICA algorithm. The output consists of two components: the vibration component and the vital signs component. The vibration component is nearly identical to the input accelerometer signal. In the vital signs component spectrum, the heartbeat spectral peak at 1.43 Hz (86 bpm) has been lifted out of the noise by the ICA algorithm, and agrees with the reference ECG spectrum superimposed in red (normalized to the radar signal level). The amplitudes are expressed in a.u. instead of radians due to signal processing methods used. The subject was driving at 120 km/h on the highway.
Applsci 09 03994 g009
Figure 10. Comparison between the vital signs extracted with the radar and the reference driving at 120 km/h. The top two traces show an example of the respiration from radar and from the reference belt, showing a clear correlation. The third and fourth traces show an example of the heartbeat signal from the radar and from the reference ECG. The bottom trace shows the accelerometer signals, which show significant vibration amplitudes.
Applsci 09 03994 g010
Table 1. Overview of recorded subjects for the capacitive sensor system evaluation.
SubjectRecording LengthNumber of Clothing Layers Worn
CityHighway
144 min35 min1
216 min15 min2
3n/a32 min1
438 min46 min1
539 min36 min2
Table 2. R peak detection and heart rate performance before and after motion artefact algorithms. The percentage of signal removed is a result of the quality-based motion artefact handling. * The mean is not calculated for numbers expressed as percentages since the sample sizes are not identical.
Subj.TrafficBefore Motion Artefact AlgorithmsAfter Motion Artefact Algorithms
R Peak Detection SensitivityR Peak Detection Positive PredictivityHR Mean Absolute Error (bpm)R Peak Detection SensitivityR Peak Detection Positive PredictivityHr Mean Absolute Error (bpm)% of Signal Removed
1highway94.67%95.15%2.2897.58%98.26%0.8610.3%
city89.46%92.34%2.1897.11%97.23%1.2829.7%
2highway76.71%84.65%3.0698.28%99.03%1.5747.3%
city59.27%66.53%12.6899.36%100.00%0.9382.5%
3highway98.05%98.04%1.1099.58%99.49%0.369.8%
cityn/an/an/an/an/an/an/a
4highway99.63%99.89%0.0599.82%99.92%0.012.8%
city99.28%98.97%0.3599.31%99.05%0.220.3%
5highway89.92%86.57%3.3796.65%91.51%2.3020.6%
city92.74%87.45%6.5693.99%88.64%5.8011.2%
Medianhighway94.67%95.15%2.2898.28%99.03%0.8610.29%
city91.10%89.90%4.3798.21%98.14%1.1120.41%
overall92.74%92.34%2.2898.28%99.03%0.9311.15%
Meanhighway**1.97**1.02*
city**5.44**2.06*
overall**3.51**1.48*
Table 3. Beat-to-beat R-R interval performance metrics (after motion artefact algorithms), and respiration performance (without motion artefact algorithms). * The mean is not calculated for numbers expressed as percentages since the sample sizes are not identical.
Subj.TrafficECG after Motion Artefact AlgorithmsRespiration
R-R Interval Mean Absolute Error (ms)R-R Interval Mean Absolute Percentual Error (%)95th Percentile Absolute R-R Interval Error (ms)SDNN Mean Absolute Error (ms)Coverage R-R Interval within 5 msCoverage Respiration Rate within 3 bpm
1highway18.671.39%25.3952.4391.16%68.57%
city25.441.98%52.7364.7790.15%61.36%
2highway28.642.54%23.24119.1293.85%26.67%
city25.000.84%50.7858.1194.61%25.00%
3highway5.210.39%1.9510.0995.93%68.75%
cityn/an/an/an/an/an/a
4highway1.480.11%1.950.1397.50%26.09%
city5.430.41%5.868.1794.34%47.37%
5highway67.724.05%391.2188.3459.37%66.67%
city130.406.38%369.48132.5858.94%64.10%
Medianhighway18.671.39%23.2452.4393.85%66.67%
city25.221.41%51.7661.4492.25%54.37%
overall25.001.39%25.3958.1193.85%61.36%
Meanhighway24.34*88.7554.02**
city46.57*119.7165.91**
overall34.22*102.5159.30**