1. Introduction
Nowadays, foot and ankle pain and related disabilities are very common, with some studies indicating that around 24% of people aged over 45 years report frequent foot pain [
1]. It has also been shown that abnormal foot posture is associated with foot pain [
2] as well as with lower limb injuries and pathologies [
3].
Also, problems associated with abnormal gait include Fractures, Ankle Sprain, Pimple Pain or Plantar Fasciitis, among others [
4]. Hence, it is important to characterize foot posture (static) and foot function (how the foot moves when walking), with different methods available in the literature [
5].
Abnormal foot postures have recently been experimentally related to the pressure at the base of the foot during the walk [
3,
6]. Therefore, a podiatrist (or physiotherapist) can perform a walking study of the patient’s footprint, in order to detect these problems, prevent related injuries and indicate exercises to correct them. The classic gait study consists of walking in a straight line through a sensorized surface that emulates a path of several meters length: this surface records the measures obtained for each step to analyze it later. The main problem with this analysis mechanism is the psychological component: the patient knows that he/she is being analyzed and tries to walk in the best possible way. With this, in many cases the information received does not correspond to a 100% with the patient’s way of walking [
7].
In this work, we try to avoid this psychological component by developing a smart instrumented footwear insole. Some advances have been done in this field [
8,
9,
10], demonstrating that these devices may have multiple applications such as in the orthopedic field, for the study of foot function; in the orthoprosthetic field, for the design of footwear, insoles and prostheses; in the biomechanical field, for the study of normal gait or pathological; or in sports medicine, for the study of the most appropriate athletic footwear in each athletic modality.
These instrumented footwear insoles are adjusted to the biomechanical anatomy of the foot. The aim of these devices is to obtain tangible data in order to analyze the gait with freedom of movement and without space limitation. Several ways for collecting this data have been implemented in the bibliography but, in this work, we combine the instrumented footwear insole with a Real-Time Deep Learning data analysis system, whose main goal is the gait classification between pronator, supinator and neutral. The main goal of this work is to study the feasibility of the proposed mechanism: the dataset used to train the system will be increased in future works (now it is based on the footsteps from six different people), but in this work we focus on describing the process and its functionality.
Although there is currently no consensus on the terminology, in this paper we will use the common terms “pronation” to indicate when the foot undergoes greater lowering of the medial longitudinal arch and more medial distribution of plantar loading during gait and “supination” when the foot undergoes greater elevation of the medial longitudinal arch and more lateral distribution of plantar loading during gait [
2].
The rest of the paper is divided in the following way: first, the data acquisition is described deeply, presenting the sensors placement study, the embedded system and the user application used. Subsequently, the neural network implementation is described. Next, the training dataset and the classification results are shown. Finally, conclusions are presented.
2. Data Acquisition and Representation
The instrumented footwear insole designed and developed for this work is presented in this section. In order to obtain useful data, sensors must be placed in a particular position inside the insole; so first, it is very important to study the best possible positions for these sensors. The measurement of the force in these positions can be used to derive information about the structure and function of the lower limbs and of the whole body in general.
After this study, the embedded system and the user application are shown.
2.1. Sensors Location
In the bio-mechanics of the march, the walking cycle is defined as the sequence of events that takes place between two successive repetitions of the contact of the same heel with the ground. This cycle can be divided into two phases: the stance phase (when a foot is on the ground) and the swing phase (when the foot is in the air) which alternate for each lower limb. As detailed in a previous study [
11], during the stance phase, three different phases are distinguished according to the area of the foot involved [
12]:
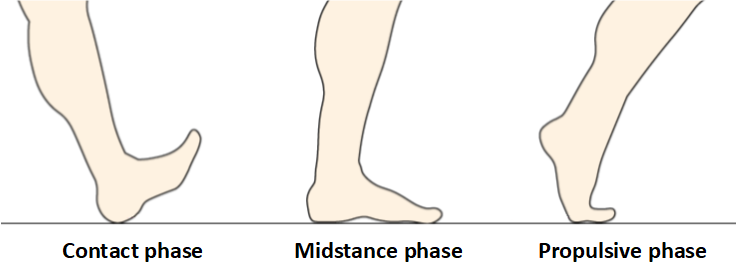
Impact or Initial Contact: first contact zone of the foot with the ground. It is made with the heel and supports a great tension at the moment of impact.
Mid-stance: the second phase. The foot rests completely on the floor and the weight of the person is distributed between the heel and the forefoot through the bridge.
Propulsion or Push off: the last phase. The foot only presents the front part in contact with the ground, and this state corresponds with the moment when it generates the ground reaction force to start the movement again.
During the march, these three phases (see
Figure 1) are constantly repeated alternately between the two feet: while one of them is in phase 3, the other is in phase 1 and vice versa [
13]. Moreover, during the second phase, one of the feet is fully supported on the ground while the other is in the air [
14,
15]. However, this cycle only remains constant if the person is just walking: if the person is running, there is a moment in which both feet are in the air, but these three phases still apply for each foot.
To measure the force exerted to the insole and perform a bio-mechanical study, force sensor resistors (FSR) are placed under the insole [
16]. FSRs provide information about the maximum pressure point, the impulse and the load forces, among others.
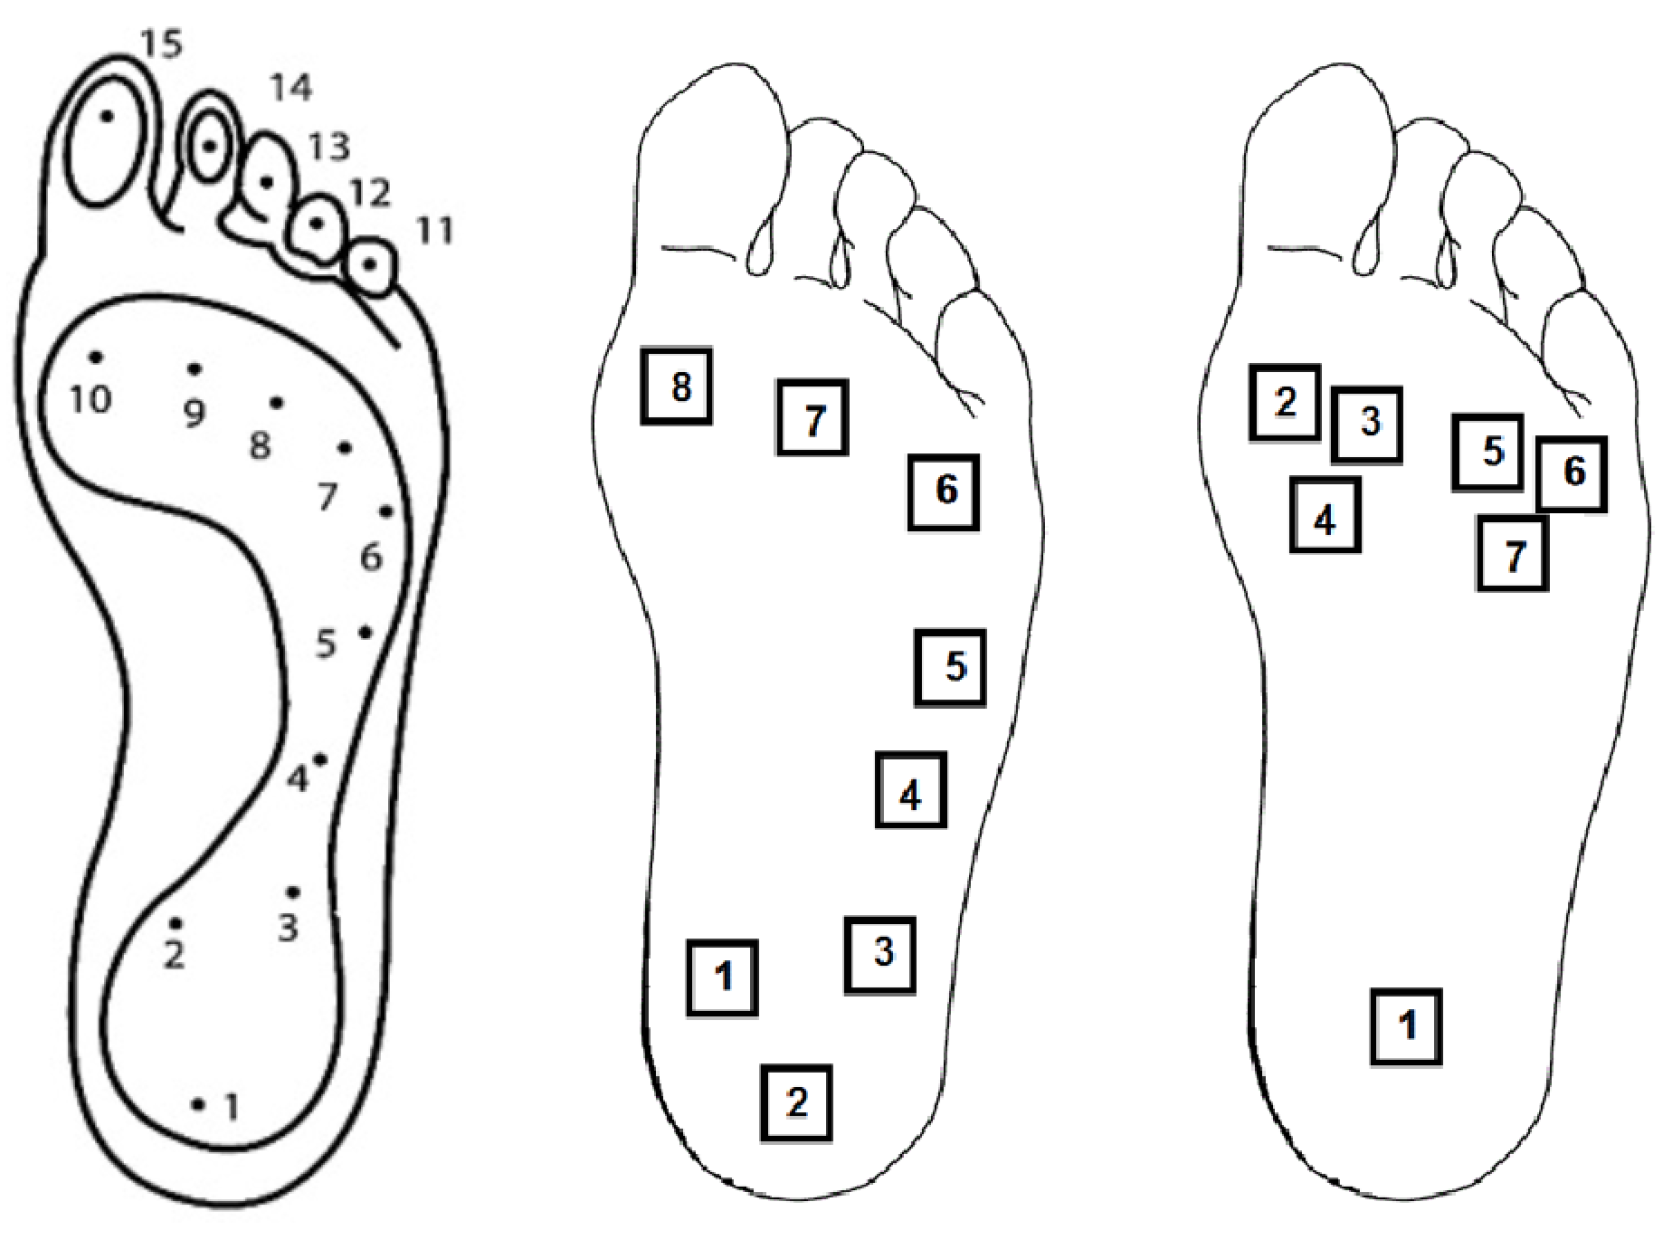
To select the best position to place the sensors, the anatomy of the foot and the types of footprints (pronator, supinator, neutral) are taken into account. According to [
10], the sole can be divided into 15 areas: the heel (areas 1–3), the arch (areas 4–5), the metatarsus (areas 6–10) and the toes (areas 11–15) as shown in
Figure 2-left. With this study, a first version of the instrumented footwear insole was developed [
11], using eight FSRs (see
Figure 2-middle).
Results obtained in [
11] show that the metatarsus area gives more information about the footprints types than the other areas. Moreover, results obtained in other works like [
17] reveal that proximal and distal joints to the medial cuneiform, connected with the metatarsus areas, are the main zones involved in pronation and supination movements, together with the heel joints. To have a better view of the footprint, some sensors are usually placed in the part of the foot arch to quickly and easily detect a supinatory walk (sensors 4 and 5 in
Figure 2-middle); however, the pressure in this area is more influenced by other factors, such as the curvature of the foot, as explained in work [
6].
So, taking into account these previous works and in order to obtain more accuracy about footprints types classification, more FSRs are placed in the metatarsus area in a second version of the instrumented insole. Due to the hardware limitations, sensors placed in other areas were relocated, obtaining an insole with six sensors in the metatarsus area and one sensor in the heel (see
Figure 2-right). In the propulsion phase, only the forefoot is in contact with the ground; so, with the sensors placed in metatarsus area, it is not necessary to place any additional one in the area of the toes [
18].
Once the instrumented footwear insole has been designed, the embedded system is described in the next section.
2.2. Embedded System
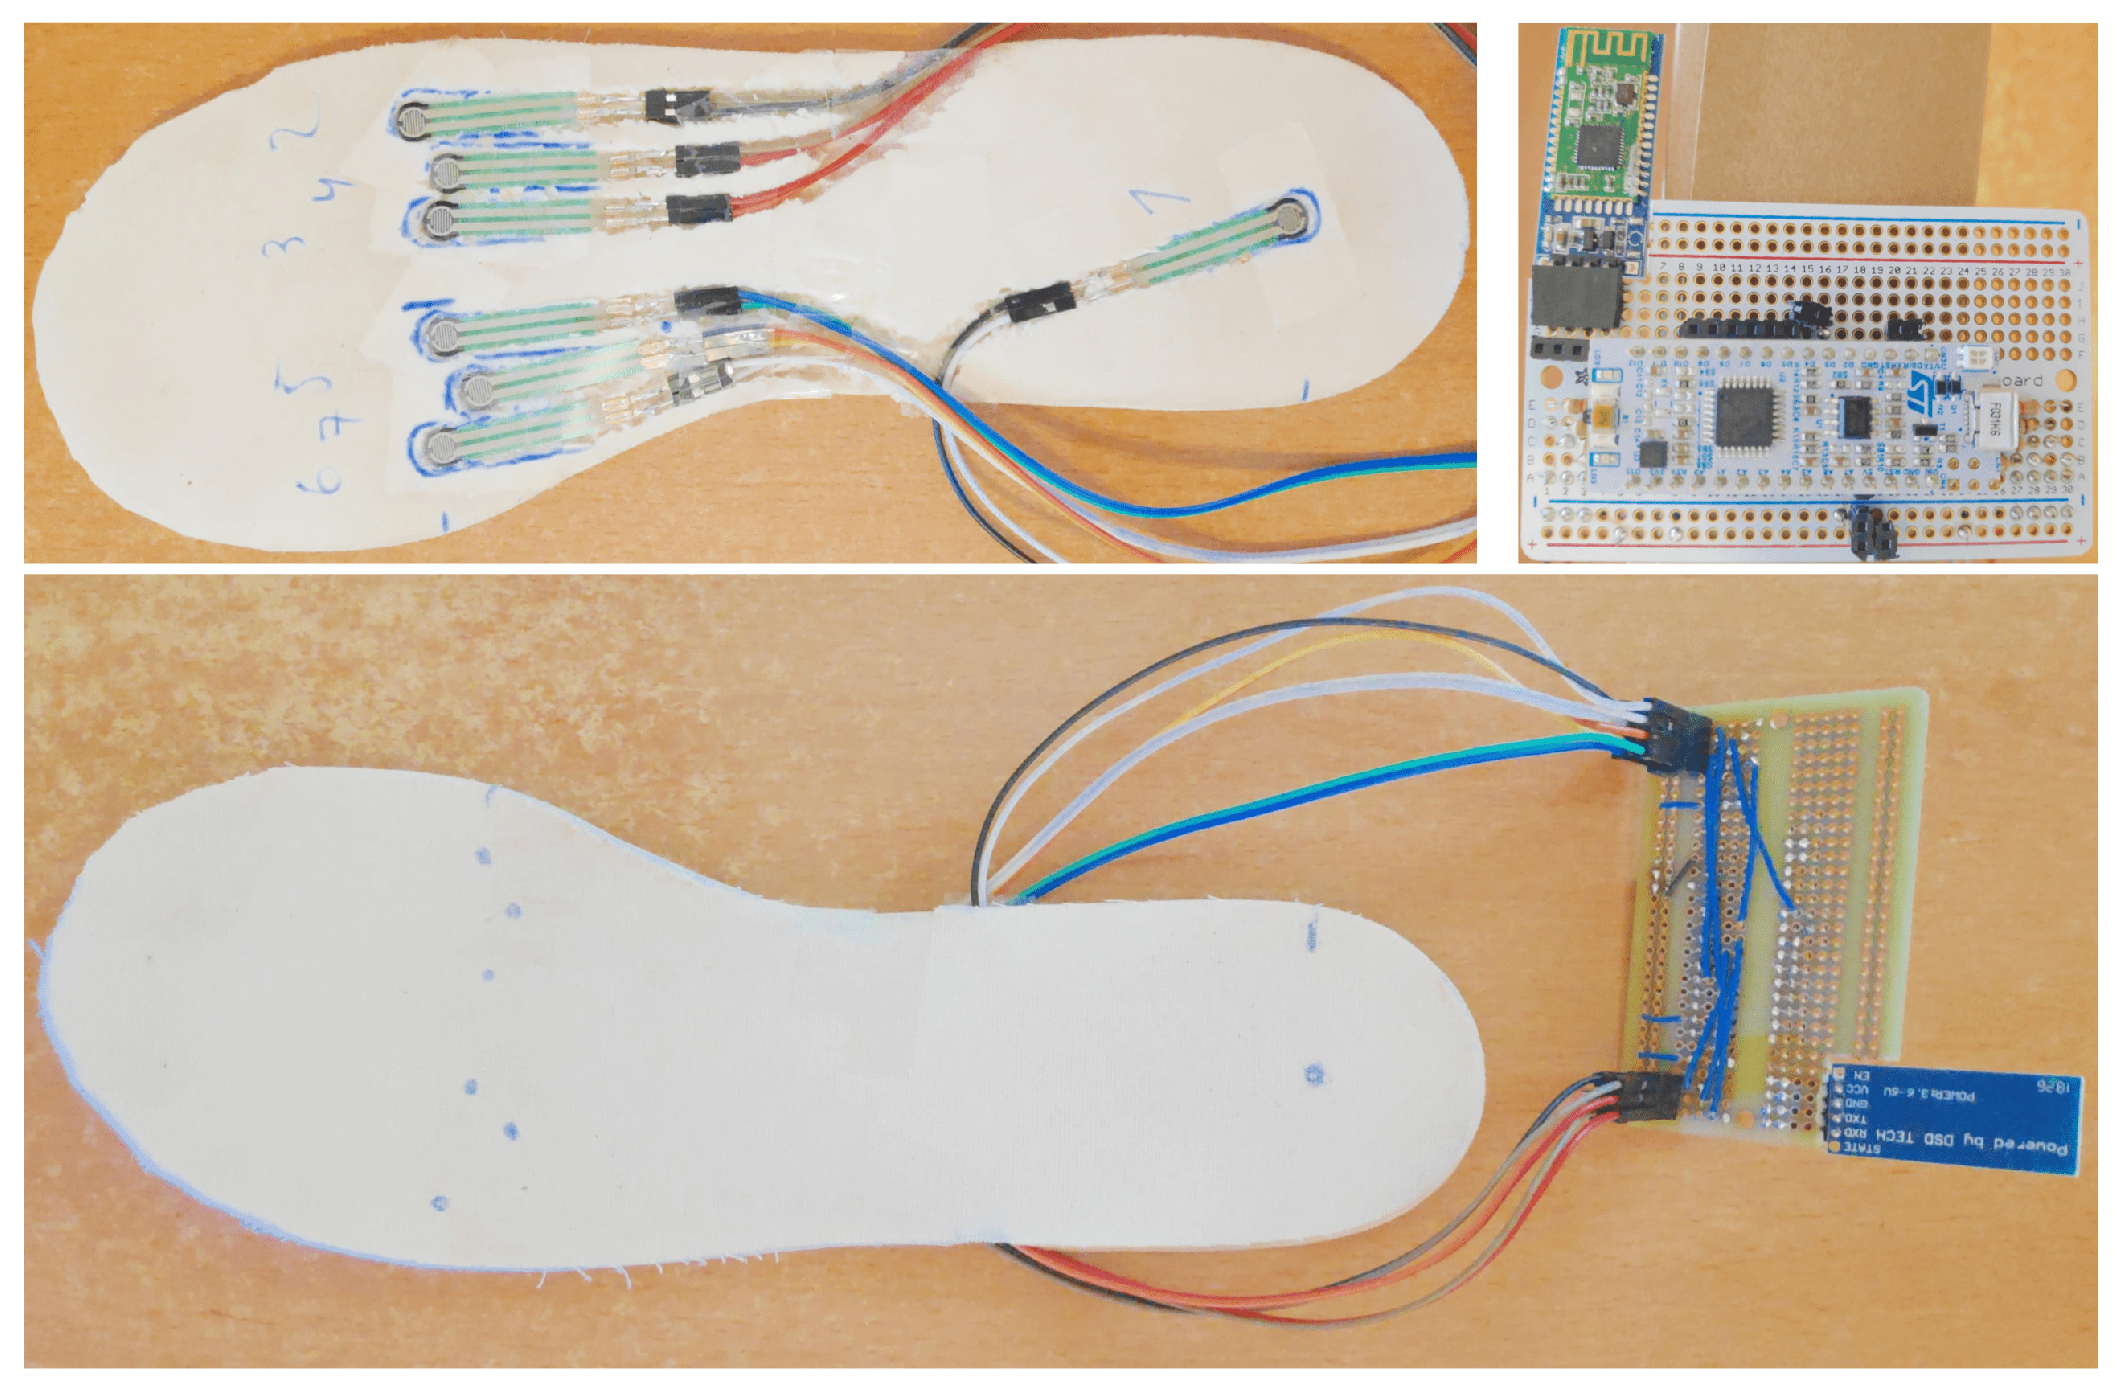
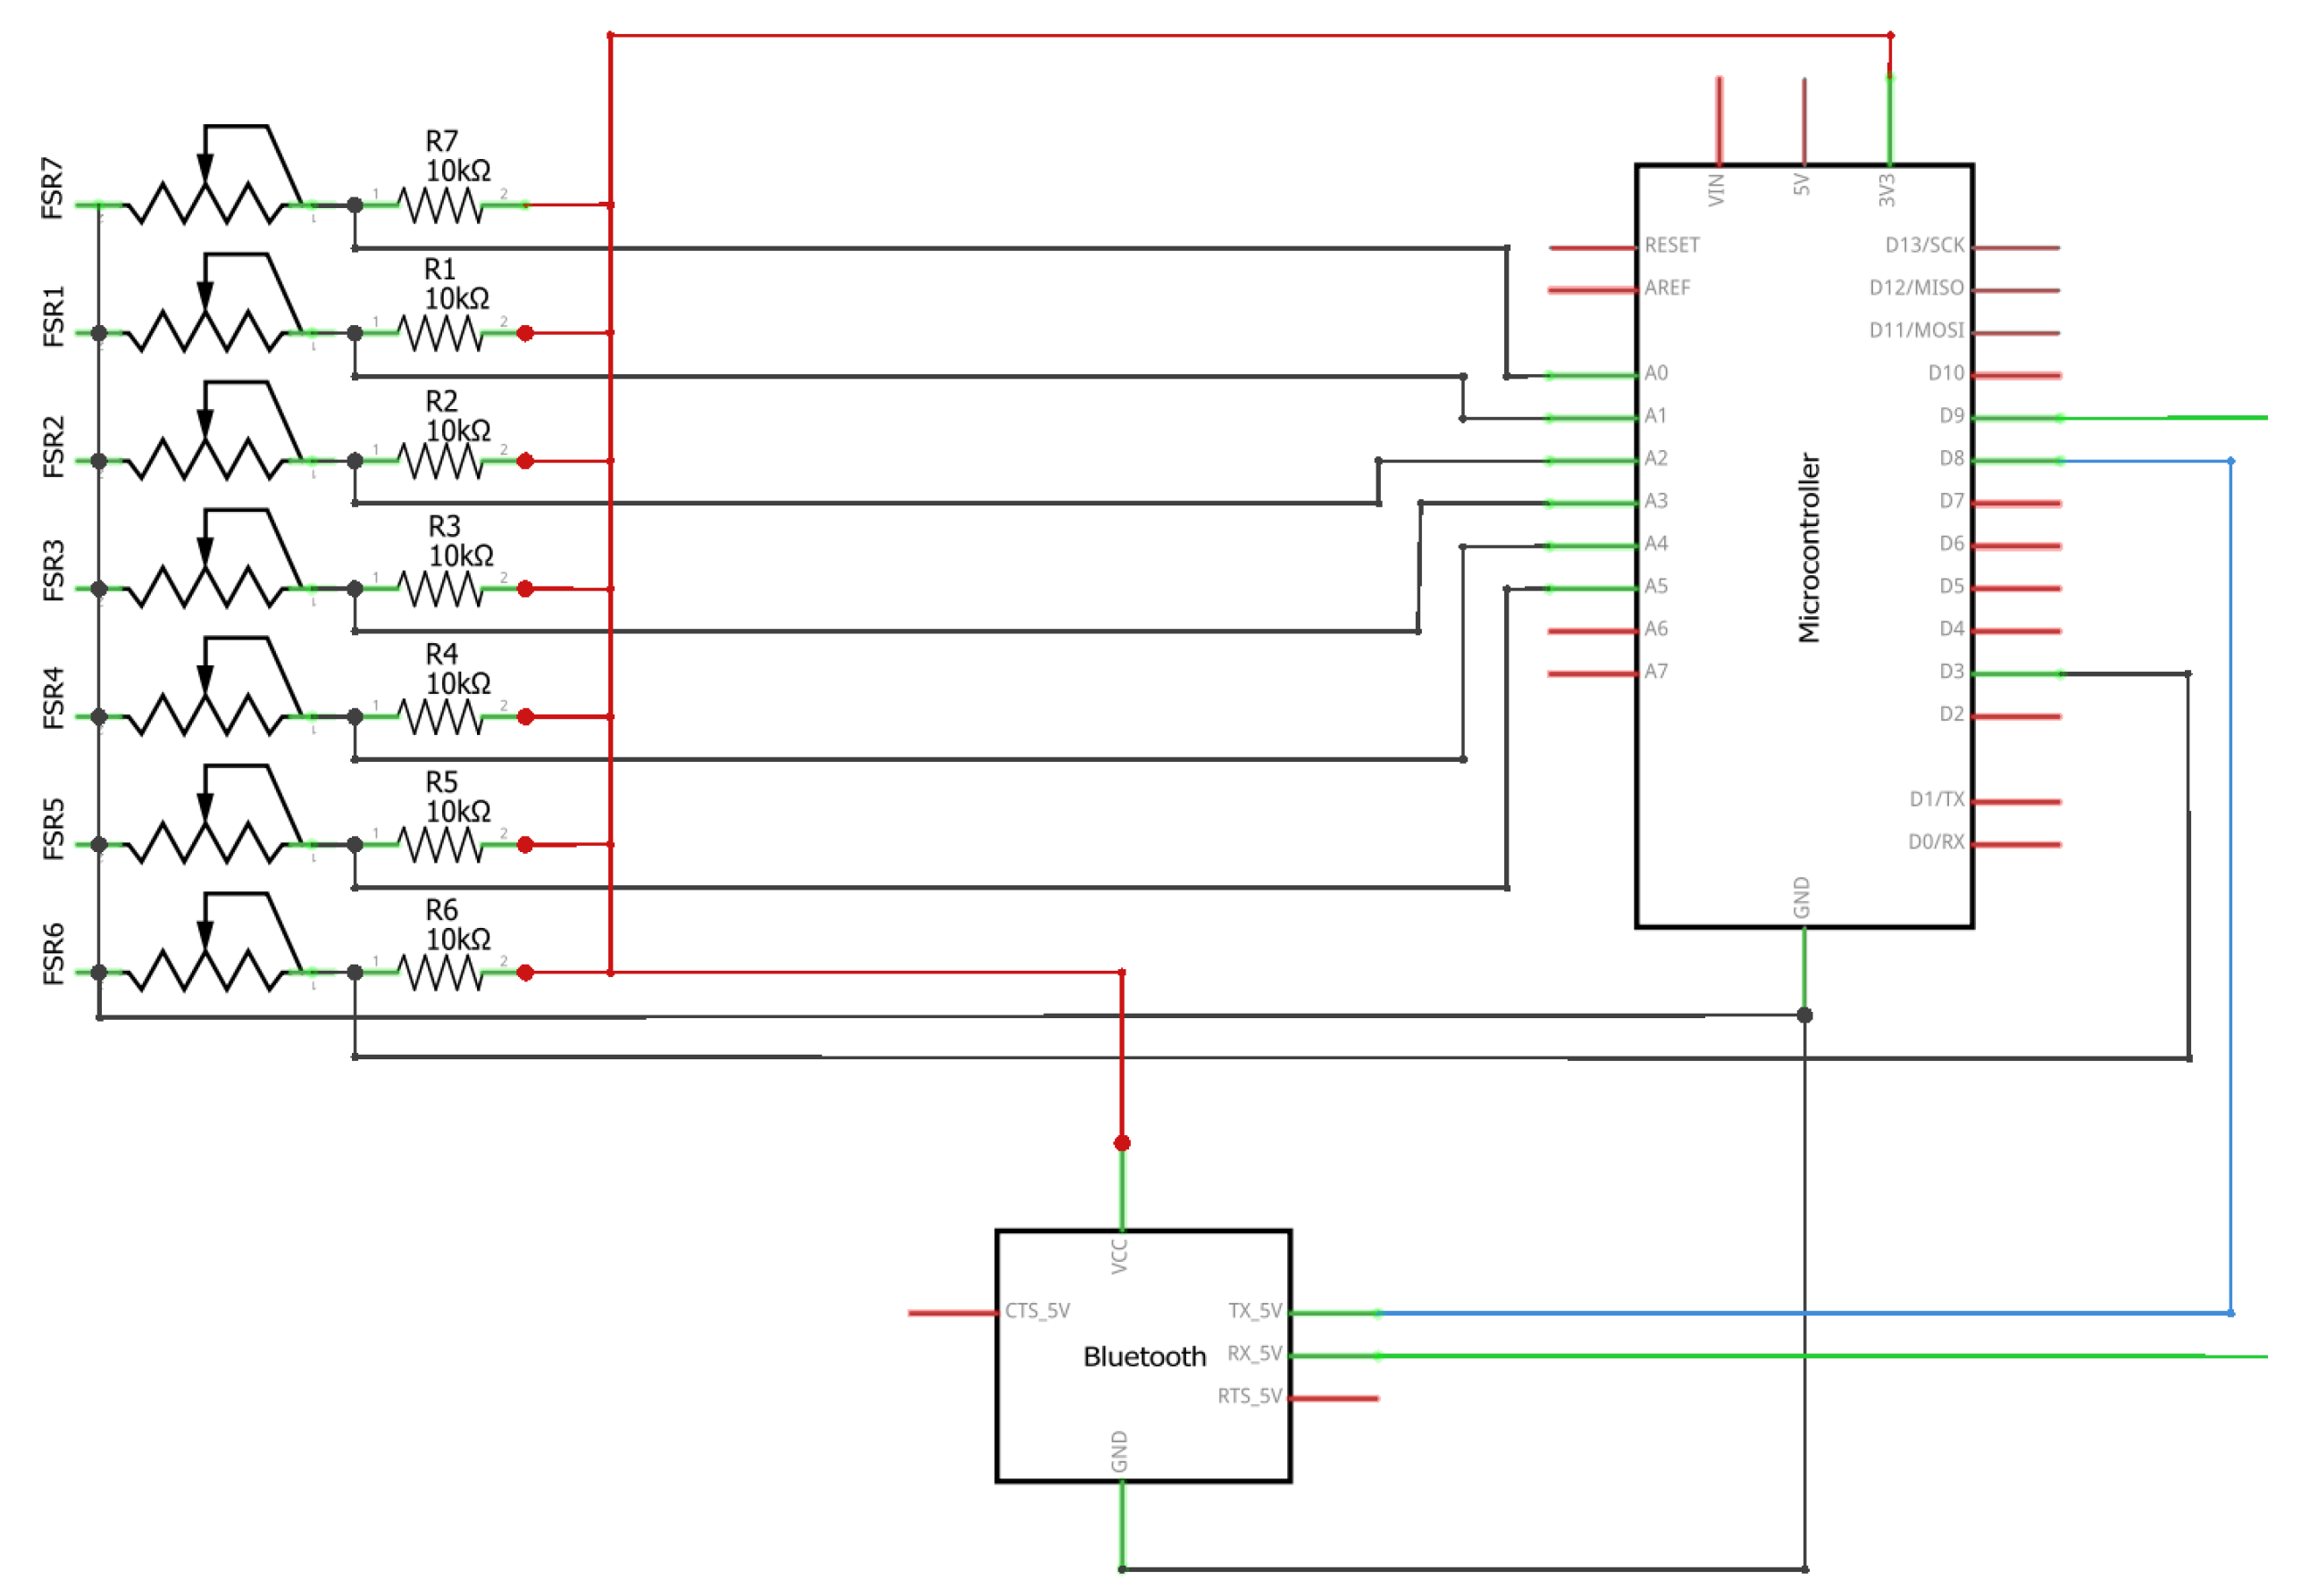
The hardware system designed, assembled and implemented for this work is based on a low-power consumption microcontroller, some FSRs and a low-energy bluetooth module (see
Figure 3), using the connections shown in
Figure 4. The elements are described below:
Microcontroller: a STMicroelectronics F031K6 board with a Cortex-M0 CPU, 32 KB of flash memory and 4 KB of RAM memory.
FSRs: seven force sensor resistances connected to the analog inputs of the microcontroller using a resistive divider with a 10 KΩ fixed resistance.
Bluetooth: HM-10 BLE (Bluetooth Low-energy) module connected as a serial port to the microcontroller.
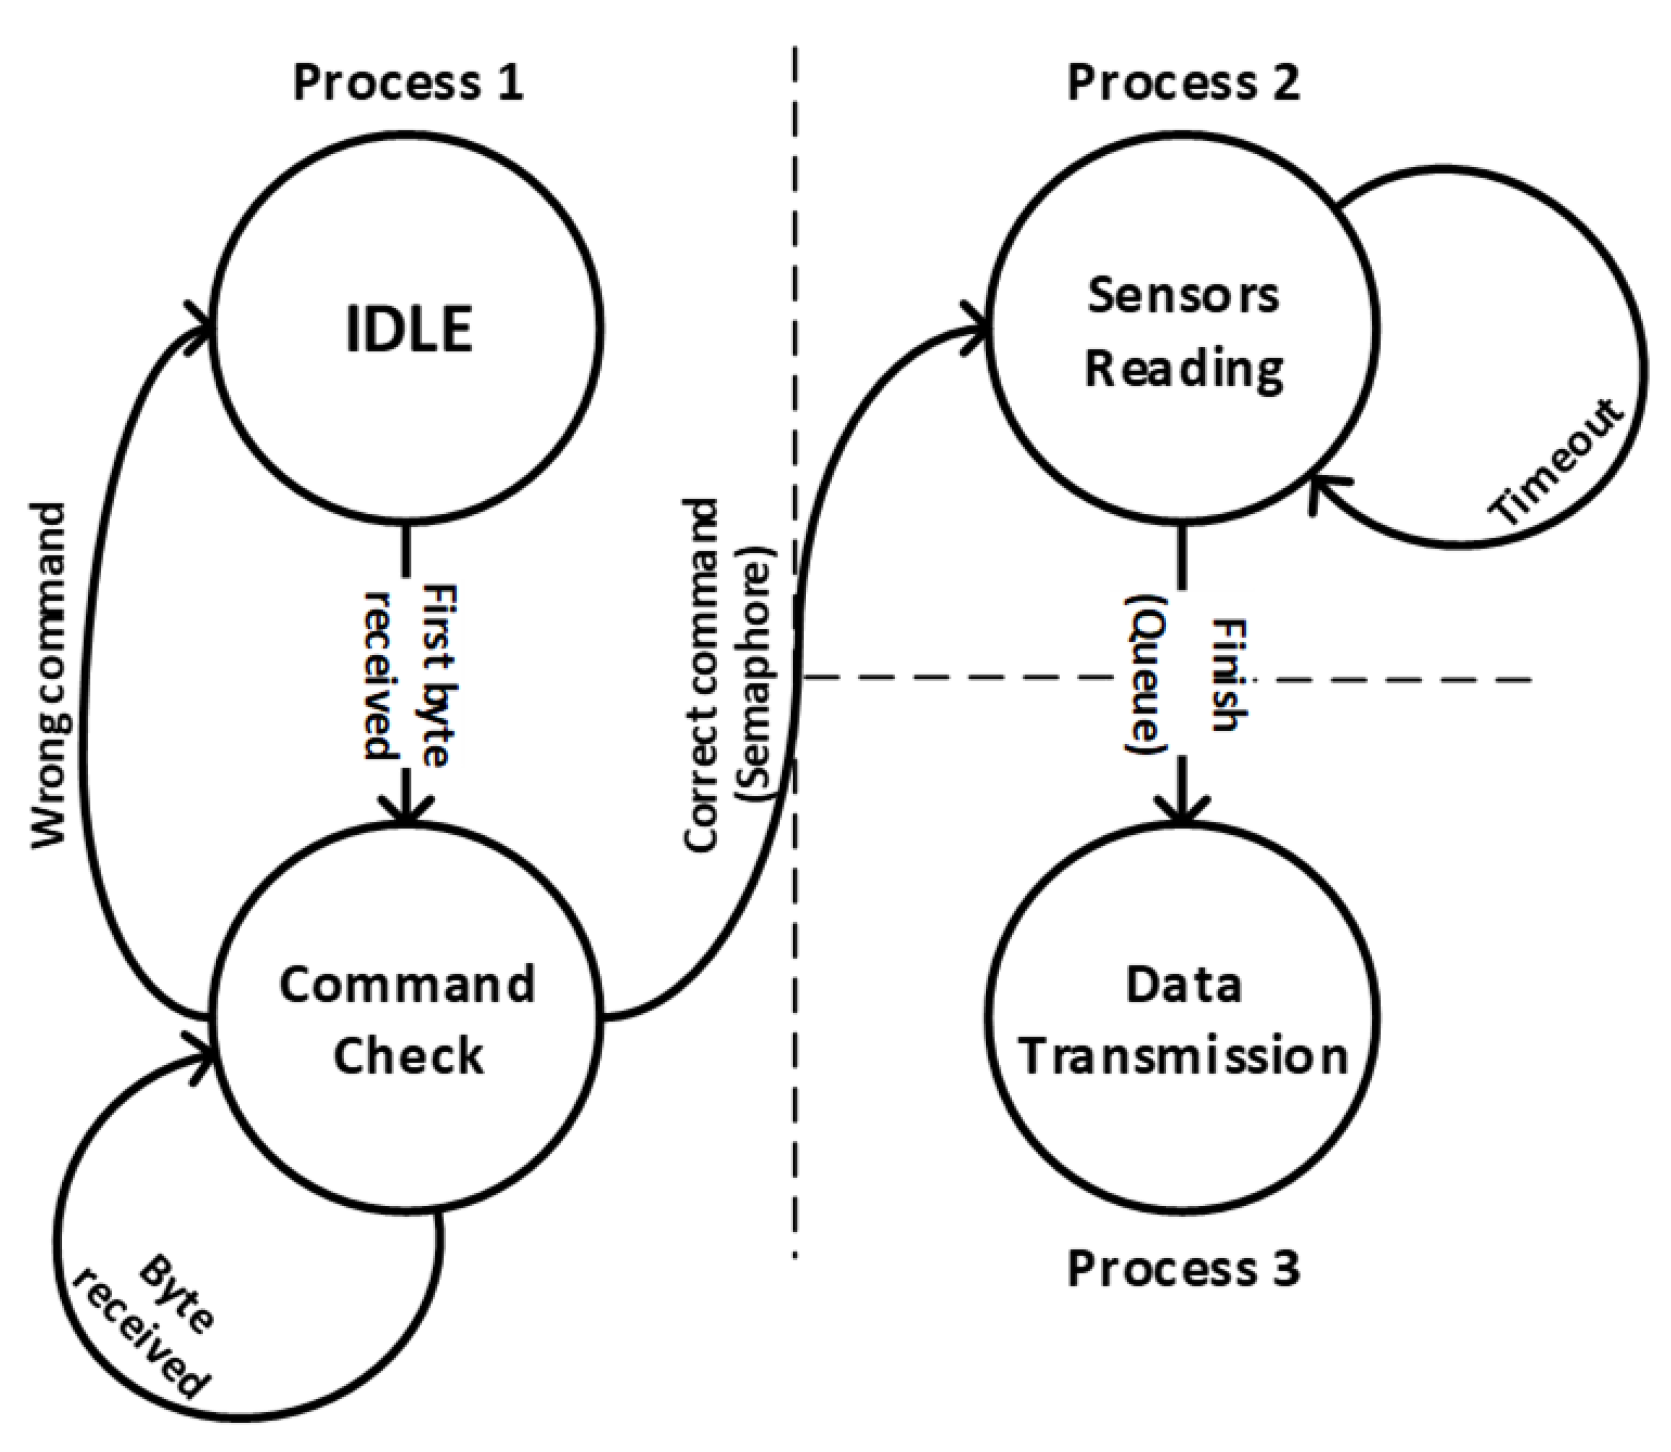
The firmware implemented inside the microcontroller consists on a freeRTOS implementation that contemplates a bi-directional serial communication with the bluetooth module (process 1 for reception and process 3 for transmission) and a periodic readings of the sensors with data transformation (process 2), with a binary semaphore and a queue to communicate these process. In order to understand the full operation of the system, a state machine diagram is presented (see
Figure 5) with these states:
Idle (process 1): the system is waiting for the first byte of a command from the bluetooth module.
Command check (process 1): once the starting byte is received, the system reads the full command byte by byte (if there is an error, the command is discarded). It can receive two types of commands: a stop command (“[S]”) or a frequency command (“[N]”, where `N’ is a number that represents the frequency of the timeout used for reading the sensors). When the command is checked, the semaphore that controls the reading process is activated (or deactivated depending on the type of command).
Sensors reading (process 2): activated by the process 1 semaphore. This process reads continuously sensors data, transforms the information and sends it to the process 3 using a queue. The reading frequency depends on the configuration given by the user.
Data transmission (process 3): the information from the seven sensors is packed and sent to the bluetooth module.
Several works have designed and implemented an instrumented footwear insole to measure some aspects from the way of walking of the user (like [
9,
10,
19,
20]), but the novelty of this work is based on the Deep-Learning system running on the computer. Next, the user application is described before starting with the Neural Network architecture section.
2.3. User Application
The user application implemented for this work has been developed using the MS Visual Studio 2017 IDE with Windows Forms interfaces. It consists on a graphical application that allows the user to connect with the instrumented insole, train and run the deep learning system.
In this section, the application is described and shown. Its advantages are described below:
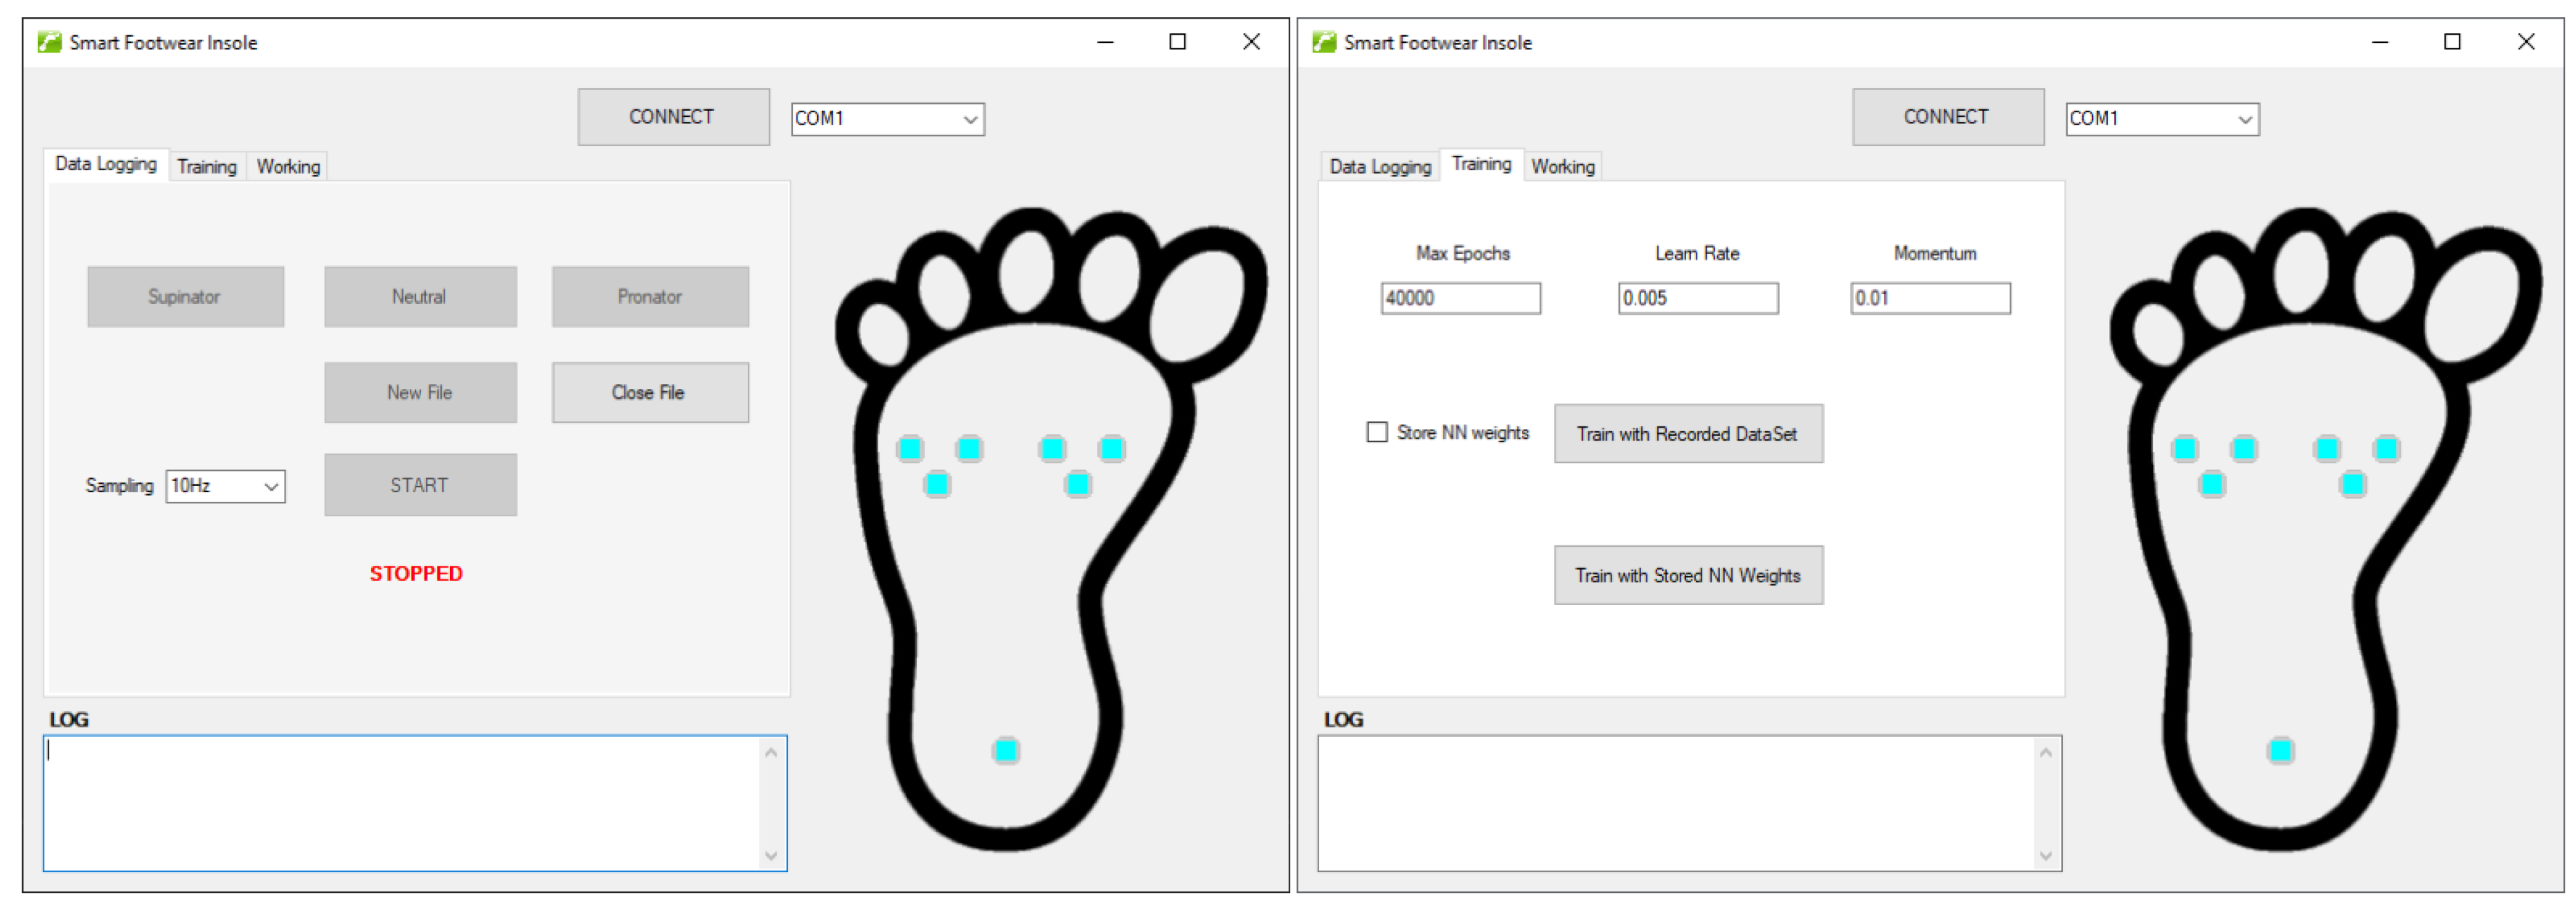
Real-Time monitoring: the application allows to connect with the instrumented insole and start logging the information received and shows it in real time representing the force received from each sensor by a color scale on an image of a foot. The sampling frequency can be configured by the user. This utility is illustrated in
Figure 6-left.
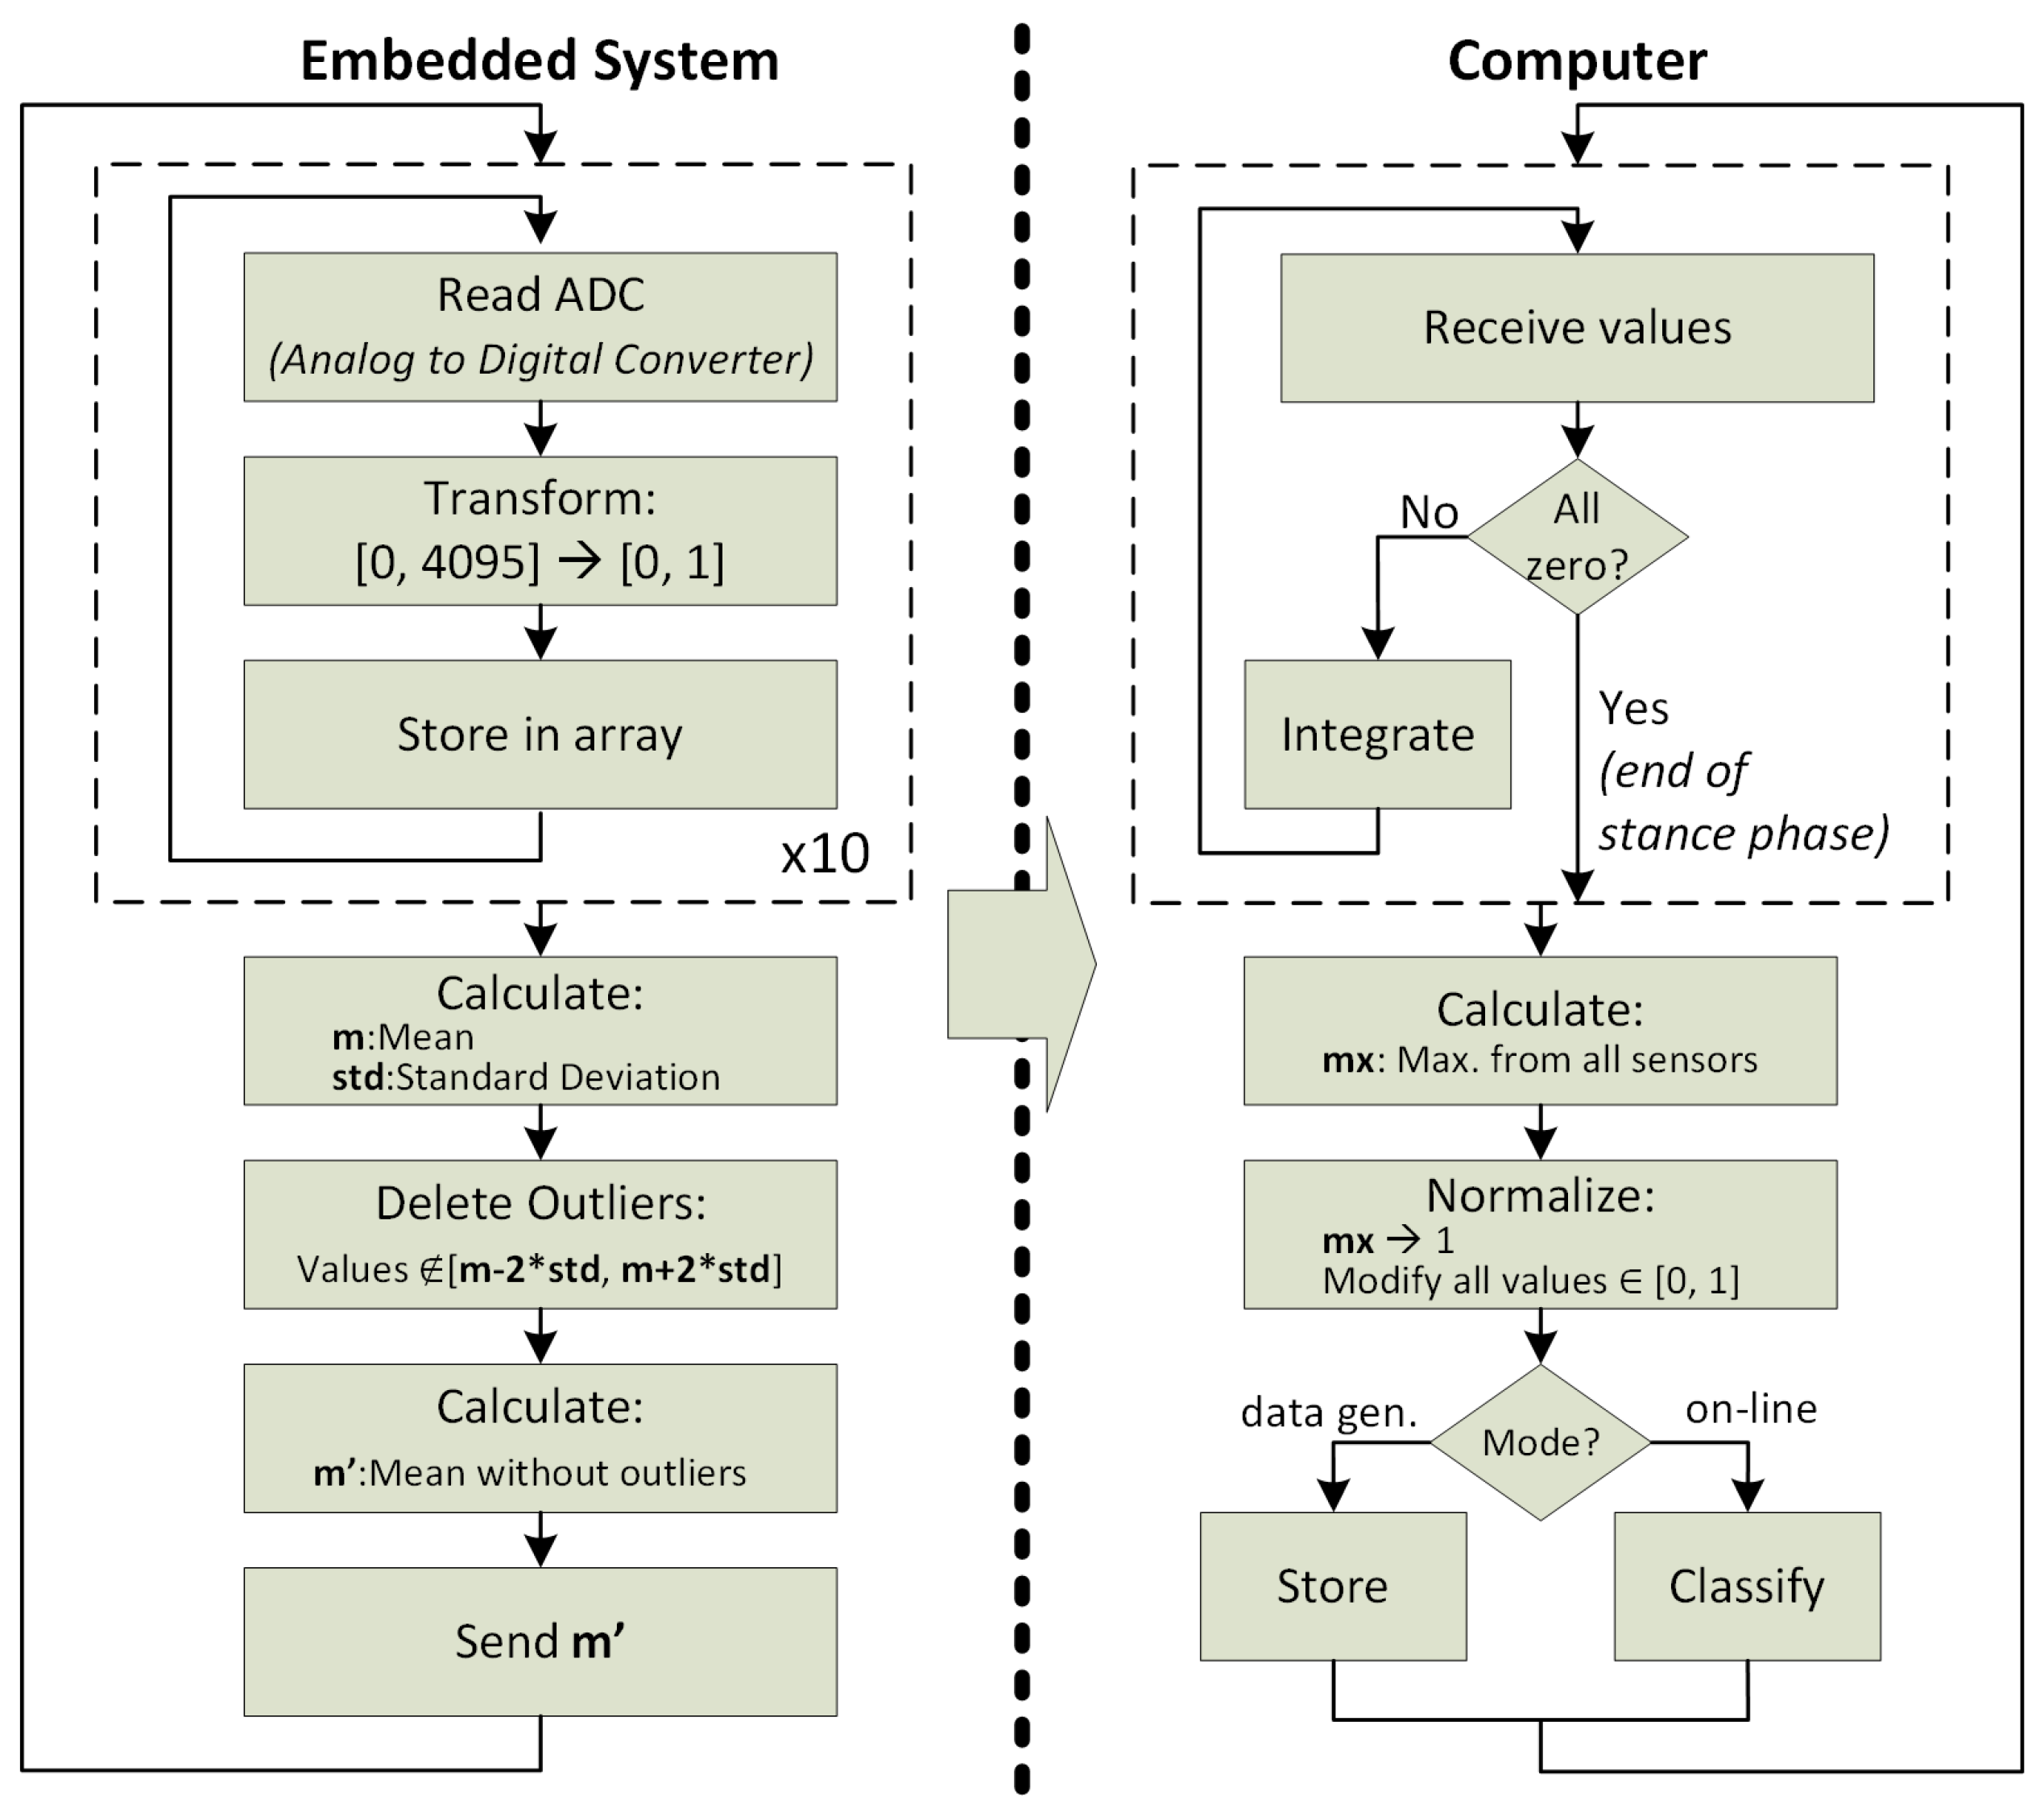
Dataset generation: while the user is monitoring the instrumented insole, the information received can be stored in a csv file in order to be used lately for the neural network training process. The user tags the information received between supinator, neutral and pronator. Each entry of the dataset has eight values: the arithmetic mean of all the received values from of each sensor (seven) during each step, and the tag selected by the user. The process implemented to collect the dataset is divided in two phases: filtering and noise removal (in the embedded system), integration and normalization (in the computer). This process is explained in
Figure 7. So, finally, the file will contain several steps’ information with its classification. The user tag selection and the file creation can be observed in
Figure 6-left.
Neural Network training: the second tab of the application allows the user to interact with the Deep Learning system. For the training mechanism, user can configure the number of epochs used, the learn rate and the momentum [
21]. The training dataset can be selected from the computer (from the datasets stored by the “dataset generation” utility), or alternatively the neural network weights stored from a previous training can be used (see
Figure 6-right).
Neural Network storing: the weights calculated while training the network can be stored in the computer in order to avoid a future training. To do that, the option “save NN weights” must be checked (see
Figure 6-right).
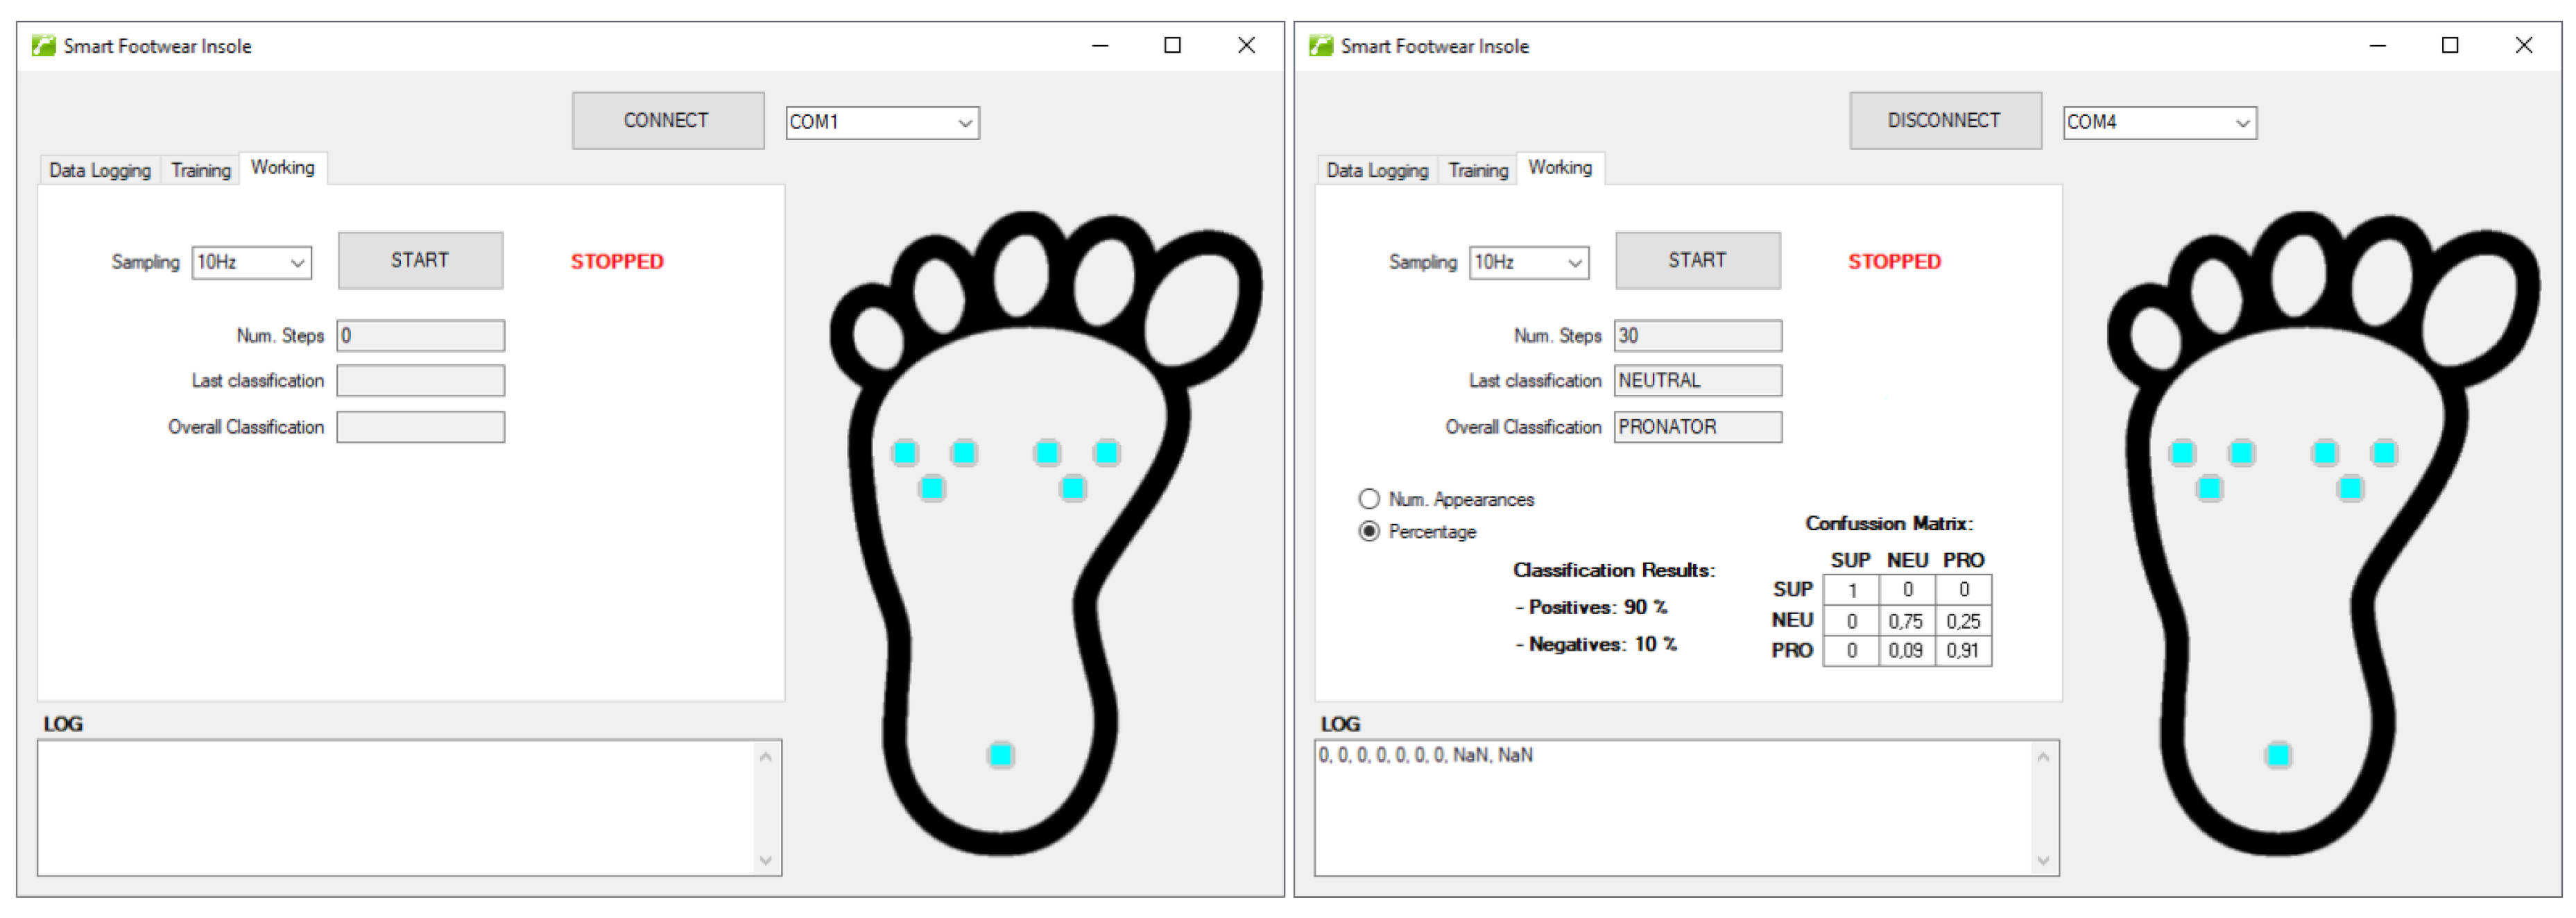
Real-Time classification: after training the network, the system can be tested using the utilities presented in the third tab (see
Figure 8-left). Selecting the sampling frequency, the user can monitor in real time the information received by the instrumented insole while the classification mechanism is working. The system counts the number of steps, shows the last step classification (after the three step phases are finished) and the overall classification.
Results generation: finally, when the working monitoring is stopped, the application shows the final results of the classification (see
Figure 8-right). Positive results, negative results and the confusion matrix are shown. The classification outputs are compared with the real step type (this information is obtained experimentally with our instrumented insole thanks to the study done in [
22], that will be detailed in the “Results and Discussion” section).
So far, it has been explained how data is acquired, transmitted and represented in the user application. Next section will focus on the training and classification steps.
3. Neural Network Architecture
As explained before, the system allows the user to store data from the instrumented insole and train the neural network with it. The neural network architecture used for the training process is a custom implementation based on the Fast Artificial Neural Network library (FANN) [
23], which is implemented in C language. This library has been adapted to be used in C# inside MS Visual Studio.
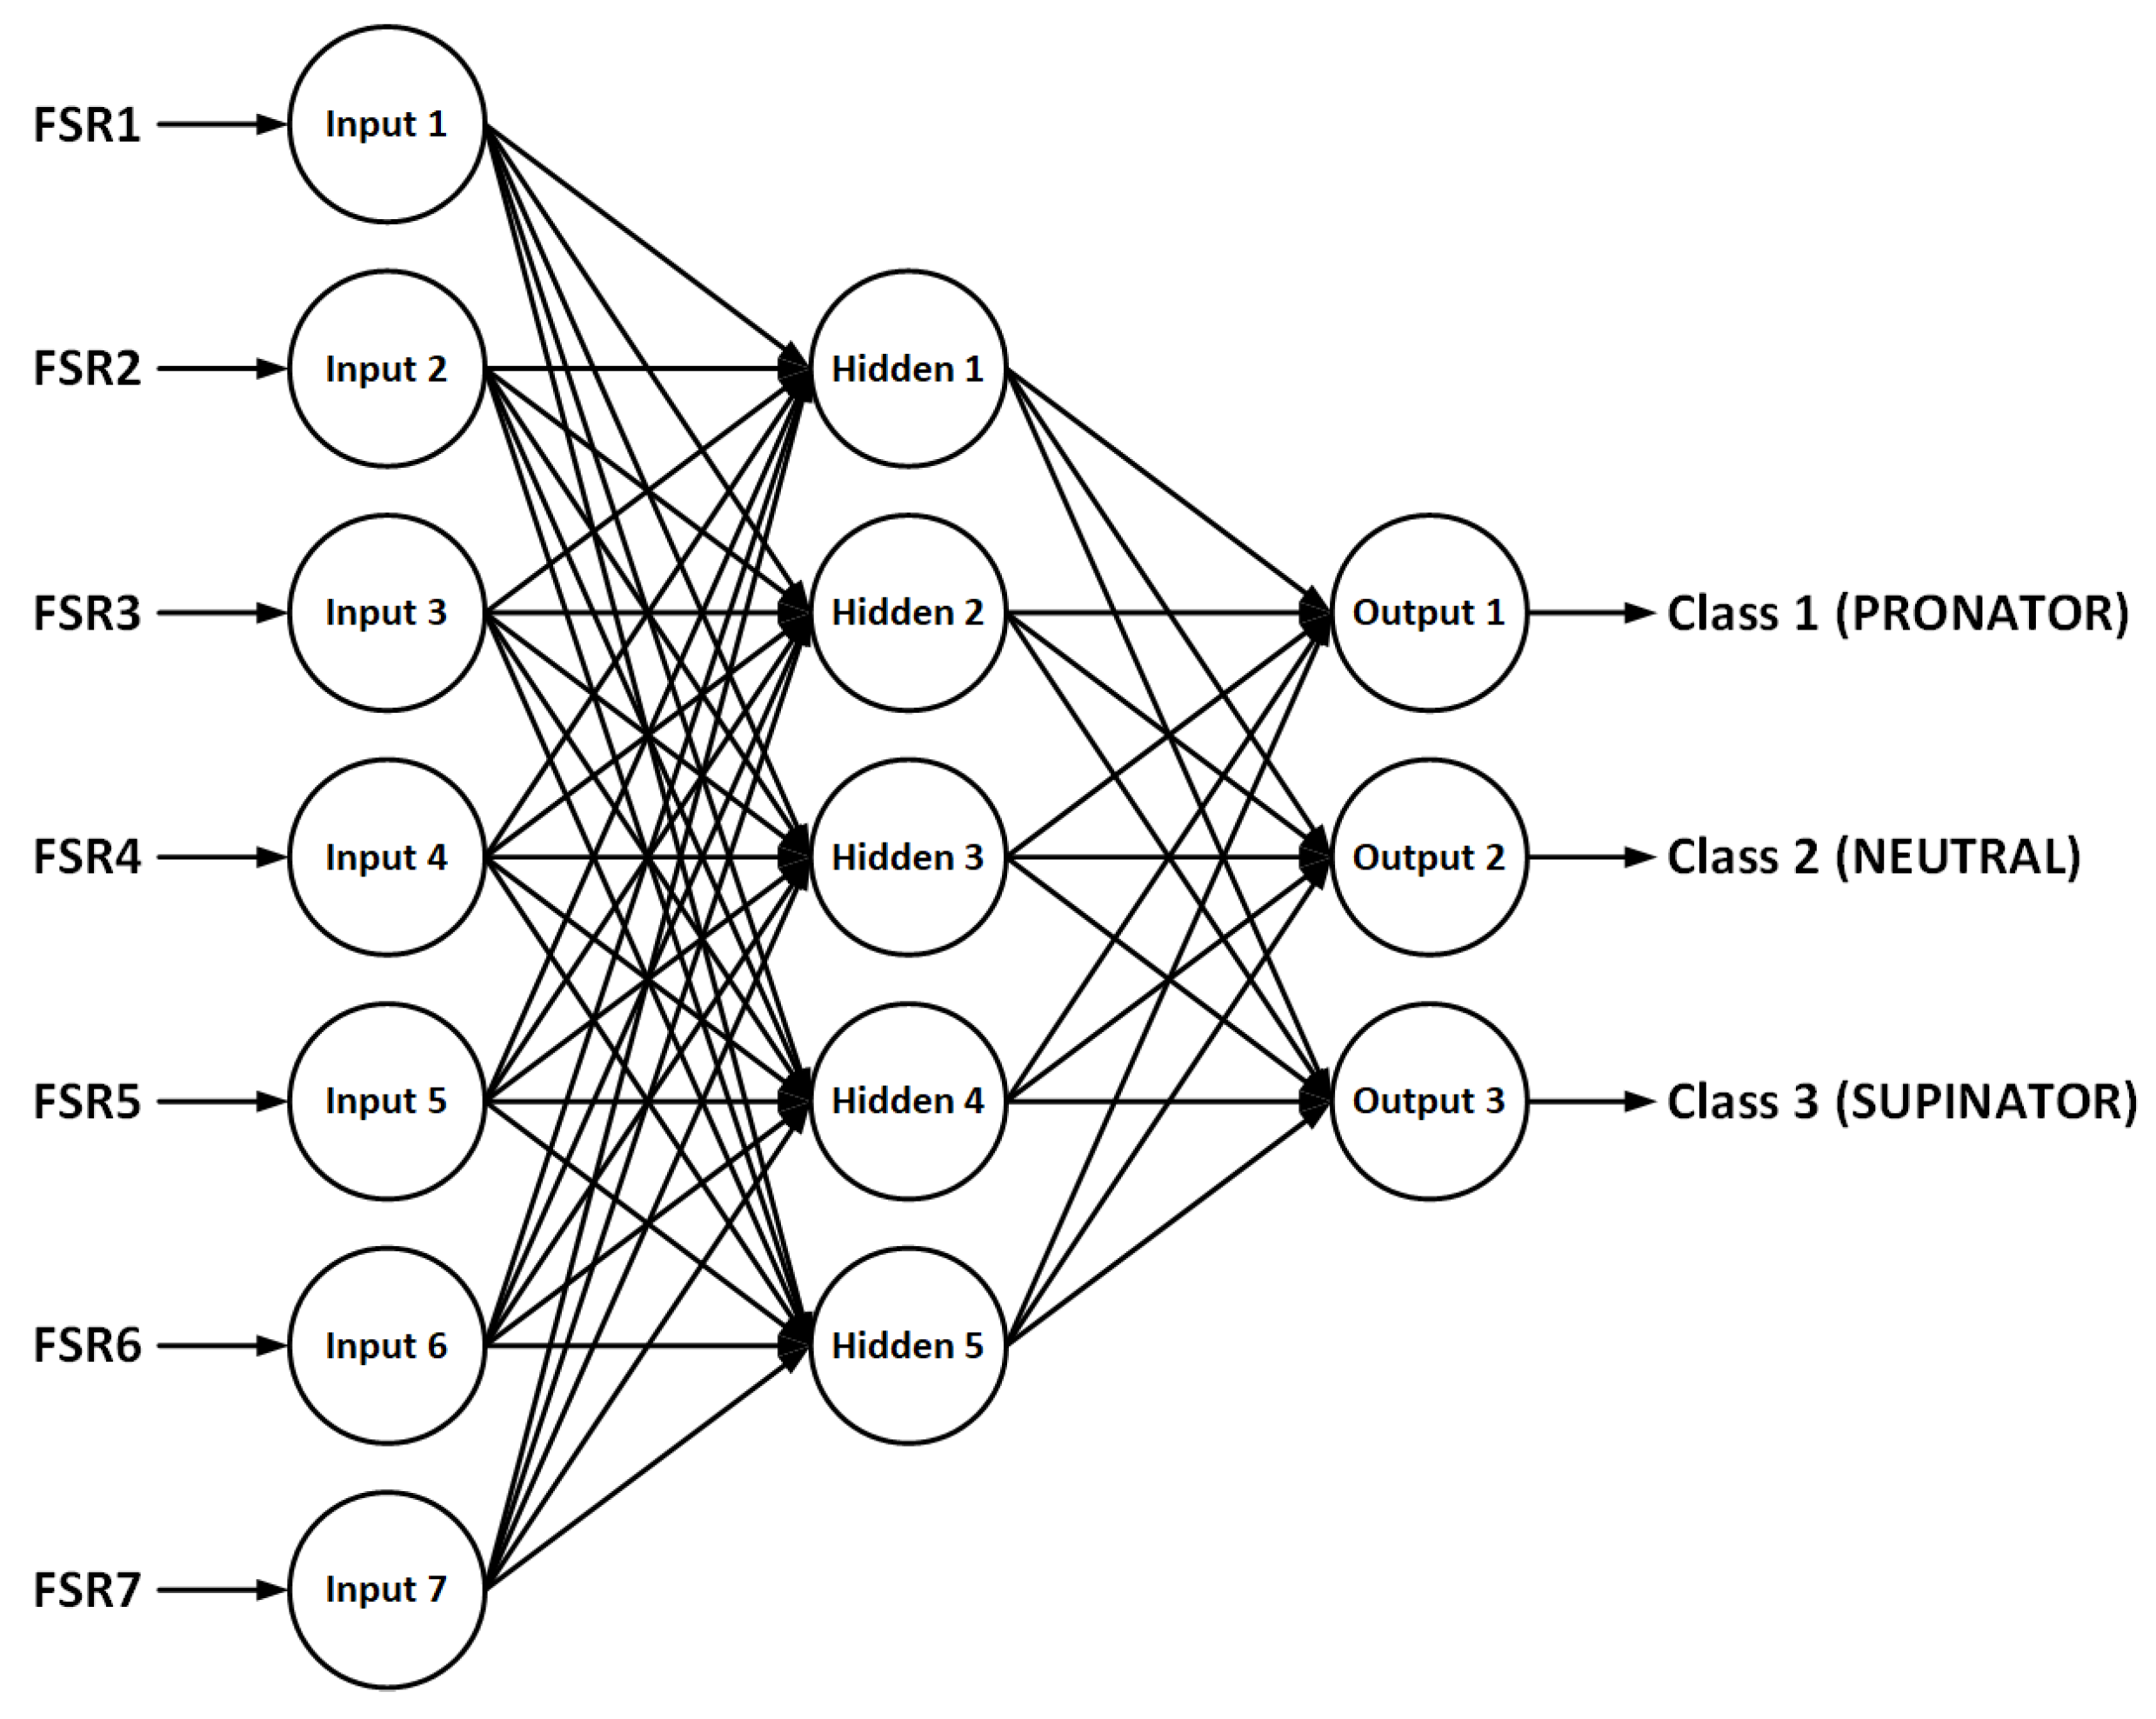
We use a Feed-Forward Neural Network with a fully-connected Multilayer Perceptron architecture (MLP) [
24], composed by an input layer, a hidden layer and an output layer. The training mechanism is ruled by back-propagation algorithm [
25] and the classification result is based on a Winner-Take-All model [
26]. These layers are described below:
Input layer: the neural network needs an input for each force sensor placed in the instrumented insole. So, the input layer has seven neurons (see
Figure 9).
Hidden layer: the number of neurons in the input layer is not standard and depends on several aspects such as the number of input neurons, the number of output neurons and the linearity of the input data. Gnana-Sheela and Deepa [
27] made a study about the different methods to estimate the number of neurons in the hidden layer and propose a new method. According to them, the number of neurons is estimated by Equation (
1). In our case, we will use five neurons in the hidden layer (see
Figure 9).
Output layer: as detailed before, the aim of this system is to distinguish between the types of footprints, so a user can be classified as pronator, supinator or neutral. Then, the output layer has one class (output neuron) for each classification state (see
Figure 9).
During the training process, the library applies a back-propagation algorithm to obtain the connections’ weights with the given dataset in order to minimize the classification error. Three parameters are taken into account during this process: number of epochs, learning rate and momentum. These parameters can be modified by the user in the application and are described by Moreira and Fiesler [
21].
4. Results and Discussion
In this section, the results obtained by the Deep Learning classification system are presented. First, it is important to describe the dataset used for the training and testing phases (that has been collected by the user application described in
Section 2.3); next, the mechanism and metrics used to measure the goodness of the results is explained; and, finally, the classification results are evaluated.
4.1. Dataset
The described application has been used to store the information about +3000 steps from six different users (two pronators, two supinators and two neutral), so we use a dataset that has between 900 and 1200 steps from each type of footprint. These six users were diagnosed directly (by a podiatrist, four of them) or indirectly (with the classical pressure platform used by podiatrists) as pronators, supinators and neutrals, respectively; they participated voluntarily and were recruited among our research group’s members and collaborators.
Of course a bigger sample would be needed to obtain statistically relevant results, so it must be noted that this work can only be considered a preliminary study.
This dataset is mixed and randomly divided in two parts (see
Table 1):
Training dataset: around 70% from each type of footprints is used to train the neural network.
Testing dataset: the remaining 30% is used for the testing phase. We calculated the accuracy with this subset after each training iteration in order to appreciate the performance evolution of the trained model.
For each step, eight values are stored: the type of footprint and the normalized average values of each sensor, held during the three phases of the march.
4.2. Real-Time Testing Thresholds
The training process is done using the previous dataset, that has been tagged manually attending to each user’s type of footprint. However, in order to test the results obtained during the real-time mode, we need a tangible metric that allows us to distinguish if the classification result has been successful or not (because, in the real-time mode we are not tagging this information manually).
Using the classification scheme proposed by Tsai et al. [
22], a foot is classified as neutral if the rear-foot eversion angle is between 3
and 9
. If this angle is higher than 9
, the foot is classified as pronator; and, if the angle is lower than 3
, the foot is classified as supinator.
In an experimental way, these thresholds have been emulated with the instrumented insole, obtaining the FSRs relations for each one. The normalized average values for each threshold determine that the step corresponds to a supinator foot if the average force received from sensors 2, 3 and 4 is (at least) a 10% higher than the average force received from sensors 5, 6 and 7. On the other hand, a step corresponds to a pronator foot if the average force received from sensors 5, 6 and 7 is (at least) a 20% higher that the average force received from sensors 2, 3 and 4. If the forces received from both sensor groups are located between these thresholds, the step is classified as neutral. It is important to comment that a common user usually exerts a little more pressure on the inside of the foot. These calculated relations are shown in
Table 2.
These values are used in the real-time mode to compare the classification results with the type of footprint obtained using this metric. Finally, the next section shows the classification results.
4.3. Classification Results
Using 10,000 epochs, a 0.005 learning rate and a momentum value of 0.01, the neural network has been trained using the dataset described in
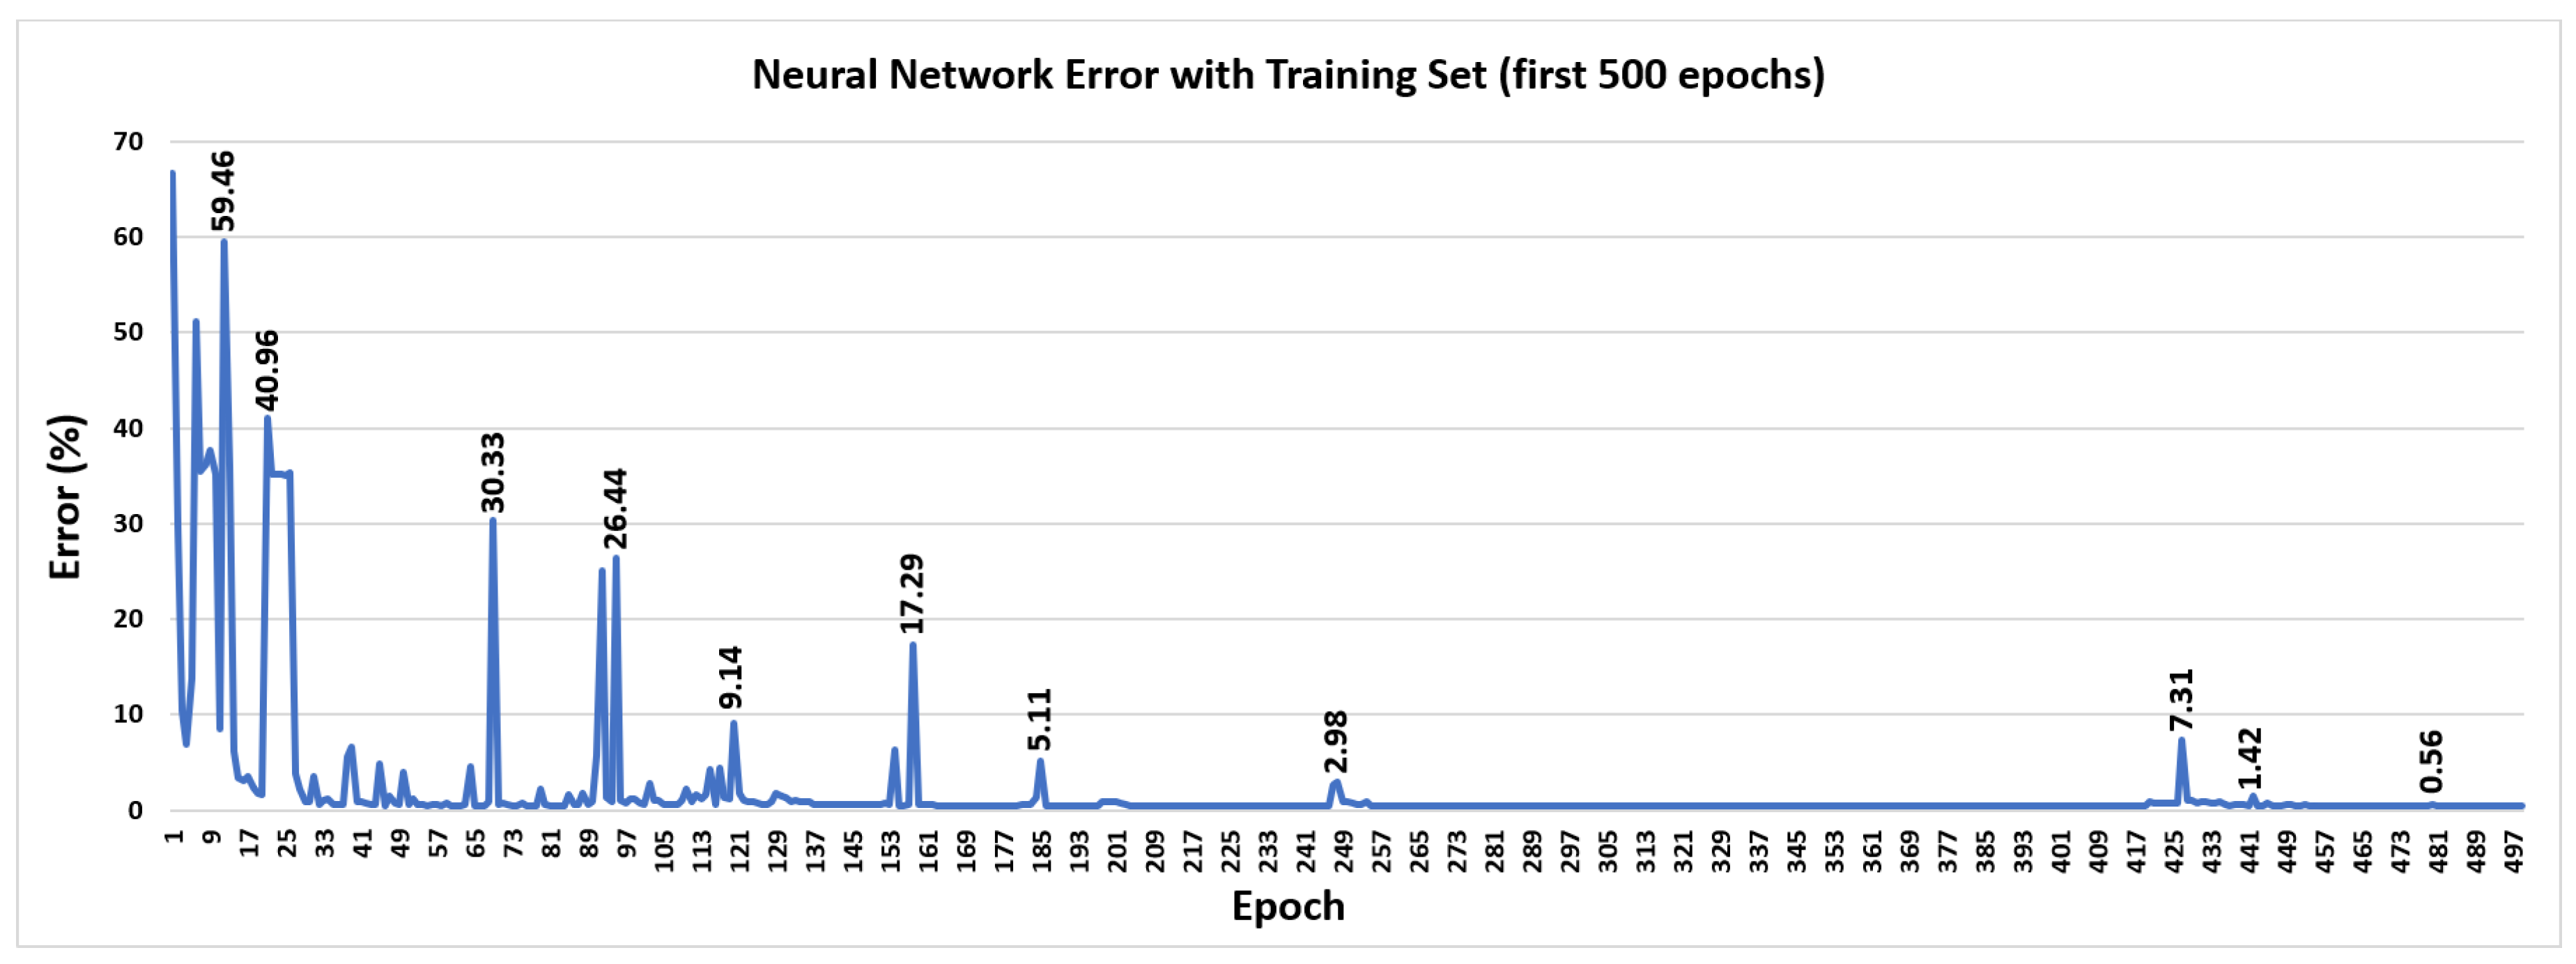
Table 1. A random 30% of this dataset is used for testing, obtaining the average classification error for each training epoch. In order to demonstrate the final convergence of the training algorithm, the error obtained for each epoch using the training dataset (for the first 500 epochs) is shown in
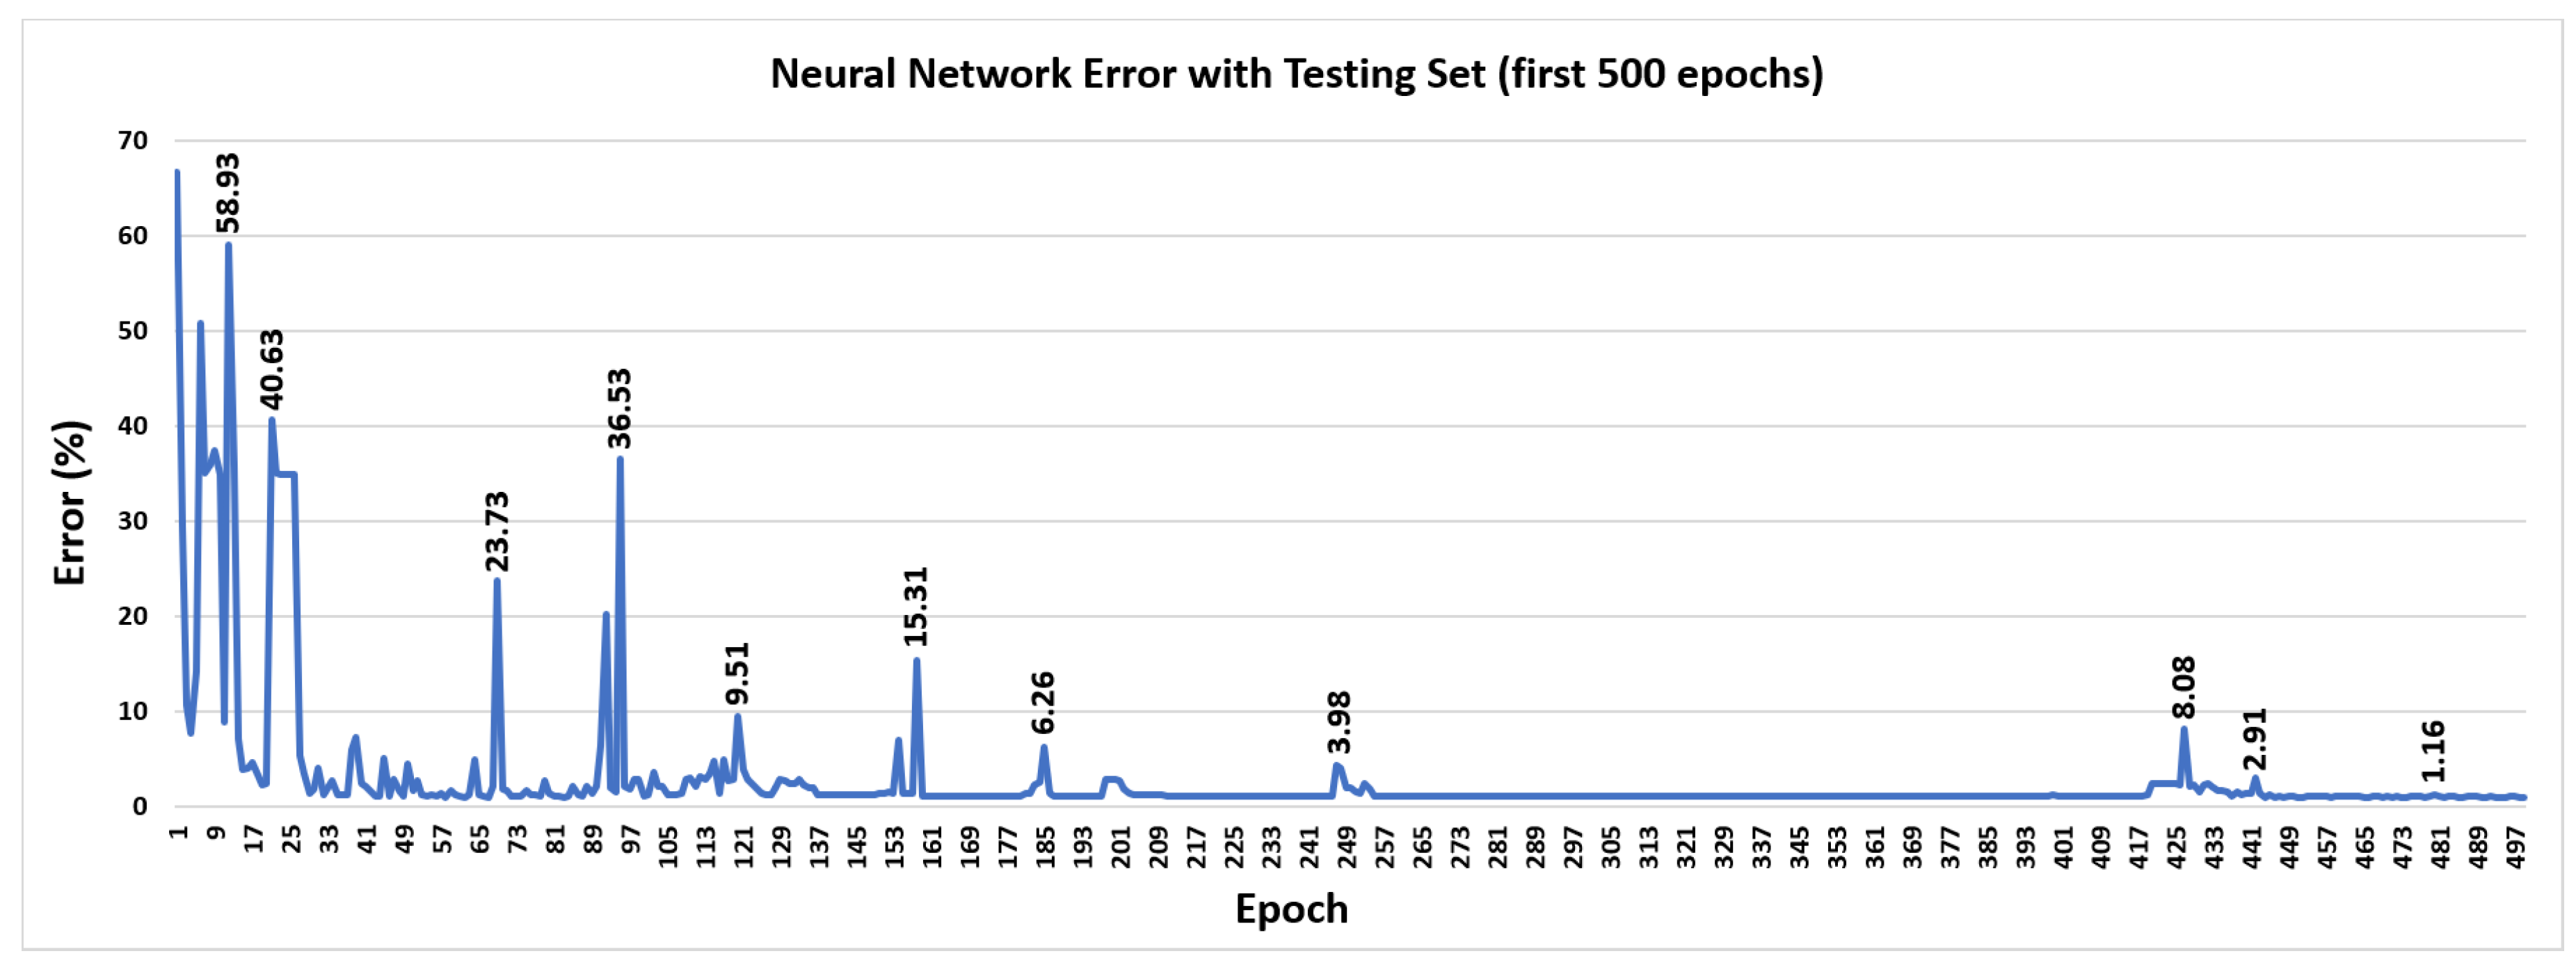
Figure 10. In the same way, the error obtained for each epoch using the testing dataset (for the first 500 epochs) is shown in
Figure 11.
As can be seen in these graphs, both follow the same trend and both converge to a value close to zero. Although not shown in
Figure 10 and
Figure 11, after 500 epochs the error obtained is 0.42% for the training dataset and 0.98% for the testing dataset. After 10,000 epochs, the error obtained using the training dataset is 0.28%, and using the testing dataset the error is 0.86%.
After the training process finishes, the classification results are obtained using the final weights of the neural network and the testing dataset. These results are evaluated more carefully using the metrics explained below (for each classification class):
True Positive (TP): the number of cases that belong to this class and are correctly classified.
False Positive (FP): the number of cases that don’t belong to this class but are incorrectly classified as belonging to this class.
True Negative (TN): the number of cases that don’t belong to this class and have not been classified as it.
False Negative (FN): the number of cases that belong to this class but are incorrectly classified as belonging to other class.
Accuracy: proportion of TP and TN in all evaluated cases (see Equation (
2)).
Sensitivity (or Recall): proportion of TP in all the cases that belong to this class (see Equation (
3)).
Specificity: proportion of TN in all cases that don’t belong to this class (see Equation (
4)).
Precision: proportion of TP in all cases that have been classified as it (see Equation (
5)).
F1 score: measure of a test’s accuracy. It considers both the precision and the sensitivity (recall) of the test to compute the score. It is the harmonic mean of both parameters (see Equation (
6)).
The values for all these metrics using the testing dataset are shown in
Table 3.
Moreover, the confusion matrix is shown in
Table 4.
The results show an error very close to zero for each classification class (we test the system with the testing dataset represented in
Figure 11). As can be observed, the neutral class is the one which obtain the worst results (5 errors and 322 hits).
Finally, the system classification efficiency is evaluated with a real-time test, where three different diagnosed users (one pronator, one supinator and one neutral) use the instrumented insole. The system logs data from 150–200 steps from each user, shows the classification results in real-time and compare them with the thresholds studied on the previous subsection. The results obtained after this test are shown in the same way as before: the values of the different metrics are presented in
Table 5, and the confusion matrix can be observed in
Table 6.
In this case, the data comes from other users and therefore the results are worse than the previous ones. In fact, another source of error is the absence of the manual tagging of the data (it was explained before that the classification in the real-time mode is compared with the values obtained from the study detailed in [
22]). So this information, and the comparison with the previous results, indicates that the neural network classification obtains better results than the classification made by the thresholds calculated by Tsai [
22].
Even so, the worst results with the real-time test occur with the neutral class (19 errors and 150 hits), which is the same conclusion obtained in the previous test. However,
Table 5 and
Table 6 show an acceptable classification error for this test.
If we compare this work with related ones, it is important to note that there are many previous works that address the problem of gait analysis; some of them even use an instrumented insole. However, most focus on step counting, movement speed, tilt, orientation, etc. We present a comparison summary with some related works in
Table 7.
As can be observed in
Table 7, almost all are recent works. Also, although the results are not easily comparable, it can be seen that we obtain results with better accuracy.
5. Conclusions
In this work, a novel Deep Learning system for detection of abnormal foot postures and functions has been presented. The system is based on an instrumented footwear insole, capable of detecting the force exerted on different points of the insole (thanks to a low-power embedded system with FSR sensors) and sending the information to a computer via bluetooth. Moreover, an user application has been developed in order to do a real-time monitoring of these sensors’ values, create a dataset and detect these abnormal foot postures.
The novelty of this work corresponds to the neural network integrated into the user application in order to successfully detect the different footprint types. This neural network can be trained and tested using the same user application indicated above (the user can modify some features of this network in order to adapt it); and the trained system run real-time classifications during the user march.
The neural network classification has been tested by two methods: on one hand, a static test with a testing dataset (30% of the full dataset) is done on the system; and, on the other hand, a real-time execution test is evaluated. In the first test scenario, the classification results provide a F1-score above 98% (with an average accuracy above 99%); and, in the second scenario, the classification results provide a F1-score around 90% (with an average accuracy above 95%). In both cases the worst results are given by the class "neutral" with a 98.47% and a 88.75% values detected from the total samples, respectively.
The results obtained demonstrate that the system is able to properly detect the three footprints types with a global error less than a 0.86%.
It must, however, be noted that this work can only be considered a preliminary study. The datasets are obtained from a small set of voluntary users, so a bigger sample would be needed to obtain statistically relevant results.
Author Contributions
Conceptualization: M.J.D.-M. and L.M.-A.; methodology: M.J.D.-M. and J.L.S.-R.; software: M.J.D.-M.; validation: M.J.D.-M. and F.L.-P.; formal analysis: L.M.-A. and M.H.-V.; investigation: M.J.D.-M. and F.L.-P.; writing: M.J.D.-M., F.L.-P. and M.H.-V.; supervision: J.L.S.-R. and L.M.-A.
Funding
This research was funded by the Telefonica Chair “Intelligence in Networks” of the Universidad de Sevilla, Spain.
Acknowledgments
This work has been partially supported by the Telefonica Chair “Intelligence in Networks” of the Universidad de Sevilla, Spain; and by the excellence project from the Spanish government grant (with support from the European Regional Development Fund) COFNET (TEC2016-77785-P).
Conflicts of Interest
The authors declare no conflict of interest.
References
- Thomas, M.J.; Roddy, E.; Zhang, W.; Menz, H.B.; Hannan, M.T.; Peat, G.M. The population prevalence of foot and ankle pain in middle and old age: A systematic review. Pain 2011, 152, 2870–2880. [Google Scholar] [CrossRef] [PubMed]
- Menz, H.B.; Dufour, A.B.; Riskowski, J.L.; Hillstrom, H.J.; Hannan, M.T. Association of planus foot posture and pronated foot function with foot pain: The Framingham foot study. Arthritis Care Res. 2013, 65, 1991–1999. [Google Scholar] [CrossRef] [PubMed]
- Buldt, A.K.; Allan, J.J.; Landorf, K.B.; Menz, H.B. The relationship between foot posture and plantar pressure during walking in adults: A systematic review. Gait Posture 2018, 62, 56–67. [Google Scholar] [CrossRef] [PubMed]
- Perry, J.; Davids, J.R. Gait analysis: Normal and pathological function. J. Pediatr. Orthop. 1992, 12, 815. [Google Scholar] [CrossRef]
- Razeghi, M.; Batt, M.E. Foot type classification: A critical review of current methods. Gait Posture 2002, 15, 282–291. [Google Scholar] [CrossRef]
- Buldt, A.K.; Forghany, S.; Landorf, K.B.; Levinger, P.; Murley, G.S.; Menz, H.B. Foot posture is associated with plantar pressure during gait: A comparison of normal, planus and cavus feet. Gait Posture 2018, 62, 235–240. [Google Scholar] [CrossRef] [PubMed]
- Frelih, N.G.; Podlesek, A.; Babič, J.; Geršak, G. Evaluation of psychological effects on human postural stability. Measurement 2017, 98, 186–191. [Google Scholar] [CrossRef]
- Morris, S.J.; Paradiso, J.A. Shoe-integrated sensor system for wireless gait analysis and real-time feedback. In Proceedings of the Second Joint 24th Annual Conference and the Annual Fall Meeting of the Biomedical Engineering Society [Engineering in Medicine and Biology], Houston, TX, USA, 23–26 October 2002; Volume 3, pp. 2468–2469. [Google Scholar]
- Bamberg, S.J.M.; Benbasat, A.Y.; Scarborough, D.M.; Krebs, D.E.; Paradiso, J.A. Gait analysis using a shoe-integrated wireless sensor system. IEEE Trans. Inf. Technol. Biomed. 2008, 12, 413–423. [Google Scholar] [CrossRef]
- Shu, L.; Hua, T.; Wang, Y.; Li, Q.; Feng, D.D.; Tao, X. In-shoe plantar pressure measurement and analysis system based on fabric pressure sensing array. IEEE Trans. Inf. Technol. Biomed. 2010, 14, 767–775. [Google Scholar]
- Pineda-Gutiérrez, J.; Miró-Amarante, L.; Hernández-Velázquez, M.; Sivianes-Castillo, F.; Domínguez-Morales, M. Designing a Wearable Device for Step Analyzing. In Proceedings of the 2019 IEEE 32nd International Symposium on Computer-Based Medical Systems (CBMS), Cordoba, Spain, 5–7 June 2019; pp. 259–262. [Google Scholar]
- Kidder, S.M.; Abuzzahab, F.S.; Harris, G.F.; Johnson, J.E. A system for the analysis of foot and ankle kinematics during gait. IEEE Trans. Rehabil. Eng. 1996, 4, 25–32. [Google Scholar] [CrossRef]
- Davis III, R.B.; Ounpuu, S.; Tyburski, D.; Gage, J.R. A gait analysis data collection and reduction technique. Hum. Mov. Sci. 1991, 10, 575–587. [Google Scholar] [CrossRef]
- Whittle, M.W. Gait analysis. In The Soft Tissues; Elsevier: United Kingdom, 1993; pp. 187–199. [Google Scholar]
- Lee, L.; Grimson, W.E.L. Gait analysis for recognition and classification. In Proceedings of the Fifth IEEE International Conference on Automatic Face Gesture Recognition, Washington, DC, USA, 21 May 2002; pp. 155–162. [Google Scholar]
- Giacomozzi, C. Hardware performance assessment recommendations and tools for baropodometric sensor systems. Ann. Dell’Ist. Super. Sanita 2010, 46, 158–167. [Google Scholar]
- Lundberg, A.; Svensson, O.K.; Bylund, C.; Goldie, I.; Selvik, G. Kinematics of the ankle/foot complex—Part 2: Pronation and supination. Foot Ankle 1989, 9, 248–253. [Google Scholar] [CrossRef] [PubMed]
- Descatoire, A.; Thévenon, A.; Moretto, P. Baropodometric information return device for foot unloading. Med. Eng. Phys. 2009, 31, 607–613. [Google Scholar] [CrossRef] [PubMed]
- Howell, A.M.; Kobayashi, T.; Hayes, H.A.; Foreman, K.B.; Bamberg, S.J.M. Kinetic gait analysis using a low-cost insole. IEEE Trans. Biomed. Eng. 2013, 60, 3284–3290. [Google Scholar] [CrossRef] [PubMed]
- Lee, S.S.; Choi, S.T.; Choi, S.I. Classification of Gait Type Based on Deep Learning Using Various Sensors with Smart Insole. Sensors 2019, 19, 1757. [Google Scholar] [CrossRef] [PubMed]
- Moreira, M.; Fiesler, E. Neural Networks with Adaptive Learning Rate and Momentum Terms; Technical Report; Idiap: Martigny, Switzerland, 1995. [Google Scholar]
- Tsai, L.C.; Yu, B.; Mercer, V.S.; Gross, M.T. Comparison of different structural foot types for measures of standing postural control. J. Orthop. Sports Phys. Ther. 2006, 36, 942–953. [Google Scholar] [CrossRef] [PubMed]
- Nissen, S. Implementation of a Fast Artificial Neural Network Library (Fann); Report; Department of Computer Science University of Copenhagen (DIKU): Copenhagen, Denmark, 2003; Volume 31, p. 29. [Google Scholar]
- Cheng, B.; Titterington, D.M. Neural networks: A review from a statistical perspective. Stat. Sci. 1994, 9, 2–30. [Google Scholar] [CrossRef]
- Rumelhart, D.E.; Hinton, G.E.; Williams, R.J. Learning representations by back-propagating errors. Cognit. Model. 1988, 5, 1. [Google Scholar] [CrossRef]
- Lazzaro, J.; Ryckebusch, S.; Mahowald, M.A.; Mead, C.A. Winner-take-all networks of O (n) complexity. In Advances in Neural Information Processing Systems; MIT Press: Cambridge, MA, USA, 1989; pp. 703–711. [Google Scholar]
- Sheela, K.G.; Deepa, S.N. Review on methods to fix number of hidden neurons in neural networks. Math. Probl. Eng. 2013, 2013, 425740. [Google Scholar] [CrossRef]
- Hegde, N.; Bries, M.; Swibas, T.; Melanson, E.; Sazonov, E. Automatic recognition of activities of daily living utilizing insole-based and wrist-worn wearable sensors. IEEE J. Biomed. Health Inform. 2017, 22, 979–988. [Google Scholar] [CrossRef] [PubMed]
- el Achkar, C.M.; Lenoble-Hoskovec, C.; Paraschiv-Ionescu, A.; Major, K.; Büla, C.; Aminian, K. Instrumented shoes for activity classification in the elderly. Gait Posture 2016, 44, 12–17. [Google Scholar] [CrossRef] [PubMed]
- Ngueleu, A.M.; Blanchette, A.K.; Bouyer, L.; Maltais, D.; McFadyen, B.J.; Moffet, H.; Batcho, C.S. Design and Accuracy of an Instrumented Insole Using Pressure Sensors for Step Count. Sensors 2019, 19, 984. [Google Scholar] [CrossRef] [PubMed]
- Chen, B.; Wang, X.; Huang, Y.; Wei, K.; Wang, Q. A foot-wearable interface for locomotion mode recognition based on discrete contact force distribution. Mechatronics 2015, 32, 12–21. [Google Scholar] [CrossRef]
- Pham, C.; Diep, N.N.; Phuong, T.M. e-Shoes: Smart shoes for unobtrusive human activity recognition. In Proceedings of the 2017 9th International Conference on Knowledge and Systems Engineering (KSE), Hue, Vietnam, 19–21 October 2017; pp. 269–274. [Google Scholar]
- Prado, A.; Cao, X.; Robert, M.T.; Gordon, A.M.; Agrawal, S.K. Gait Segmentation of Data Collected by Instrumented Shoes Using a Recurrent Neural Network Classifier. Phys. Med. Rehabil. Clin. 2019, 30, 355–366. [Google Scholar] [CrossRef] [PubMed]
- Hannink, J.; Kautz, T.; Pasluosta, C.F.; Gaßmann, K.G.; Klucken, J.; Eskofier, B.M. Sensor-based gait parameter extraction with deep convolutional neural networks. IEEE J. Biomed. Health Inform. 2016, 21, 85–93. [Google Scholar] [CrossRef]
- Zou, Q.; Wang, Y.; Zhao, Y.; Wang, Q.; Shen, C.; Li, Q. Deep Learning Based Gait Recognition Using Smartphones in the Wild. arXiv 2018, arXiv:1811.00338. [Google Scholar]
Figure 1.
Three different phases during the march.
Figure 1.
Three different phases during the march.
Figure 2.
(left) Foot pressure points, (middle) Sensors location (v1), (right) Sensors location (v2).
Figure 2.
(left) Foot pressure points, (middle) Sensors location (v1), (right) Sensors location (v2).
Figure 3.
(up-left) Below of the instrumented insole, (up-right) Embedded system with connections, (down) Top view of the final system.
Figure 3.
(up-left) Below of the instrumented insole, (up-right) Embedded system with connections, (down) Top view of the final system.
Figure 4.
Connections schematic.
Figure 4.
Connections schematic.
Figure 5.
States machine.
Figure 5.
States machine.
Figure 6.
User Application 1: (left) Monitoring and Data storing, (right) Training.
Figure 6.
User Application 1: (left) Monitoring and Data storing, (right) Training.
Figure 7.
Filtering and Normalization process. (left) Embedded system: filtering algorithm for each sensor. (right) Computer: normalization algorithm and storage/classification.
Figure 7.
Filtering and Normalization process. (left) Embedded system: filtering algorithm for each sensor. (right) Computer: normalization algorithm and storage/classification.
Figure 8.
User Application 2: (left) Classification, (right) Results.
Figure 8.
User Application 2: (left) Classification, (right) Results.
Figure 9.
Neural Network architecture.
Figure 9.
Neural Network architecture.
Figure 10.
Error obtained during the training process after each epoch (epochs 1 to 500 represented) using the training dataset itself.
Figure 10.
Error obtained during the training process after each epoch (epochs 1 to 500 represented) using the training dataset itself.
Figure 11.
Error obtained during the training process after each epoch (epochs 1 to 500 represented) using the testing dataset.
Figure 11.
Error obtained during the training process after each epoch (epochs 1 to 500 represented) using the testing dataset.
Table 1.
Number of dataset steps used for training and testing.
Table 1.
Number of dataset steps used for training and testing.
| Type of Footprint | Training (∼70%) | Testing (∼30%) | TOTAL |
|---|
| Supinator | 643 | 276 | 919 |
| Neutral | 764 | 327 | 1091 |
| Pronator | 740 | 317 | 1057 |
Table 2.
Relations between rear-foot eversion angles and the instrumented insole’s sensors for the real-time testing mode.
Table 2.
Relations between rear-foot eversion angles and the instrumented insole’s sensors for the real-time testing mode.
| Footprint | Angle | Average External Force (Sens. 2–4) | Average Internal Force (Sens. 5–7) |
|---|
| Supinator | <3 | [0.55, 1] | [0, 0.45] |
| Neutral | 3–9 | (0.4, 0.55) | (0.45, 0.6) |
| Pronator | >9 | [0, 0.4] | [0.6, 1] |
Table 3.
Classification results with the testing dataset.
Table 3.
Classification results with the testing dataset.
| Footprint | TP | FP | TN | FN | Accuracy | Sensitivity | Specificity | Precision | F1 Score |
|---|
| Supinator | 274 | 3 | 641 | 2 | 0.994565 | 0.99275362 | 0.9953416 | 0.98916968 | 0.9909584 |
| Neutral | 322 | 3 | 590 | 5 | 0.991304 | 0.98470948 | 0.994941 | 0.99076923 | 0.9877301 |
| Pronator | 316 | 2 | 601 | 1 | 0.996739 | 0.99684543 | 0.9966833 | 0.99371069 | 0.9952756 |
Table 4.
Confusion matrix for the testing dataset.
Table 4.
Confusion matrix for the testing dataset.
| | Supinator | Neutral | Pronator |
|---|
| Supinator | 99.28% | 0.72% | 0% |
| Neutral | 0.92% | 98.47% | 0.61% |
| Pronator | 0% | 0.32% | 99.68% |
Table 5.
Classification results for the real-time test.
Table 5.
Classification results for the real-time test.
| Footprint | TP | FP | TN | FN | Accuracy | Sensitivity | Specificity | Precision | F1 score |
|---|
| Supinator | 188 | 11 | 320 | 7 | 0.965779 | 0.96410256 | 0.9667674 | 0.94472362 | 0.9543147 |
| Neutral | 150 | 14 | 343 | 19 | 0.937262 | 0.88757396 | 0.9607843 | 0.91463415 | 0.9009009 |
| Pronator | 154 | 9 | 355 | 8 | 0.967681 | 0.95061728 | 0.9752747 | 0.94478528 | 0.9476923 |
Table 6.
Confusion matrix for the real-time test.
Table 6.
Confusion matrix for the real-time test.
| | Supinator | Neutral | Pronator |
|---|
| Supinator | 96.41% | 3.08% | 0.51% |
| Neutral | 6.51% | 88.76% | 4.73% |
| Pronator | 0% | 4.94% | 95.06% |
Table 7.
Accuracy comparison with related works.
Table 7.
Accuracy comparison with related works.
| Work | Year | Device | Method | Classification | Accuracy | Other metrics |
|---|
| [28] | 2017 | Commercial
Insole (IMU) | ¿? | Gait type | 92% | X |
| [29] | 2016 | Shoe (IMU) | DTA | Gait type | 97% | X |
| [30] | 2019 | Insole (5xFSRs) | Custom | Steps | 98.5% | X |
| [31] | 2015 | Insole (4xFSRs) | LDA and DTA | Gait type | 98.7% | X |
| [32] | 2017 | Shoe (Accel.) | NN | Gait type | 93% | X |
| [33] | 2019 | Shoe (Accel. and
3x Piezoresistive) | NN | Gait info 6 | X | Errors:
−5.9 ± 37.1 ms
11.4 ± 47.4 ms |
| [34] | 2016 | Shoe (IMU) | NN | Gait info | X | Error: 10%
± 0.12 s |
| [35] | 2018 | Smartphone (Accelerometer) | NN | Gait type | 91.8% | X |
| [20] | 2019 | Insole (IMU) | NN | Gait type | 90% | X |
| This work | 2019 | Insole (7xFSRs) | NN | Foot posture 7 | 99.4% | Sensitivity: 99.14%
Specificity: 99.56%
F1-Score: 99.12% |
© 2019 by the authors. Licensee MDPI, Basel, Switzerland. This article is an open access article distributed under the terms and conditions of the Creative Commons Attribution (CC BY) license (http://creativecommons.org/licenses/by/4.0/).

 ,
, 


