Featured Application
An application to recommend blended tea suited to the user’s preferred flavors and health benefits.
Abstract
The rapidly growing interest in healthy lifestyles and the health benefit of foods and the growing tea-consuming population are driving the growth of the tea industry. In particular, the growing preference among Millennials for premium blended tea is leading the growth of the tea market. In this paper, we study the feasibility of recommendation services for blended tea, which has not been addressed well by existing recommender systems. To this end, we design TeaPickTM, a mobile application that suggests a blend of tea suited to the user’s preferences including desired health benefits. To evaluate the application and its recommendations, we conduct not only a usability test, but also a consumer acceptance test with 31 participants. Our user study shows that the participants were positive about the recommendation service provided by our application and were generally satisfied with the recommended tea.
1. Introduction
The paradigm of decision-making in consumer behavior is gradually shifting from people to machines [1]. The advance of information communication technology (ICT), and machine learning and artificial intelligence (AI) technology have been driving this paradigm shift, causing many changes in the purchasing behavior of consumers [1,2]. Consumers conveniently order products at online shopping malls without having to check them directly at offline stores. They receive automatically generated recommendations on the products, films, music, and food that they want, and complete their purchases via recommendation algorithms, without the assistance of a sales person. Consumers are increasingly relying on ICT-based decision-making systems based on recommendation algorithms and big data analyses, such as recommender systems, for minimized shopping expenses and maximized convenience.
While there are many items that recommender systems target, such as books, movies, songs, and foods [3,4], there has rarely been a recommender system specialized for tea, which is one of the oldest drinks in human history. According to the report from Zion Market Research [5], the global tea market is forecasted to show significant growth; the market value was around USD 49,456.52 million in 2017 and it will grow at a compound annual growth rate (CAGR) of about 4.5% between 2018 and 2024. The rapidly growing interest in pursuing a healthy lifestyle, including the health benefits of consuming certain foods [6,7], and the growing tea-consuming population are driving the growth of tea industry [5]. Young consumers such as Millennials are also an important factor contributing to this growth [8,9].
Blended teas are positioning themselves among teas enjoyed by the young generation [9,10]. Blended teas, i.e., a mix of two or more types of tea materials and herbs [11], have a richer flavor than single teas. Consumers can expect not only the synergistic effects of their flavors, but also the health benefits from the ingredients of blended teas. However, there are more than a few hundred different types of blended teas. This makes it very difficult for consumers to choose the one that best matches their preferences. Also, it is not easy for consumers to enjoy blended teas unless they are high-involvement consumers who have a lot of experience with tea consumption.
In this paper, we study the feasibility of recommendation services for blended teas, which has not been addressed well by existing recommendation services. To this end, we design a mobile application, TeaPickTM. The application suggests certain blends of tea that are suited to the preferences of individual users, while providing useful information on blended tea. We adopt a content-based approach that allows us to provide recommendations on tea even without the initial preference data from a large number of consumers. We build a tea database and recommendation logic for the recommendation service based on the collaboration with experts in the tea industry and consumer research.
To investigate whether the developed application is useful for consumers and the tea industry, we conduct an evaluation regarding consumer behavior with 31 participants. Our user study covers the usability and usefulness of the application, user satisfaction, intention to use, brand attitude, and consumer preference for the recommended tea. The results show that our study participants were positive about the recommendation service provided by our application and that they were generally satisfied with the recommended tea.
2. Related Work
Recommender systems are a key technology for suggesting appropriate content, services, or products that suit the user’s needs based on the input of personal preference, area of interest, and purchase history [12]. For more than a decade, the use of recommender systems has increased, and giant global IT companies such as Google, Facebook, Netflix, and Amazon are actively using such systems for their marketing sales [3,4,13]. Recommender systems can be broadly classified into content-based filtering and collaborative filtering [12,14,15]. Content-based filtering measures the degree of similarity between item categories classified by pre-selected criteria and user-preferred items, and recommends items with high similarity. Collaborative filtering is a method of predicting preferences based on the assumption that consumers with similar preferences for certain items will have similar preferences for other items. Hybrid filtering is a combination of these two methods.
While tea, especially blended tea, has rarely been a target of recommender systems, studies have proposed recommender systems for food. Food recommender systems provide personalized recommendations for food items such as recipes, meals, or ingredients [16,17,18,19,20,21]. Ge et al. present a food and personalized recipe recommender system to suit individual taste [18]. They also propose a health-aware recommender system that not only offers recipe recommendations that suit the user’s taste preference but also provide nutritional information that promotes a healthy diet [22]. Pinxteren et al. propose a method to recommend healthier alternatives to routine recipes for commonly selected meals [19]. Different from these works, we aim to develop a recommendation service for blended tea. This paper investigates the feasibility of such a service through a mobile application usability test and a consumer acceptability test. It should be noted that the main focus of this study is not to propose a new recommendation algorithm. Rather, we adopt the well-known content-based approach to develop the mobile tea recommendation application.
There have been many studies on usability evaluations of mobile applications [23,24,25,26,27,28]. Some of these propose methodologies for usability evaluations of mobile applications in diverse application domains, such as mobile learning applications [24], mobile fitness applications [25], and mobile sale force automation applications [26]. In this paper, we evaluate the usability of our prototype mobile application for tea recommendation. The usability measure for our evaluation is based on previous works. However, our evaluation further covers other specific factors such as intention to use and brand attitude regarding consumer behavior for tea recommendation. In addition, we study consumer preference for the recommended tea, which is evaluated by users that have sampled the recommended tea.
3. Methods
3.1. Development of TeaPickTM Mobile Application
Our application provides useful information on blended tea and recommends tea suited to the preference of users. To build our recommendation logic, we adopt a content-based recommendation approach among other existing approaches as the first step towards the tea recommendation service. Collaborative filtering, which is another representative method used for recommendation systems based on the similarity between users, requires the user rating or preference information from a large number of users. However, it is difficult to apply this approach at the current stage since there is no available user preference/rating database for various blended teas. Based on this study, it will be possible to further develop a new tea recommendation service that utilizes the collaborative filtering method or hybrid one.
For content-based recommendation, it is necessary to determine product attributes and calculate user’s preference for products, and to determine rankings of products accordingly. To ensure effective recommendation, it is important to determine what the main attributes of the products are and how to express the user’s preference for them. Blended tea can be represented by a variety of attributes such as flavor, health benefits, recommended drinking time, presence of caffeine, strength of flavor, and ingredients. However, in blended tea selection, not all attributes are considered equally, but their importance differs for each attribute. Moreover, it is rather complicated to consider all of these various attributes to create a user’s preference profile. We collaborate with four domain experts to select the key attributes of the blended tea and develop a database for blended tea. The four experts consist of one tea sommelier (13 years of experience), two tea manufacturing experts (8 and 21 years of experience, respectively), and one food and nutrition expert (22 years of experience).
The attributes of blended tea selected through our collaboration with the tea experts include flavor, health benefits, recommended drinking time, two main ingredients, and presence of caffeine. Among them, flavor and health benefits include a total of 9 factors, respectively. Recommended drinking time includes a total of 5 factors. For this purpose, we first started with popular blended teas of one tea brand (i.e., 34 teas) since there are tens of thousands of different blended teas available in the Korean market. We collected information about the flavor, health benefits, and recommended drinking time of those teas from the experts through a couple of rounds of surveys and interviews. To achieve a common conclusion from the collected information, we adopted the Delphi method and determined the factors accordingly. To represent the unique characteristics of each tea, the four abovementioned experts assigned a score from 1 to 5 for each factor of flavor and health benefits. To develop a prototype of TeaPickTM for our experiment, we target 18 commercial blended teas and build a tea attribute database for those teas. Table 1 shows an example of the current tea attribute database.

Table 1.
Tea attribute database example.
In order to create a user’s preference profile, it is important to determine the tea attributes which users need to specify their preferences for. It is also important to present the appropriate number of attributes that the user can intuitively select and enter on the mobile screen. For this purpose, we conducted an online survey to determine the key attributes of tea and their importance to generate the desirable user’s preference profile. The survey respondents were 462 male and female adults, aged 19–59, living in six major cities in Korea. We examined the importance of health benefits, flavor, and drinking time. The results show that the most important factor in selecting blended tea was flavor, followed by health benefits. We thus assign a higher weight to the flavor than to other factors.
The main process of recommendation is to calculate the matching score of each tea for the user preference and to provide the three teas that rank the highest as the recommended tea, as depicted in Algorithm 1. The tea ranking operation is divided into two steps. First, the matching score of each tea is derived based on the user’s input for their preferred flavor and health benefits, as well as the scores given by the experts for the factors of tea attributes. As a result, the top 6 teas are determined, as can be seen in 1-1 and 1-2 of Algorithm 1. The matching score is determined by calculating the score for flavor and the score for the health benefits, and computing the weighted sum of the two. The score for flavor or health benefits is calculated by adding the scores (as shown in Table 1) of the factors selected by users. The weights of flavor and health benefits were set as 0.6 and 0.4, respectively, from the results of the consumer survey mentioned above. Second, based on the user’s preferred drinking time, the top three of the six teas are selected as recommended teas (see 2 in Algorithm 1). Priority is given to the teas with the recommended drinking time determined by the experts that matches the user’s preferred time. If there are multiple teas in the matching time zone, we rank teas in order of the matching score of teas. The reason why we did not include the factor of drinking time in the calculation of the matching score, as we did with the factors of flavor and health benefits, was that it was not appropriate to assign a score to the time.
| Algorithm 1 Recommended tea selection algorithm |
| Input: fu, a column vector for the preferred flavors of a user, fui = 1 if a user selects the ith flavor, otherwise 0 hu, a column vector for the preferred health benefits of a user, hui = 1 if a user selects the ith health benefit, otherwise 0 tu, a column vector for the preferred drinking time of a user, tui = 1 if a user selects the ith drinking time, otherwise 0 Tf, a matrix for the scores of the flavor factors of all teas from the tea attribute database Th, a matrix for the scores of the health benefit factors of all teas from the tea attribute database wf, a weight of the flavor attribute wh, a weight of the health benefit attribute Output: ltea, a list of three recommended tea ids //initialization K ← 3 C ← 6 sT ← [] ltea ← [] //1-1. calculate a column vector, s, containing matching scores of teas given user preferred flavors and health benefits s ← wfTffu + whThhu //1-2. select the teas with top-6 matching scores while size of sT < C do idxMax ← argmaxi(s) sT ← idxMax remove an element of s with index of idxMax //2. select the top-3 teas that matches the preferred drinking time for i ← 1 to C do if (recommended drinking time of sTi = user preferred drinking time) then ltea ← sTi if (size of ltea = K) then break if (size of ltea < K) then for i ← 1 to C do if (sTi is not an element of ltea) then ltea ← sTi if (size of ltea = K) then break return ltea |
Our prototype of TeaPickTM was implemented using the aforementioned recommended tea selection logic. We designed the application’s UI in a way that allows users to intuitively choose their preferred flavors and health benefits without any special assistance. Currently, the application asks users to select at least one factor for three tea attributes to create a preference profile. Up to 3 flavors can be selected from the nine, and up to two of the nine health benefits can be selected. We also designed a screen showing recommended teas so that users can easily find out important information about the three recommended teas. In addition, if a specific tea is selected from the recommended tea list, more detailed information about the tea and how to make tea is provided. Figure 1 shows the screenshots of the TeaPickTM prototype. Note that the current prototype is built in Korean for user study targeting Korean users.
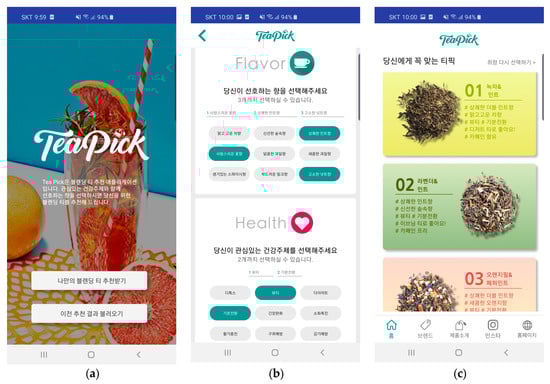
Figure 1.
Example screenshots of TeaPickTM prototype application. (a) A screen for starting recommendation, (b) A screen for user preference input, (c) A screen for recommended teas. * The current prototype is built in Korean for user study.
3.2. Experiment Setup
We conducted a user study based on survey questionnaires to evaluate our prototype application to recommend blended tea, TeaPickTM. Our evaluation consists of two tests: the application usability test of TeaPickTM and the consumer acceptability test for recommended tea. The former was designed to evaluate the usability, usefulness, satisfaction, intention to use, and brand attitude regarding the application and recommendation results after using TeaPickTM. The latter was designed to evaluate the overall preference for the recommended tea after the participants sampled the tea.
Participants: We recruited 33 participants for our experiment. After the experiment, we excluded two of them since their responses were incomplete. As a result, we analyzed data from total 31 participants. They included 17 males and 14 females and their age range was between 21 and 34 (mean: 25.3, SD: 2.82). Most of them were undergraduate/graduate students and some were office workers. This study was conducted in accordance with Institutional Review Board of KOREATECH (18120411). We gave the participants a brief explanation about the study purpose and obtained their consent. Everyone voluntarily participated and was compensated with a meal coupon worth USD 5.
Surveys: The survey questionnaires consisted of two types: one for the app usability test (type A) and the other for evaluating preference of recommended tea (type B). The type A questionnaire was designed with 5 constructs. These were the usability of the TeaPickTM mobile application, the perceived usefulness of the application, the satisfaction with recommendation, the intention to use the application, and the attitude toward recommended tea brands (i.e., brand attitude). We included 5 questions per construct based on the previous research [24,27,28,29]. The type B questionnaire was designed to evaluate the overall acceptability after users had sampled the recommended tea. Both types of questionnaires contained 7-point Likert scale questions (1 means strongly disagree and 7 means strongly agree).
Procedure: The experiment consisted of three parts. First, we briefly explained the purpose of the study and the process of experiment. We then provided the participants with an Android tablet on which the TeaPickTM application was installed. Second, the participants freely used the application while the experimenters observed how they used it and measured the total time they spent using it, meaning the time from when they touched the application launcher icon until they said that they were finished running the application. We allowed them to ask questions when they experienced any difficulty using the application. After they finished using the application, they responded to the type A questionnaire. In the meantime, the experimenters prepared the samples of three recommended teas. Third, the participants tasted those tea samples and responded to the type B questionnaire.
To ensure that the experiment ran smoothly, we used Android tablets (Galaxy Tab S3, Samsung Electronics Co., Ltd., Suwon, Korea) instead of allowing the participants to use their smartphones. Also, we set up a tablet on a cradle (BANADA® S1 Stand, DMK Korea Co., Ltd., Bucheon, Korea) so that the participants could use it stably. We used two tablets to allow two people to participate in the experiment simultaneously.
Sample tea preparation: To prepare the tea samples, we purchased 18 tea products used to implement the prototype of TeaPickTM. Among the commercial blended tea brands, we selected one brand (LOOKOURTEA, RESH Corp., Seongnam, Korea) to avoid any differences based on the brand. We prepared sample teas following the instruction to make tea shown in the package of tea products. To avoid causing any difference in the flavor of tea caused by the experiments, we refrained from shaking the tea bag while preparing the tea samples. We used commercially available bottled water (Baek-sansu, NONGSHIM Co., Ltd., Seoul, Korea) to prepare the tea. To serve the tea, we used 13.5oz white paper cups with no pattern (EVERYPACK, SJ Company Co., Seoul, Korea). To randomize the three recommended teas for each participant, we put a label with a random sampling number on each of the three cups and served them to the participant. After they drank one tea sample, we provided water to allow them to rinse their mouth before they drank another tea sample.
Data analysis: We analyzed the collected data using IBM SPSS Statistics 25.0 (IBM SPSS INC., Armonk, NY, USA). A descriptive analysis was conducted to provide summary statistics. A frequency analysis was conducted to analyze the characteristics of the sample. To test the reliability of our questionnaire, Cronbach’s α was analyzed for each construct. In addition, we conducted an analysis of variance (ANOVA) to analyze the difference in overall acceptability depending on the recommended tea rank. We used Duncan’s multiple range test as a post-hoc test.
4. Results and Discussion
4.1. Evaluation of TeaPickTM
Application use time: The participants used the application for 116.5 s on average (SD: 65.4 s). As shown in Figure 2, most of the participants used it for less than 3 minutes. They usually looked into the recommended teas and their information after inputting their preferred flavor, health benefits, and drinking time. While some only looked into the recommended teas, there were some participants who checked other screens such as the tea list page and looked at all the tea information provided by the application. Four participants used the application for more than 3 minutes.
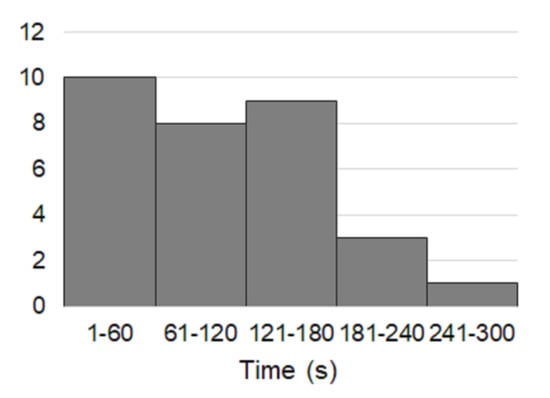
Figure 2.
Histogram of TeaPickTM app use time.
Usability: Usability measures the extent that the relevant functionalities and menus of the application can be used easily and conveniently while the users use TeaPickTM [28,29]. Table 2 shows the average scores of five usability questions. The participants were highly positive about the usability; the overall average score is 6.77 (SD: 0.46). The average scores of all five questions were larger than 6.5 and did not show large difference. Our current prototype is easy to use and its menu hierarchy is not complicated. Also, most of the participants were undergraduate or graduate students in their 20–30s who were proficient in using mobile devices and applications. We believe that they had no difficulty using the application because they were able to select their preference and get the recommendation results at once.
Table 2.
Usability of TeaPickTM.
Perceived usefulness: Perceived usefulness represents the application’s usefulness perceived by the users after using TeaPickTM [28,29]. As shown in Table 3, the participants felt positive about its usefulness; the overall average score is 5.56 (SD: 0.75). Of the 5 questions, the first three show relatively larger scores than the last two. The first three questions asked whether the application would be helpful for tea selection; most of the participants gave positive scores. However, questions 4 and 5 were rather broad; they asked whether the users thought this application would help with their daily lives. We conjecture that this was the main reason as to why there were relatively more participants giving lower scores. There were four and three participants who gave scores of less than four for questions 4 and 5, respectively. For the first three questions, however, no participant gave a score of less than four. We believe that most of the participants thought that TeaPickTM would be useful to select their preferred blended tea.
Table 3.
Perceived usefulness of TeaPickTM.
Satisfaction: Satisfaction measures the users’ satisfaction with the recommendation results and the application after they use TeaPickTM. On the whole, the participants were satisfied with the recommendation results provided by the application; the overall average score is 5.64 (SD: 0.78) (see Table 4). Of the five questions, four showed higher scores than the overall average. Only question 2 had a lower average score than the overall average. While there are a large number of blended tea products from different brands, our current prototype used 18 teas from one brand for recommendation. It might be that there were some recommended teas that the participants did not know, or that some recommended teas were different from what some participants expected. We conjecture that this is the main reason for the relatively low score of question 2.
Table 4.
Satisfaction with TeaPickTM.
Intention to use: As shown in Table 5, the participants were generally positive when asked about their intention to use the application; the overall average was 5.3 (SD: 1.02). While four of the five questions show an average score of 5 or more, the average score of question 1 is close to neutral. As can be seen in the results of questions 2–4, the participants responded positively to using the application. However, some participants gave a relatively low score regarding the installation of the application on their own smartphone (question 1). A total of 9 participants responded negatively, 11 responded neutrally, and 11 responded positively. We conjecture that this is mainly because the current application is a prototype that provides only the recommendation of 18 blended teas from one brand. Also, it might be that many participants did not feel the need to install the application on their smartphone because they did not enjoy drinking tea.
Table 5.
Intention to use TeaPickTM.
Brand attitude: The participants showed generally positive attitudes towards the brand of teas recommended by the application. As shown in Table 6, the average scores are 4.81–5.39 for the five questions; the overall average is 5.21 (SD: 0.92). The average score of only one question (question 5) is less than 5, i.e., 4.81. Although the TeaPickTM application used in this study is not a branded application for brand promotion, most of participants gave more than neutral scores for the brand attitude. We conjecture that this kind of recommendation application will have a positive effect on attracting new customers to the brand. However, even if the participants had a positive attitude towards the recommended tea brand after using the application, this does not necessarily imply the intention to purchase tea. For an in-depth study on purchase intention, it is necessary to conduct additional experiments with a larger number of participants using an upgraded application with additional functionalities such as purchasing.
Table 6.
Brand attitude.
4.2. Consumer Acceptance Test
Table 7 shows the statistics of overall acceptability for the three recommended teas. The average scores are 5.61, 4.39, and 4.58 for the first-rank teas, the second-rank teas, and the third-rank teas, respectively. The participants showed positive responses about the first-rank teas. Their responses were also more than neutral on average for the second and third rank teas. As shown in Table 7, there is a significant difference in overall acceptability according to the ANOVA test (p = 0.001). We conducted a post-hoc test to determine where differences in overall acceptability were found. The Duncan’s multiple range test shows that there is a statistically significant difference between the average score of the first–rank teas and that of the second- and third-rank teas. However, there is no significant difference between the scores of the second- and third-rank teas. We believe that the current result, especially the rank 1 result, shows the effect of the recommended tea selection.
Table 7.
Differences of overall acceptability by recommendation rank.
5. Conclusions
In this paper, we study the feasibility of a recommendation service for blended teas, which has not been addressed well by existing recommender systems. We design a mobile application, TeaPickTM, that suggests blended tea suited to the user’s preferences, and develop its prototype through our collaboration with domain experts in the tea industry. We conduct not only a usability test, but also a consumer acceptance test to evaluate the prototype application and its recommendation results. Our user study with 31 participants shows that they were positive about the recommendation provided by our application and were generally satisfied with the recommended tea. We believe that this study is a meaningful first-step towards a convergence research of computer science, consumer behavior, and food science. It is expected to contribute to enhancing the development of recommendation services in the tea industry, where it is important to adequately reflect consumer preferences.
Author Contributions
J.L. designed and performed the user study. J.L. and S.K. designed and developed the mobile application. J.L. and S.K. wrote the original draft of the manuscript and reviewed the manuscript.
Funding
This work was supported in part by the "Leaders in INdustry-university Cooperation +” Project, supported by the Ministry of Education and National Research Foundation of Korea (2018). This work was also supported in part by the Education and Research Promotion Program of KOREATECH (2017).
Conflicts of Interest
The authors declare no conflict of interest. The funders had no role in the design of the study; in the collection, analyses, or interpretation of data; in the writing of the manuscript, or in the decision to publish the results.
References
- Syam, N.; Sharma, A. Waiting for a sales renaissance in the fourth industrial revolution: Machine learning and artificial intelligence in sales research and practice. Ind. Mark. Manag. 2018, 69, 135–146. [Google Scholar] [CrossRef]
- Gupta, S.; Keen, M.; Shah, A.; Verdier, G.; Walutowy, M.F. (Eds.) Digital Revolutions in Public Finance; International Monetary Fund: Washington, DC, USA, 2017. [Google Scholar]
- Jallouli, M.; Lajmi, S.; Amous, I. Designing Recommender System: Conceptual Framework and Practical Implementation. Procedia Comput. Sci. 2017, 112, 1701–1710. [Google Scholar] [CrossRef]
- Jannach, D.; Resnick, P.; Tuzhilin, A.; Zanker, M. Recommender systems—Beyond matrix completion. Commun. ACM 2016, 59, 94–102. [Google Scholar] [CrossRef]
- Global Tea Market Will Reach USD 49,456.52 Million by 2024. Available online: https://www.globenewswire.com/news-release/2018/08/08/1549020/0/en/Global-Tea-Market-Will-Reach-USD-49-456-52-Million-by-2024-Zion-Market-Research.html (accessed on 29 July 2019).
- Chrysochou, P.; Askegaard, S.; Grunert, K.G.; Kristensen, D.B. Social discourses of healthy eating. A market segmentation approach. Appetite 2010, 55, 288–297. [Google Scholar] [CrossRef] [PubMed]
- Goetzke, B.; Nitzko, S.; Spiller, A. Consumption of organic and functional food. A matter of well-being and health? Appetite 2014, 77, 96–105. [Google Scholar] [CrossRef] [PubMed]
- FAO (Food and Agriculture Organization) of the United Nations. Global tea consumption and production driven by robust demand in China and India. Available online: http://www.fao.org/news/story/en/item/1136255/icode/ (accessed on 29 July 2019).
- Canadian Tea Market Overview. Available online: http://www.o-cha.net/english/association/information/documents/Louise.pdf (accessed on 29 July 2019).
- Which Trends Offer Opportunities on the European Tea Market? Available online: https://www.cbi.eu/market-information/tea/trends (accessed on 29 July 2019).
- Lee, H.J.; Ko, J.Y.; Seo, H.J. The study of the influence on satisfaction and loyalty of tea selection attributes. J. Tour. Leis. Res. 2013, 25, 289–307. [Google Scholar]
- Isinkaye, F.O.; Folajimi, Y.O.; Ojokoh, B.A. Recommendation systems: Principles, methods and evaluation. Egypt. Inform. J. 2015, 16, 261–273. [Google Scholar] [CrossRef]
- Pathak, B.; Garfinkel, R.; Gopal, R.D.; Venkatesan, R.; Yin, F. Empirical analysis of the impact of recommender systems on sales. J. Manag. Inf. Syst. 2010, 27, 159–188. [Google Scholar] [CrossRef]
- Choi, J.; Lee, H.J. An integrated perspective of user evaluating personalized recommender systems: Performance-driven or user-centric. J. Soc. e-Bus. Stud. 2014, 17. [Google Scholar] [CrossRef]
- Son, J.; Kim, S.B.; Kim, H.; Cho, S. Review and analysis of recommender systems. J. Korean Inst. Ind. Eng. 2015, 41, 185–208. [Google Scholar] [CrossRef]
- Freyne, J.; Berkovsky, S. Intelligent food planning: Personalized recipe recommendation. In Proceedings of the 15th International Conference on Intelligent User Interfaces, Hong Kong, China, 7–10 February 2010; pp. 321–324. [Google Scholar]
- Teng, C.-Y.; Lin, Y.-R.; Adamic, L.A. Recipe recommendation using ingredient networks. In Proceedings of the 3rd Annual ACM Web Science Conference, Evanston, IL, USA, 22–24 June 2012; pp. 298–307. [Google Scholar]
- Ge, M.; Elahi, M.; Fernaández-Tobías, I.; Ricci, F.; Massimo, D. Using tags and latent factors in a food recommender system. In Proceedings of the 5th International Conference on Digital Health, Florence, Italy, 18–20 May 2015; pp. 105–112. [Google Scholar]
- Pinxteren, Y.; Geleijnse, G.; Kamsteeg, P. Deriving a recipe similarity measure for recommending healthful meals. In Proceedings of the 16th International Conference on Intelligent User Interfaces, Palo Alto, CA, USA, 13–16 February 2011; pp. 105–114. [Google Scholar]
- Yang, L.; Hsieh, C.K.; Yang, H.; Pollak, J.P.; Dell, N.; Belongie, S.; Estrin, D. Yum-me: A personalized nutrient-based meal recommender system. ACM Trans. Inf. Syst. 2017, 36, 7. [Google Scholar] [CrossRef] [PubMed]
- Elsweiler, D.; Harvey, M. Towards automatic meal plan recommendations for balanced nutrition. In Proceedings of the 9th ACM Conference on Recommender Systems, Vienna, Austria, 16–20 September 2015; pp. 313–316. [Google Scholar]
- Ge, M.; Ricci, F.; Massimo, D. Health-aware food recommender system. In Proceedings of the 9th ACM Conference on Recommender Systems, Vienna, Austria, 16–20 September 2015; pp. 333–334. [Google Scholar]
- Olsina, L.; Santos, L.; Lew, P. Evaluating mobile app usability: A holistic quality approach. In Proceedings of the International Conference on Web Engineering, Toulouse, France, 1–4 July 2014; pp. 111–129. [Google Scholar]
- Parsazadeh, N.; Ali, R.; Rezaei, M.; Tehrani, S.Z. The construction and validation of a usability evaluation survey for mobile learning environments. Stud. Educ. Eval. 2018, 58, 97–111. [Google Scholar] [CrossRef]
- Alturki, R.; Gay, V. Usability testing of fitness mobile application: Methodology and quantitative results. In Proceedings of the 7th International Conference on Computer Science, Engineering & Applications, Copenhagen, Denmark, 23–24 September 2017; pp. 97–114. [Google Scholar]
- Borys, M.; Milosz, M. Mobile application usability testing in quasi-real conditions. In Proceedings of the 8th International Conference on Human System Interaction (HSI), Warsaw, Poland, 25–27 June 2015; pp. 381–387. [Google Scholar]
- Moumane, K.; Idri, A.; Abran, A. Usability evaluation of mobile applications using ISO 9241 and ISO 25062 standards. SpringerPlus 2016, 5, 548. [Google Scholar] [CrossRef] [PubMed]
- Treeratanapon, T. Design of the usability measurement framework for mobile applications. In Proceedings of the International Conference on Computer and Information Technology, Bangkok, Thailand, 16–17 June 2012; pp. 16–17. [Google Scholar]
- Davis, F.D. Perceived Usefulness, Perceived Ease of Use, and User Acceptance of Information Technology. MIS Q. 1989, 13, 319–340. [Google Scholar] [CrossRef]
© 2019 by the authors. Licensee MDPI, Basel, Switzerland. This article is an open access article distributed under the terms and conditions of the Creative Commons Attribution (CC BY) license (http://creativecommons.org/licenses/by/4.0/).