Article

Detecting the Extremely Small Angle of an Axicon by Phase-Shifting Digital Holography

College of Information Science and Engineering, Fujian Provincial Key Laboratory of Light Propagation and Transformation, Huaqiao University, Xiamen 361021, China
*
Author to whom correspondence should be addressed.
Appl. Sci. 2019, 9(19), 3959; https://doi.org/10.3390/app9193959
Submission received: 20 August 2019 / Revised: 11 September 2019 / Accepted: 16 September 2019 / Published: 20 September 2019
(This article belongs to the Special Issue Incoherent Digital Holography)

Abstract

:
Axicon is an optical element that can be used to produce high-quality Bessel beams efficiently. In general, the smaller the base angle of the axicon is, the longer the diffraction-free distance of the generated Bessel beam will be. Therefore, axicon with an extremely small base angle is important for the generation of Bessel beam. However, the measurement of an extremely small base angle is a challenge. Here, we applied the phase-shifting digital holography in the measurement of axicon angle. The errors of the three measured axicons with base angles of 0.5°, 1°, and 1° were 1.94%, 4.43%, and 1.63%, respectively.

Graphical Abstract

1. Introduction

As proposed by Durnin [1], Bessel beams have been receiving much attention because of their interesting properties. For example, Bessel beams have long diffraction-free distance and can reconstruct in the presence of an obstacle (self-reconstructing) [2,3,4,5]. Such properties make Bessel beams attractive for a broad range of applications, such as optical tweezers and particle trapping [6,7,8,9]. Bessel beams are also particularly involved in the applications in strong-field science, laser machining, biomedical imaging, and confocal microscopy [10,11,12,13,14,15,16]. Given the specific properties and important applications, the generation of Bessel beams is of considerable importance.
Several techniques such as diffractive optical element, spatial light modulator (SLM), and axicon, have been used to generate Bessel beams [17,18,19,20,21]. Among the techniques, the most common method to generate a Bessel beam is by using an axicon because of the low energy loss and high beam quality. The diffraction-free distance of a Bessel beam can be adjusted by changing the base angle of the axicon. In general, the smaller the base angle of the axicon is, the longer the diffraction-free distance of the generated Bessel beam will be [22]. Therefore, the production of axicons with a small base angle is important. However, as the base angle of an axicon decreases, its measurement becomes increasingly challenging. Thus, a method that can accurately measure the base angle of an axicon is necessary.
Some methods have been proposed to measure the base angle of an axicon. The coordinate measuring machine (CMM) method uses a contact probe to detect the base angle of an axicon. However, similar to other contact measurement methods, CMM may cause surface damage to the axicon, and the process is time-consuming. Computer-generated holograms (CGHs) were applied for the measurement of the axicon [23]. However, CGHs need to be precisely designed. A method based on the chromatic dispersion optical path was also proposed [24]. Although this method is easy to regulate, its angle deviation is relatively high. Wei et al. measured an axicon with a base angle of 20° by using an auto-collimation optical path [25]. Here, we applied the phase-shifting digital holography technique [26,27] to measure the base angle of axicons. Results show that this method can precisely detect the extremely small base angle of an axicon.

2. Theoretical Analysis

The electric field of the light after passing through an axicon can be expressed as follows:
E o b j e c t = A o exp [ i ( φ i + φ A ) ] ,
where Ao stands for amplitude, φi is the phase distribution of the background, and φA is the phase imposed by an axicon.
The electric field of the reference light is expressed as follows:
E r e f e r e n c e = A R exp ( i φ R ) ,
where AR stands for amplitude, and φR is the phase distribution of the reference light.
To obtain the phase change φA caused by the axicon, we adopt the four-step phase-shifting technique [27]. Phases 0, π/2, π, and 3π/2 are respectively imposed onto the reference beam. Then, the light intensity of the interference hologram, collected by charge coupled device (CCD), can be expressed by the following equation:
I 1 n = A R 2 + A o 2 + 2 A R A o cos [ φ R + ( n 1 ) π 2 ( φ i + φ A ) ]   ( n = 1 , 2 , 3 , 4 )
We obtain the following equations by removing the axicon and respectively imposing phases 0, π/2, π, and 3π/2 to the reference beam again, as follows:
I 2 n = A R 2 + A o 2 + 2 A R A o cos [ φ R + ( n 1 ) π 2 φ i ]   ( n = 1 , 2 , 3 , 4 ) .
According to Equation (3), four different holograms recording the interference of Bessel beam and reference light with phase shift of 0, π/2, π, and 3π/2 are obtained. These holograms contain the information of the axicon. In Equation (4), we have another four different holograms without the axicon. Compared with the expression of Equation (3), these four holograms do not contain the information of an axicon. Based on these interference holograms, we can deduce the phase of the axicon by the mathematical transformation, and the details are shown in the following section. As representative examples, three different methods using four, five, or eight phase-shifted holograms were introduced. Four holograms in Equation (3) are enough to derive the object phase with the known reference phase [27]. The most common reference is a plane wave with uniform amplitude and phase, which needs precise control of the reference light.
The phase can be solved using four phase-shifting holograms with the presence of an axicon, that is, I11, I12, I13, and I14 in Equation (3). The phase term can be expressed as follows:
tan ( φ R φ i φ A ) = I 14 I 12 I 11 I 13 .
Assuming the intensity of background light and reference light remains constant, that is, φRφi = 0, we obtain the following equation:
φ A = arctan ( I 14 I 12 I 11 I 13 ) .
We also solve the phase by using five phase-shifting holograms, that is, I11, I12, I13, and I14 in Equation (3) and I21 in Equation (4). Another four holograms are obtained by subtracting I21 from I11, I12, I13, and I14, respectively, as follows:
I n = I 1 n I 21   ( n =   1 , 2 , 3 , 4 ) .
Equation (7) can be further expressed as follows:
I n = 2 A R A o { cos [ φ R + ( n 1 ) π 2 ( φ i + φ A ) ] cos [ φ R φ i ) ] } .
We obtain the following equation by applying trigonometric transformation and filtering high-frequency terms:
I n = 2 A R A o sin [ φ A 2 + π 4 ( n 1 ) ] .
By applying the phase-shifting, we have:
tan ( φ A ) = I 4 2 I 2 2 I 1 2 I 3 2 .
Then, we obtain the expression of axicon phase by the following equation:
φ A = arctan ( I 4 2 I 2 2 I 1 2 I 3 2 ) .
We can also obtain the phase by using eight phase-shifting holograms, that is, I11, I12, I13, and I14 in Equation (3) and I21, I22, I23, and I24 in Equation (4). According to these equations, we can derive the following equations:
tan ( φ R φ i φ A ) = I 14 I 12 I 11 I 13 ,
tan ( φ R φ i ) = I 24 I 22 I 21 I 23 .
Equations (12) and (13) can be further written as follows:
tan φ A = ( I 11 I 13 ) ( I 24 I 22 ) ( I 14 I 12 ) ( I 21 I 23 ) ( I 11 I 13 ) ( I 21 I 23 ) + ( I 14 I 12 ) ( I 24 I 22 )
We can obtain phase φA by using inverse trigonometric function.
The phase introduced by axicon can be expressed as follows:
φ A = k × ( n 1 ) × γ × r
where k is the wave vector, n is the refractive index of axicon, γ is the base angle, and r is the radial length along the axicon. Therefore, the base angle of the axicon can be calculated using the phase distribution.

3. Experimental Result

The experimental setup is shown in Figure 1. A laser beam is split into two beams after transmitting through the beam expander consisting of two lenses. One of the beams is reflected onto the SLM by BS2. Given that SLM can only modulate light with polarization along the horizontal axis, a polarizer is inserted in front of the SLM. Another beam directly passes through the axicon, which is placed close to BS3 to reduce the distance that the object light travels before it interferes with the reference beam. Then, two beams are combined and interfered by BS3, whose results are recorded by a CCD. In the experiment, the phase shift is introduced by the SLM. According to the interference holograms with different phase shifts, the base angle of the axicon can be measured.
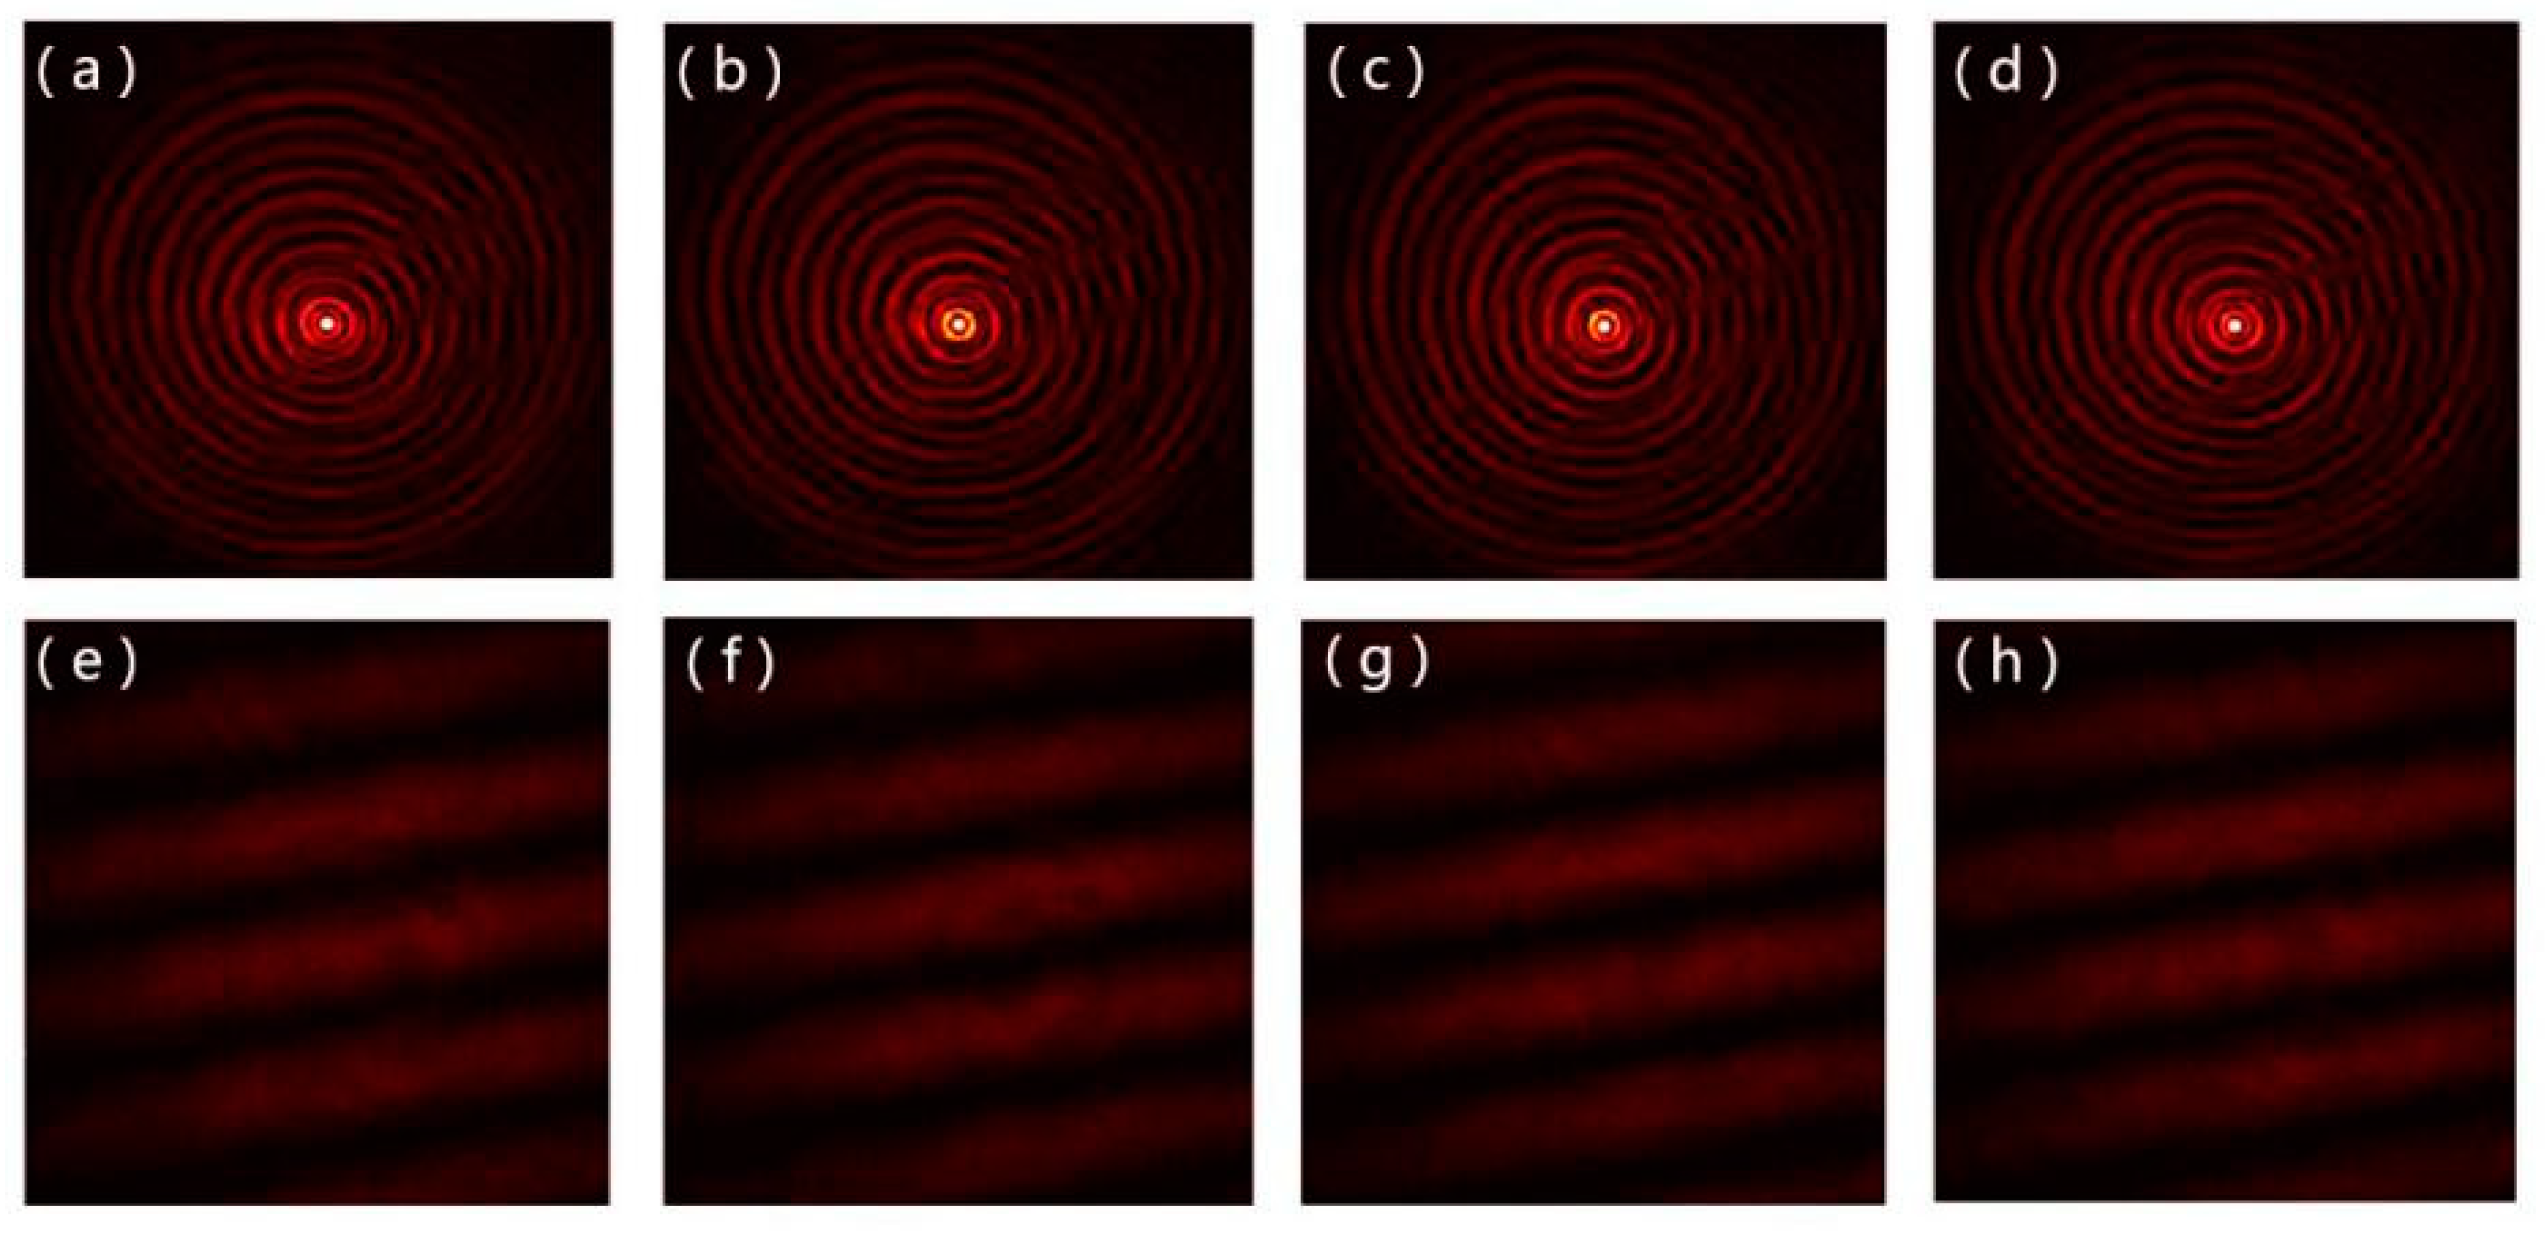
Based on the experimental setup, we can record the interference patterns, as shown in Figure 2. The upper four figures are recorded with the presence of the axicon. Figure 2a–d shows the interference results with the phase shifts of 0, π/2, π, and 3π/2, which correspond to I11, I12, I13, and I14 in Equation (3). Considering the line-focusing feature of the axicon, a focal spot surrounded by rings is generated. Removing the axicon from the experimental setup, the interference patterns of the reference light and the object light without axicon can be recorded, as presented in the lower part of Figure 2. These two beams can be approximately regarded as plane waves, thereby resulting in a series of oblique parallel lines. When introduced with different phase shifts, the fringes translate accordingly. With a phase shift of π, the fringes move roughly half the fringe’s width, which is consistent with the theoretical results.
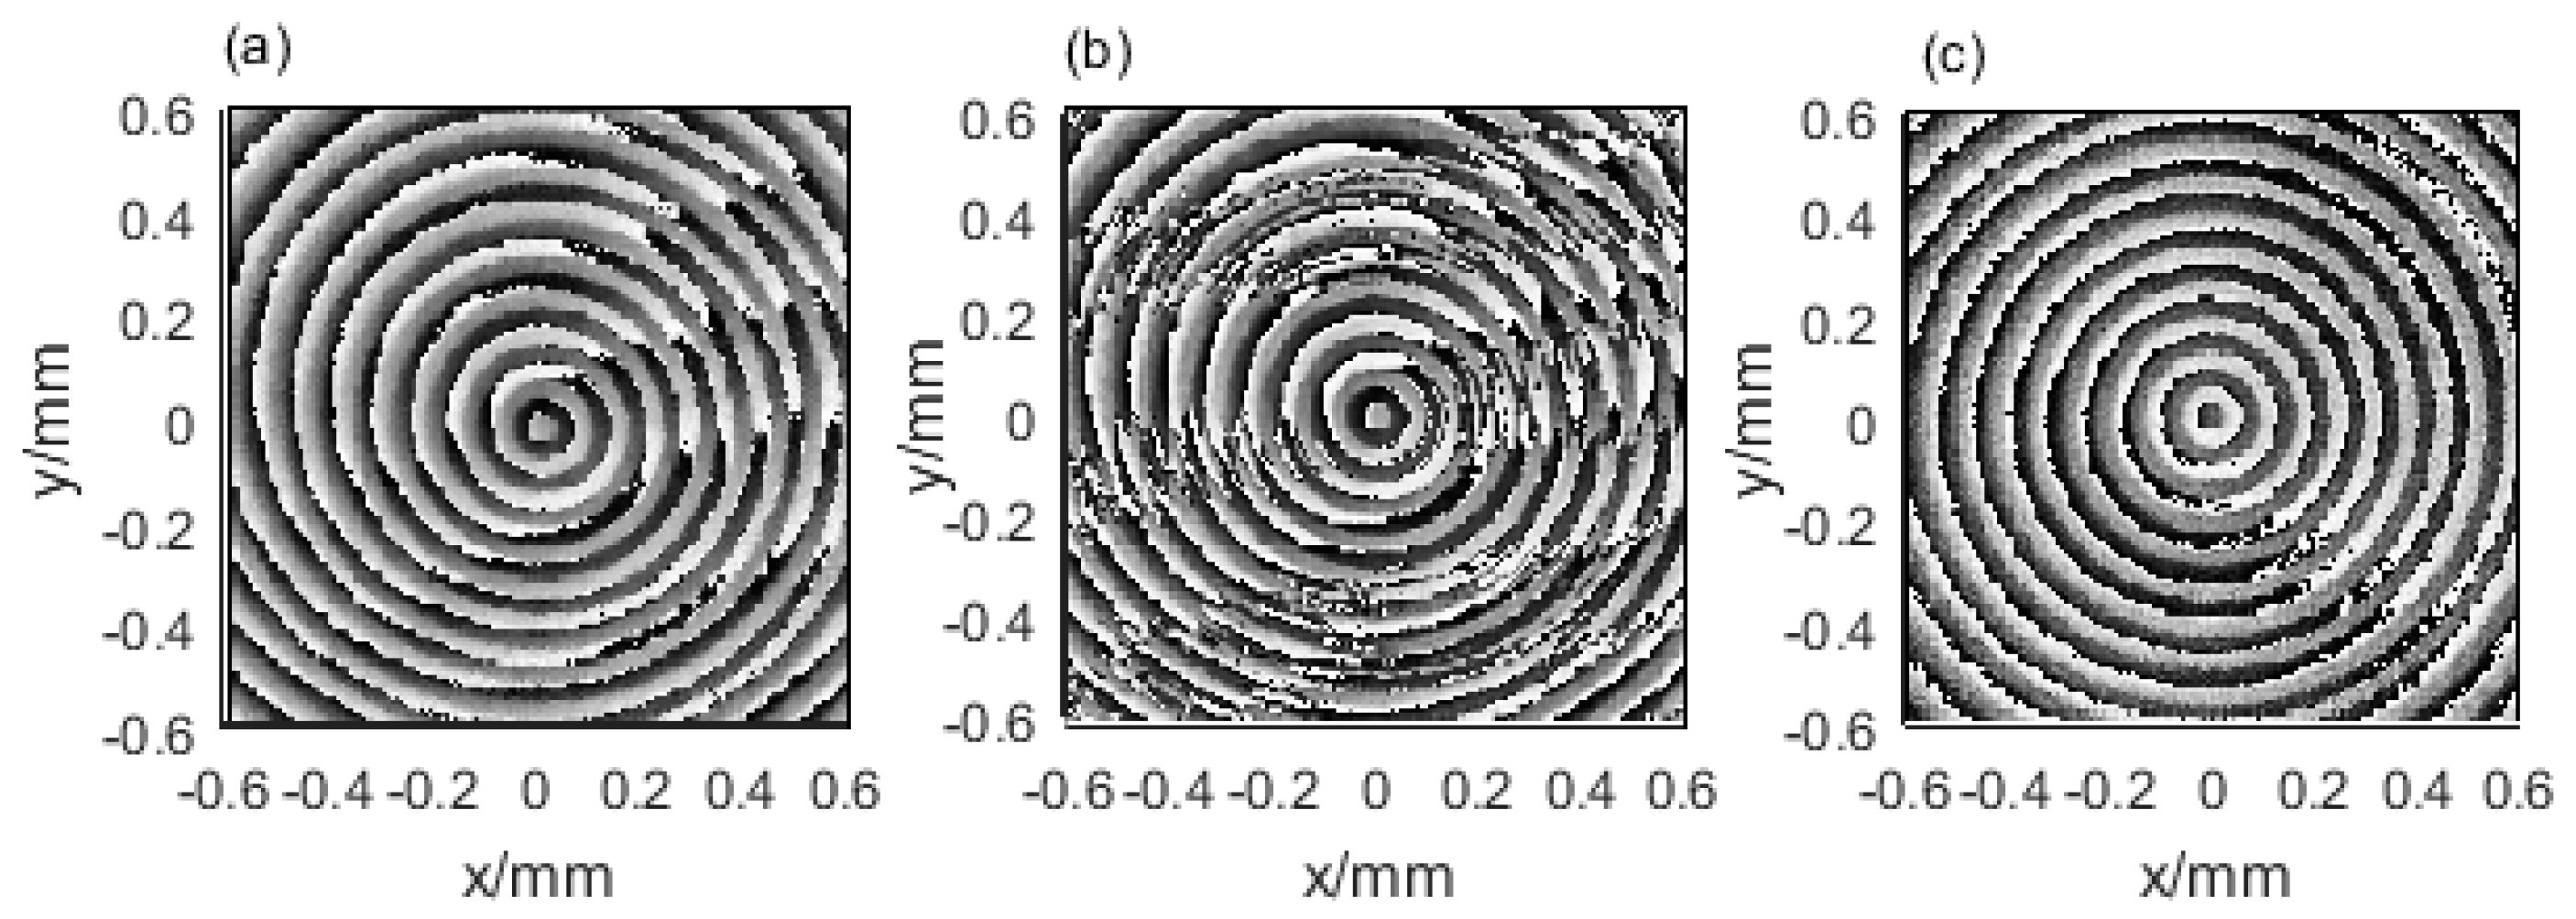
Using three phase extracting methods, we measure the angle of an axicon experimentally. The phase distribution solved by four interference holograms is a pattern with poor symmetry (Figure 3a) because the method assumes the background phase as 0, indicating the background phase is assumed to be constant. However, in the experiment, the background phase may change, which results in errors in the solved phase. A phase distribution with significant noise is solved using five interference holograms (Figure 3b). To solve the phase, we introduce a filter to eliminate the high-frequency noise in this method. Meanwhile, the introduction of the filter will result in an error at the position where the phase changes significantly. A better result is obtained by using eight interference holograms, as shown in Figure 3c. The phase distribution has a good circular symmetry, which agrees with the feature of the axicon.
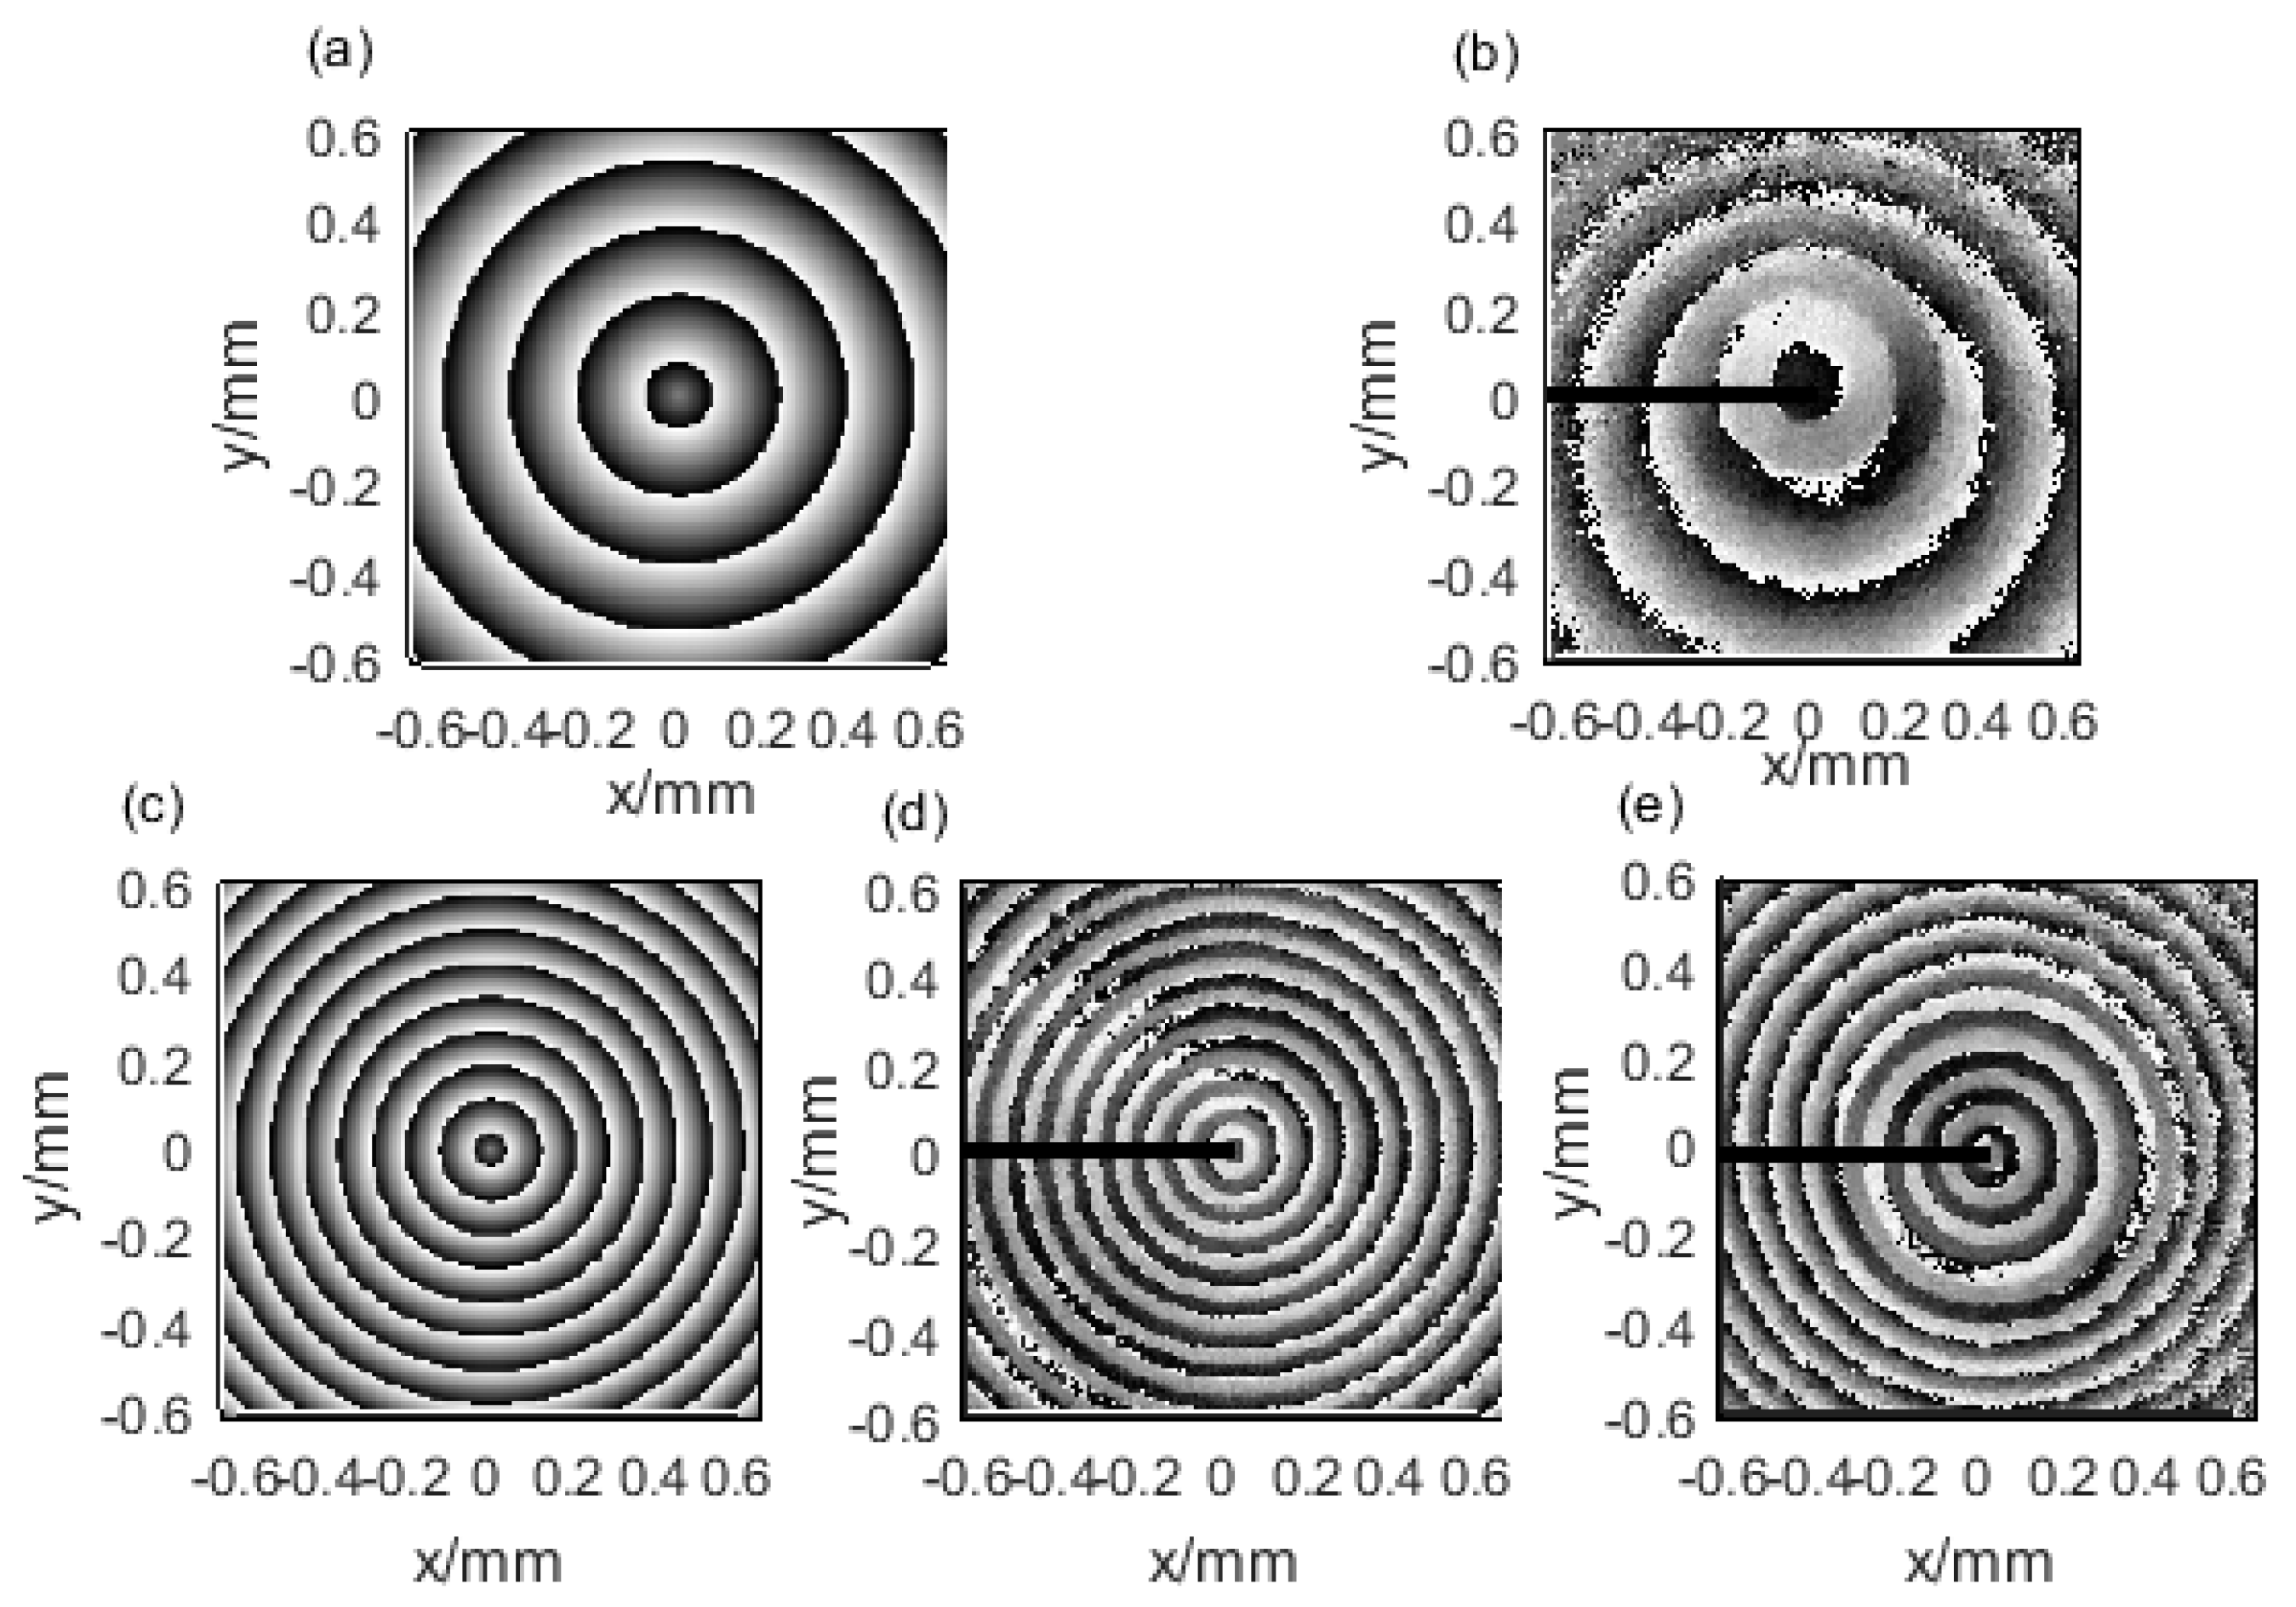
Using eight interference holograms, we measure the phase distribution of three axicons, that is, one with a base angle of 0.5° and the other two are 1°. Then we compare the experimental results with the theoretical data. Axicon has a tapered structure, whose thickness varies with radial distance. Therefore, the beam phase also presents periodic circular symmetric distribution as radial distance changes.
Figure 4a,c show the theoretical simulations of axicons with the base angles of 0.5° and 1°. Phase changes periodically with increasing radial distance. In the figure, the selected radial range is 0.63 mm. Within this range, the phase of the axicon with a base angle of 1° changes by approximately eight cycles, while that of the axicon with the base angle of 0.5° varies by approximately four cycles, which is half of the former. Figure 4b,d,e presents the corresponding experimental results, thereby indicating that the simulation and experimental results are consistent.
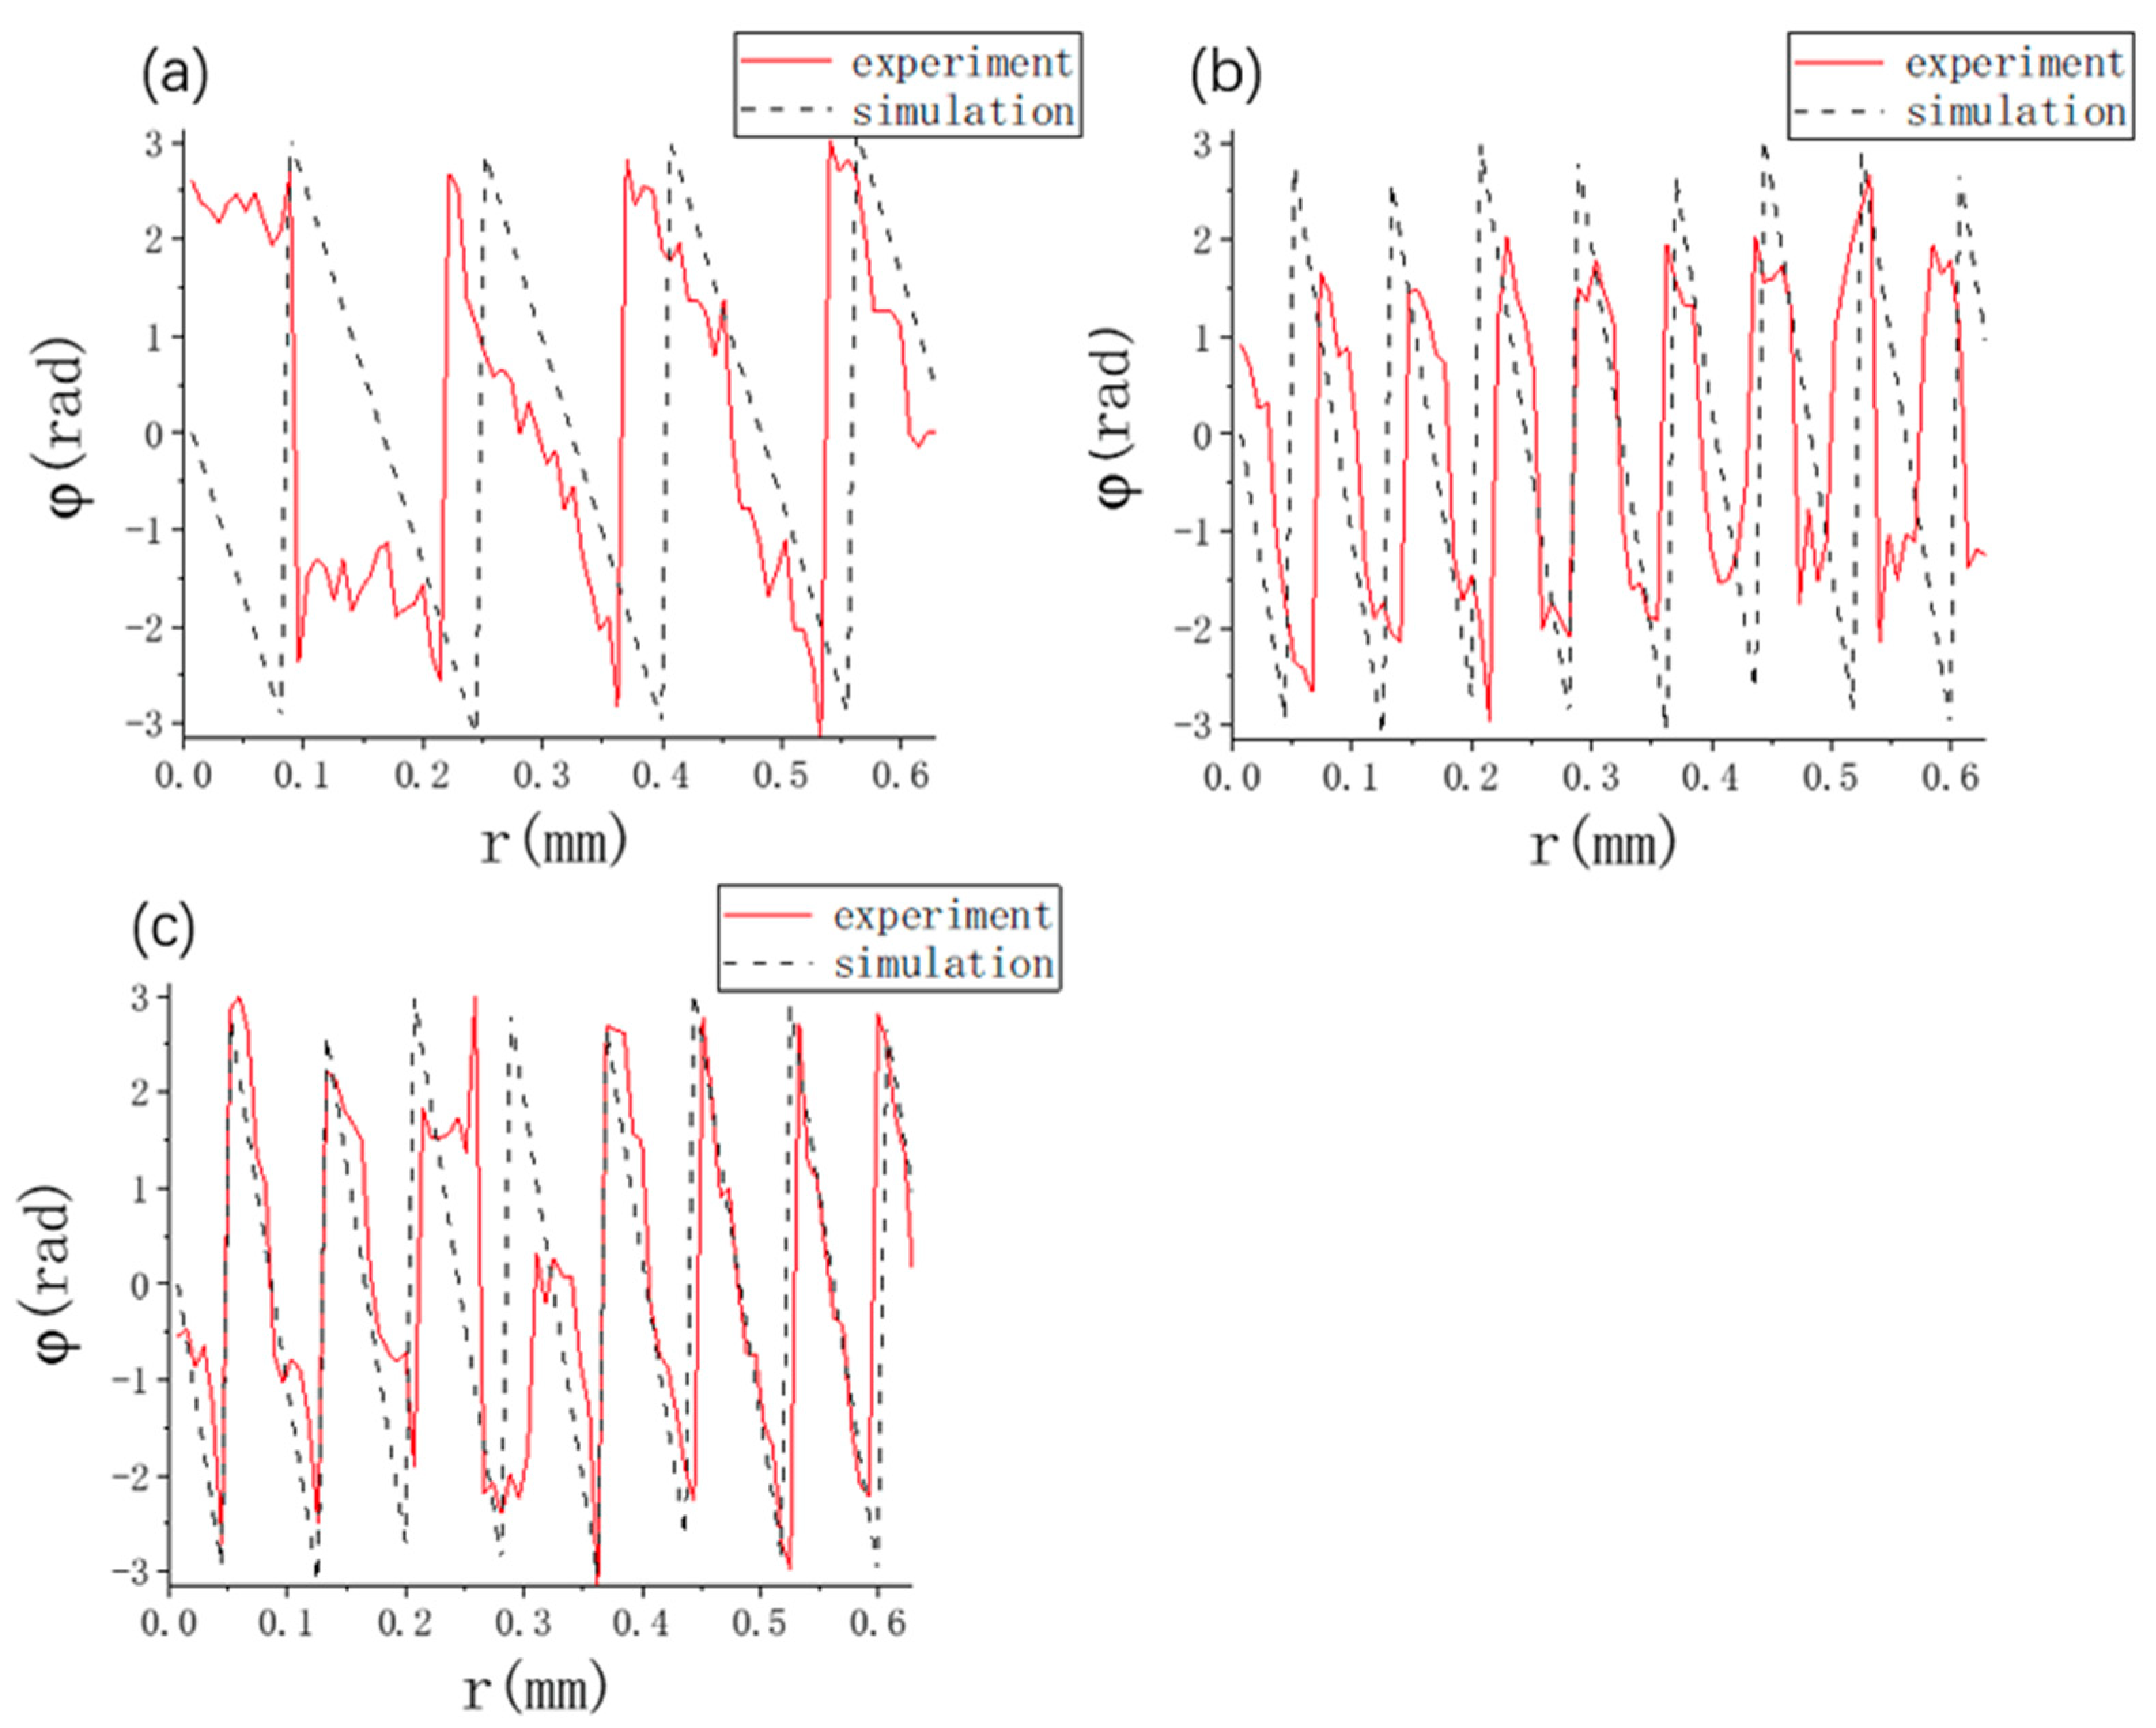
The phase change curve along the radial distance (along the black line in Figure 4b,d,e) shows the details of the error between theoretical simulation and experimental measurements, as presented in Figure 5. The experimental results of the three axicons show consistent results with the theoretical simulation. After calculation in radial range from 0 mm to 0.63 mm, the axicon with a base angle of 0.5° changed 3.924 periods in simulation and 4 periods in the experiment. Therefore, the error is 1.94%. The first axicon with the base angle of 1° (Figure 4d) shifts 7.849 periods in the simulation and 8.197 periods in the experiment, with the error of 4.43%; the second 1° axicon (Figure 4e) shifts 7.977 periods in the experiment, and the error is 1.63%. The errors may be caused by the following factors. First, axicon is not well-manufactured. As shown in Figure 3b, the position of the axicon tip is not at the center of the phase diagram, and the phase of the central spot shows insignificant change. Second, the phase-shift introduced by SLM may deviate from the required value.
We solve the phase of an axicon by phase-shifting digital holography, and obtain the base angle of the axicon by the phase map. If the digital holography is used instead of digital-phase shifting holography, only one hologram is recorded. In the hologram, the axicon phase is embedded with the phase of the reference beam. Some possible methods can be considered to solve the phase of the axicon. One is traditional digital hologram. For this method, the reconstruction of axicon’s phase should introduce another beam to illuminate the hologram in simulation. To perfectly qualify for reconstruction, this beam should possess the same properties as the reference beam, which is difficult to realize. Also, the statistic property of the hologram should be satisfied. Two other methods can be considered to eliminate the influence of reference beam. One is using a plane wave as a reference, then the phase of the reference can be treated as a constant. However, an ideal plane wave is difficult to achieve in experiment. The other one is detecting the phase of reference, which requires additional experimental measurement. Moreover, all these methods will introduce additional error, which affects the detection of the angle, especially for axicons with extremely small angle (smaller than 1 degree).

4. Conclusions

In conclusion, we introduced digital holography to measure the base angle of an axicon. With the help of Mach-Zehnder interference system, we used SLM to introduce phase shift and calculated the phase of the axicon by using interference holograms with different phase shifts. We experimentally calculated the phase by using four, five, or eight phase-shifted holograms. Our results showed that a better result can be obtained using eight holograms. Compared with theoretical simulation, we measured the phase of three axicons, that is, one with the base angle of 0.5° and the other two with 1° base angle, and the errors are 1.94%, 4.43%, and 1.63% respectively. The results indicated that the method can accurately measure the base angle of the axicon.

Author Contributions

Conceptualization, Z.C. and J.P.; methodology, Y.Z. and X.H.; validation, Y.Z., L.C. and W.F.; formal analysis, Y.Z. and L.C.; investigation, Y.Z., L.C., W.F. and Z.C.; data curation, Y.Z. and L.C.; writing—original draft preparation, Y.Z. and Z.C.; writing—review and editing, Z.C. and J.P.; supervision, J.P.; funding acquisition, Z.C., J.P.

Funding

This research was funded by National Natural Science Foundation of China (NSFC) under grant numbers 11674111, 61575070; Fujian Province Science Funds for Distinguished Young Scholar (No. 2018J06017); Natural Science Foundation of Fujian province (No. 2017J01003); Fundamental Research Funds for the Central Universities (ZQN-PY209).

Conflicts of Interest

The authors declare no conflict of interest.

References

  1. Durnin, J. Diffraction-free beams. Phys. Rev. Lett. 1987, 58, 1499–1501. [Google Scholar] [CrossRef] [PubMed]
  2. Tao, S.H.; Yuan, X.C. Self-reconstruction property of fractional Bessel beams: Reply to comment. J. Opt. Soc. Am. A 2009, 26, 2182. [Google Scholar] [CrossRef]
  3. Litvin, I.A.; McLaren, M.G.; Forbes, A. A conical wave approach to calculating Bessel-Gauss beam reconstruction after complex obstacles. Opt. Commun. 2009, 282, 1078–1082. [Google Scholar] [CrossRef]
  4. Gori, F.; Santarsiero, M. Twisted Gaussian Schell-model beams as series of partially coherent modified Bessel-Gauss beams. Opt. Lett. 2015, 4, 1587–1590. [Google Scholar] [CrossRef] [PubMed]
  5. Ye, H.; Huang, K.; Liu, H. Intrinsically shaping the focal behavior with multi-ring Bessel-Gaussian beam. Appl. Phys. Lett. 2017, 111, 031103. [Google Scholar] [CrossRef]
  6. Yang, L.; Ji, S.; Xie, K. High efficiency fabrication of complex microtube arrays by scanning focused femtosecond laser Bessel beam for trapping/releasing biological cells. Opt. Express 2017, 25, 8144–8157. [Google Scholar] [CrossRef] [PubMed]
  7. Ayala, Y.A.; Arzola, A.V.; Volke-Sepulveda, K. 3D micromanipulation at low numerical aperture with a single light beam: The focused-Bessel trap. Opt. Lett. 2016, 41, 614–617. [Google Scholar] [CrossRef]
  8. Rui, G.; Wang, X.; Cui, Y. Manipulation of metallic nanoparticle with evanescent vortex Bessel beam. Opt. Express 2015, 23, 25707–25716. [Google Scholar] [CrossRef]
  9. Wang, X.; Liu, Z.R.; Zhao, D. Fractional Fourier transform of hollow sinh-Gaussian beams. Opt. Eng. 2014, 53, 086112. [Google Scholar] [CrossRef] [Green Version]
  10. Summers, A.M.; Yu, X.; Wang, X. Spatial characterization of Bessel-like beams for strong-field physics. Opt. Express 2017, 25, 1646–1655. [Google Scholar] [CrossRef]
  11. Zhang, Z.; Zeng, X.; Miao, Y.; Fan, Y.; Gao, X. Focusing properties of vector Bessel-Gauss beam with multiple-annular phase wavefront. Optik 2017, 157, 240–247. [Google Scholar] [CrossRef]
  12. Chen, S.; Li, S.; Zhao, Y. Demonstration of 20-Gbit/s high-speed Bessel beam encoding/decoding link with adaptive turbulence compensation. Opt. Lett. 2016, 41, 4680–4683. [Google Scholar] [CrossRef] [PubMed]
  13. Schreiber, B.; Elsayad, K.; Heinze, K.G. Axicon-based Bessel beams for flat-field illumination in total internal reflection fluorescence microscopy. Opt. Lett. 2017, 42, 3880–3883. [Google Scholar] [CrossRef] [PubMed]
  14. Thibon, L.; Lorenzo, L.E.; Piche, M. Resolution enhancement in confocal microscopy using Bessel-Gauss beams. Opt. Express 2017, 25, 2162–2177. [Google Scholar] [CrossRef] [PubMed]
  15. Wu, B.; Zeng, X.; Miao, Y.; Fan, Y.; Gao, X.; Zhuang, S. Focal shift of radial varying polarized Bessel-Gauss beam with radial phase modulation. Optik 2017, 157, 675–683. [Google Scholar] [CrossRef]
  16. Li, X.; Ji, X. Effect of thermal blooming on the beam quality of truncated laser beams. Optik 2016, 127, 8350–8356. [Google Scholar] [CrossRef]
  17. Ouadghiri-Idrissi, I.; Giust, R.; Froehly, L. Arbitrary shaping of on-axis amplitude of femtosecond Bessel beams with a single phase-only spatial light modulator. Opt. Express 2016, 24, 1495–1504. [Google Scholar] [CrossRef]
  18. Litvin, I.A.; Mhlanga, T.; Forbes, A. Digital generation of shape-invariant Bessel-like beams. Opt. Express 2015, 23, 7312–7319. [Google Scholar] [CrossRef]
  19. Dudley, A.; Li, Y.; Mhlanga, T. Generating and measuring nondiffracting vector Bessel beams. Opt. Lett. 2013, 38, 3429–3432. [Google Scholar] [CrossRef]
  20. Pavone, S.C.; Ettorre, M.; Casaletti, M. Transverse circular-polarized Bessel beam generation by inward cylindrical aperture distribution. Opt. Express 2016, 24, 11103. [Google Scholar] [CrossRef]
  21. Wang, D.; Li, B.; Rong, L. Extended depth of field in continuous-wave terahertz computed tomography based on Bessel beam. Opt. Commun. 2019, 432, 20–26. [Google Scholar] [CrossRef]
  22. Selcuk, A.; Bing, Z. Intensity distribution around the focal regions of real axicons. Opt. Commun. 2008, 281, 4240–4244. [Google Scholar]
  23. Ma, J.; Pruss, C.; Häfner, M.; Heitkamp, B.; Zhu, R.; Gao, Z.; Yuan, C.; Osten, W. Systematic analysis of the measurement of cone angles using high line density computer-generated holograms. Opt. Eng. 2011, 50, 055801. [Google Scholar]
  24. Zhang, Y.B.; Zeng, A.J.; Wang, Y.; Huang, H.J. A method for measuring the base angle of axicon lens based on chromatic dispersion. Opt. Commun. 2015, 346, 69–73. [Google Scholar] [CrossRef]
  25. Wei, Z.; Yuan, Q.; Ma, X. Measurement of base angle of an axicon lens based on auto-collimation optical path. Opt. Commun. 2019, 434, 23–27. [Google Scholar] [CrossRef]
  26. Yamaguchi, I.; Zhang, T. Phase-shifting digital holography. Opt. Lett. 1997, 22, 1268–1270. [Google Scholar] [CrossRef]
  27. Nomura, T.; Shinomura, K. Generalized sequential four-step phase-shifting color digital holography. Appl. Opt. 2017, 56, 6851–6854. [Google Scholar] [CrossRef]
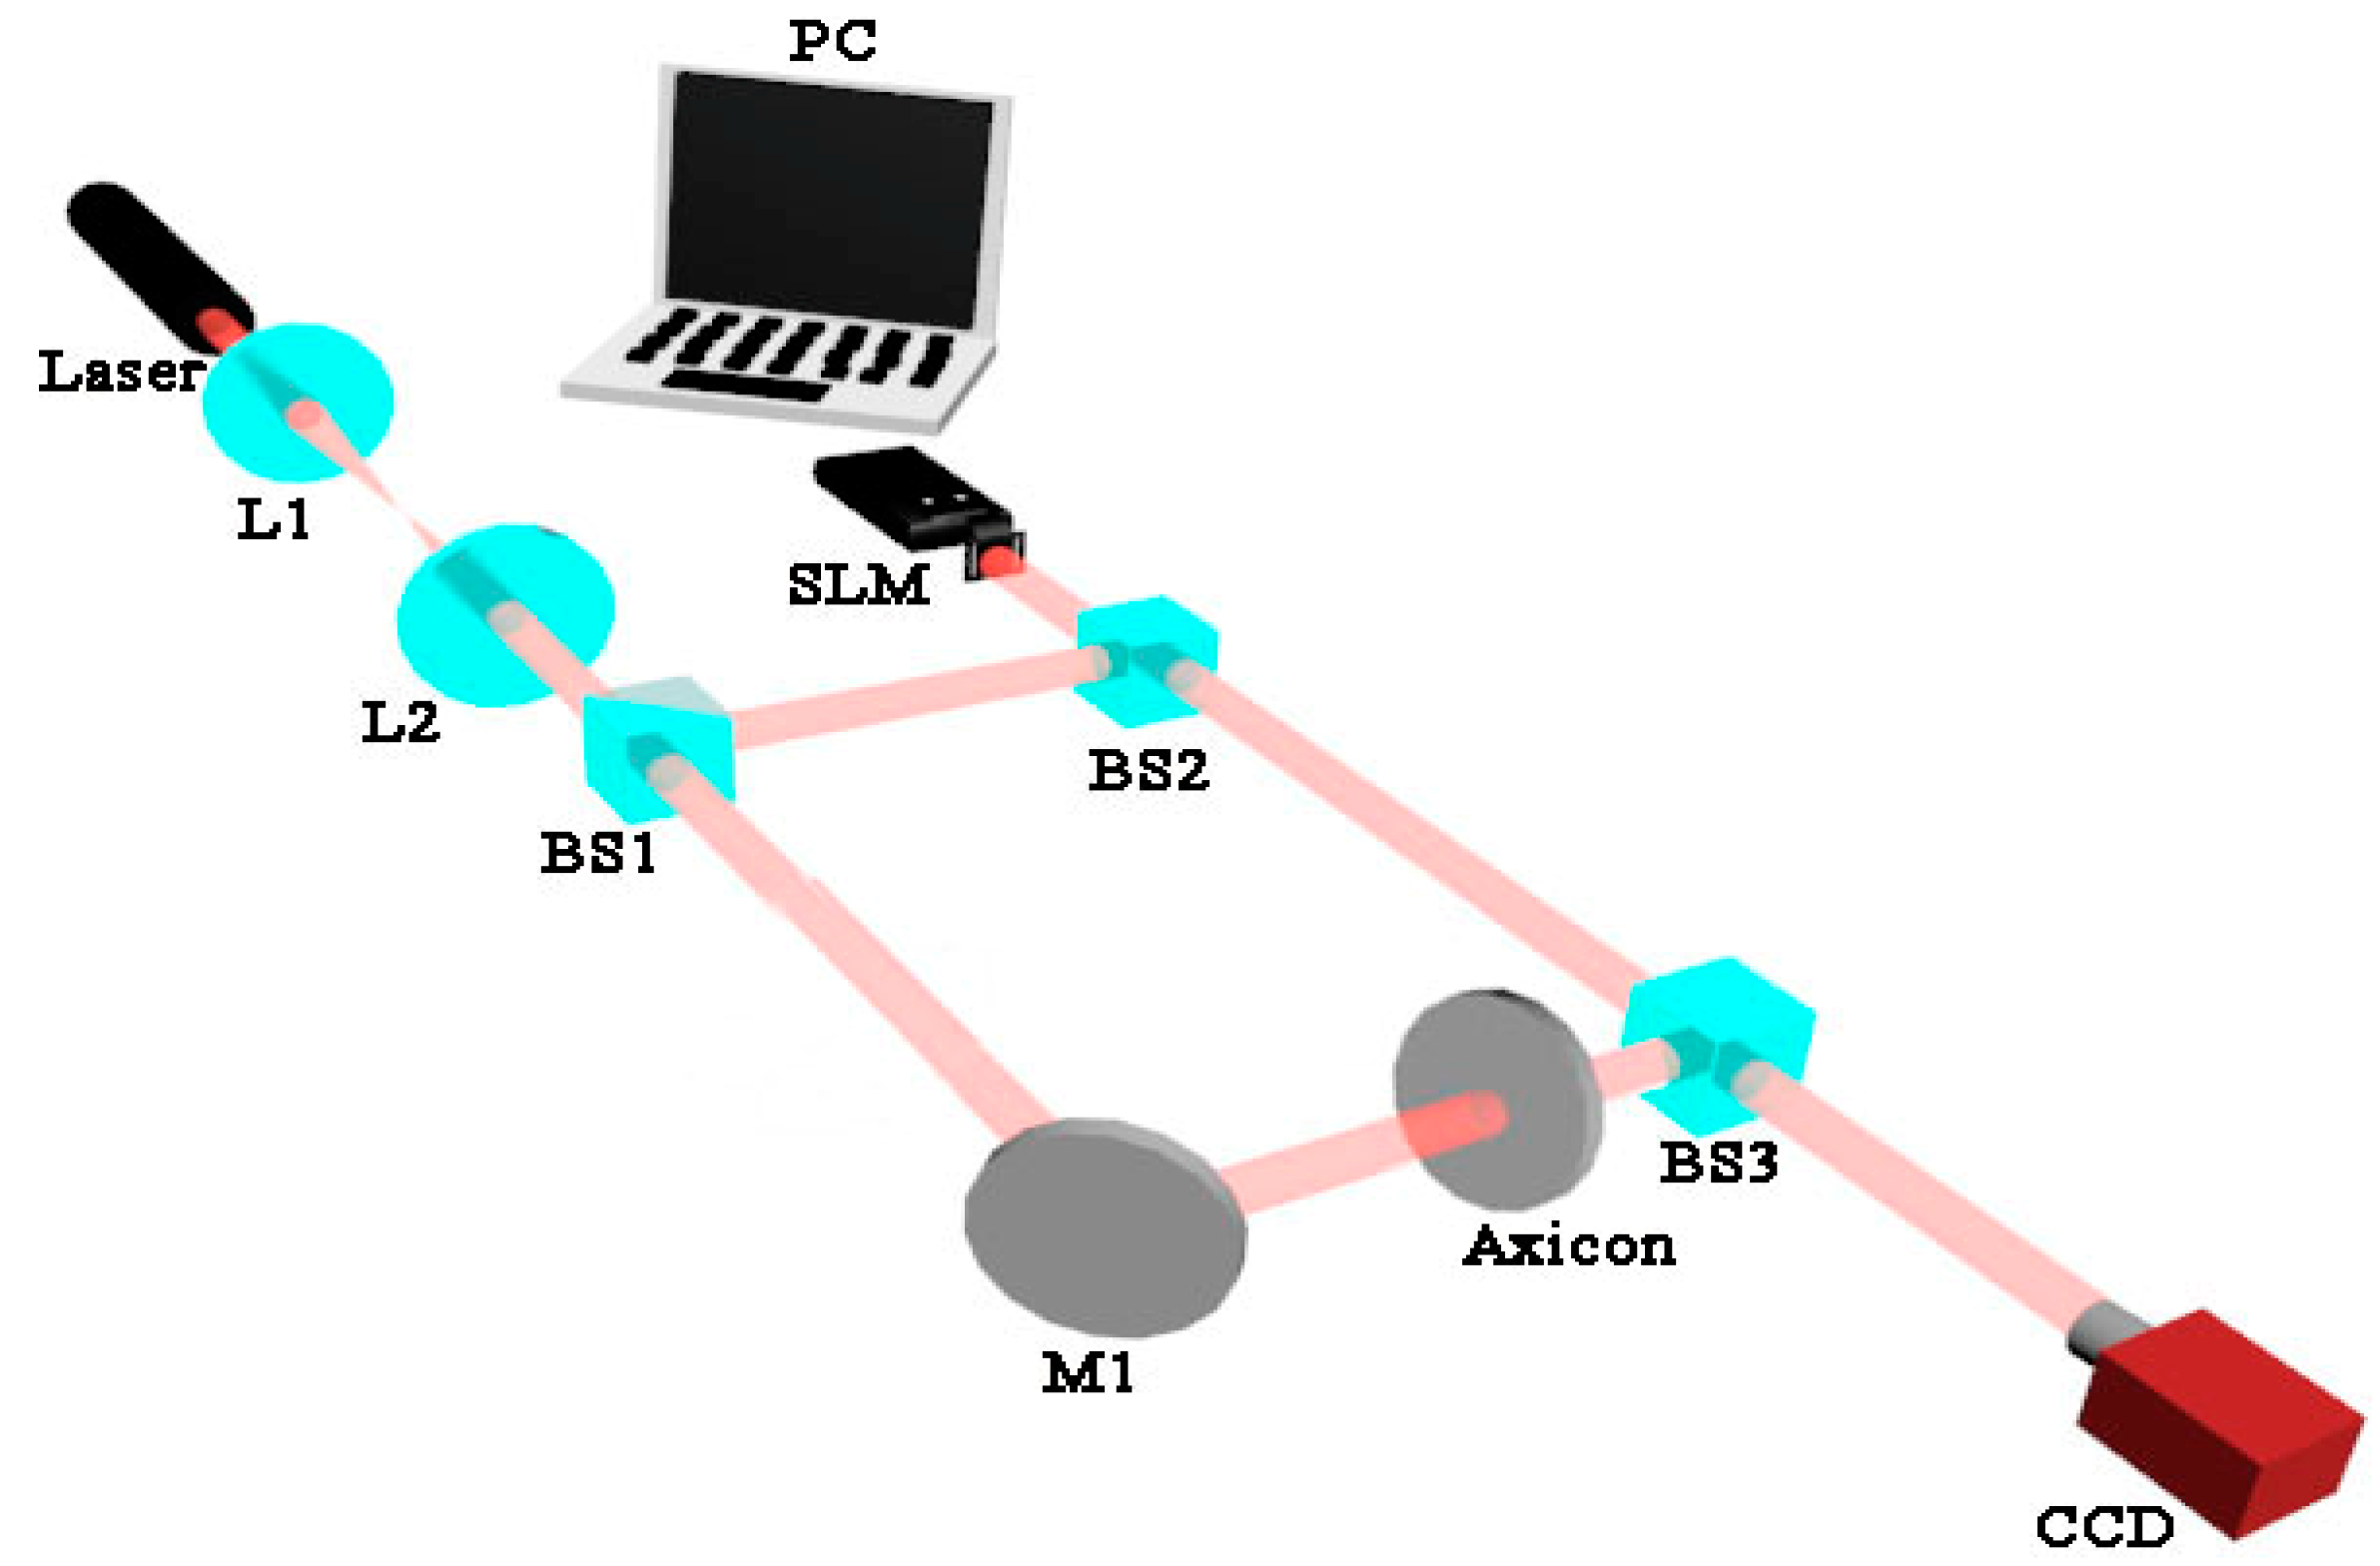
Figure 1. Experiment setup of phase-shifting digital holography for measuring the base angle of axicon. SLM: Spatial light modulator; CCD: Charge coupled device.
Applsci 09 03959 g001
Figure 2. (ad) Interference patterns of the light passing through the axicon interfering with the reference light with different phase shift. (eh) Interference fringes of the plane wave interfering with the reference light with different phase shift. (a,e) Phase shifts of 0; (b,f) phase shifts of π/2; (c,g) phase shifts of π; (d,h) phase shifts of 3π/2.
Applsci 09 03959 g002
Figure 3. solved phase with different phase-shifted holograms. (a) Four phase-shifted holograms; (b) five phase-shifted holograms; (c) eight phase-shifted holograms.
Applsci 09 03959 g003
Figure 4. Phase of axicons with different base angle. (a) Theoretical simulation of axicon with base angle of 0.5°. (b) Experimental measurement of axicon with base angle of 0.5°. (c) Theoretical simulation of axicon with base angle of 1°. (d) Experimental measurement of one axicon with base angle of 1°. (e) Experimental measurement of another axicon with base angle of 1°.
Applsci 09 03959 g004
Figure 5. The phase profile along the radial direction. The base angle of the axicon is (a) 0.5 degree; (b) the first 1 degree; (c) the second 1 degree.
Applsci 09 03959 g005