Article

Experimental Investigation on Semi-Active Control of Base Isolation System Using Magnetorheological Dampers for Concrete Frame Structure

1
School of Civil Engineering, Qingdao University of Technology, Qingdao 266033, China
2
Co-operative Innovation Center of Engineering Construction and Safety in Shandong Peninsula Blue Economic Zone, Qingdao University of Technology, Qingdao 266033, China
3
Center for Infrastructure Engineering, Western Sydney University, Penrith, NSW 2751, Australia
*
Authors to whom correspondence should be addressed.
Appl. Sci. 2019, 9(18), 3866; https://doi.org/10.3390/app9183866
Submission received: 22 August 2019 / Revised: 10 September 2019 / Accepted: 11 September 2019 / Published: 14 September 2019

Abstract

:
The traditional passive base isolation is the most widely used method in the engineering practice for structural control, however, it has the shortcoming that the optimal control frequency band is significantly limited and narrow. For the seismic isolation system designed specifically for large earthquakes, the structural acceleration response may be enlarged under small earthquakes. If the design requirements under small earthquakes are satisfied, the deformation in the isolation layer may become too large to be accepted. Occasionally, it may be destroyed under large earthquakes. In the isolation control system combined with rubber bearing and magnetorheological (MR) damper, the MR damper can provide instantaneous variable damping force to effectively control the structural response at different input magnitudes. In this paper, the control effect of semi-active control and quasi-passive control for the isolation control system is verified by the shaking table test. In regard to semi-active control, the linear quadratic regulator (LQR) classical linear optimal control algorithm by continuous control and switch control strategies are used to control the structural vibration response. Numerical simulation analysis and shaking table test results indicate that isolation control system can effectively overcome the shortcoming due to narrow optimum control band of the passive isolation system, and thus to provide optimal control for different seismic excitations in a wider frequency range. It shows that, even under super large earthquakes, the structure still exhibits the ability to maintain overall stability performance.

1. Introduction

Isolation technology is the most widely used structural vibration control technology in the world. It can effectively reduce the natural frequency of the structure and make the natural vibration period of the structure far distant from the predominant period of the earthquake [1]. Structural isolation is mainly divided into base isolation and inter-story isolation and base isolation is most used in practical projects [2,3,4]. Meanwhile, due to the excellent performance of isolation technology, many different isolation devices (e.g., rubber isolation bearings, lead rubber isolation bearings, friction pendulum bearings, etc.) are used in buildings and bridges [5,6,7,8,9,10,11,12,13,14,15]. However, passive isolation also has many disadvantages. Because of the greater uncertainty of the earthquake, the isolation structure cannot be checked in all cases of design, which may lead to the displacement of the isolation layer exceeding the design requirements. The plastic deformation of isolation bearing cannot be restored, the structure is in danger of rollover and overturning [16,17,18,19,20].
To solve this problem, many scholars have adopted the method of adding various dampers (e.g., viscous dampers, magnetorheological dampers, friction dampers, etc.) into the isolation layer of the structure to limit its displacement [21,22,23,24]. As a semi-active control, the input voltage of the magnetorheological (MR) fluid is calculated by the feedback of external excitation to change the viscous coefficient of the MR damper, which can approach the control effect of active control without a large amount of energy input [25,26,27,28,29,30,31,32,33], and it also performed well in the isolation layer [34,35,36,37,38,39,40,41,42,43,44]. Therefore, the control strategy of the MR damper is particularly important, and many scholars have done a lot of research on it [45,46,47,48,49,50]. However, the MR dampers also have the disadvantage of time-delay. In strong earthquakes, short time-delay may lead to the failure of MR dampers to control structures. Therefore, whether the control of MR dampers under high-intensity earthquakes can be effective is a matter of great concern.
In this paper, the MR damper isolation system is studied utilizing experiment and numerical simulation. The control effect of MR damper under two control strategies, continuous control and switching control, is analyzed by linear quadratic regulator (LQR) algorithm. At the same time, a viscous damper and friction damper are used to comparative analyze at the same model structure, which verifies the superiority of the control effect of MR damper under two control strategy. Finally, the semi-active MR damper isolation structure under a high-intensity earthquake is tested and the feasibility of the MR isolation system under a high-intensity earthquake is verified.

2. Magnetorheological Isolation System
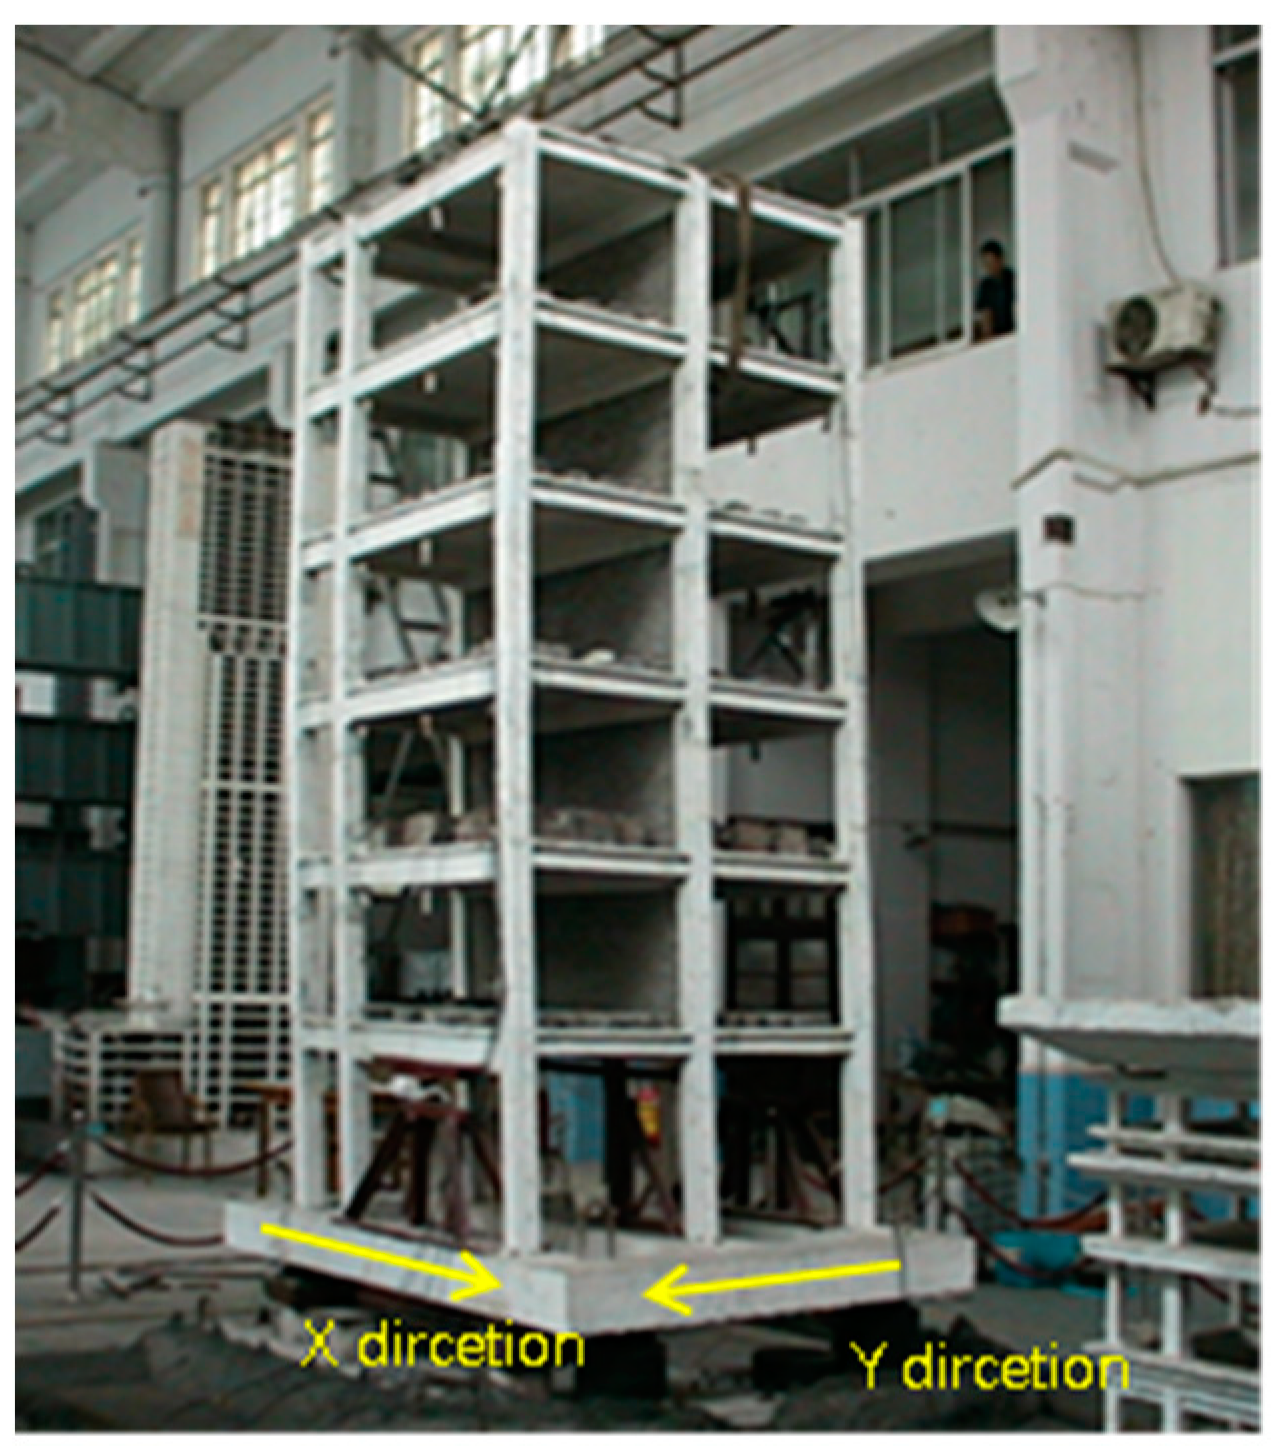
The isolation system consists of an MR damper, ordinary laminated rubber bearing, additional data acquisition and computing devices. Rubber bearings provide a restoring force. The MR damper provides a variable damping force to the model structure by voltage control. The damping force at each moment is calculated by the optimal control algorithm according to the state feedback of the structure. It is adjusted by considering the damping force which the damper can actually provide. This ensures that the damping force provided by the isolation device to the isolation layer is optimal and achievable at every moment. Figure 1 shows the control process of the whole control system.

2.1. Test Model

The test model for the LRQ semi-active control test was a 3 × 2 spans six-story reinforced concrete frame structure. Frame takes were a 1:5 scale ratio. In this model, the column cross section was 90 × 90 mm, the main beam section size was 120 × 60 mm, the secondary beam section size was 80 × 60 mm and the thickness of the floor was 30 mm. Figure 2 shows the model structure.
According to the similarity ratio, the superstructure and the isolation layer were 1.3 tons per layer. Together with the steel frame, the total weight of the structure turns out to be 10 tons. The 10 tons weight was supported by four 100 mm rubber bearings located in the isolation layer.

2.2. Control Algorithm and Control Law

In order to successfully conduct the test, the numerical simulation of the control system was carried out before the test. The accuracy of the numerical calculation and the satisfaction of the fast calculation in the test depends on the control algorithm chosen by the controller. The LQR linear optimal control algorithm was used in this control system and it has the advantages of simple algorithm and strong robustness.
The LQR is an algorithm commonly used in control. It uses a quadratic performance index as an objective function, using the state equation as a constraint condition, through the variational method to meet the minimum control force of the control requirements, as shown in Equation (1). Equation (2) provides the control force at each moment and is the gain matrix.
J = 0 t f [ Z T ( t ) Q Z ( t ) + u T ( t ) R u ( t ) ] d t
u ( t ) = 1 2 R 1 B T P Z ( t ) = K Z ( t )
In reference [4], the above equation has been deformed. It is pointed out that the essence of the algorithm is to change the stiffness matrix and damping matrix of the controlled structure, so that the response of the structure is minimal, as shown in Equation (3) [51].
u ( t ) = K Z ( t ) = { K x K x ˙ } { x x ˙ } = K x x K x ˙ x ˙
Considering the characteristics of the damping force that the MR damper exerts on the structure, the continuous control rule is shown in Equation (4) and the switch control rule is shown in Equation (5).
u = { u max f o p t × x ˙ b < 0 | f o p t | > | u max | f o p t f o p t × x ˙ b < 0 | u max | | f o p t | > | u min | u min f o p t × x ˙ b < 0 | f o p t | | u min | u min f o p t × x ˙ b 0
u = { u min      f o p t × x ˙ b > 0 u max      f o p t × x ˙ b < 0 ,
where u max is the maximum damping force that the MR damper can provide while u min is the minimum damping force that MR damper can provide. x ˙ b is the relative velocity of the isolation layer. f o p t is the calculated optimal control force and u is the final calculated damping force applied by the damper which can be achieved by controlling the input current to drive the damper.

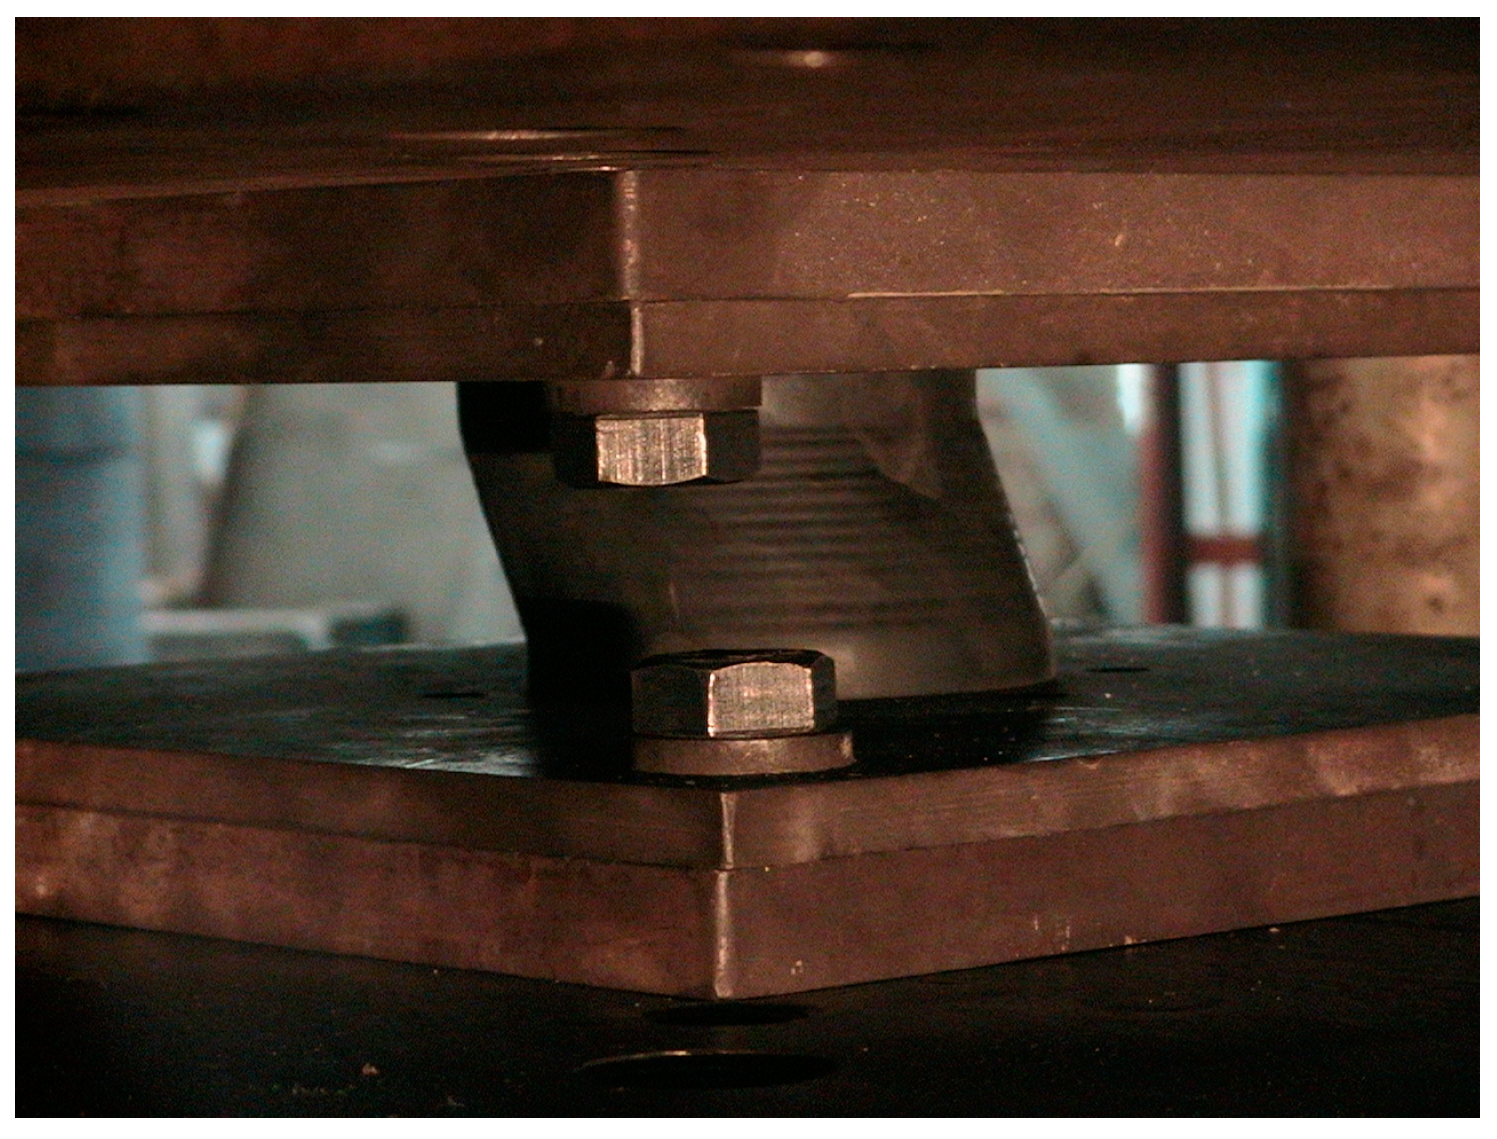
2.3. Isolation Bearing Device

This structure consists of four ordinary laminated isolation rubber bearings placed at four corners of the structure. The diameter of the isolation bearing is 100 mm and the total thickness of the rubber layer is 22.5 mm. In order to test the performance of the rubber bearing, 100% horizontal shear deformation tests are carried out on the installed rubber isolation bearings. The compressive shear tests of horizontal shear deformations of 50% and 100% are carried out to the rubber bearings, respectively, with a compressive stress of 10 MPa. Figure 3 shows the bearing illustration at the time of the test. The force and displacement curves for the 100% deformation of the two bearing shear tests are shown in Figure 4.

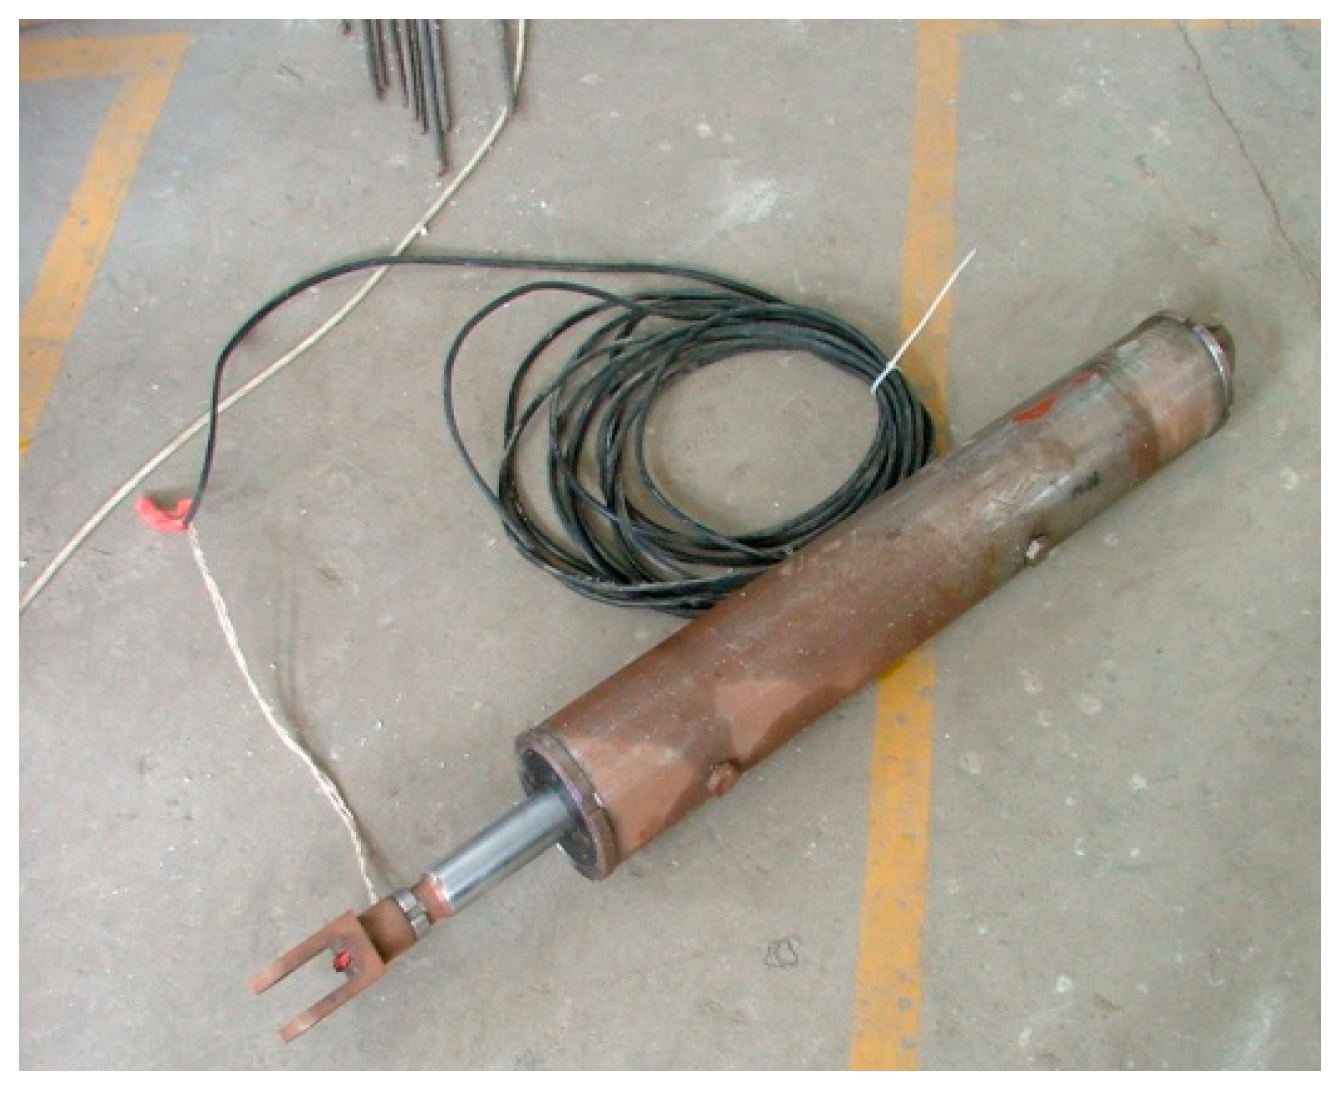
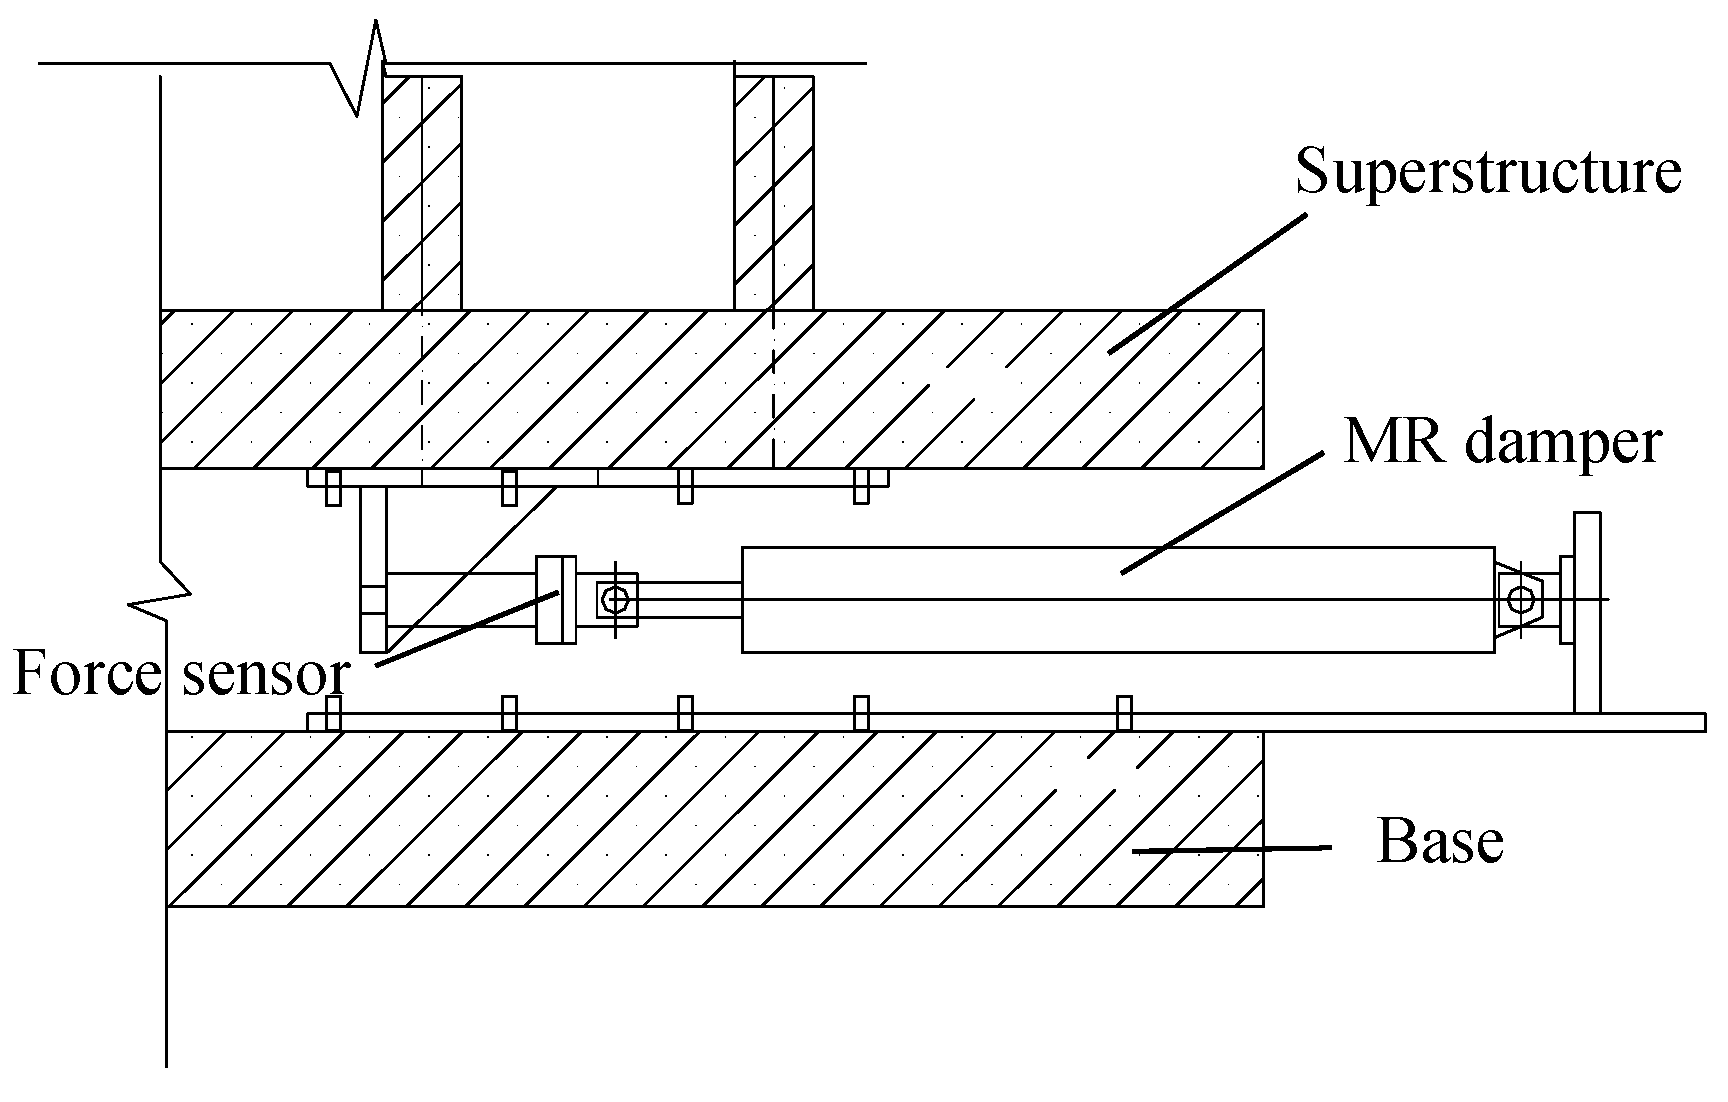
2.4. Magnetorheological (MR) Damper

The maximum output of the magnetorheological damper used in the test was 20 kN, the minimum output was 2.5 kN, and the adjustable multiples of the damping force was eight times. The stroke range of the damper was ±80 mm, and the operating current was 0–4 A. Numerical simulation results indicate that for the selected test model, the maximum required output was about 1 ton, and the maximum displacement of the isolation layer was less than 60 mm. The damper with larger output and strokes was required for the later test of other models. It also provided a safety margin for the test. Figure 5 shows the magnetorheological damper and Figure 6 shows the connection diagram of damper in isolation layer.
The performance test of the damper was carried out before the shaking table test. Figure 7 shows the hysteresis curves of the MR damper with an input current between 0.2 A and 1 A with an interval of 0.3 A.
Figure 7 provides the damper hysteresis curves with maximum and minimum outputs. It can be seen that these outputs have reached the design requirements and the performance of the MR damper is stable in the frequency domain of the shaking table test (about 1 Hz).

3. Experimental Scheme

3.1. Loading Scheme

In order to verify the damping effect of the MR semi-active isolation system under a different-intensity earthquake, the following loading scheme was designed. For the semi-active control test, the three different seismic ground motions: El Centro earthquake, Taft earthquake and Tianjin earthquake were used. Based on the Chinese seismic code, the input seismic excitation was adjusted to three different degrees with corresponding peak ground acceleration of 0.126 g, 0.36 g and 0.72 g, respectively.
This shaking table test was also carried out under two control conditions for the MR damper consisting of passive friction control and passive viscous control. Under each condition, three seismic ground motions (Griffth earthquake, EI-Centro earthquake and Taft earthquake) were loaded. The input seismic excitation is adjusted to two different degrees with corresponding peak ground acceleration of 0.36 g and 0.72 g, respectively.

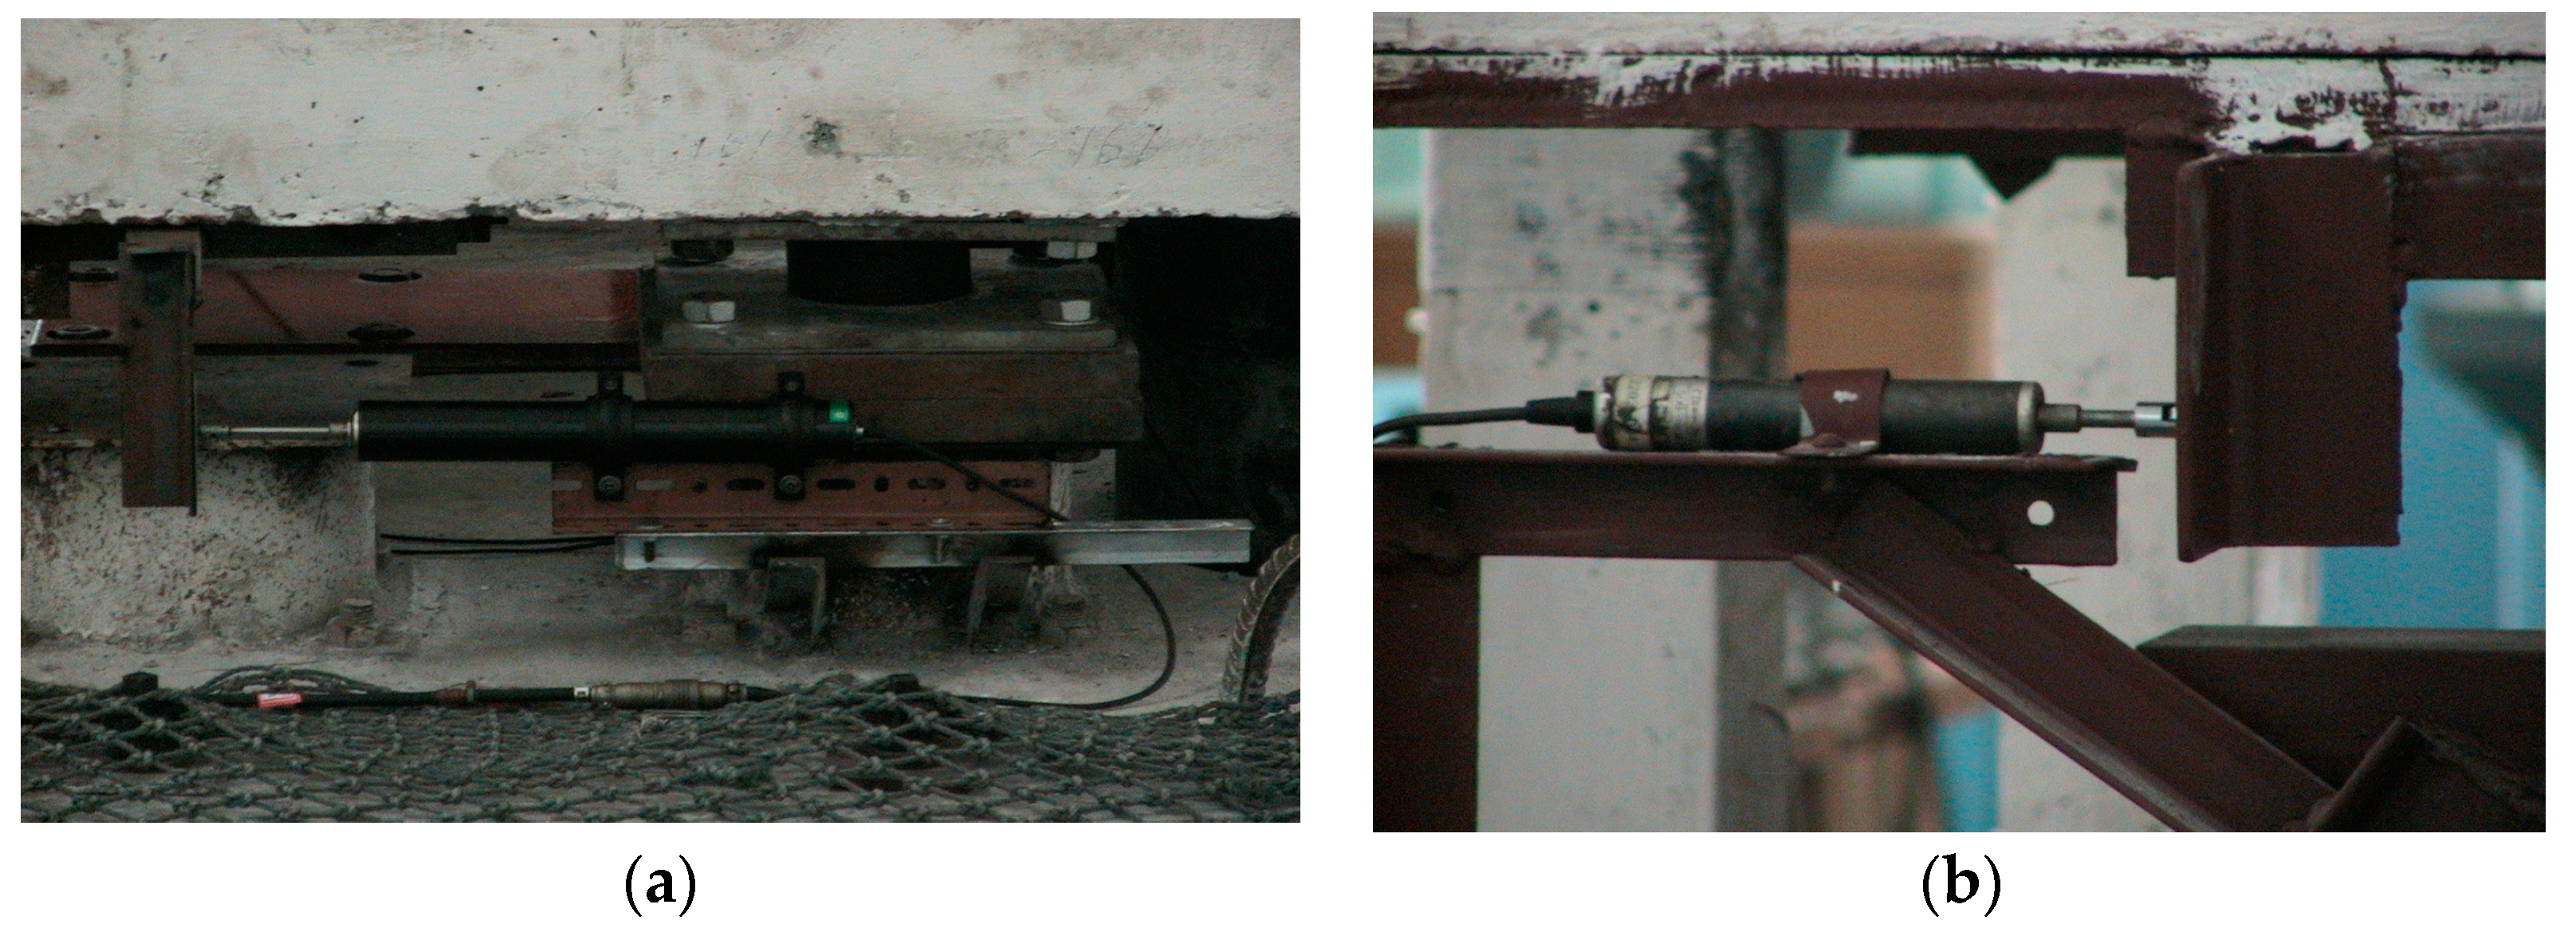
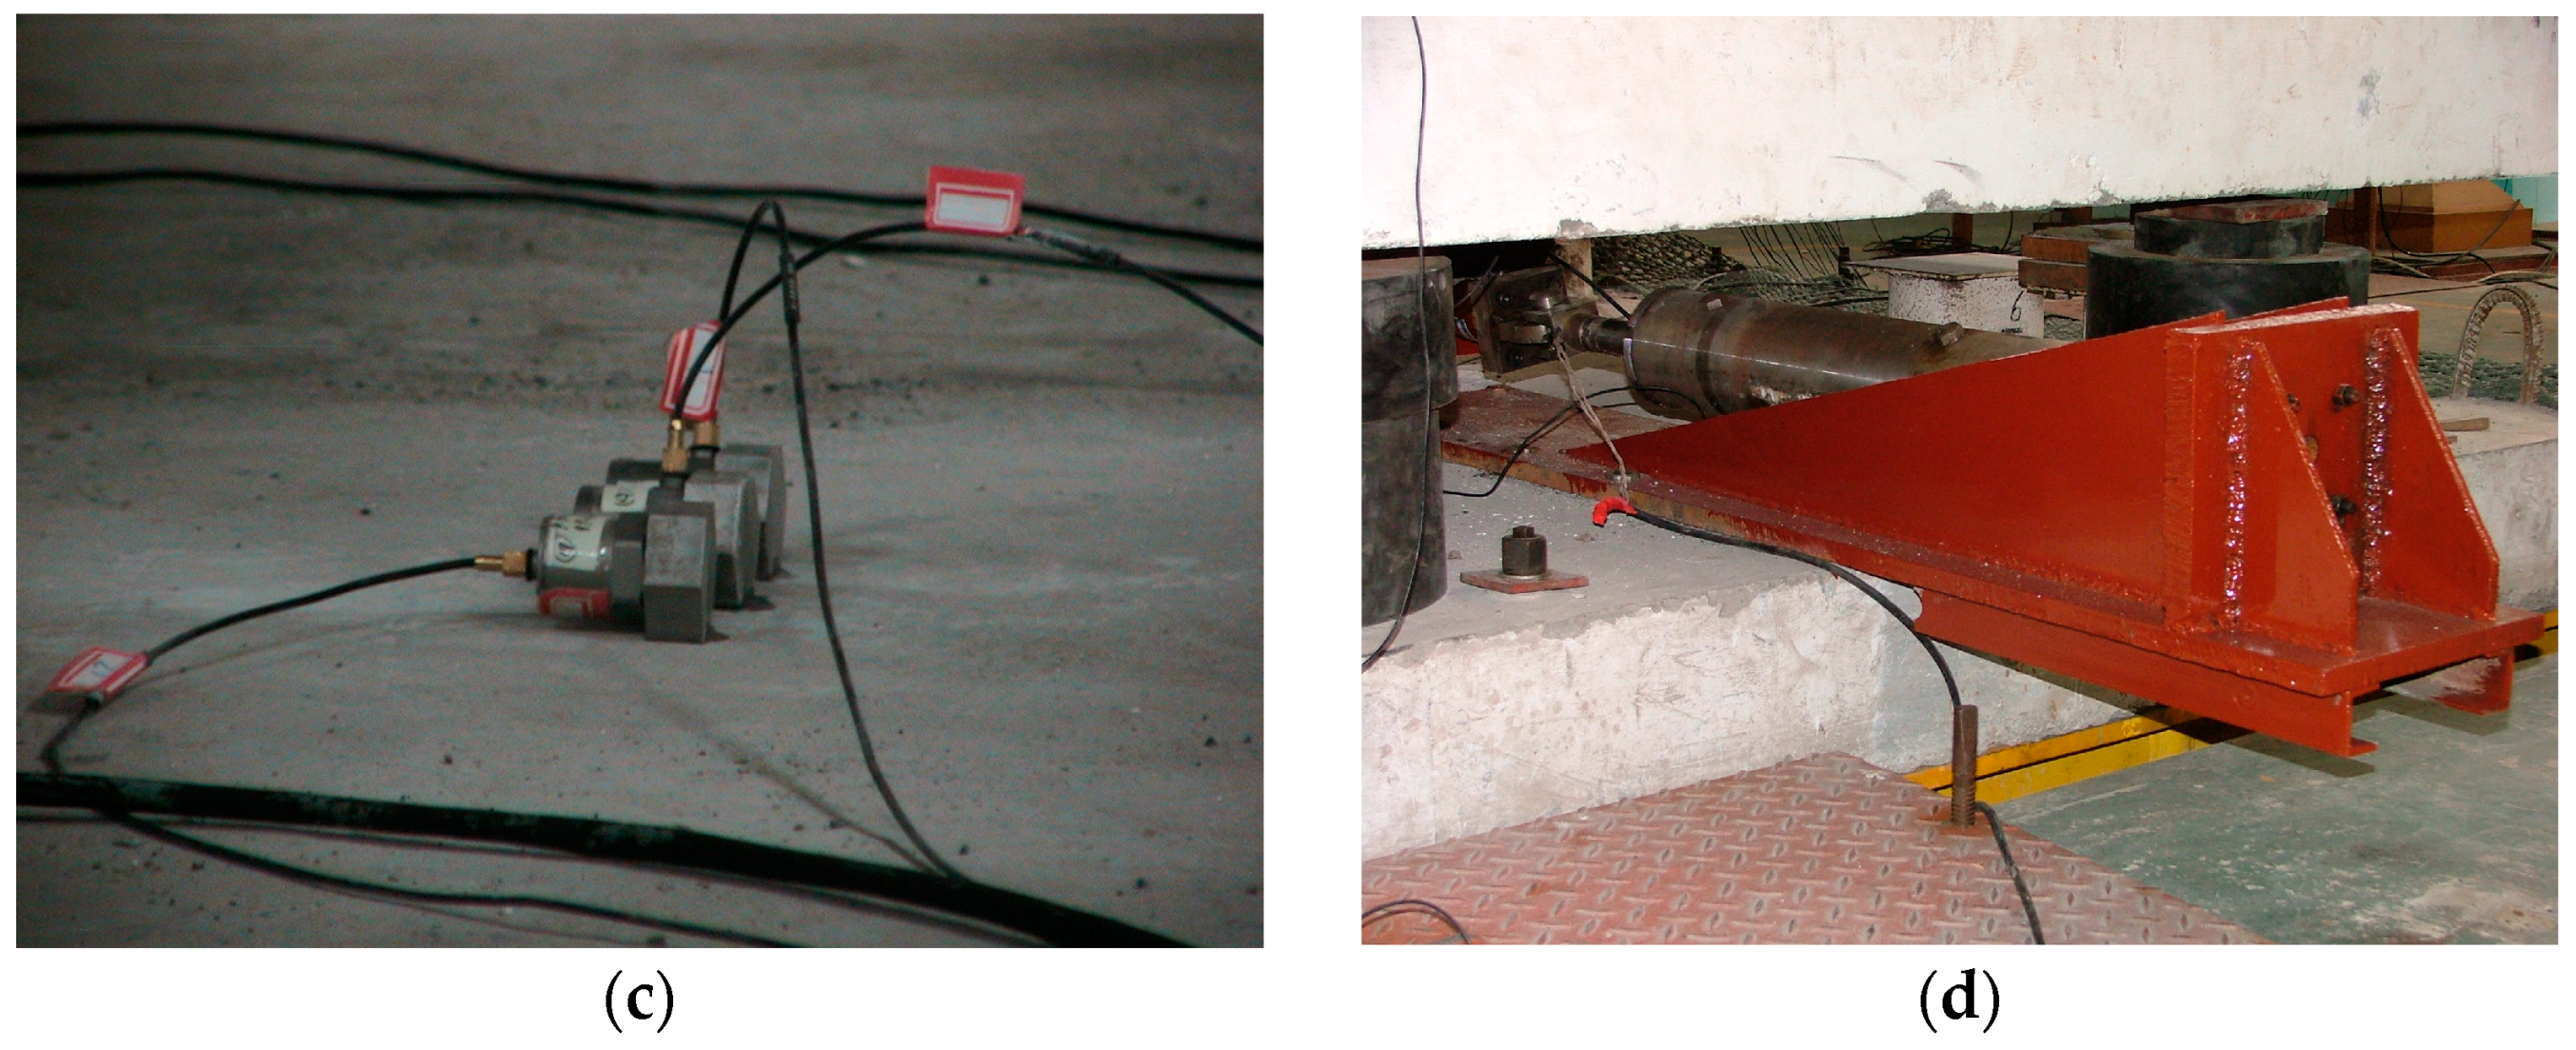
3.2. Measurement Scheme

In order to measure and calculate the state vector of the control system, a number of displacement, velocity, acceleration and force sensors were arranged on the experimental model. three acceleration sensors were arranged at each floor level to measure the vibration response of each layer. The three sensors (Figure 8c) on each floor were 4381 V piezoelectric acceleration sensors produced by the B&K Company of Denmark. One of them measured the acceleration response directly, and the other two obtained the absolute displacement and velocity response values by integrating the acceleration values. When the absolute reaction values of adjacent layers were subtracted, the relative reaction values between layers can be obtained. The purpose of using three acceleration sensors to work at the same time was to reduce the on-line calculation time and the real-time control error. The quantity of each type sensor is one in every floor. The linear variable differential transformer (LVDT) displacement sensor was made in Shenzhen China, with a range of ±64 mm, sensibility of 10%, and sampling frequency of more than 1000 Hz. It was arranged on the isolation layer, the bottom layer and the top layer for measuring the story drift response of the structure. In order to measure the actual performance of the MR damper, a force sensor with a measuring range of two tons was set up, which was directly connected to the damper and was arranged in the isolation layer. The described sensor arrangement has been shown in Figure 8.

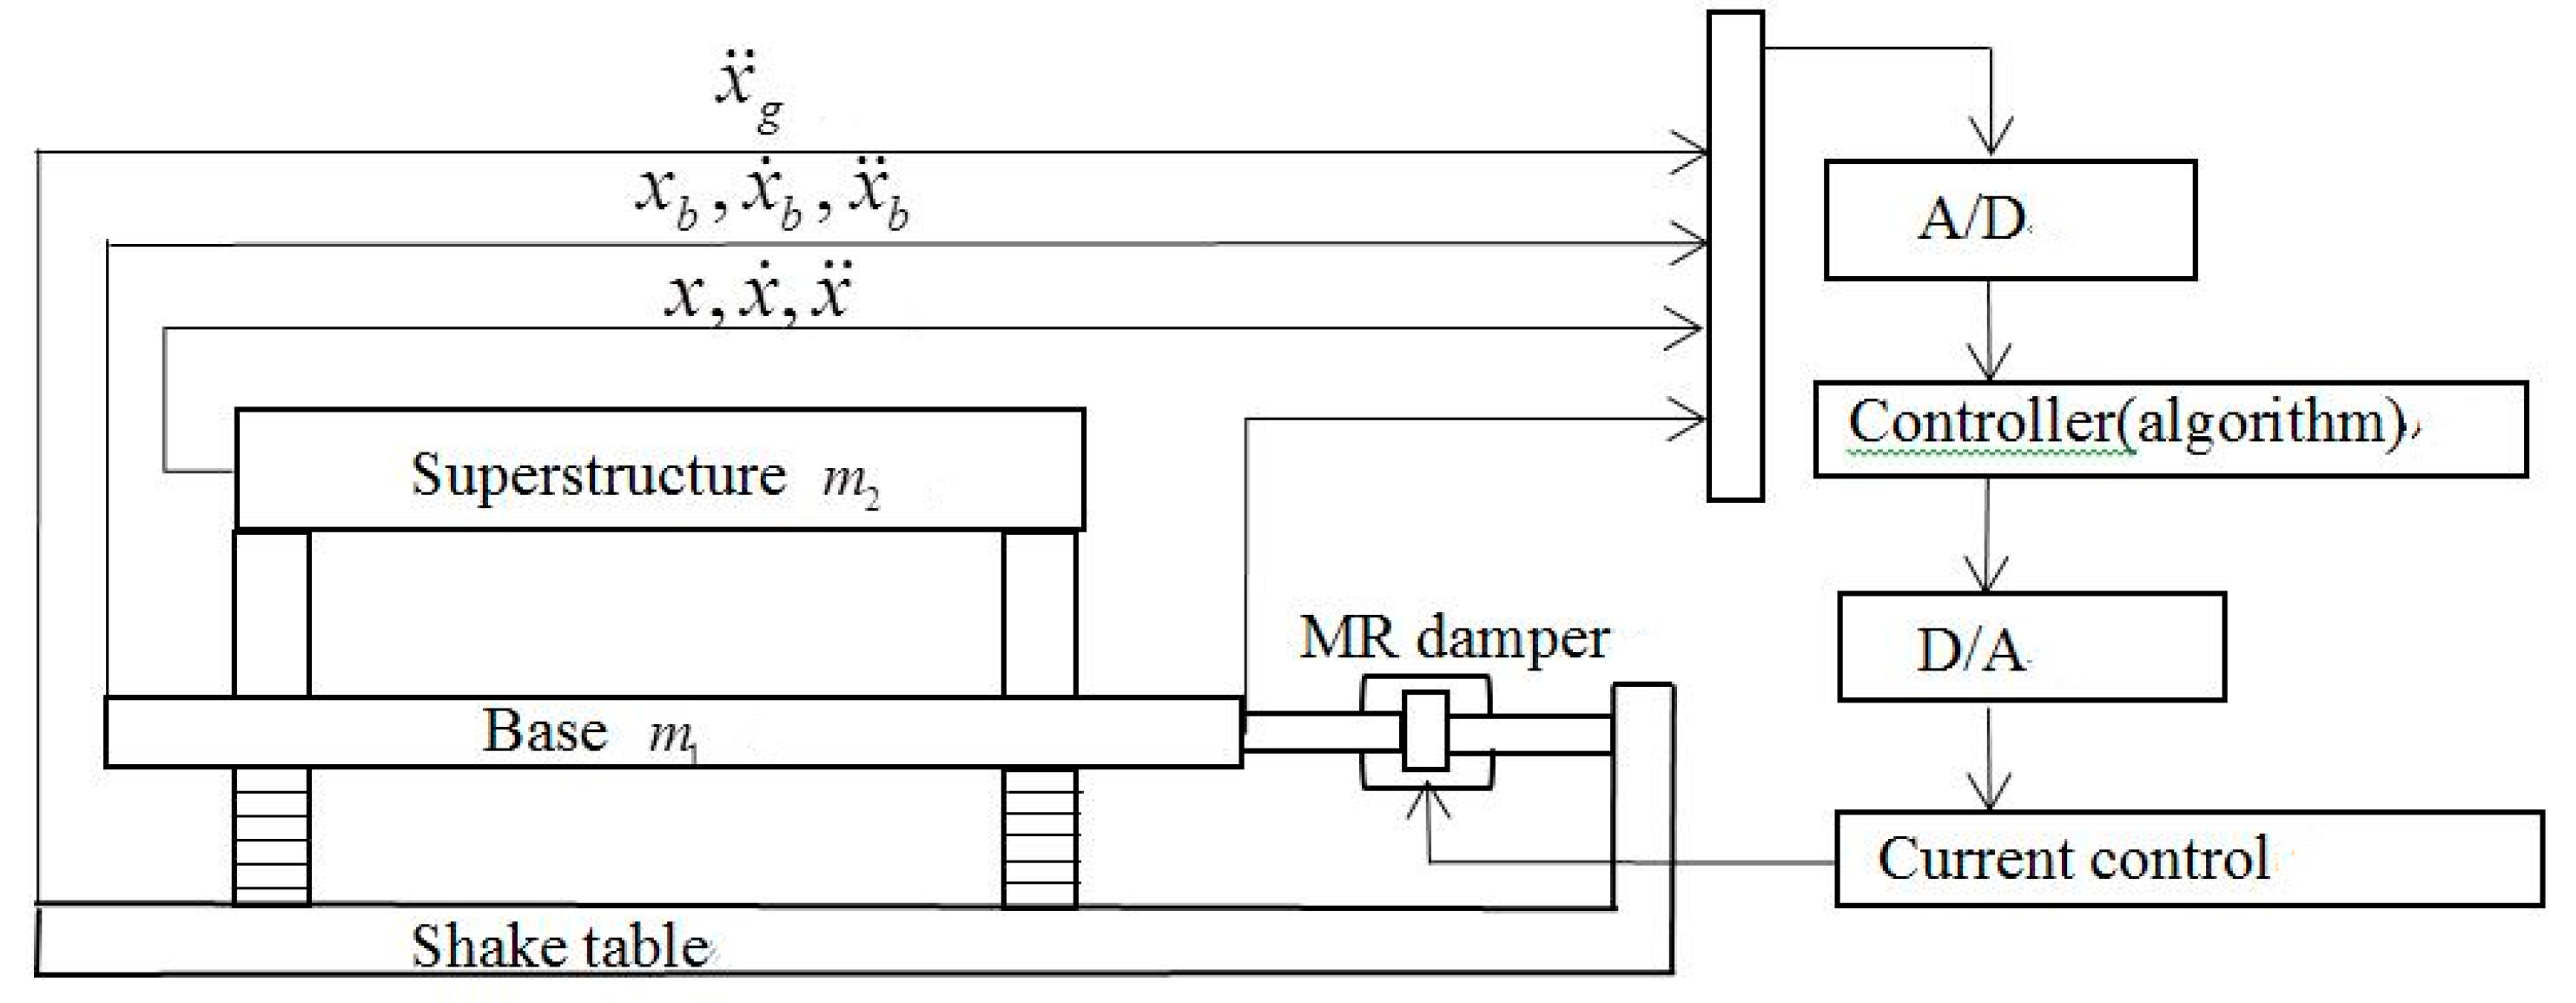
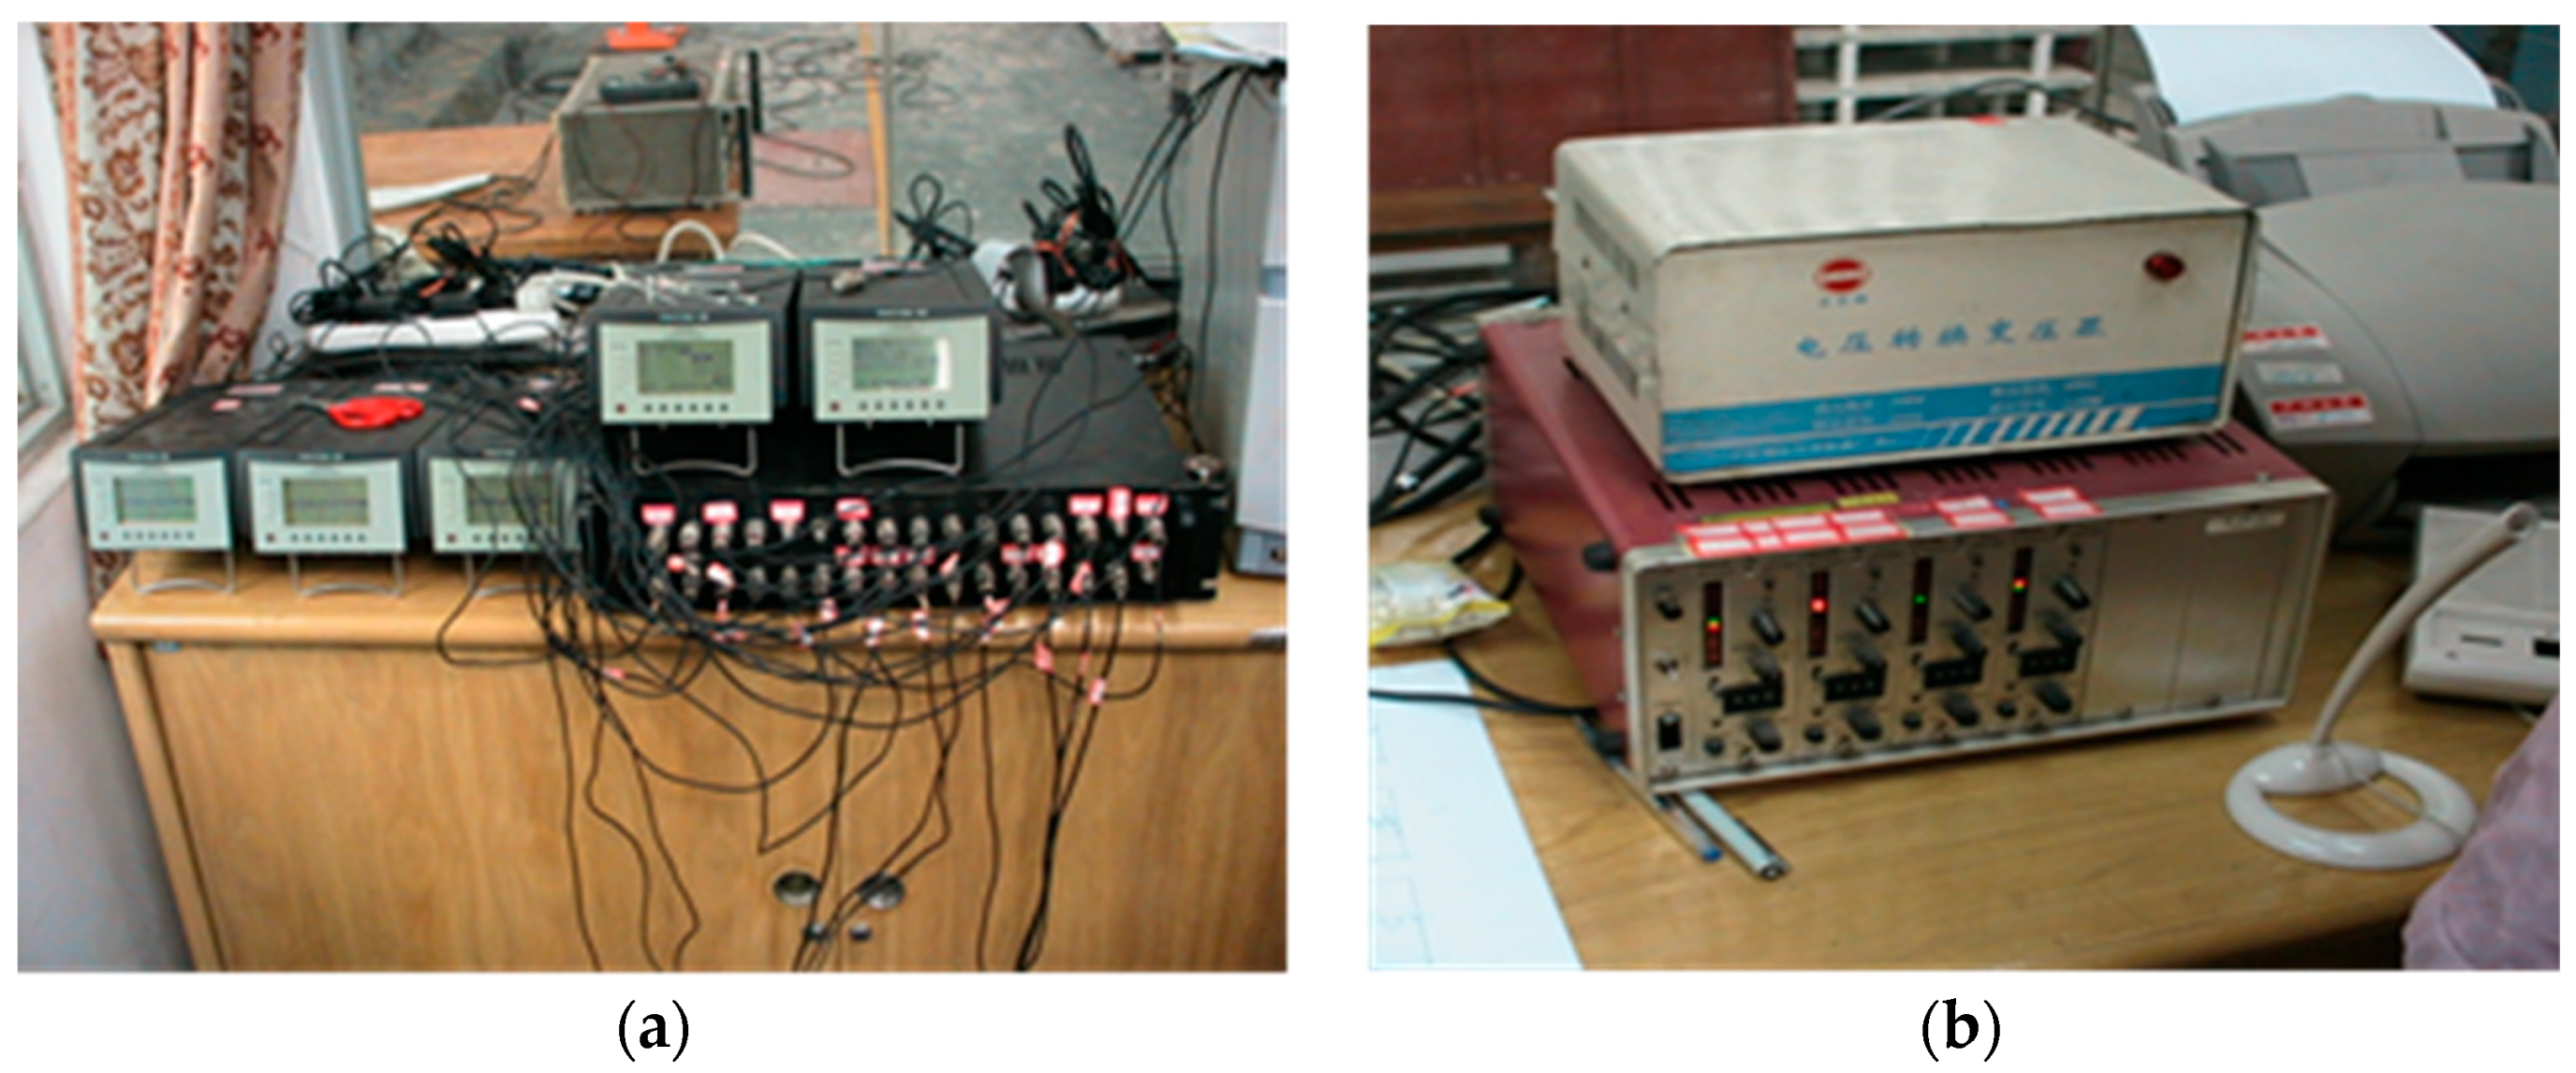
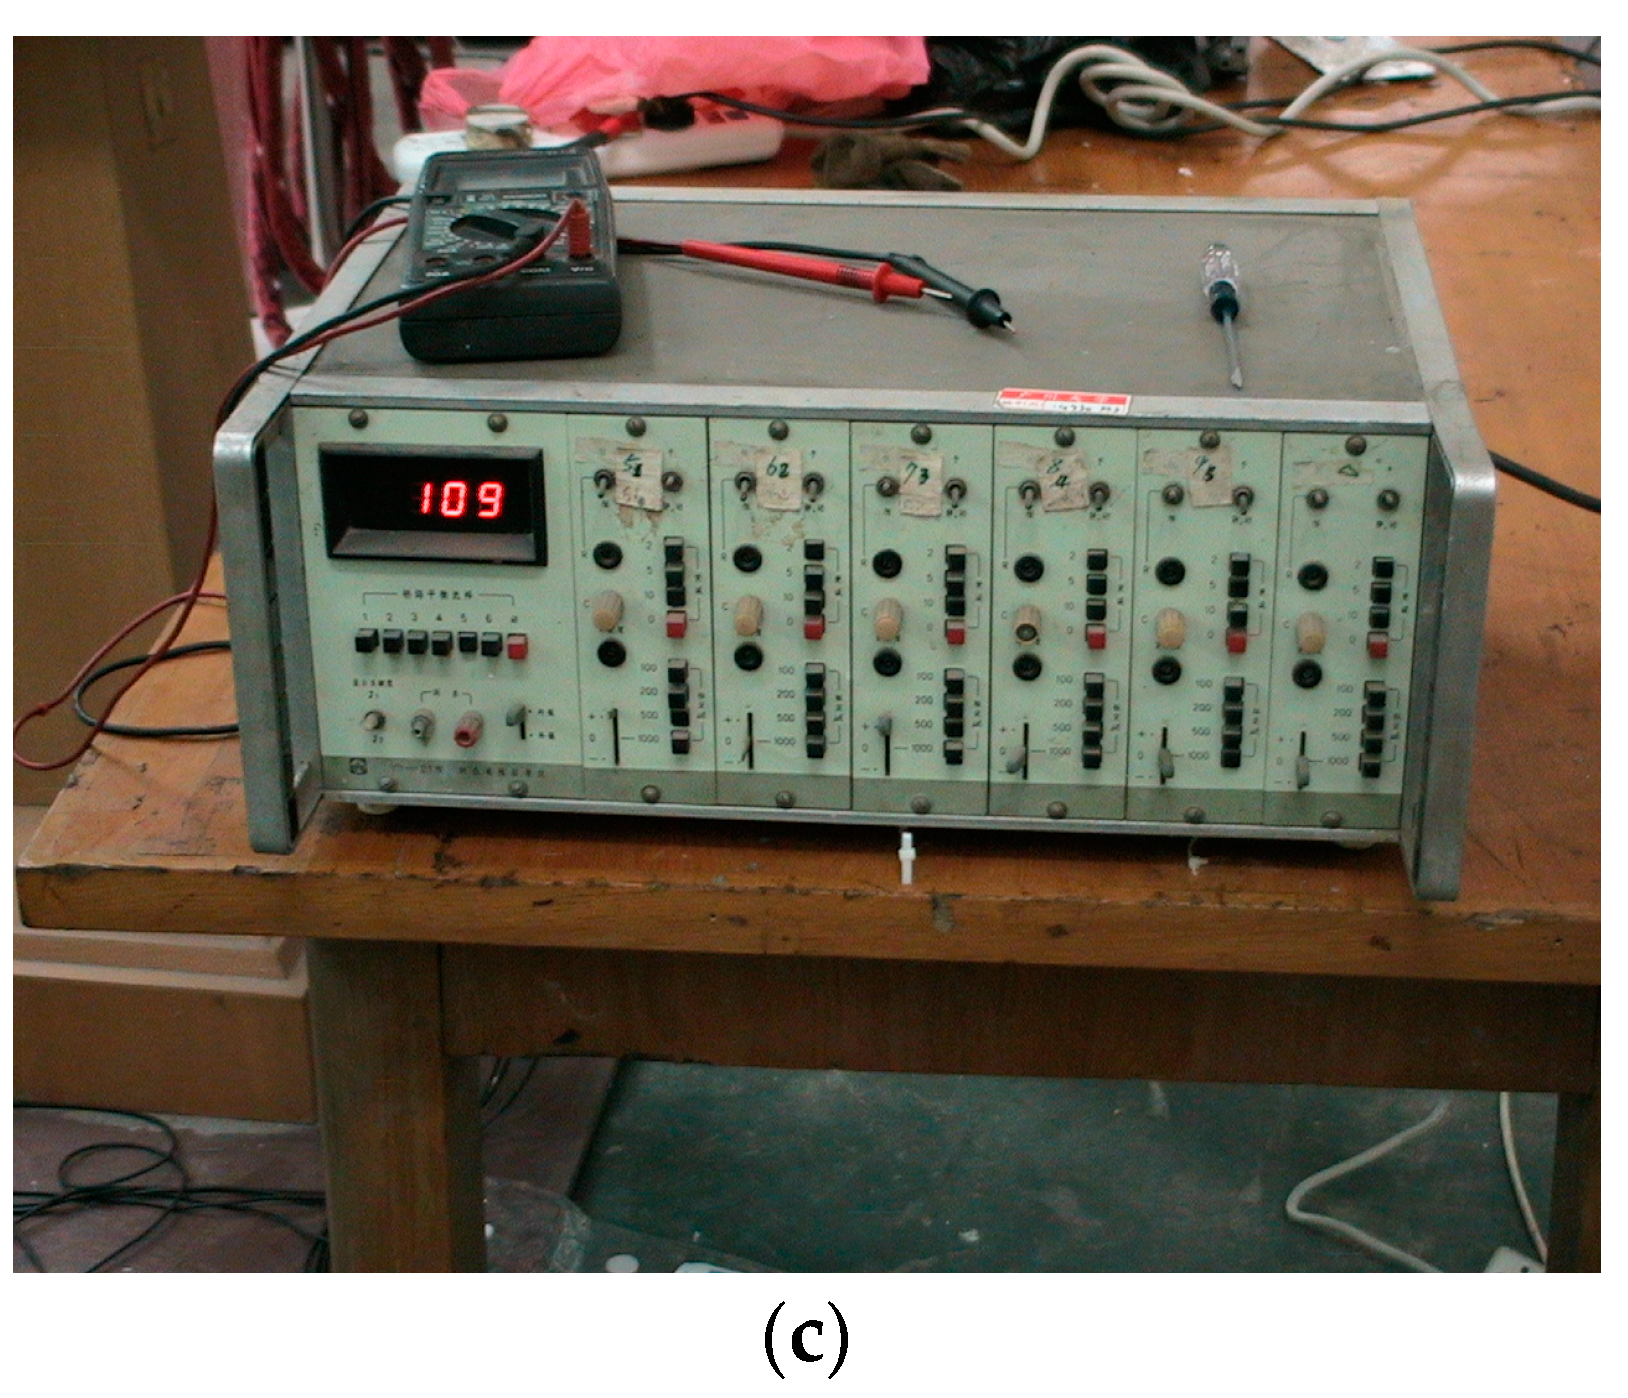
3.3. Data Acquisition and Structural Response Feedback Scheme

The whole process of data acquisition, calculation and instruction issue used by the system was accomplished by a computer with a PCI8335 multi-function data acquisition board. The sampling frequency of PCI8335 board was 100 Hz, which was higher than the input frequency of seismic ground motion. It is suitable for the control program and can meet the requirements of the experiment. The computer was mainly used for on-site data acquisition and control implementation. Its performance indexes were as follows:
  • A/D part (acquisition)
  • Input channel: 32 channels single ended/16 channel differential
  • Input range: 0~10V, −5~+5 V
  • Overpressure range: −12~+12 V
  • D/A part (issue order)
  • Resolution: 12bit
  • Output channel: 4 way
  • Output range: −12~+12 V
  • Maximum sampling frequency: 250 Hz
For the data acquisition board, the two control algorithms were written into a visual basic (VB) executable program by a VB complier. The acquisition of the structure state signal, online calculation and control signal issues are carried out. Figure 9 shows the conversion instruments between digital signals and analogy signals for the sensors.

4. Numerical and Experimental Investigation of MR Semi-Active Control

To make the test proceed smoothly, the numerical simulation of the control system was carried out before the test. The numerical simulation and experimental results of the two control strategies controlled by the two algorithms respectively will be analyzed in the following section.
The control force equation of the MR damper is as follows: F = F η + F τ . While, F η is a viscous damping force, which is only related to the viscous coefficient of magnetorheological fluids, and F τ is a coulomb damping force, which is related to the voltage of magnetorheological fluid. F η / F τ is the output adjustable multiple of the MR damper.
The relationship between the input current and the output force of MR damper is shown in Equation (6), in which the parameters are calculated by the least square method from the experimental data, so the Equation (6) should always have the solutions within 0~4 Ampere. According to the required damping force and velocity response, the current required for MR damper can be obtained.
F = C 0 v + F ( I ) = 10629 v + 1500 + 10891 I + 2291 I 2 1468 I 3 .
Based on MATLAB, a program for solving the above equation has been developed. For the Equation (6), when the solutions of this equation fell within 0~4 Ampere, we took the smallest value as the current input. In Equation (6) force F, being the actual force applied to the structure, is represented by force u which is calculated by the control algorithms in terms of input value. Therefore, the single current value corresponding to each time step can be determined by the above approach.
In order to measure the actual working condition of the MR semi-active isolation control system, the shaking table test of the controlled structure model under two control rules has been carried out at the seismic research center of Guangzhou University for this research. Specific test results and analysis are described in the following.

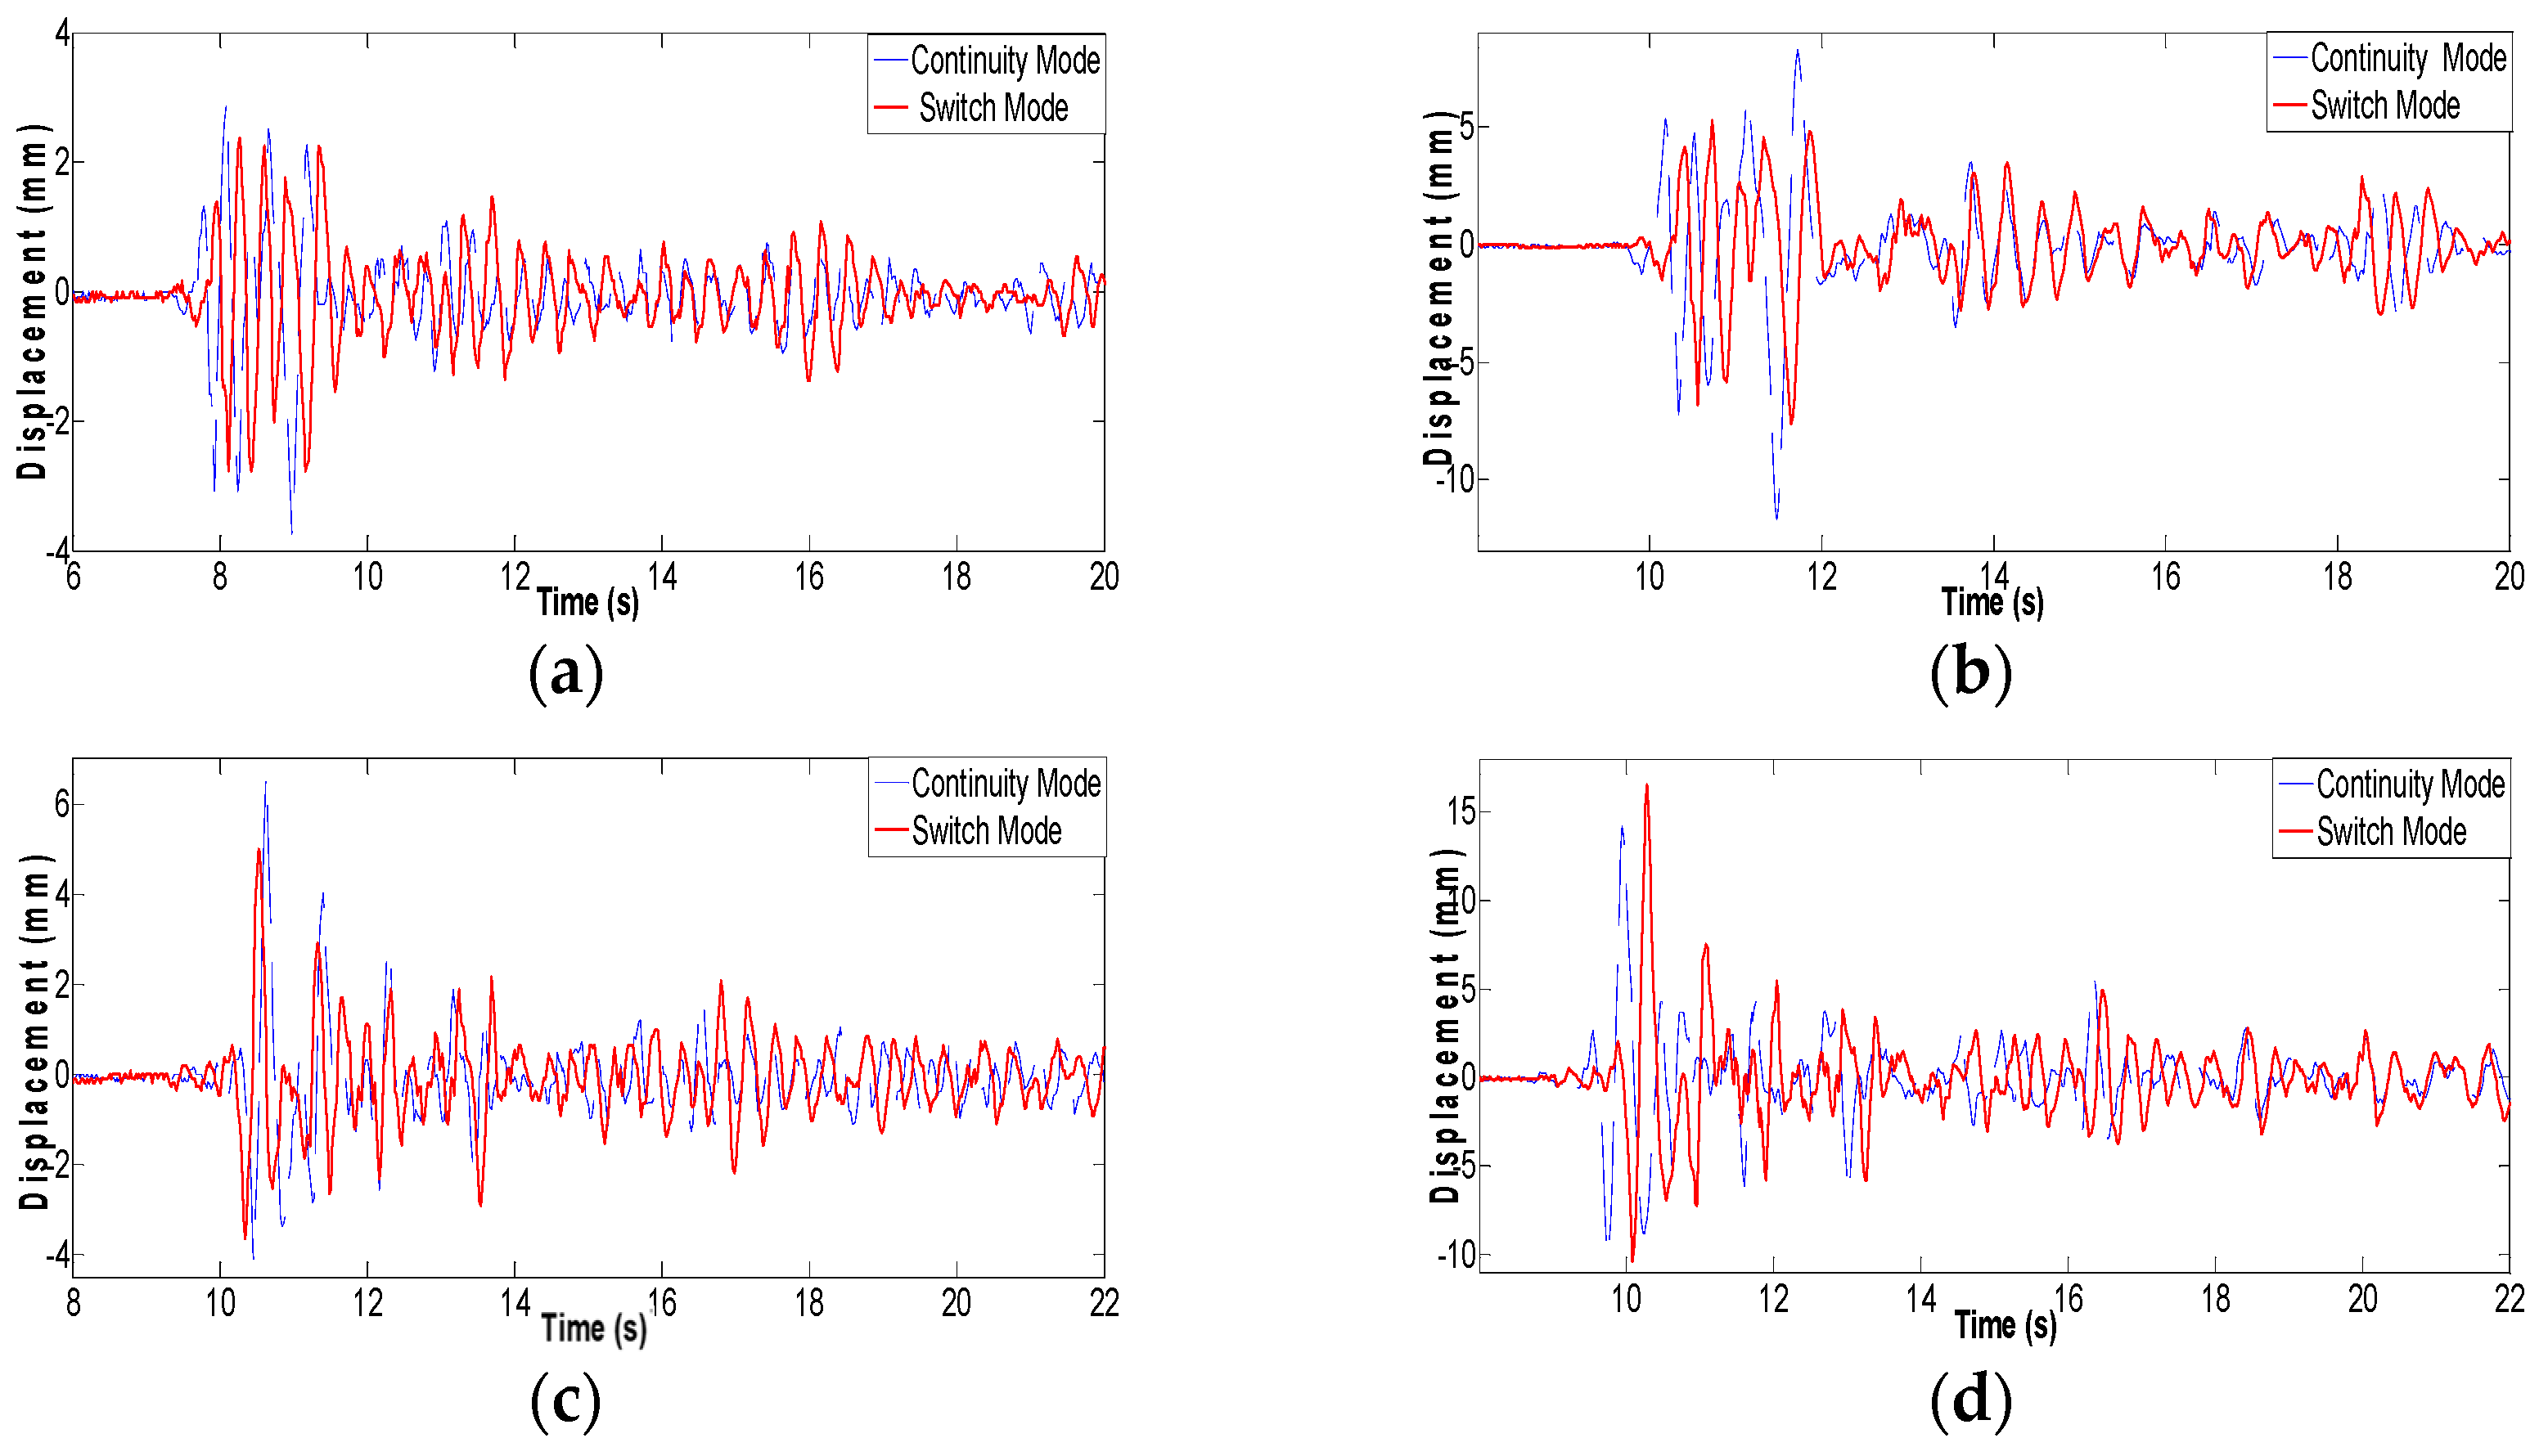
4.1. Displacement Response

The results in Table 1 and Table 2 are the peak interlayer drift response of the continuous control and switching control test. The values in parentheses are numerically simulated values. Figure 10 is the time displacement history diagram of the isolation layer measured by two control conditions under two kinds of intensities.
It can be seen that from above tables, the displacement response of the structure under three kinds of intensities is well controlled by the control under two control conditions. The maximum displacement (28 mm) of the isolation layer is only half the maximum displacement (55 mm) of the rubber bearing under three working conditions. The reduction in the displacement of the isolation layer ensures that the isolation rubber bearing work safely in the event of an extreme earthquake.
As can be seen from the table above, the displacement of the isolation layer (which are control effect determinants) and the experimental results are close to the numerical results under two control conditions. This lays a foundation for further research on the design method of the control system. In addition, the displacement of the isolation layer measured by tests is generally less than the numerical results. This should be the result of a multifaceted interaction, such as the inaccuracy of the model and damper parameters, the errors of calculation and measurements, etc. This is the next step where further research is required.
For switch control, the displacement of the isolation layer is relatively small because it changes only between the maximum and minimum damping forces. When a large displacement occurs in the isolation layer, the maximum damping force is applied directly by the damper instead of the value between the maximum damping force and minimum damping force under continuous control. It can be seen from the above table that the displacement of the isolation layer is small and the interlayer drift of the superstructure is relatively large with switch control.

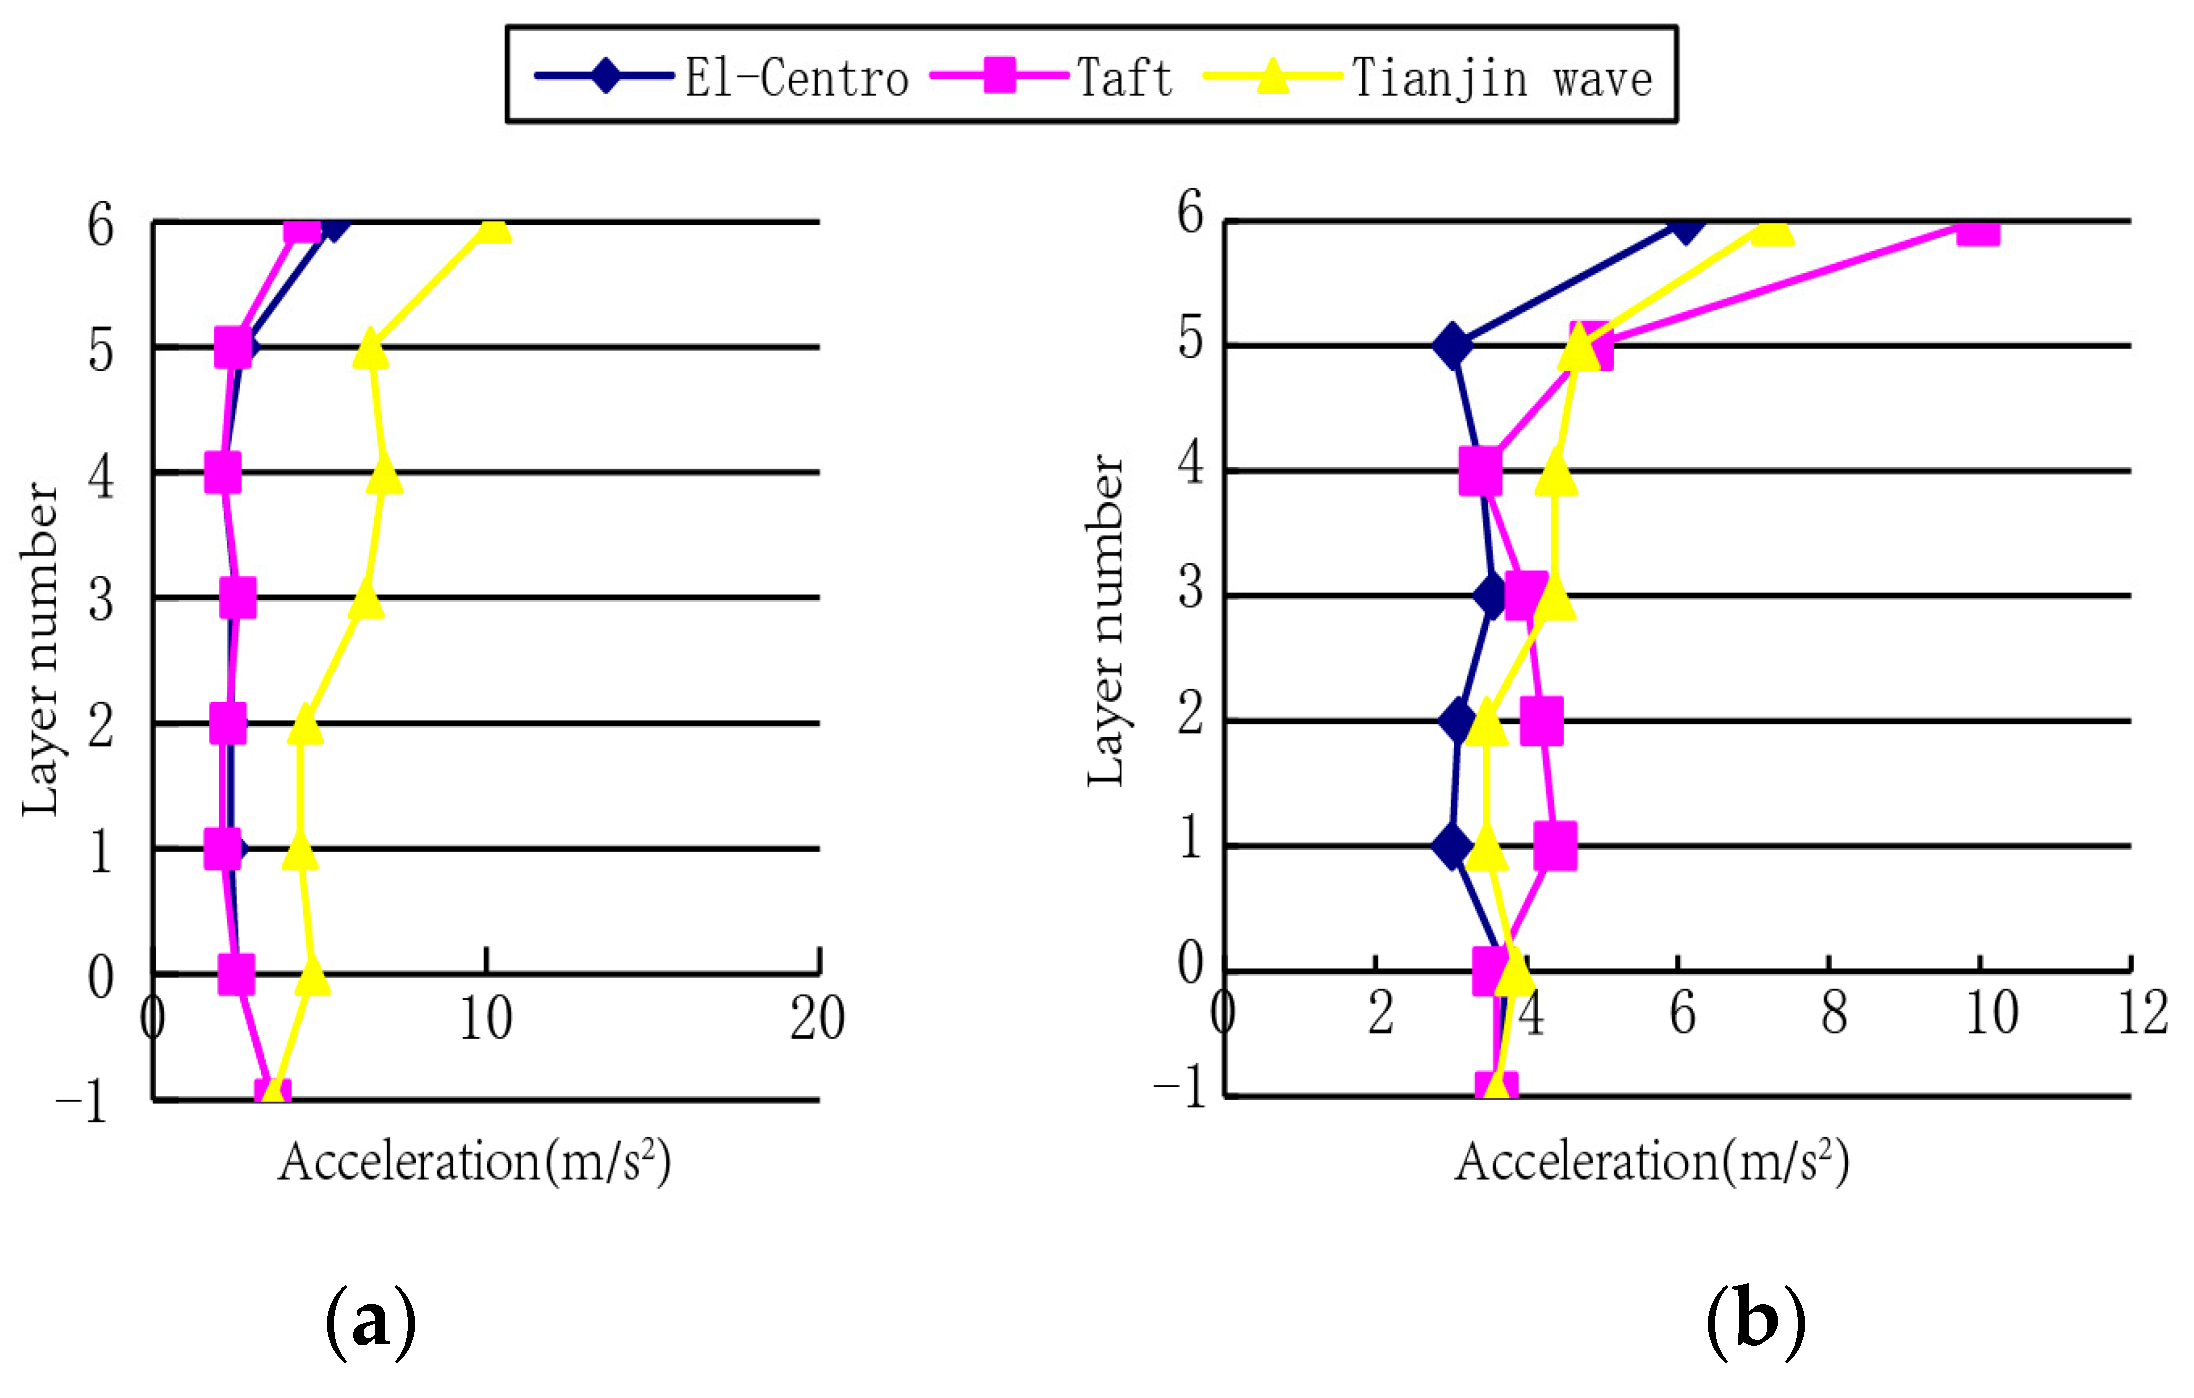
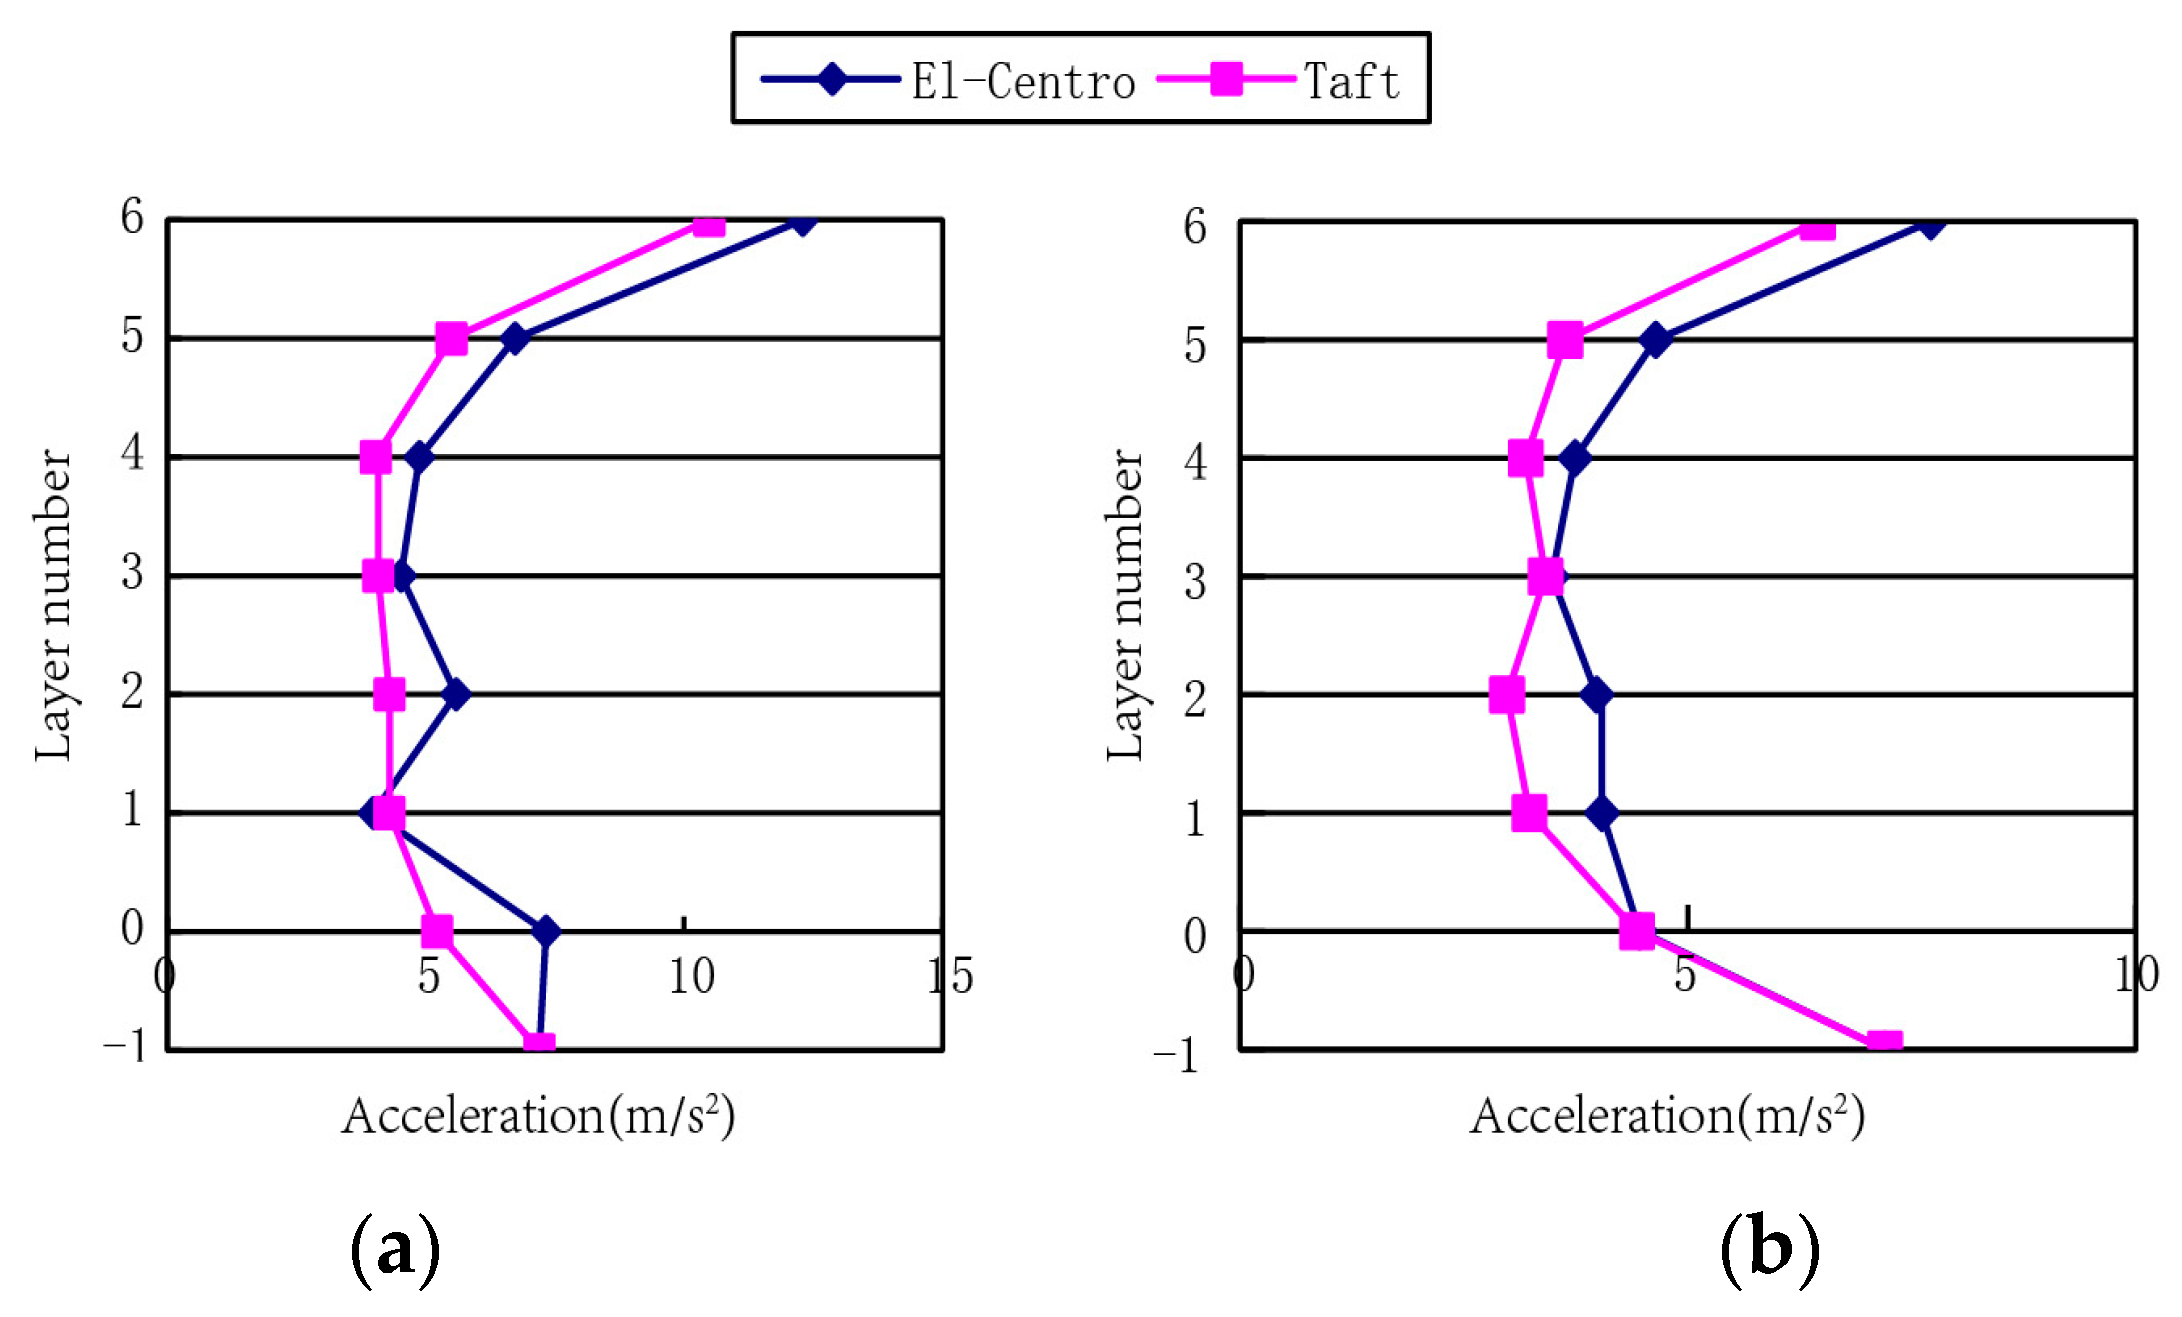
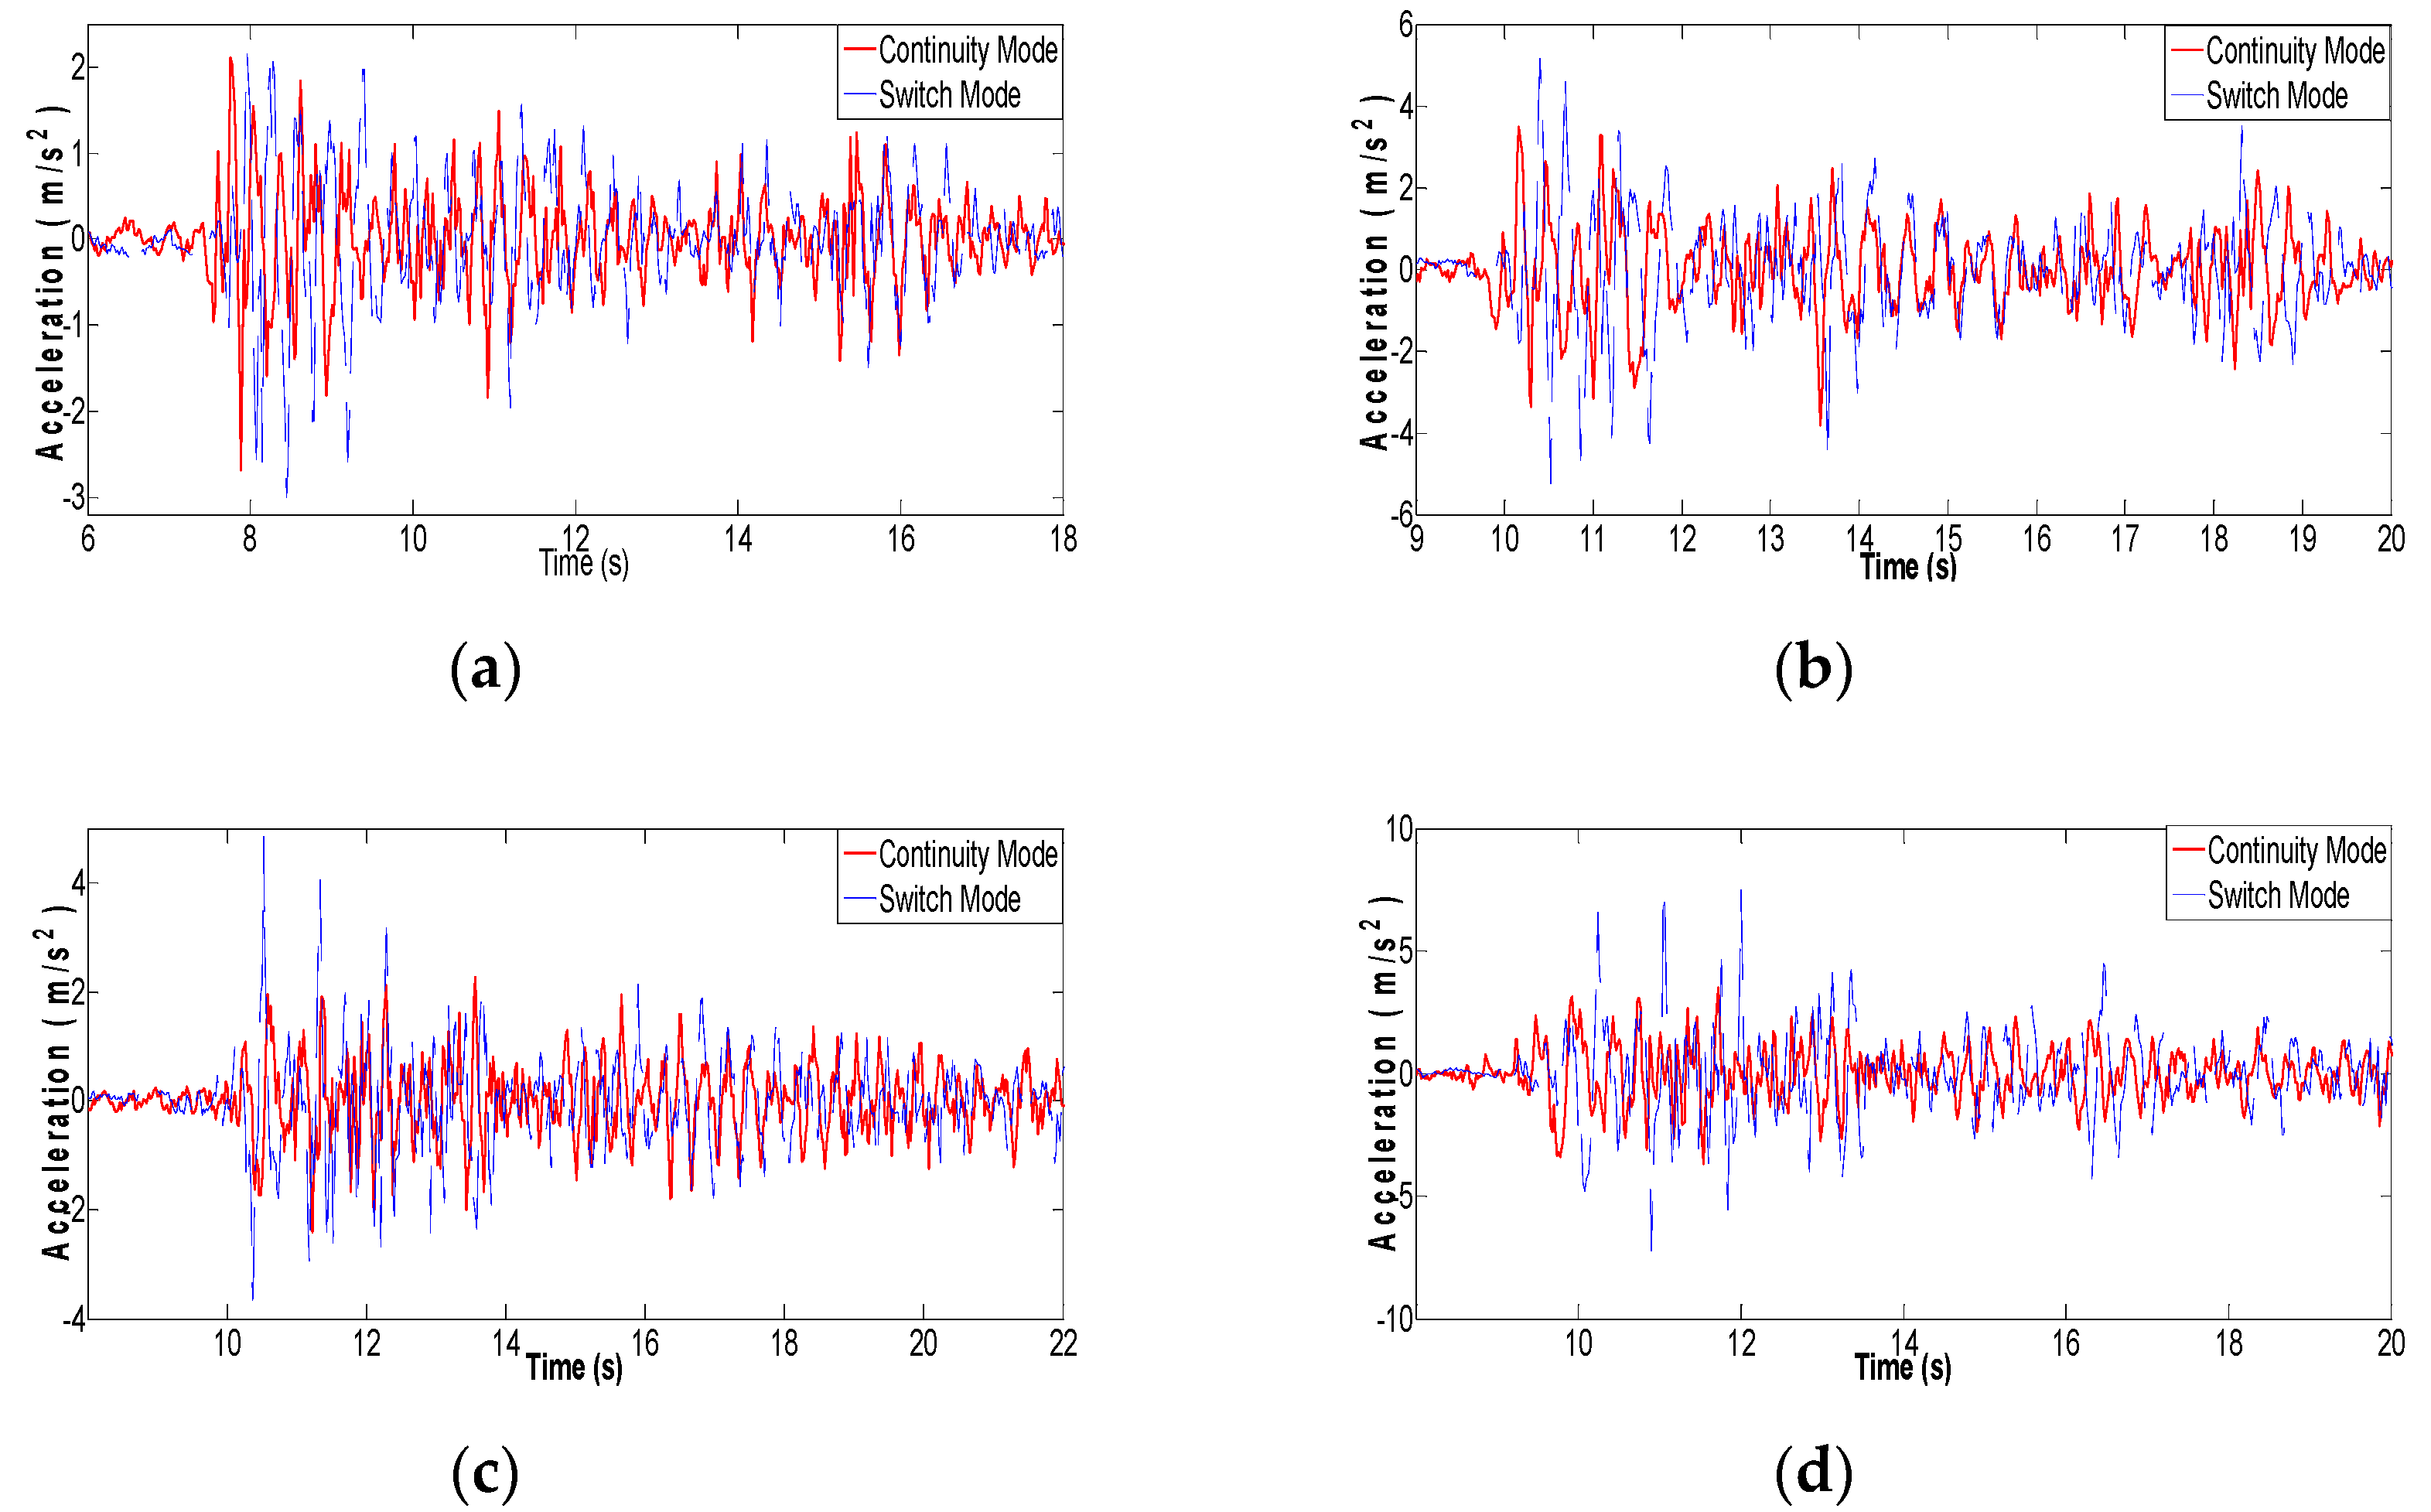
4.2. Acceleration Response

Figure 11 and Figure 12 shows the peak acceleration of each layer. The acceleration time history response of the fifth floor of the structure under two control conditions is given in Figure 13. As shown in these figures, the control effect of continuous control under different intensities is better than that of switch control. The seismic isolation layer performed better under earthquakes where the maximum acceleration was 0.72 g than that in earthquakes where the maximum acceleration was 0.126 g. Similarly, the damping effect of isolation layer under El Centro earthquake and Taft earthquake was better than that of Tianjin ground motion. In earthquakes where the maximum acceleration was 0.72 g, the peak acceleration of the fifth layer under El Centro earthquake and Taft earthquake in continuous control was reduced by half relative to the input ground motion. Shock absorption effect was obvious in these figures. The peak acceleration of the fifth layer under the ground motion where the maximum acceleration was 0.126 g also decreases by 1/3. Top acceleration is slightly enlarged under frequent intensity earthquake.
The reason why the continuous control was better than the switch control can be obtained by the analysis of the displacement response. The displacement of the isolation layer under the switch control was much less than that of the continuous control. The displacement of the isolation layer decreased so that the energy dissipation of the damper was relatively small, and the energy transferred to the superstructure increased, so the acceleration response became larger.
It is worth noting that the peak acceleration of the top layer in various conditions relative to all other floors have greatly enlarged, which is inconsistent with the overall control effect. It could be due to the fact that the top of the structure was damaged in the previous test which caused significant stiffness reduction. Therefore, whiplash effect occurred during the test. The hypothesis was also verified by the observations in the next experiment.

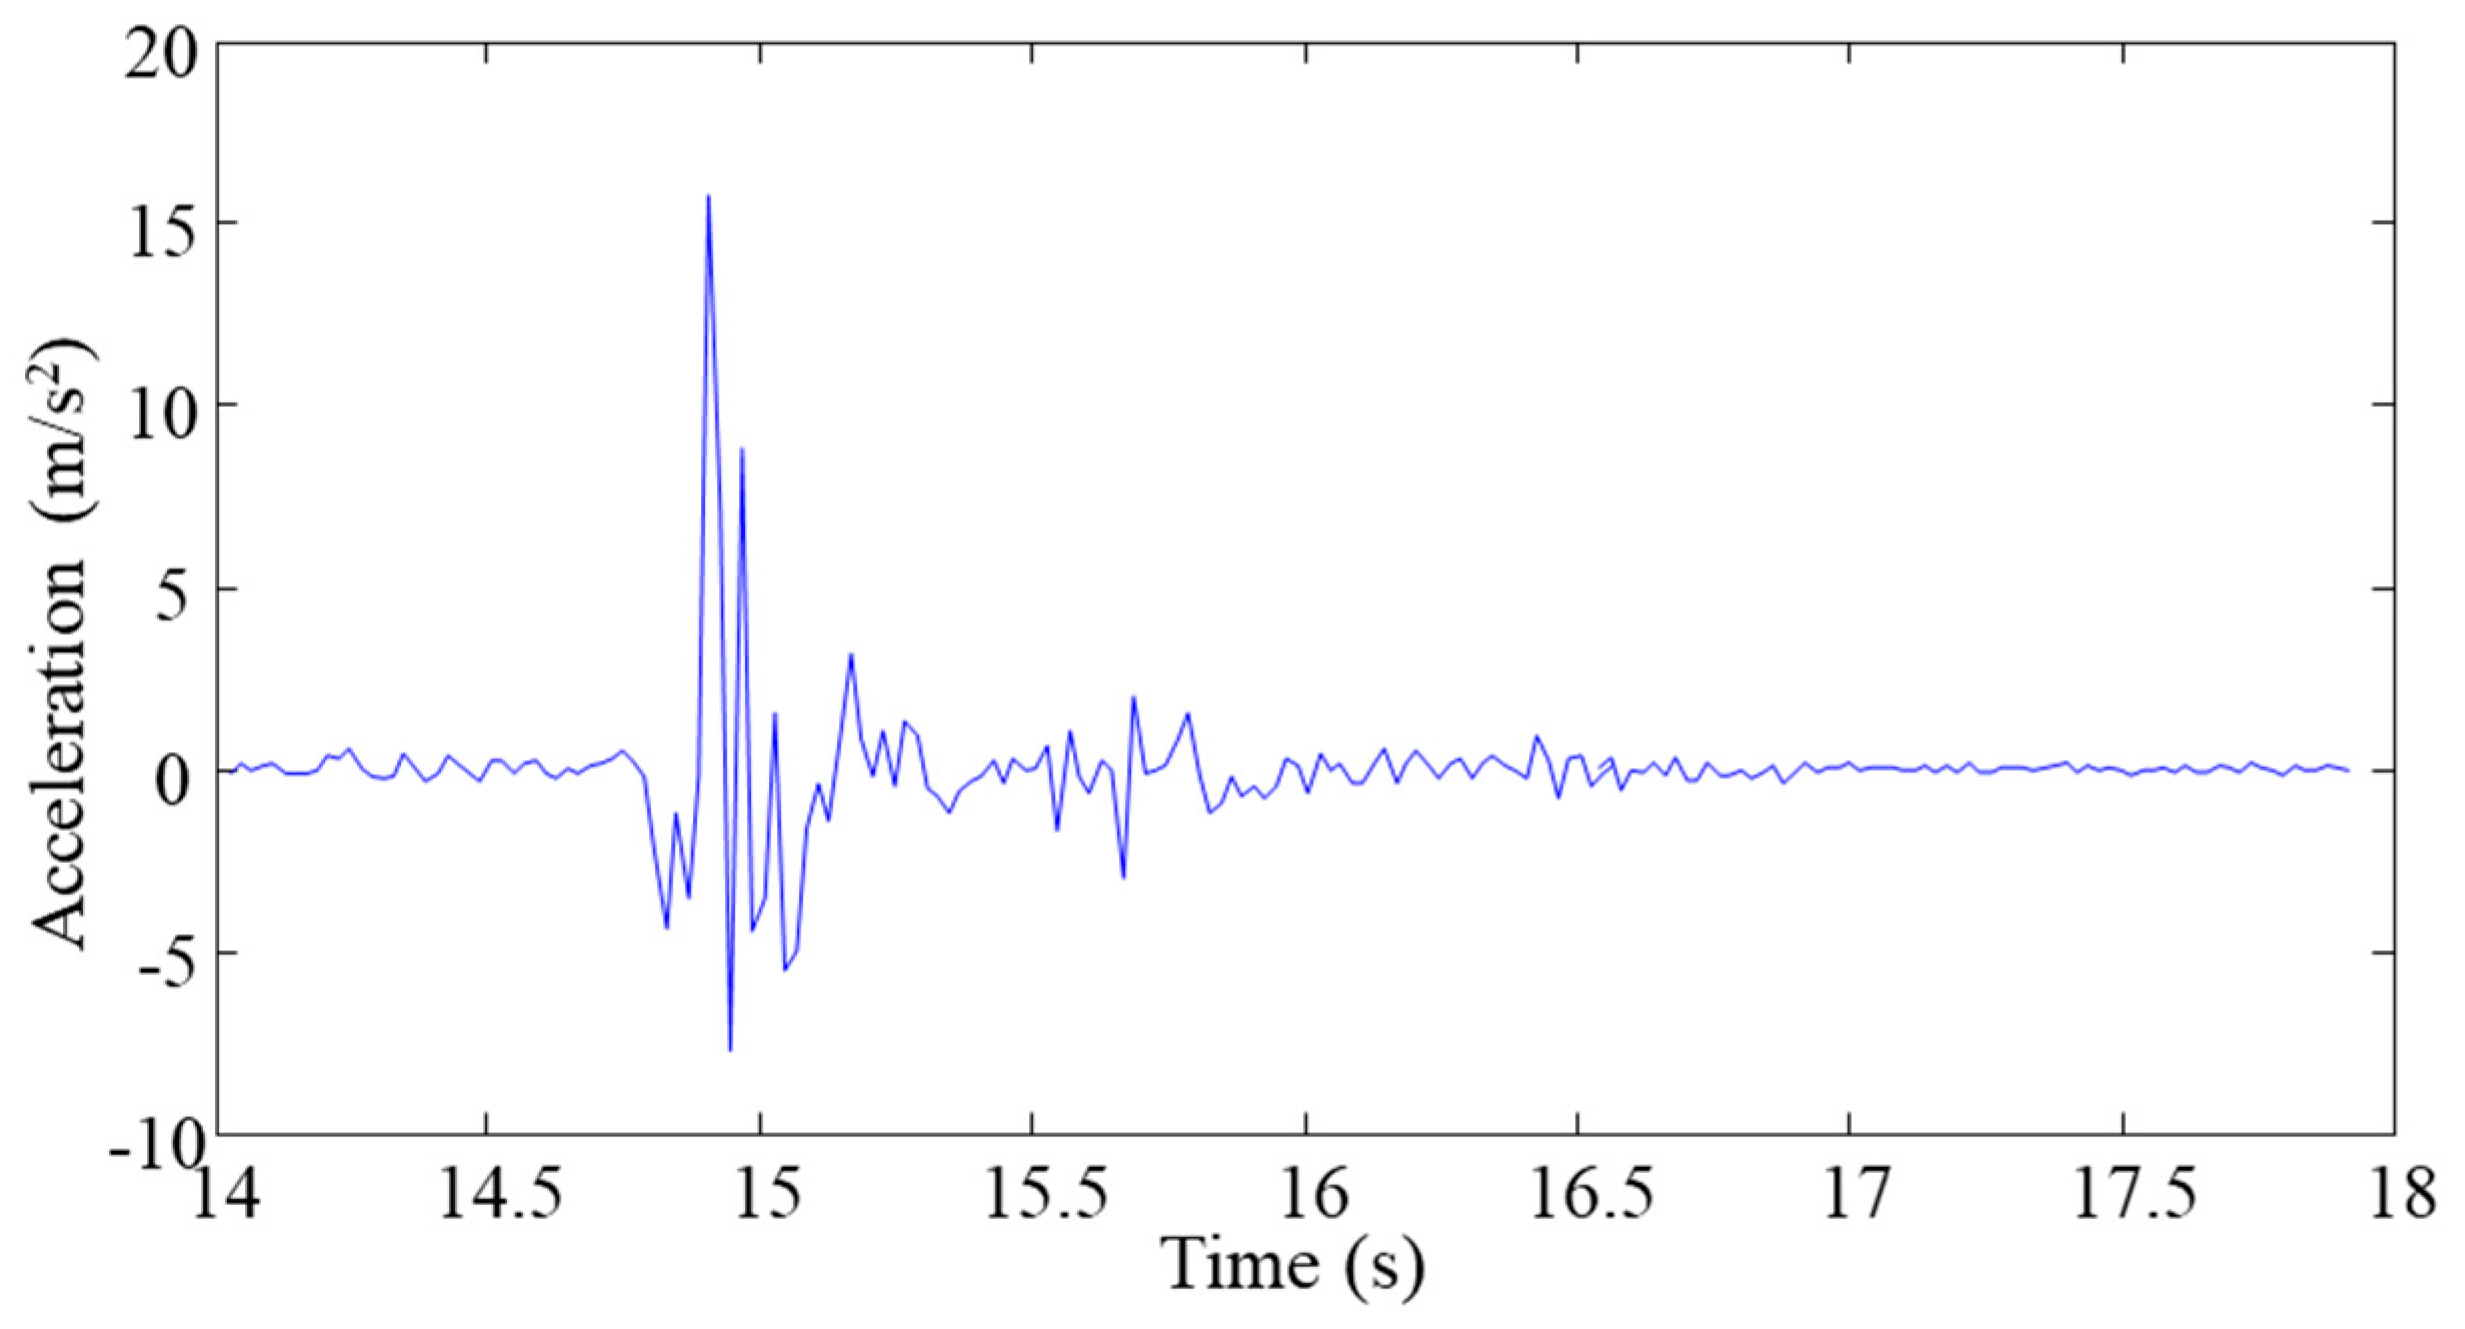
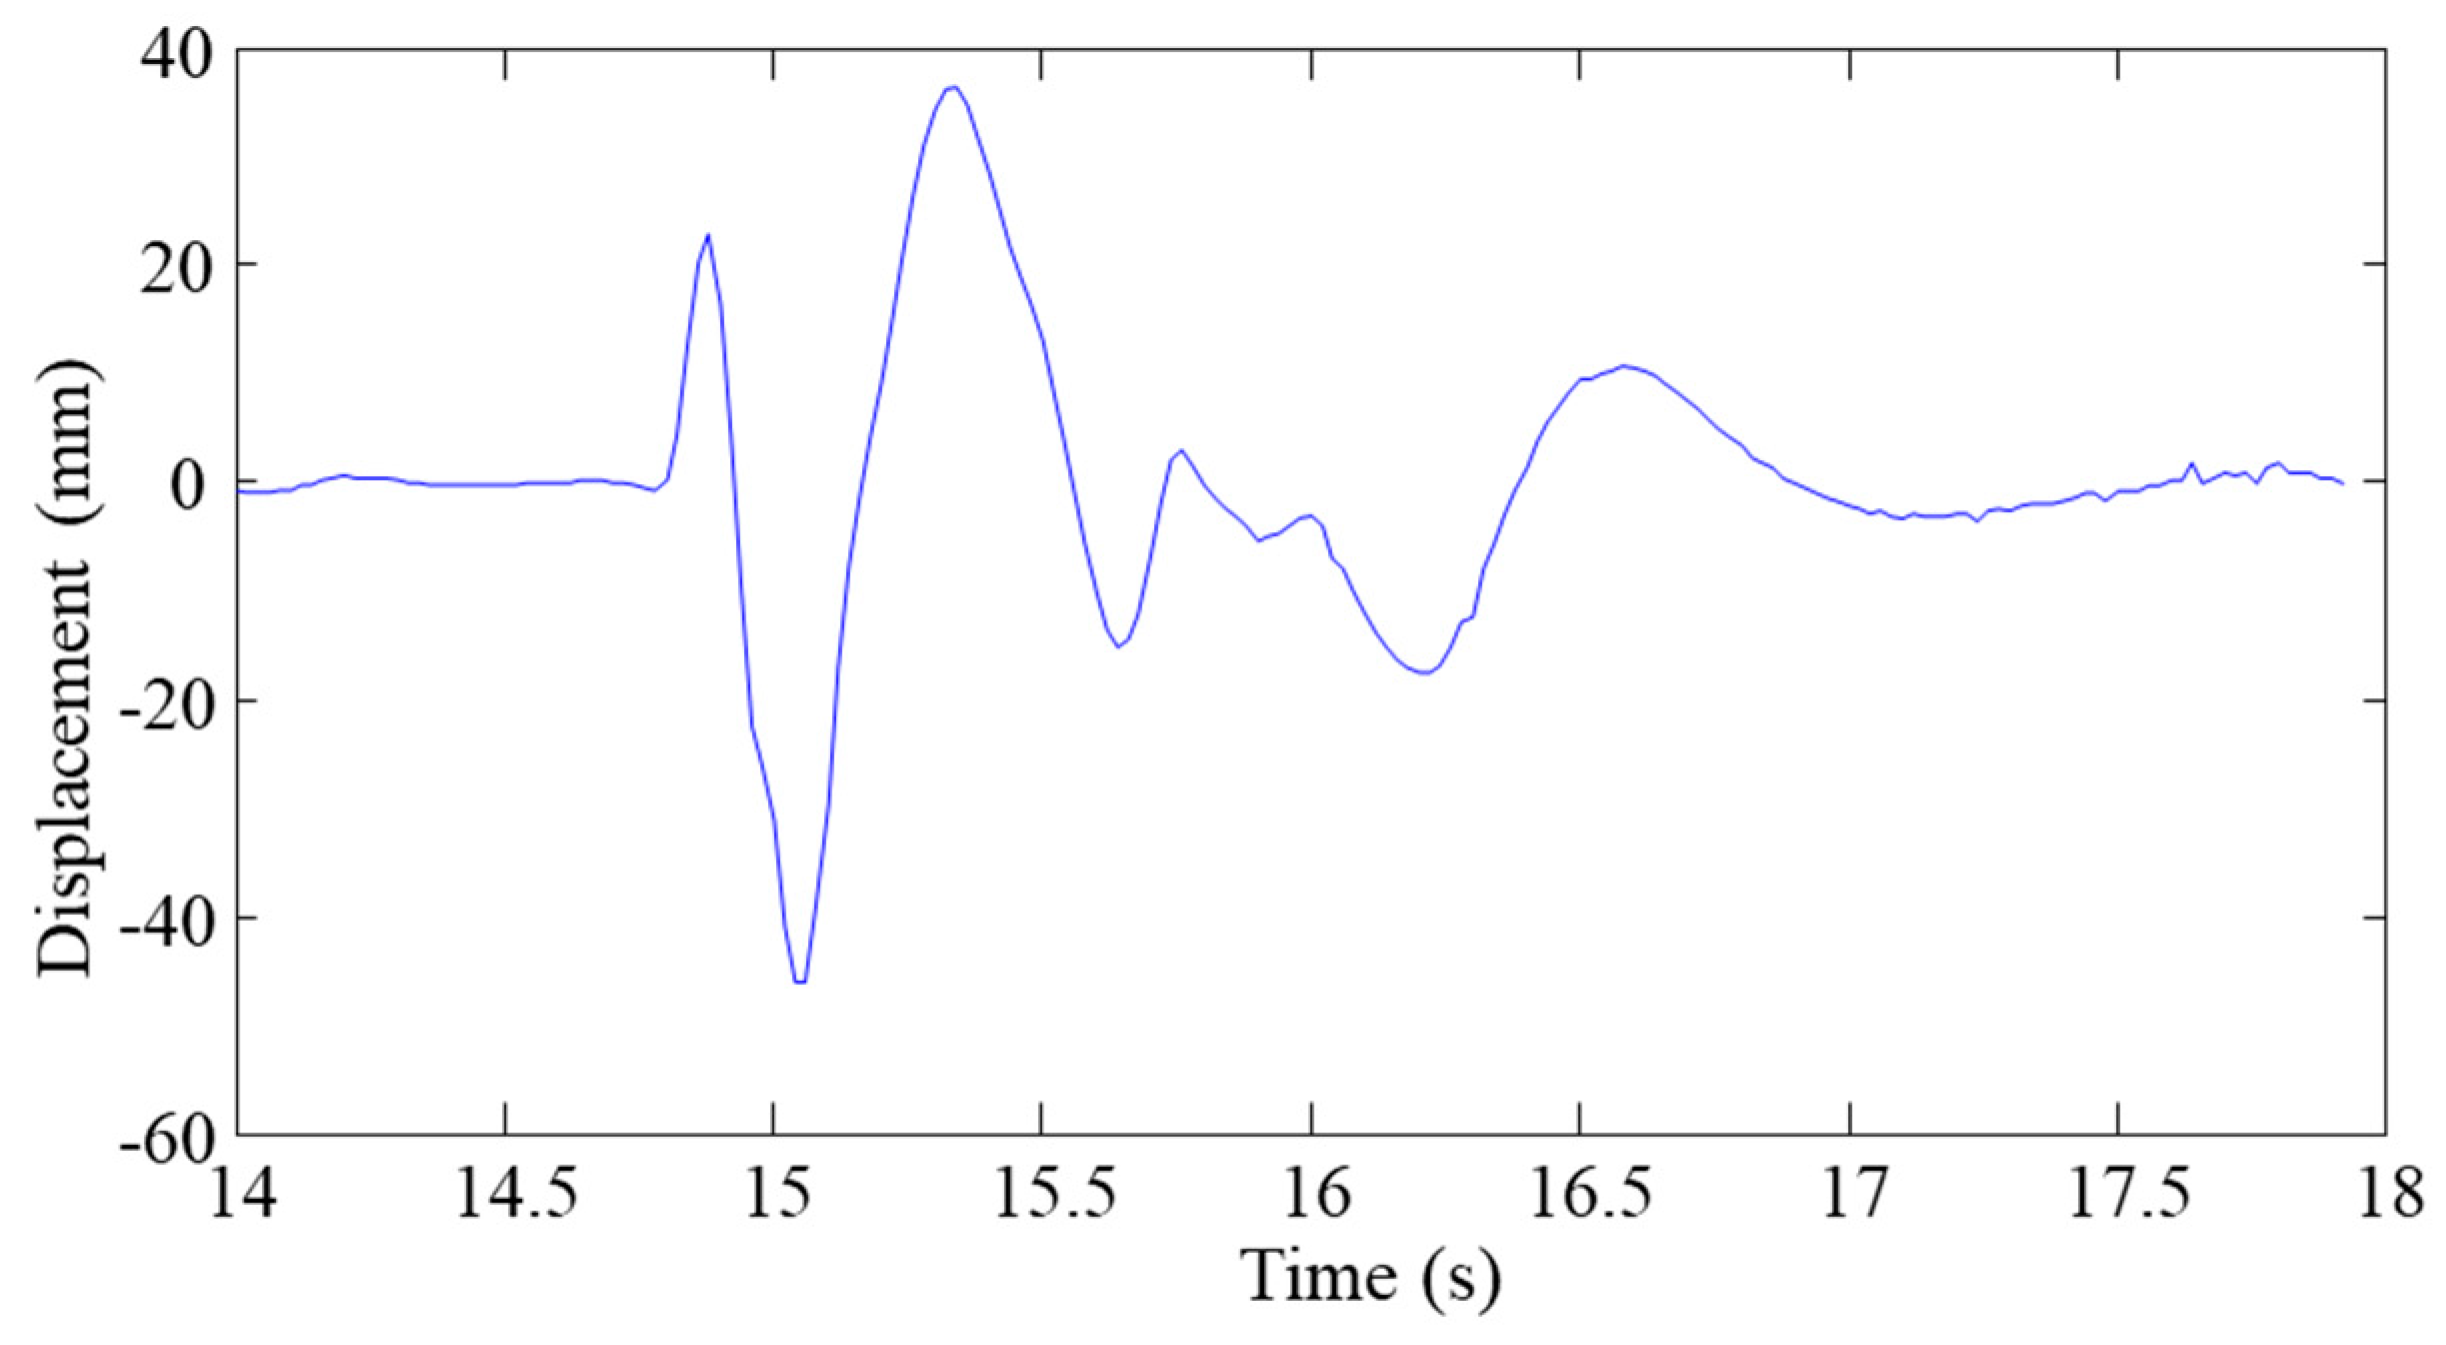
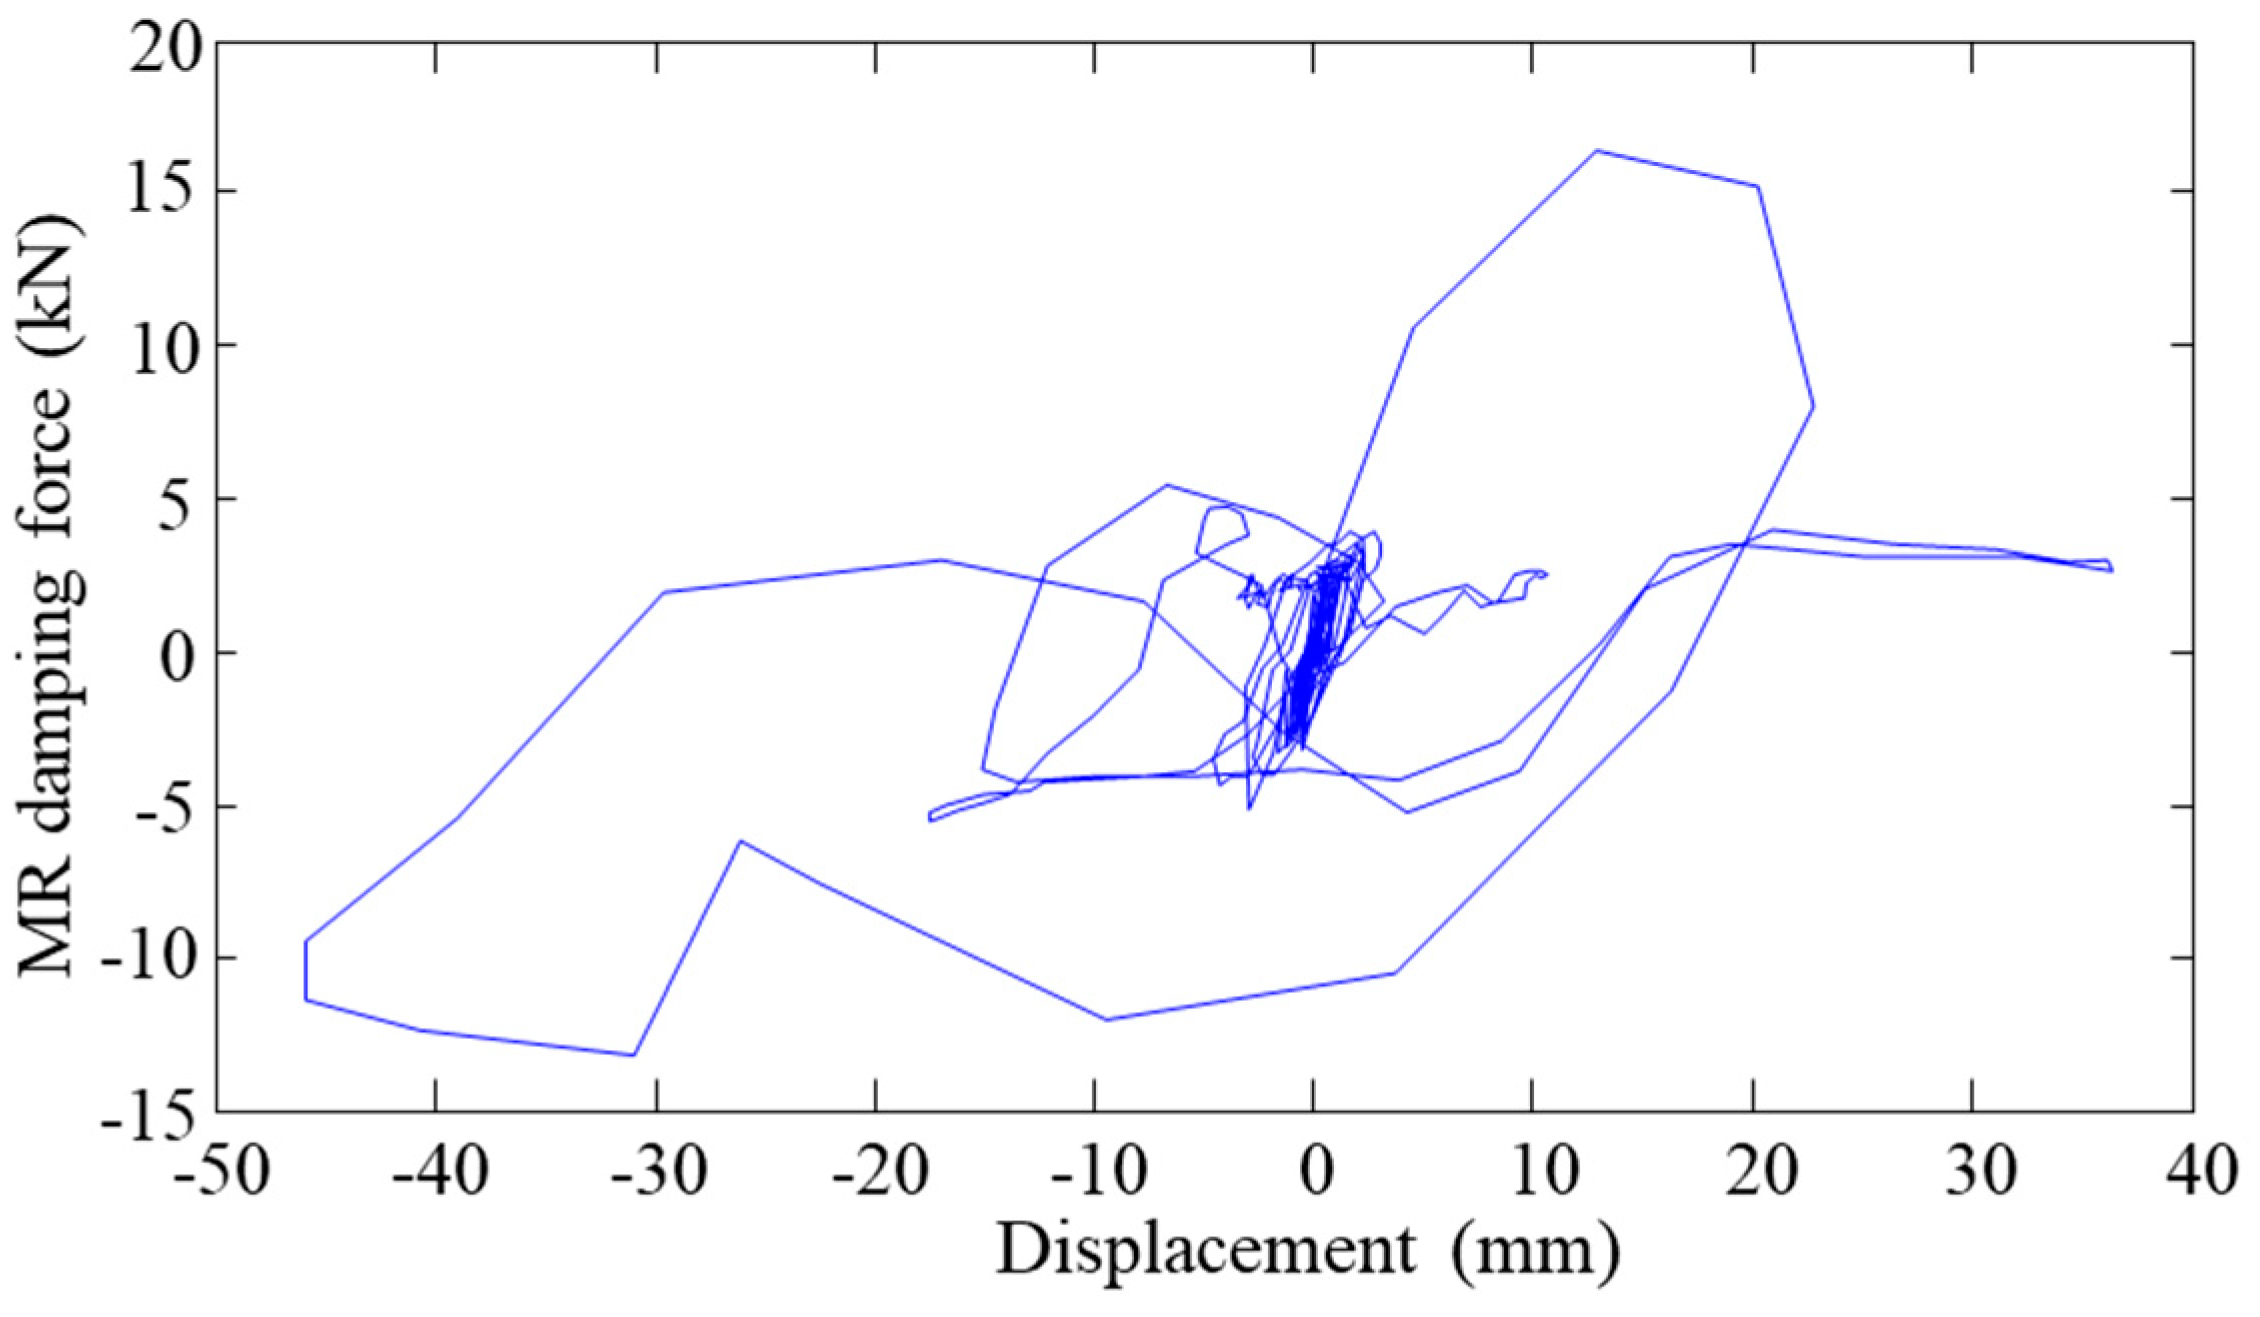
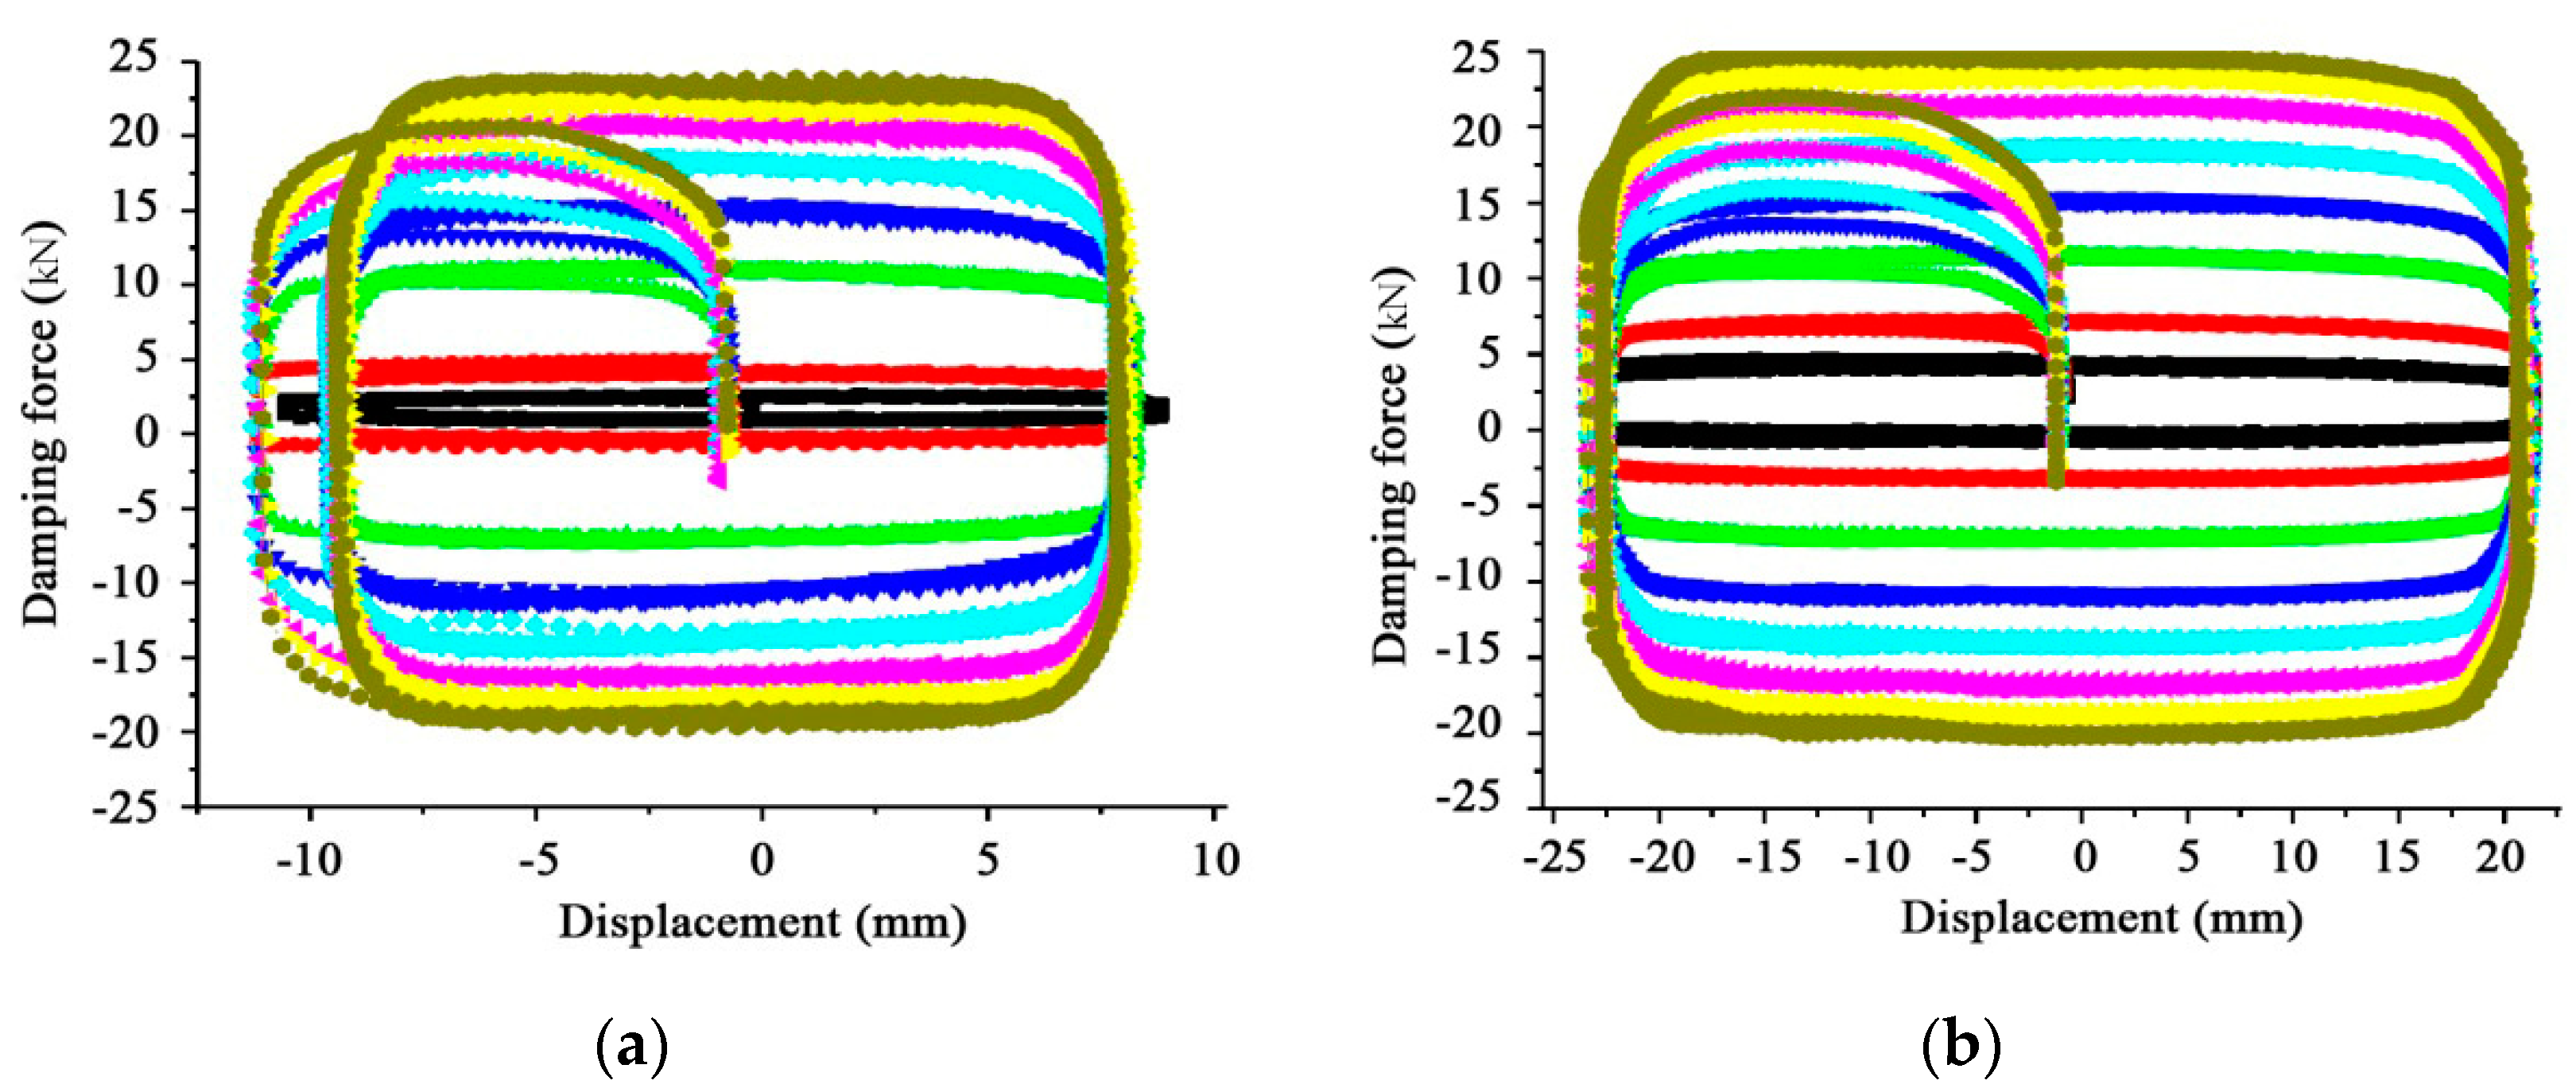
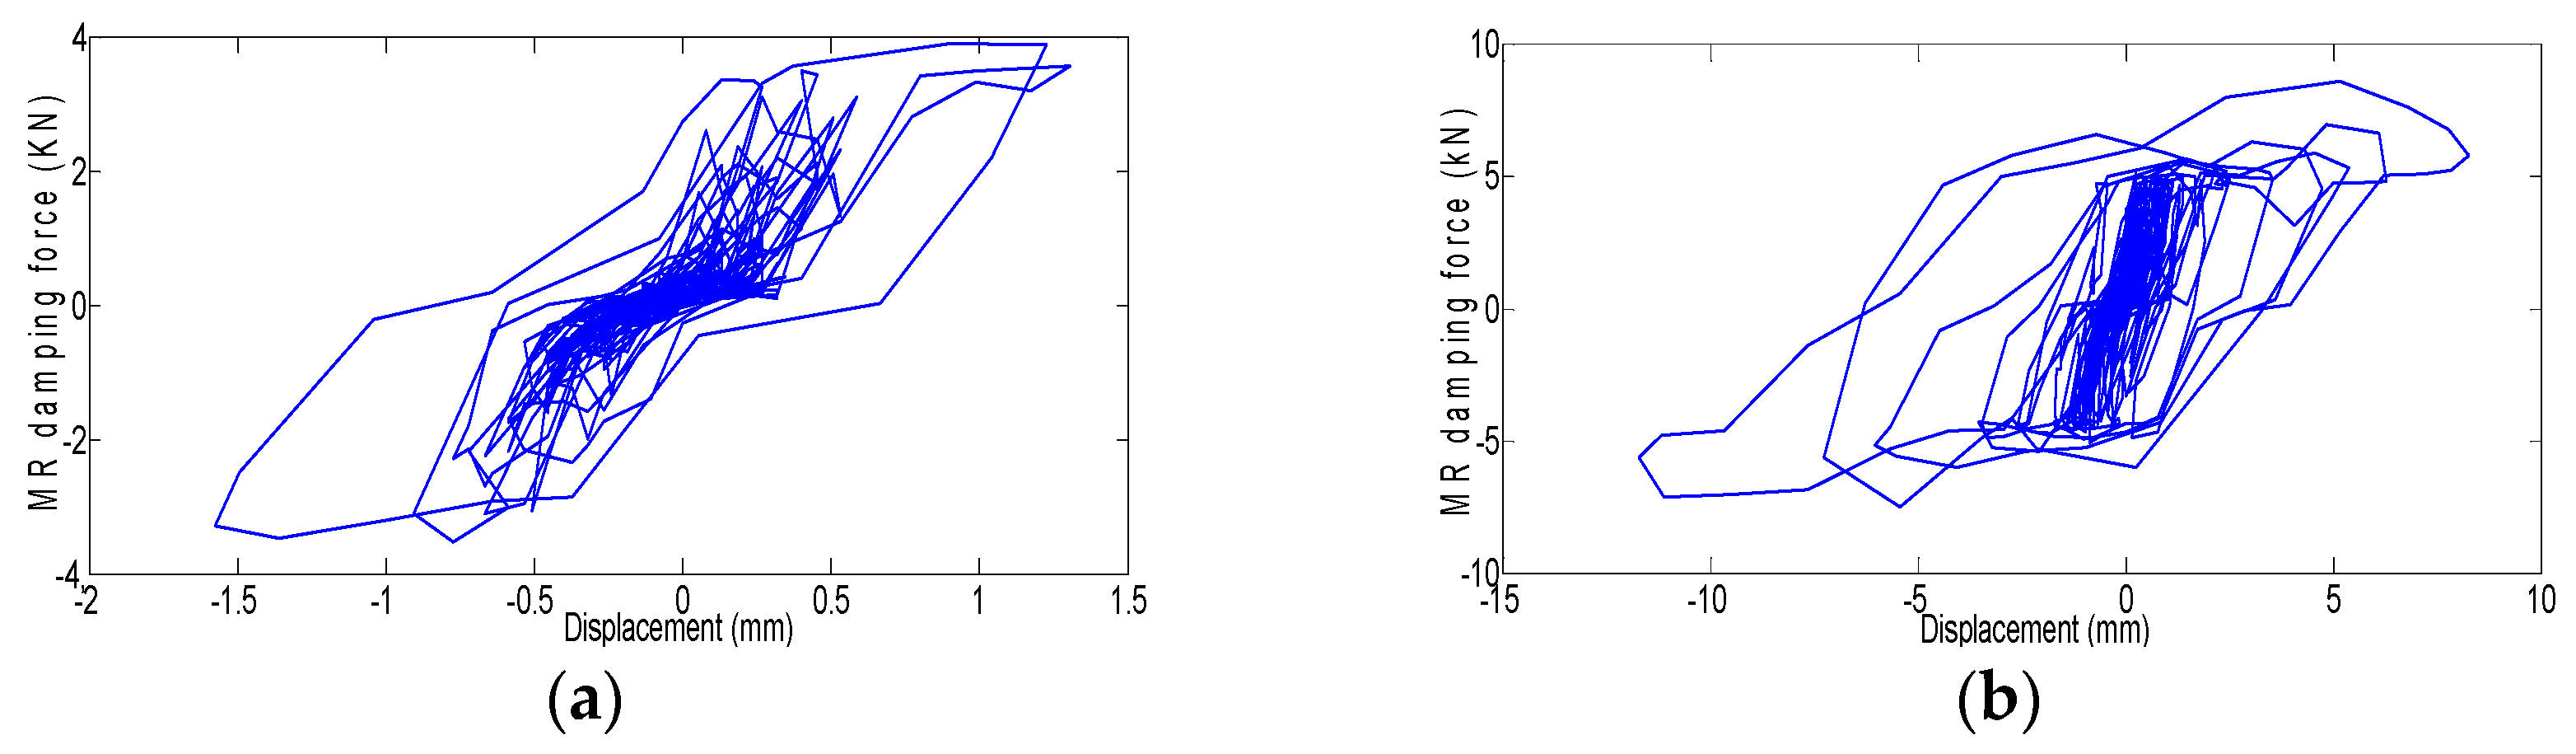
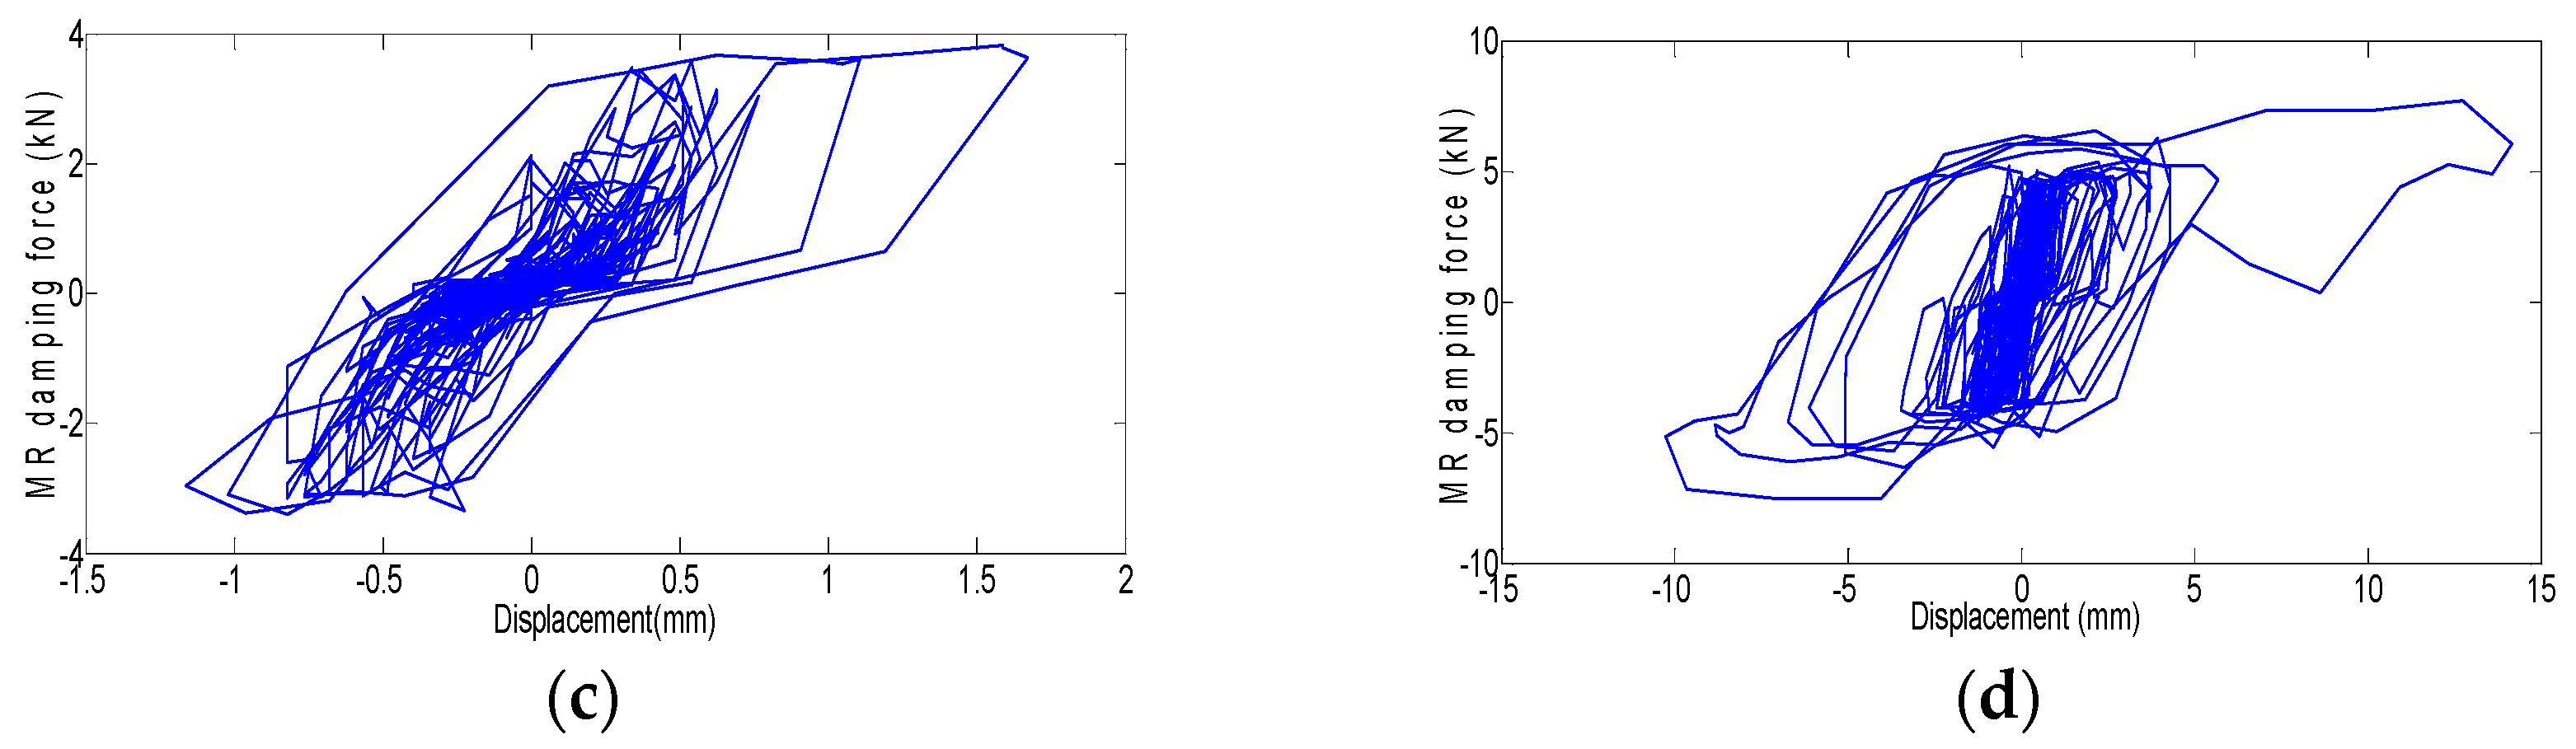
4.3. MR Damper Response

The MR damper’s force at each moment was obtained by the force sensor during the test. The hysteretic curves of the dampers under 0.72 g earthquakes of El Centro earthquake and Taft earthquake have been shown in Figure 14.
As can be seen in the figures above, the damper hysteresis curve is plump. As a result, a large amount of seismic energy is dissipated by the MR damper which eventually caused the energy reduction in the upper part of the structure.

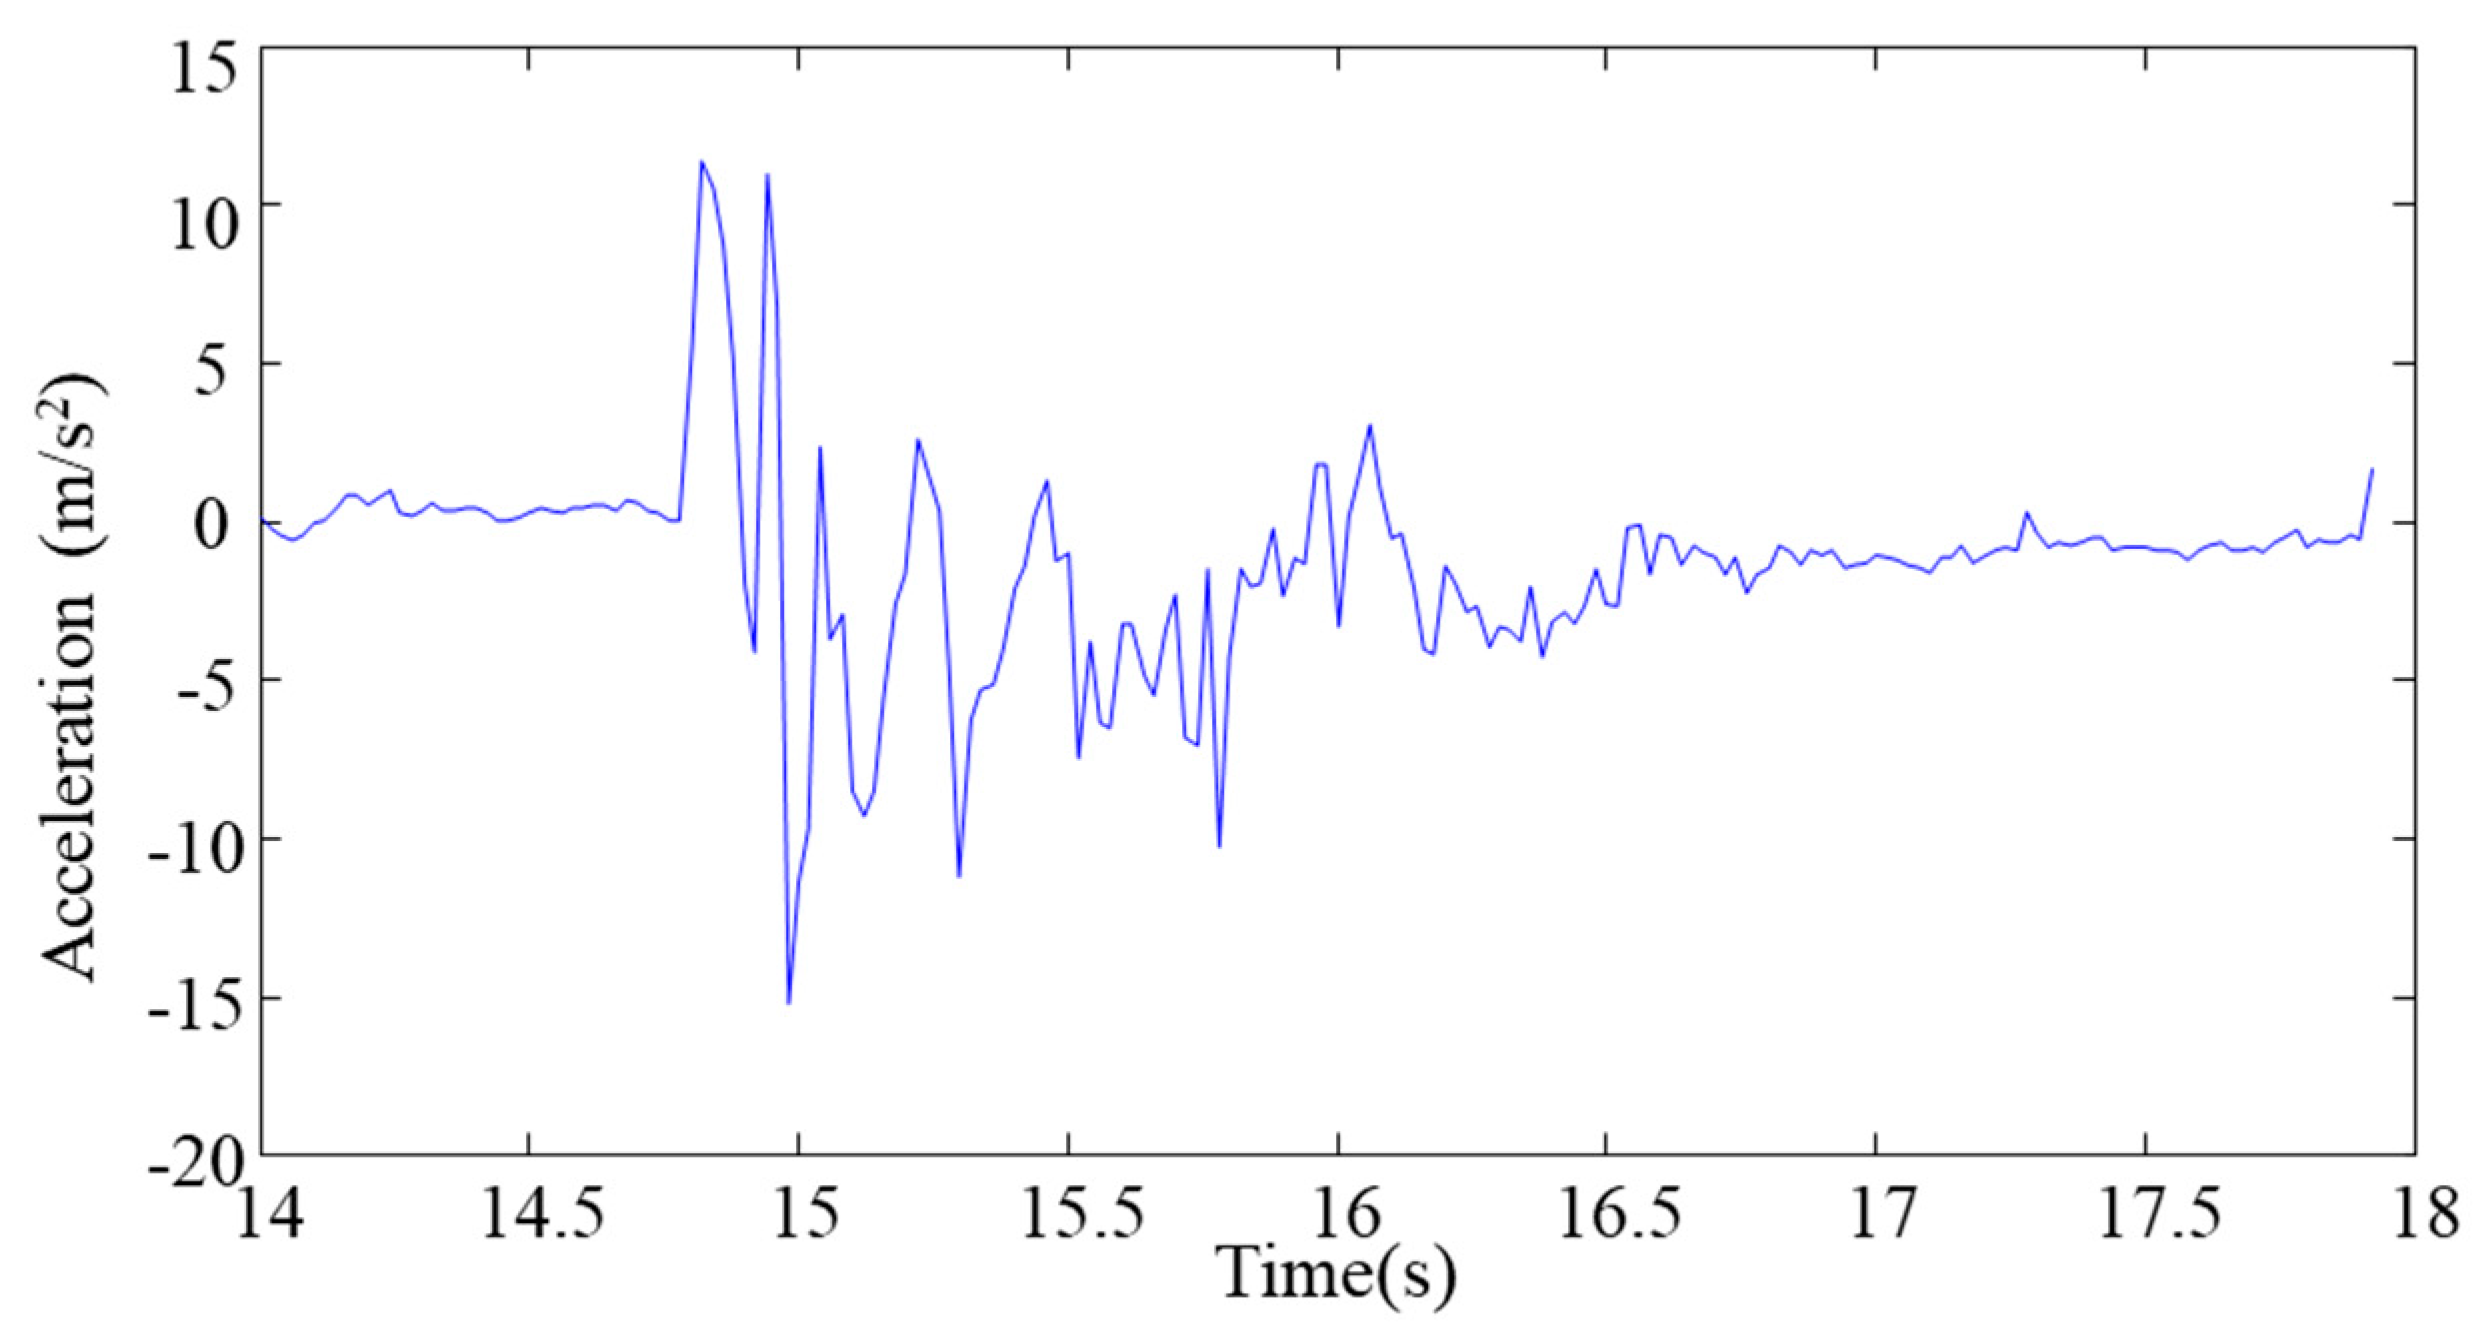
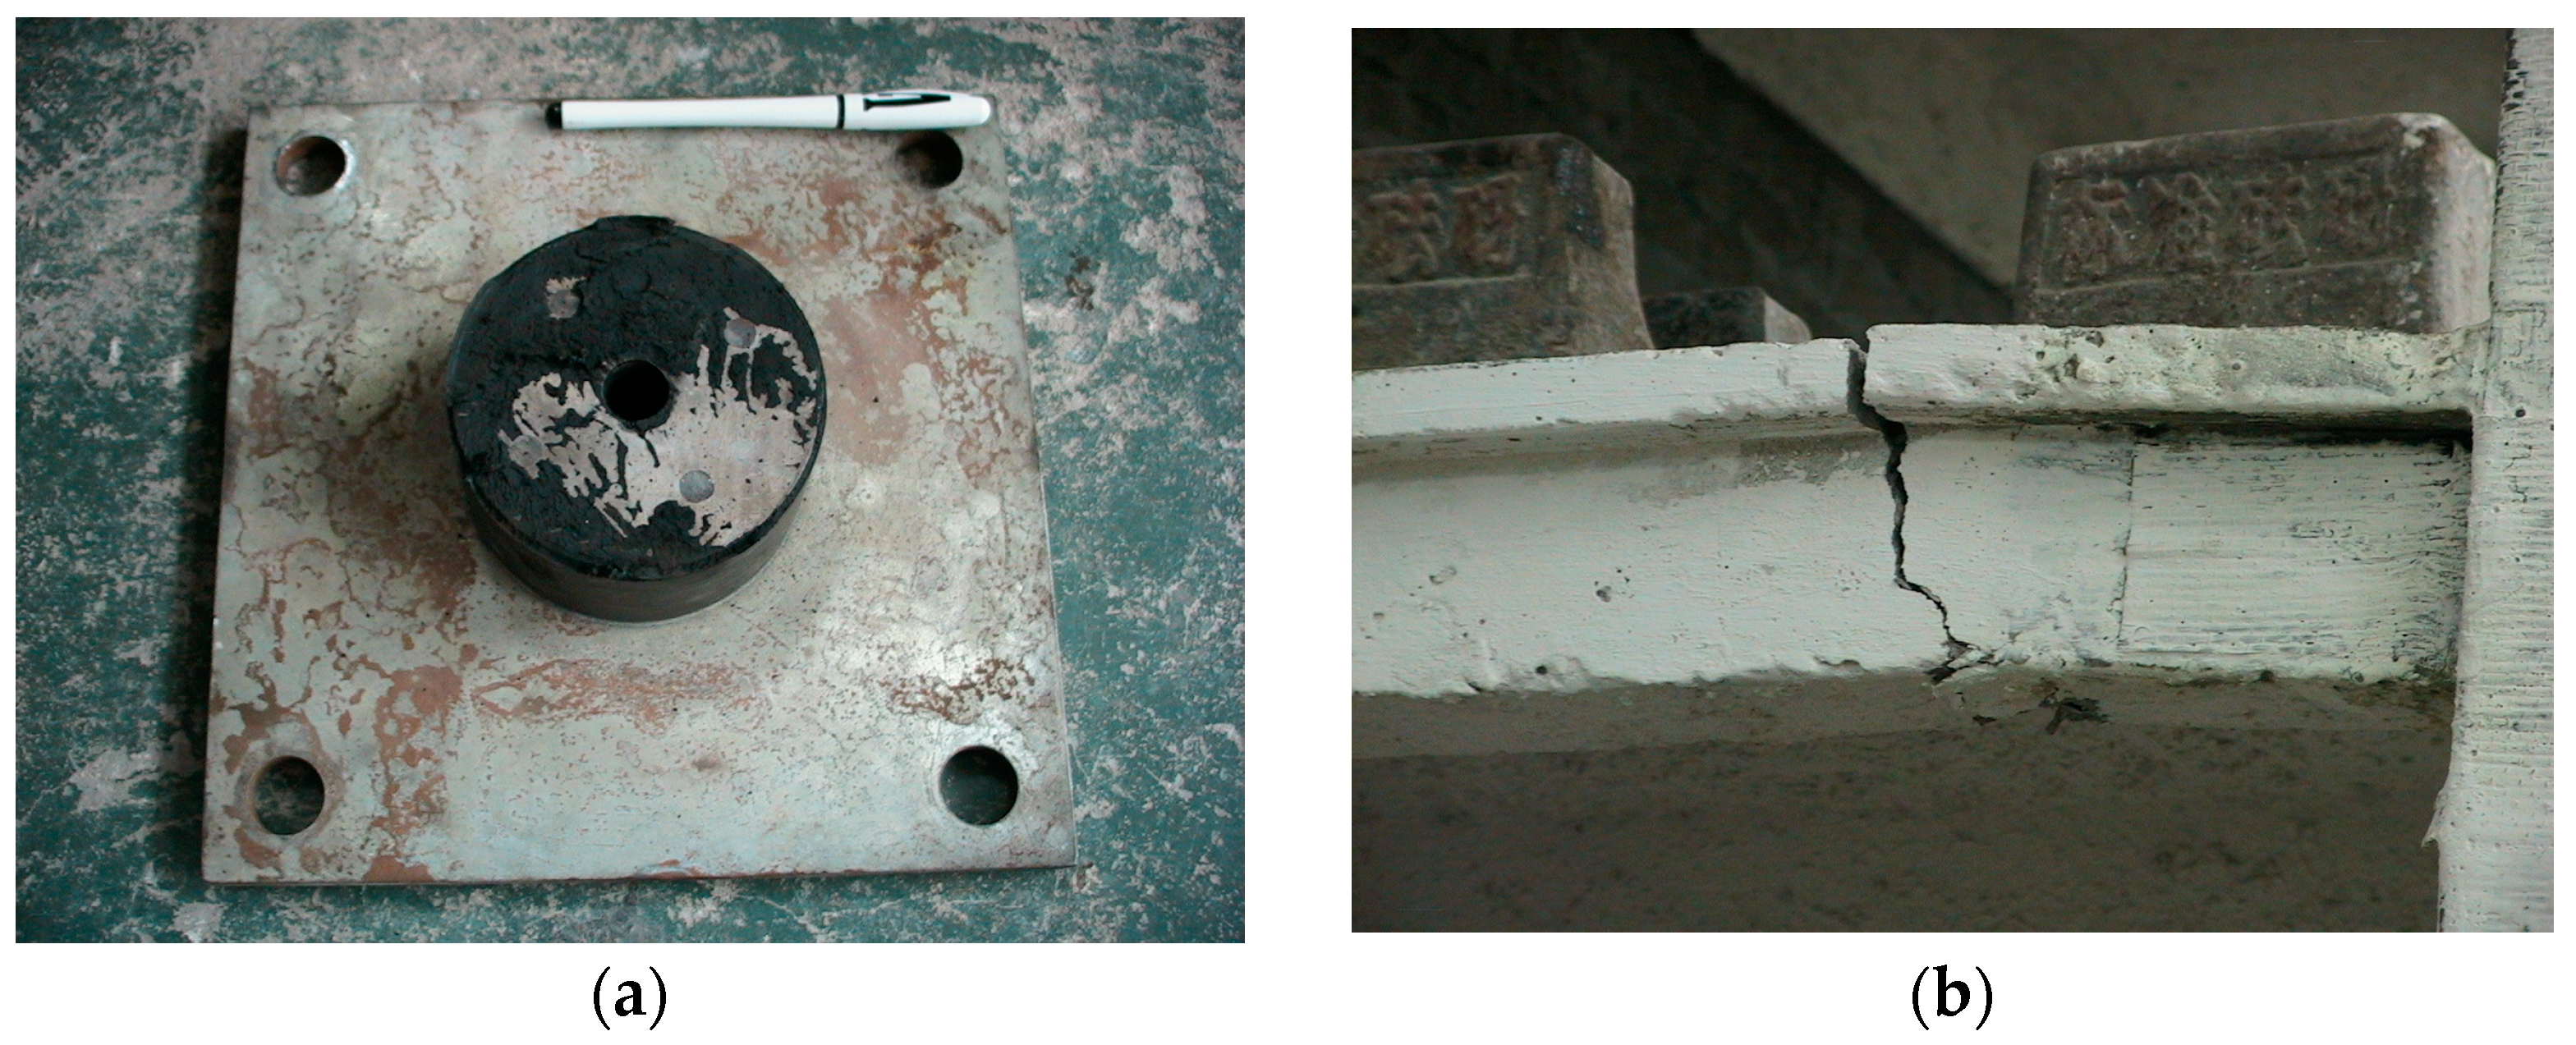
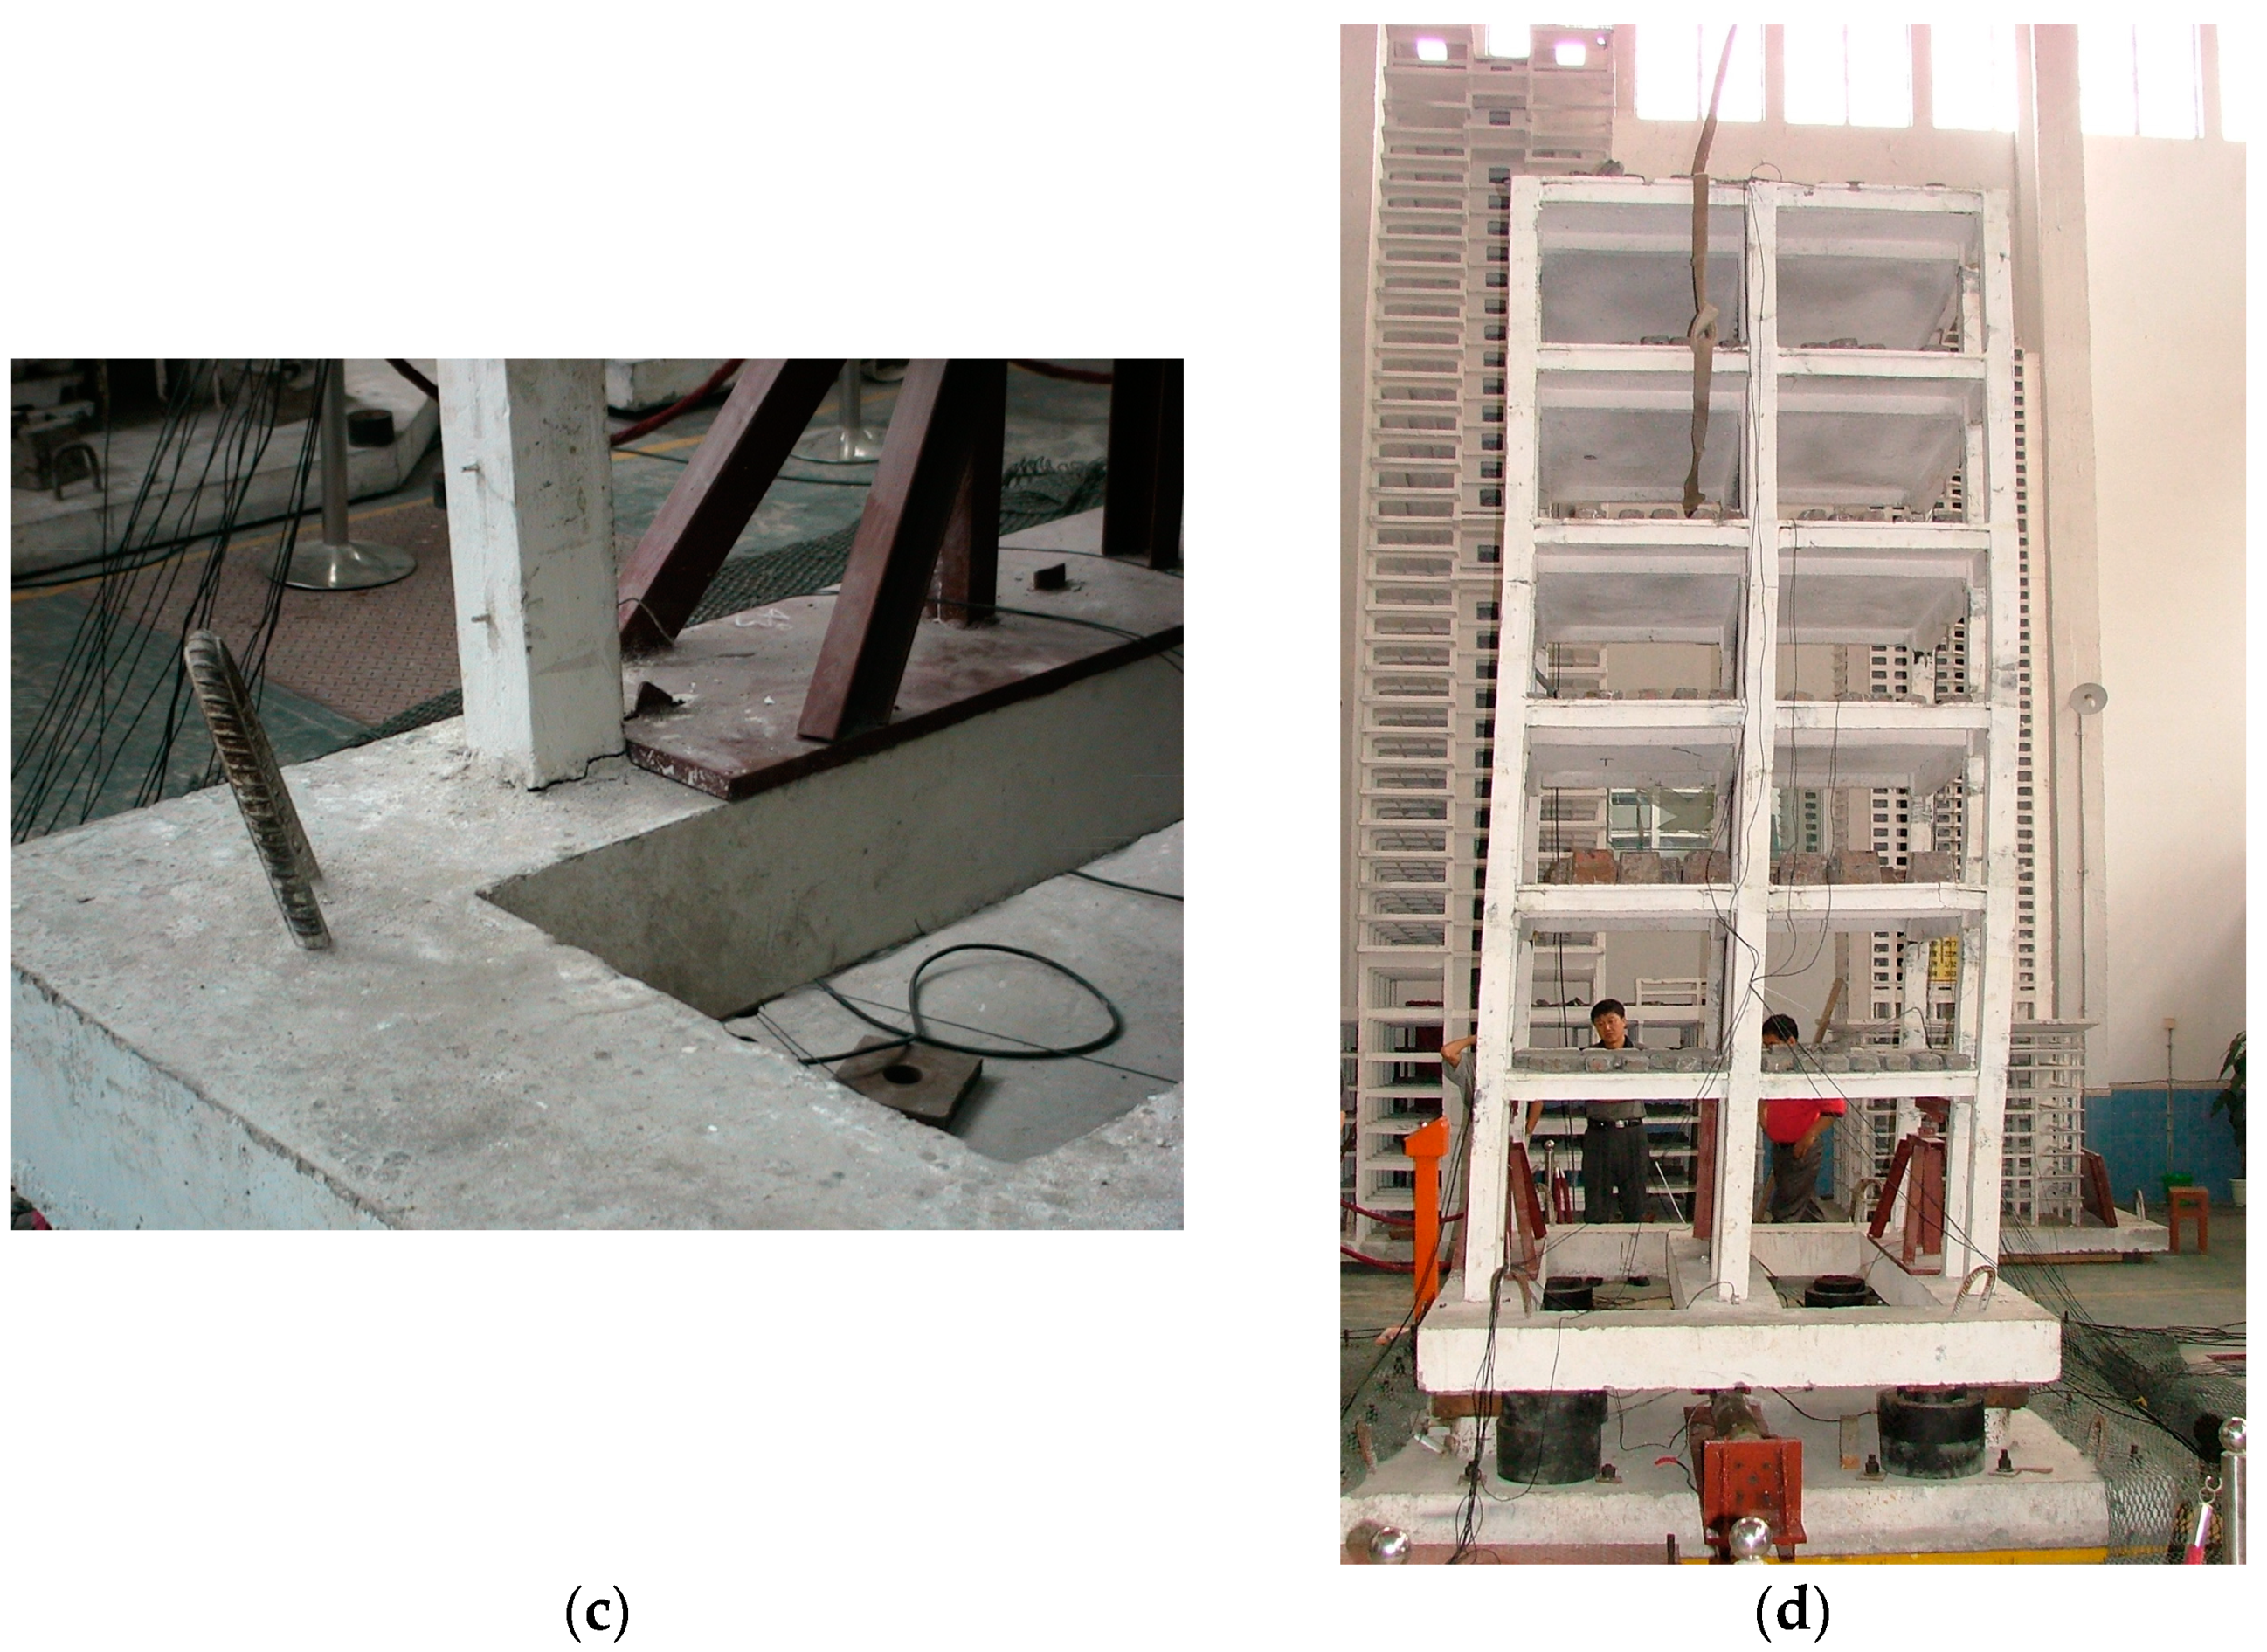
4.4. Structural Destructive Test

In order to test the damping effect of MR semi-active isolation control system under the super earthquake, the destructive test for the structure with MR control system also carried out in this experiment. The input seismic acceleration peak value reached 1.5 g. Cracks occurred in the part of the structure after the test. Figure 15 shows the seismic ground motion under a destructive reaction. Figure 16 is structure acceleration response of the top layer. The displacement time history of the isolation layer is shown in Figure 17. Figure 18 gives the hysteretic curve of the MR damper.
As can be seen in figures above, in the event of a nine-magnitude earthquake (peak acceleration is 1.5 g), the peak displacement of the isolation layer reaches 46 mm, which is close to 250% shear deformation, but the maximum shear deformation is not up to the limit of 300% in the code. At this point, the damper hysteresis curve area reaches the maximum and the energy consumption is the largest.
The main part of the structure has entered into the plastic state, but there has not been the phenomenon of overall inclination and collapse. All of this depends on the MR damper’s ability which can achieve larger energy dissipation instantaneously. Figure 19 displays the failure of structural members.

4.5. Comparison between MR Isolation and LRB Isolation System

For the same model, the isolation experiment with lead rubber bearing has been done in the relevant literature [38], using four diameter of 100 mm of lead rubber bearing (LRB). The overall yield force is 8.652 kN. The test results are shown in Table 3 under different working conditions.
Compared with the displacement of the isolation layer, the smart base isolation with MR dampers, regardless of the maximum displacement of the isolation layer or the amplification factor of the upper acceleration, is significantly less than the passive isolation with LRBs. In this way, the smart isolation system has the capability to resist larger earthquakes. Thus, it can be seen that the MR smart isolation device has better performance compared with the passive LRBs.

5. Conclusions

In this paper, two control algorithms and control strategies were applied to the isolation system consisting of MR damper and isolation rubber bearing. The numerical simulation and shaking table test of model structure were carried out. The following conclusions can be achieved:
  • Semi-active isolation system is shown to be adaptable to the external seismic input intensity, which may change the energy consumption mode with respect to external earthquake input magnitudes. It can effectively limit the deformation of the isolation layer as well as to reduce the acceleration response of the superstructure. Therefore, it demonstrates better damping effect than passive LRB isolation system.
  • The LQR control algorithm has been proven to be effective in terms of controlling the real time structural vibrations. Regarding the two control strategies, the switching control strategy is simpler than the continuous control strategy. However, in the switching control strategy, the deformation of the isolation layer is limited, and the acceleration of the upper structure is enlarged.
  • The MR damper responds more quickly to external excitations. When the structure is subjected to nine-degree earthquake, the damping force of the damper can reach the maximum capacity instantaneously to guarantee the energy dissipation performance. This can ensure the overall stability of the structure during super large earthquakes.

Author Contributions

Data curation, W.F.; algorithm development, C.Z.; formal analysis, M.L.; funding acquisition, W.F.; investigation, W.F.; project administration, C.Z.; software, M.L. and C.D.; writing—original draft, W.F.; writing—review and editing, C.Z. and C.D.

Funding

The research work was funded by the Ministry of Science and Technology Of China (grant number: 2017YFC0703603), the Nation Natural Science Foundation of China (grant number: 51,678,322) and the Shandong Provincial Natural Science Foundation, China (grant number: ZR2019MEE020).

Conflicts of Interest

The authors declare no conflict of interest.

References

  1. Soong, T.T. Passive and Active Structural Vibration Control in Civil Engineering; Michalakis, C.C., Ed.; Springer: Wien, Austria, 1994; Volume 345. [Google Scholar]
  2. Myslimaj, B.; Gamble, S.; Chin-Quee, D.; Davies, A.; Breukelman, B. Base isolation technologies for seismic protection of museum artifacts. In Proceedings of the 2003 IAMFA Annual Conference, San Francisco, CA, USA, 21–24 September 2003. [Google Scholar]
  3. Jung, H.J.; Jang, D.D.; Lee, H.J.; Lee, I.W.; Cho, S.W. Feasibility test of adaptive passive control system using MR fluid damper with electromagnetic induction part. J. Eng. Mech. 2000, 136, 254–259. [Google Scholar] [CrossRef]
  4. Wu, M.; Samali, B. Shake table testing of a base isolated model. Eng. Struct. 2002, 24, 1203–1215. [Google Scholar] [CrossRef]
  5. Zhang, C.; Wang, H. Swing Vibration Control of Suspended Structure Using Active Rotary Inertia Driver System: Parametric Analysis and Experimental Verification. Appl. Sci. 2019, 9, 3144. [Google Scholar] [CrossRef]
  6. Eem, S.H.; Jung, H.J.; Koo, J.H. Seismic performance evaluation of an MR elastomer-based smart base isolation system using real-time hybrid simulation. Smart Mater. Struct. 2009, 22, 055003. [Google Scholar] [CrossRef]
  7. Wu, Y.; Liu, N.; Qi, A. Seismic Performance of a New Structural Design Solution for First-Story Isolated RC Buildings with Coupled Beam-Column Connections. Appl. Sci. 2019, 9, 177. [Google Scholar] [CrossRef]
  8. Falborski, T.; Jankowski, R. Experimental Study on Effectiveness of a Prototype Seismic Isolation System Made of Polymeric Bearings. Appl. Sci. 2017, 7, 808. [Google Scholar] [CrossRef]
  9. Hong, S.C.; Hur, D.J. Dynamic Behavior of a Simple Rolling Seismic Isolator with a Position Restoring Device. Appl. Sci. 2018, 8, 1910. [Google Scholar] [CrossRef]
  10. Yu, Y.; Li, J.; Li, Y.; Li, S.; Li, H.; Wang, W. Comparative Investigation of Phenomenological Modeling for Hysteresis Responses of Magnetorheological Elastomer Devices. Int. J. Mol. Sci. 2019, 20, 3216. [Google Scholar] [CrossRef]
  11. Yu, Y.; Royel, S.; Li, J.; Li, Y.; Ha, Q. Magnetorheological elastomer base isolator for earthquake response mitigation on building structures: Modeling and second-order sliding mode control. Earthq. Struct. 2016, 11, 943–966. [Google Scholar] [CrossRef]
  12. Li, Y.; Li, J.; Li, W.; Du, H. A state-of-the-art review on magnetorheological elastomer devices. Smart Mater. Struct. 2014, 23, 123001. [Google Scholar] [CrossRef]
  13. Zhang, C.W.; Ou, J.P. Control Structure Interaction of Electromagnetic Mass Damper System for Structural Vibration Control. J. Eng. Mech. 2008, 134, 428–437. [Google Scholar] [CrossRef]
  14. Gu, X.; Yu, Y.; Li, Y.; Li, J.; Askari, M.; Samali, B. Experimental study of semi-active magnetorheological elastomer base isolation system using optimal neuro fuzzy logic control. Mech. Syst. Signal Process. 2019, 119, 380–398. [Google Scholar] [CrossRef]
  15. Yan, B.; Ma, H.; Jian, B.; Wang, K.; Wu, C. Nonlinear dynamics analysis of a bi-state nonlinear vibration isolator with symmetric permanent magnets. Nonlinear Dyn. 2019, 97, 1–21. [Google Scholar] [CrossRef]
  16. Sato, E.; Furukawa, S.; Kakehi, A.; Nakashima, M. Full-scale shaking table test for examination of safety and functionality of base-isolated medical facilities. Earthq. Eng. Struct. Dyn. 2011, 40, 1435–1453. [Google Scholar] [CrossRef]
  17. Liu, W.; Tian, K.; Wei, L.; He, W.; Yang, Q. Earthquake response and isolation effect analysis for separation type three-dimensional isolated structure. Bull. Earthq. Eng. 2018, 16, 6335–6364. [Google Scholar] [CrossRef]
  18. Wang, T.; Wang, H.; Liu, W.; Zhang, Y. Shaking Table test Research on Large Height-Width Ratio Rubber Bearings Isolation Structure (1). J. Harbin Inst. Technol. 2006, 38, 2060–2064. [Google Scholar]
  19. Wang, T.; Wang, H.; Liu, W.; Zhang, Y. Shaking Table test Research on Large Height-Width Ratio Rubber Bearings Isolation Structure (2). J. Harbin Inst. Technol. 2007, 39, 196–200. [Google Scholar]
  20. Du, Y.; Wang, X.; Zhu, X. Overturning collapse simulation of isolation structure under near-fault seismic motion considering potential pounding. Build. Struct. 2013, 39, 56–59. [Google Scholar]
  21. Huang, B.; Zhang, H.; Wang, H.; Song, G. Passive base isolation with superelastic nitinol SMA helical springs. Smart Mater. Struct. 2014, 23, 065009. [Google Scholar] [CrossRef]
  22. Cai, W.; Yu, B.; Kaewunruen, S. Shaking Table Tests of Suspended Structures Equipped with Viscous Dampers. Appl. Sci. 2019, 9, 2616. [Google Scholar] [CrossRef]
  23. Naderpour, H.; Naji, N.; Burkacki, D.; Jankowski, R. Seismic Response of High-Rise Buildings Equipped with Base Isolation and Non-Traditional Tuned Mass Dampers. Appl. Sci. 2019, 9, 1201. [Google Scholar] [CrossRef]
  24. Liu, Y.; Wang, H.; Qiu, C.; Zhao, X. Seismic Behavior of Superelastic Shape Memory Alloy Spring in Base Isolation System of Multi-Story Steel Frame. Materials 2019, 12, 997. [Google Scholar] [CrossRef] [PubMed]
  25. Spencer, B., Jr.; Dyke, S.J.; Sain, M.K.; Carlson, J. Phenomenological model for magnetorheological dampers. J. Eng. Mech. 1997, 123, 230–238. [Google Scholar] [CrossRef]
  26. Xu, H.B.; Zhang, C.W.; Li, H.; Tan, P.; Ou, J.P.; Zhou, F.L. Active mass driver control system for suppressing wind-induced vibration of the Canton Tower. Smart Struct. Syst. 2014, 13, 281–303. [Google Scholar] [CrossRef]
  27. Zhang, C.W. Control Force Characteristics of Different Control Strategies for the Wind-excited 76-story Benchmark Building Structure. Adv. Struct. Eng. 2014, 17, 543–559. [Google Scholar] [CrossRef]
  28. Zhang, C.W.; Ou, J.P. Modeling and Dynamical Performance of the Electromagnetic Mass Driver System for Structural Vibration Control. Eng. Struct. 2015, 82, 93–103. [Google Scholar] [CrossRef]
  29. Xu, H.B.; Zhang, C.W.; Li, H.; Ou, J.P. Real-time hybrid simulation approach for performance validation of structural active control systems: A linear motor actuator based active mass driver case study. Struct. Control Health Monit. 2014, 21, 574–589. [Google Scholar] [CrossRef]
  30. Yang, G.; Spencer, B.F., Jr.; Carlson, J.D.; Sain, M.K. Large-scale MR fluid dampers: Modeling and dynamic performance considerations. Eng. Struct. 2002, 24, 309–323. [Google Scholar] [CrossRef]
  31. Yoshida, O.; Dyke, S.J.; Giacosa, L.M.; Truman, K.Z. Experimental verification of torsional response control of asymmetric buildings using MR dampers. Earthq. Eng. Struct. Dyn. 2003, 32, 2085–2105. [Google Scholar] [CrossRef]
  32. Zhang, C.W.; Ou, J.; Zhang, J. Parameter Optimization and Analysis of Vehicle Suspension System Controlled by Magnetorheological Fluid Dampers. Struct. Control Health Monit. 2006, 13, 885–896. [Google Scholar] [CrossRef]
  33. Zhang, C.W.; Li, L.Y.; Ou, J.P. Swinging motion control of suspended structures: Principles and applications. Struct. Control Health Monit. 2010, 17, 549–562. [Google Scholar] [CrossRef]
  34. Ramallo, J.C.; Johnson, E.A.; Spencer, B.F., Jr. “Smart” base isolation systems. J. Eng. Mech. 2002, 128, 1088–1099. [Google Scholar] [CrossRef]
  35. Yoshioka, H.; Ramallo, J.C.; Spencer, B.F., Jr. “Smart” base isolation strategies employing magnetorheological dampers. J. Eng. Mech. 2002, 128, 540–551. [Google Scholar] [CrossRef]
  36. Oliveira, F.; Botto, M.A.; Morais, P.; Suleman, A. Semi-active structural vibration control of base-isolated buildings using magnetorheological dampers. J. Low Freq. Noise Vib. Act. Control 2018, 37, 565–576. [Google Scholar] [CrossRef]
  37. Fan, Y.C.; Loh, C.H.; Yang, J.N.; Lin, P.Y. Experimental performance evaluation of an equipment isolation using MR dampers. Earthq. Eng. Struct. Dyn. 2009, 38, 285–305. [Google Scholar] [CrossRef]
  38. Sahasrabudhe, S.; Nagarajaiah, S. Experimental study of sliding base-isolated buildings with magnetorheological dampers in near-fault earthquakes. J. Struct. Eng. 2005, 131, 1025–1034. [Google Scholar] [CrossRef]
  39. Asai, T.; Chang, C.M.; Spencer, B.F., Jr. Real-time hybrid simulation of a smart base-isolated building. J. Eng. Mech. 2014, 141, 04014128. [Google Scholar] [CrossRef]
  40. Yoshida, S.; Fujitani, H.; Mukai, Y.; Ito, M. Real-time hybrid simulation of semi-active control using shaking table: Proposal and verification of a testing method for mid-story isolated buildings. Jpn. Archit. Rev. 2018, 1, 221–234. [Google Scholar] [CrossRef]
  41. Zhang, C.W.; Alam, Z.; Sun, L.; Su, Z.X.; Samali, B. Fibre Bragg grating sensor-based damage response monitoring of an asymmetric reinforced concrete shear wall structure subjected to progressive seismic loads. Struct. Control Health Monit. 2019, 26. [Google Scholar] [CrossRef]
  42. Fu, W.; Zhang, C.; Sun, L.; Askari, M.; Samali, B.; Chung, K.L.; Sharafi, P. Experimental investigation of a base isolation system incorporating MR dampers with the high-order single step control algorithm. Appl. Sci. 2017, 7, 344. [Google Scholar] [CrossRef]
  43. Zhang, R.; Phillips, B.M.; Taniguchi, S.; Ikenaga, M.; Ikago, K. Shake table real-time hybrid simulation techniques for the performance evaluation of buildings with inter-story isolation. Struct. Control Health Monit. 2017, 24, e1971. [Google Scholar] [CrossRef]
  44. Yan, B.; Ma, H.; Zheng, W.; Jian, B.; Wang, K.; Wu, C. Nonlinear electromagnetic shunt damping for nonlinear vibration isolators. IEEE/ASME Trans. Mechatron. 2019, 24, 1851–1860. [Google Scholar] [CrossRef]
  45. Lin, P.Y.; Roschke, P.N.; Loh, C.H. Hybrid base-isolation with magnetorheological damper and fuzzy control. Struct. Control Health Monit. 2007, 14, 384–405. [Google Scholar] [CrossRef]
  46. Jung, H.J.; Choi, K.M.; Spencer, B.F., Jr.; Lee, I.W. Application of some semi-active control algorithms to a smart base-isolated building employing MR damper. Struct. Control Health Monit. 2006, 13, 693–704. [Google Scholar] [CrossRef]
  47. Zhang, C.W.; Ou, J.P. Control strategies and experimental verifications of the electromagnetic mass damper system for structural vibration control. Earthq. Eng. Eng. Vib. 2008, 7, 181–192. [Google Scholar] [CrossRef]
  48. Askari, M.; Yu, Y.; Zhang, C.W.; Samali, B. Real-Time Tracking of Structural Stiffness Reduction with Unknown Inputs, using Self-Adaptive Recursive Least Square and Curvature Change Techniques. Int. J. Struct. Stab. Dyn. 2019, 6, 26. [Google Scholar] [CrossRef]
  49. Jansen, L.M.; Dyke, S.J. Semiactive control strategies for MR dampers: Comparative study. J. Eng. Mech. 2000, 126, 795–803. [Google Scholar] [CrossRef]
  50. Ouyang, Y.; Shan, J.; Shi, W.; Spencer, B.F. Adaptive control for smart-actuated base isolation structures regarding various reference-tracking strategies. Eng. Struct. 2019, 198, 109574. [Google Scholar] [CrossRef]
  51. Wang, T. Research on the Overturn Effect of Rubber Isolation Structure. Ph.D. Thesis, Harbin Institute of Technology, Harbin, China, 2004. [Google Scholar]
Figure 1. Sketch of structure and control system.
Applsci 09 03866 g001
Figure 2. Six story reinforced concrete frame structure.
Applsci 09 03866 g002
Figure 3. The rubber bearing in testing.
Applsci 09 03866 g003
Figure 4. Force and displacement curve under 100% deformation of bearing. (a) rubber bearing-A; (b) rubber bearing-B.
Applsci 09 03866 g004
Figure 5. MR damper.
Applsci 09 03866 g005
Figure 6. Connection diagram of damper in isolation layer.
Applsci 09 03866 g006
Figure 7. The hysteretic curve under (a) an amplitude of 10 mm and 1-Hz sine wave, and (b) an amplitude of 20 mm and 0.5 Hz sine wave.
Applsci 09 03866 g007
Figure 8. Sensors arrangement. (a) linear variable differential transformer (LVDT) displacement sensor in isolation layer; (b) LVDT displacement sensor in the bottom layer; (c) three acceleration sensors; (d) magnetorheological (MR) damper in isolation layer.
Applsci 09 03866 g008aApplsci 09 03866 g008b
Figure 9. Conversion instruments.
Applsci 09 03866 g009aApplsci 09 03866 g009b
Figure 10. The displacement response of isolation layer. (a) El Centro earthquake—0.36 g; (b) El Centro earthquake—0.72 g; (c) Taft earthquake—0.36 g; (d) Taft earthquake—0.72 g.
Applsci 09 03866 g010
Figure 11. The peak acceleration (0.36 g). (a) Continuous control; (b) switch control.
Applsci 09 03866 g011
Figure 12. The peak acceleration (0.72 g). (a) Continuous control; (b) switch control.
Applsci 09 03866 g012
Figure 13. The displacement response of isolation layer. (a) El Centro earthquake—0.36 g; (b) El Centro earthquake—0.72 g; (c) Taft earthquake—0.36 g; (d) Taft earthquake—0.72 g.
Applsci 09 03866 g013
Figure 14. MR damper hysteretic curve. (a) El Centro earthquake—0.36 g; (b) El Centro earthquake—0.72 g; (c) Taft earthquake—0.36 g; (d) Taft earthquake—0.72 g.
Applsci 09 03866 g014aApplsci 09 03866 g014b
Figure 15. Input seismic ground motion
Applsci 09 03866 g015
Figure 16. The acceleration response of the top layer.
Applsci 09 03866 g016
Figure 17. The displacement time history of isolation layer.
Applsci 09 03866 g017
Figure 18. MR damper hysteretic curve.
Applsci 09 03866 g018
Figure 19. The structure destruction. (a) the isolation bearing failure; (b) the beam failure of model structure; (c) the bottom column failure of model structure; (d) the overall failure of model structure.
Applsci 09 03866 g019aApplsci 09 03866 g019b
Table 1. The peak interlayer drift under different seismic inputs in continuous control (mm).
Earthquake MagnitudeMax Acc. 0.126 gMax Acc. 0.36 gMax Acc. 0.72 g
Earthquake ground motionEl Centro earthquakeTaft earthquakeTianjin earthquakeEl Centro earthquakeTaft earthquakeTianjin earthquakeEl Centro earthquakeTaft earthquake
Isolation layer1.57 (2.09)1.67 (2.50)3.52 (6.70)3.76 (7.74)6.66 (8.52)28.2 (20.0)11.71 (15.4)14.16 (17.9)
First floor1.041.131.671.362.005.942.863.41
Second floor0.590.620.831.040.864.771.731.60
Third floor0.530.481.020.851.144.161.791.63
Fourth floor0.450.570.710.730.953.851.311.69
Fifth floor0.400.430.830.650.723.191.401.41
Sixth floor0.260.280.450.440.551.310.880.81
Table 2. The peak interlayer drift under different seismic inputs in switch control (mm).
Earthquake MagnitudeMax Acc. 0.126 gMax Acc. 0.36 gMax Acc. 0.72 g
Earthquake ground motionEl Centro earthquakeTaft earthquakeTianjin earthquakeEl Centro earthquakeTaft earthquakeTianjin earthquakeEl Centro earthquakeTaft earthquake
Isolation layer 1.32 (4.40)1.43 (3.02)2.8 (1.29)2.78 (4.31)5.00 (4.20)15.94 (17.5)7.60 (10.88)16.48 (11.1)
First floor0.911.231.51.953.584.623.725.52
Second floor0.570.540.911.291.691.552.392.91
Third floor0.430.620.901.071.982.272.163.18
Fourth floor0.370.340.750.921.422.061.822.52
Fifth floor0.340.320.610.851.502.631.702.82
Sixth floor0.290.280.460.850.841.081.311.69
Table 3. The peak response isolating by the lead rubber bearing (LRB).
El Centro EarthquakeTaft Earthquake
Earthquake MagnitudeMax Acc. 0.36 gMax Acc. 0.72 gMax Acc. 0.72 g
Acceleration response of the shaking table−0.3510.727−0.368
Peak acceleration of 1st layer−0.281−0.596−0.503
Peak acceleration of 5th layer−0.440−0.662−0.662
The 5th layer acceleration amplification factor under LRB isolation1.2540.911.79
The 5th layer acceleration amplification factor under MR isolation0.890.640.69
The LRB isolation layer peak displacement8.3824.1514.36
The MR isolation layer peak displacement3.8015.187.04

