1. Introduction
The demand for secondary batteries is expected to increase rapidly as electric vehicles become more popular [
1,
2,
3]. Lightweight aluminum alloys, which provide sufficient strength, are mainly used to produce housing that protects the battery modules, which is generally located at the bottom of the vehicle.
In the case of conventional aluminum alloys materials, high heat input during fusion welding causes a large degree of welding deformation and residual stress. In addition, the surface of the welding joint is not clean due to the spatter during welding, and the mechanical properties of the weld deteriorate compared to the base metal. High-temperature cracks often occur in the weld due to the segregation of alloying elements or the low-melting temperature inclusions in the grain boundaries. Such high-temperature cracks are divided into solidification cracks and liquefaction cracks. Solidification cracks are caused by the tensile stress due to shrinkage or external factors during solidification at low temperatures within the solidification temperature range when the weld metal solidifies. Liquefaction cracks occur due to shrinkage when the intergranular area is locally melted and solidified by heating the heat affected zone to a high temperature. Porosity is also a significant problem with fusion welding aluminum compared to other metal materials. The pores are caused by the dissolution of gas into the weld metal during welding, the release of gas in the solidification process, the gas generated by the chemical reaction in the molten metal during cooling, and the release of gas due to the decrease of solubility. The purpose of this study is to solve the problems of arc welding by applying friction stir welding (FSW), which minimizes welding deformation and provides high weld quality when welding thin nonferrous metal plates, in order to produce high-quality battery housings.
Figure 1 shows the welding deformations of arc welding and FSW tested by Hitachi, in which FSW shows a deformation on tenth that of arc welding [
4].
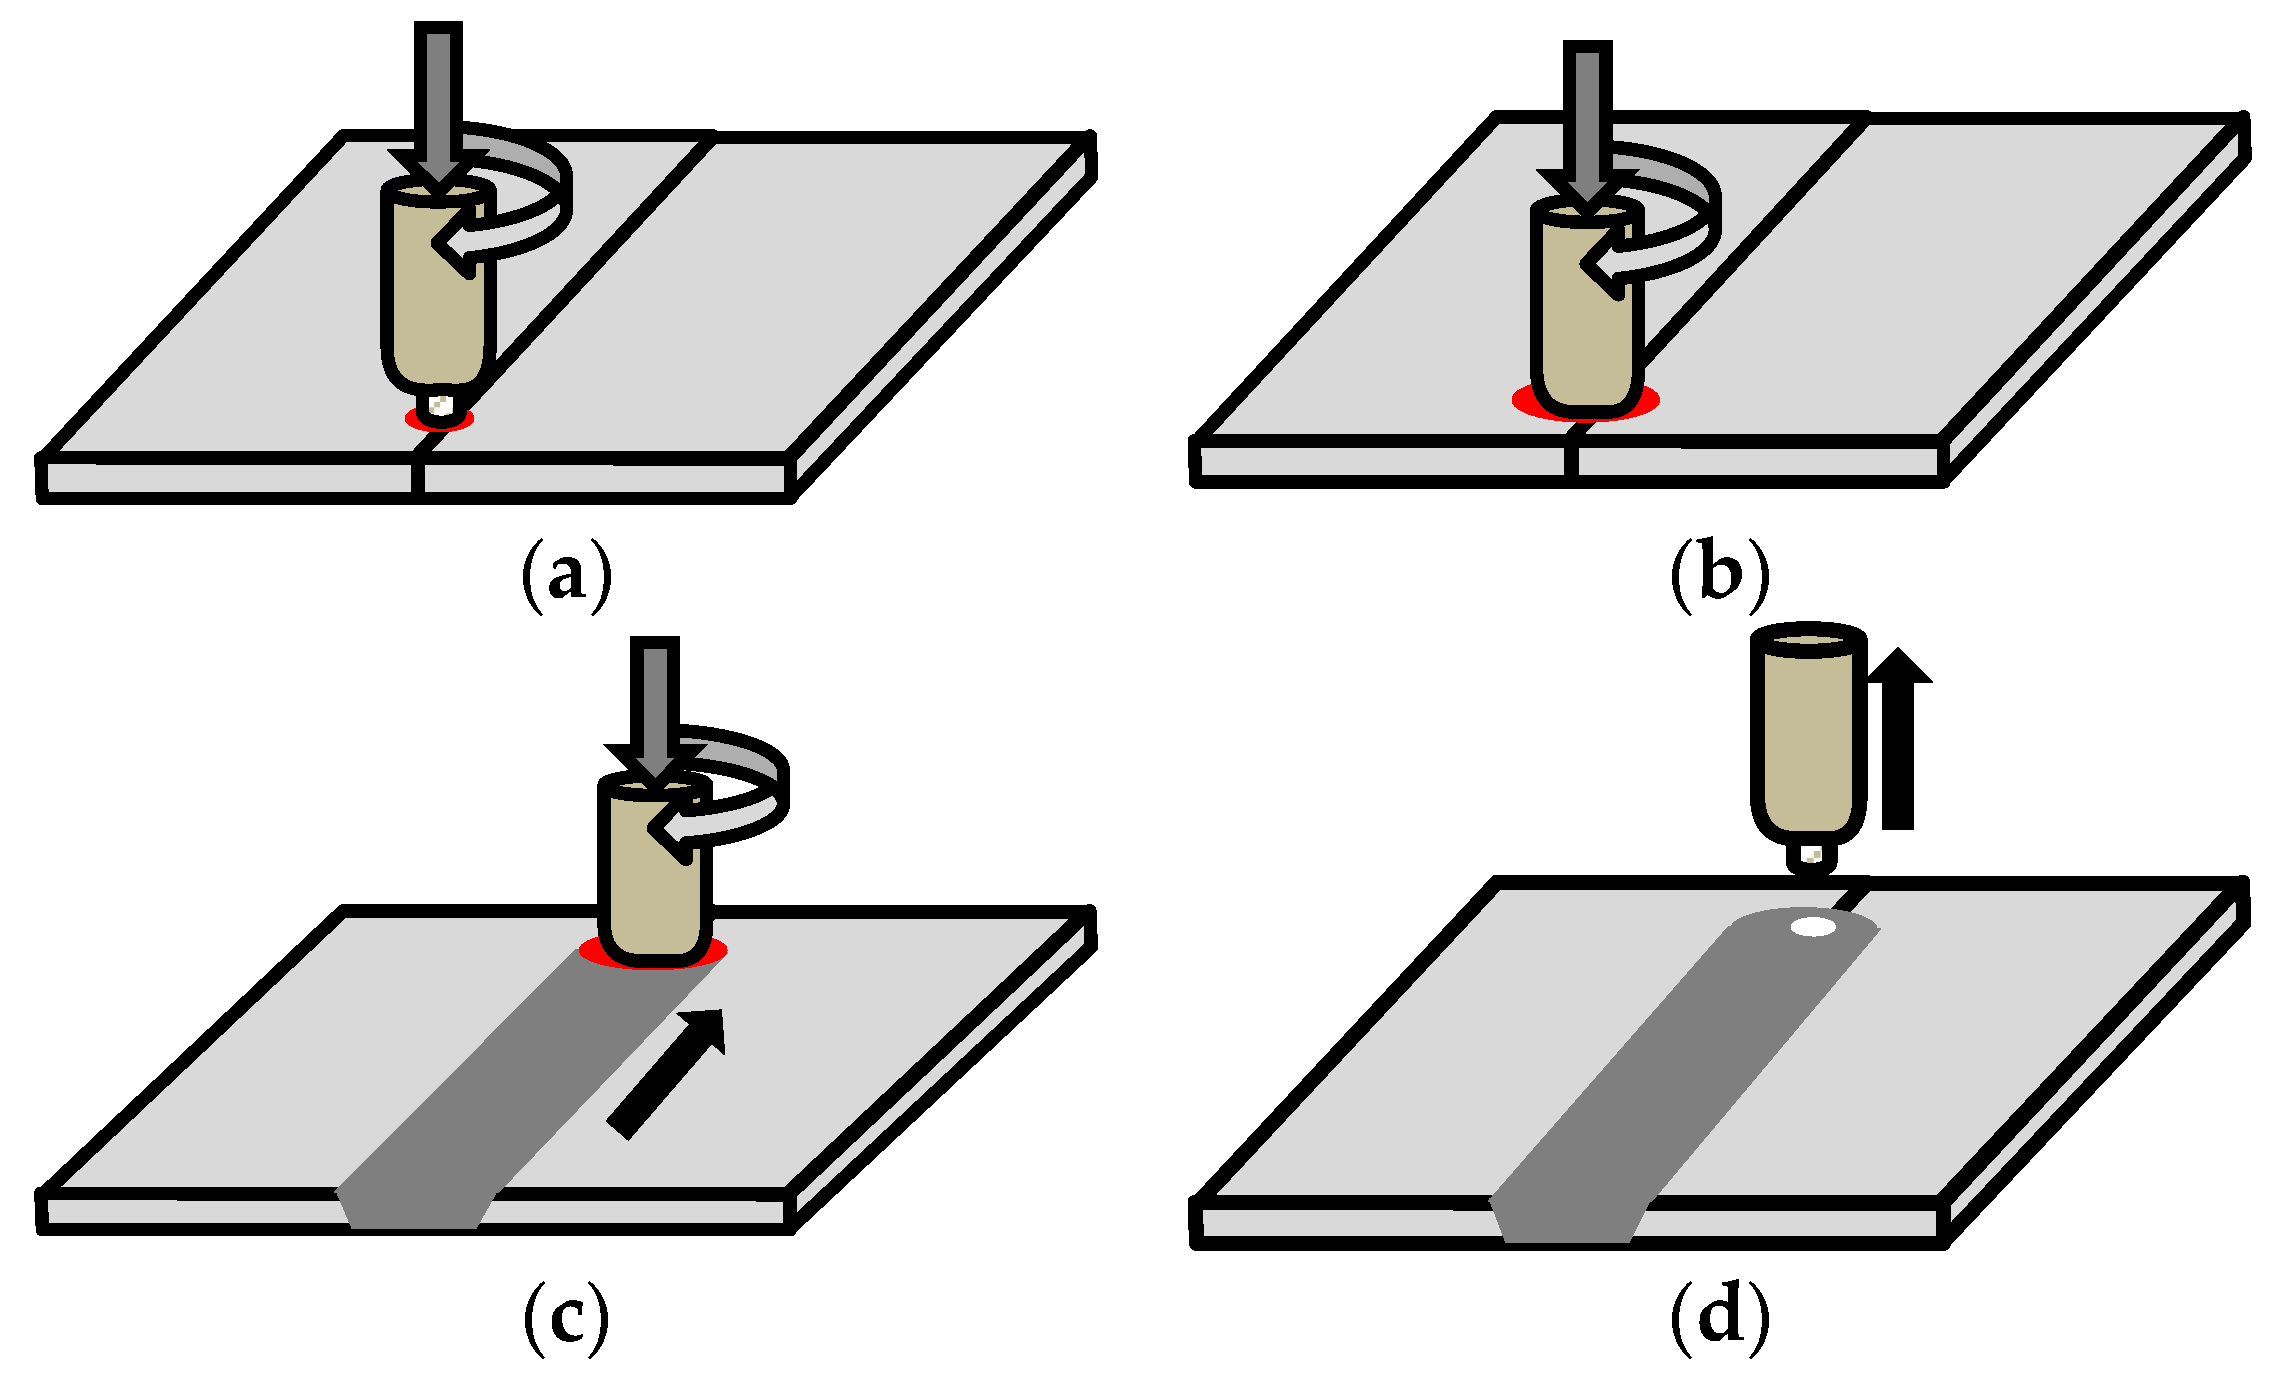
Developed by TWI (The Welding Institute) in 1991, FSW is a solid-state joining process which does not apply greater heat than the melting point to the base metal. The operating principle of FSW is shown in
Figure 2. A cylindrical tool—made of rigid material with a profiled probe—rotating at a high speed, is inserted into the joint of the workpiece. The welding region is softened by using the mutual frictional heat between the rotating tool and the workpiece, and the stir zone is formed with the forced plastic flow by the tool’s rotation.
The advantages of FSW include the following. The process does not generate hazardous substances, such as toxic fumes or hazardous rays during the work, and the work environment is good because there is little noise. FSW consumes less power and does not require welding rods, flux, and shielding gas. In addition, the welds are free from pores or cracks, which are likely to occur when using conventional fusion welding methods. FSW can be easily automated and maintains uniform quality because it does not rely on the proficiency and skills of the worker. The welding deformation is small and the dimensional precision is high because there is little thermal effect on the base metal. In addition, it is easier to bond dissimilar materials, and the mechanical strength of the weld is 90% of the base metal, which is higher than the 80% of conventional TIG welding [
5,
6,
7,
8]. Stationary shoulder friction stir welding technology can improve the weld surface quality and minimize the reduction of cross-section [
9]. Due to such advantages, FSW is being applied to various industrial fields (aerospace, automobile, railroading, shipbuilding, etc.) and a wide variety of research is being performed.
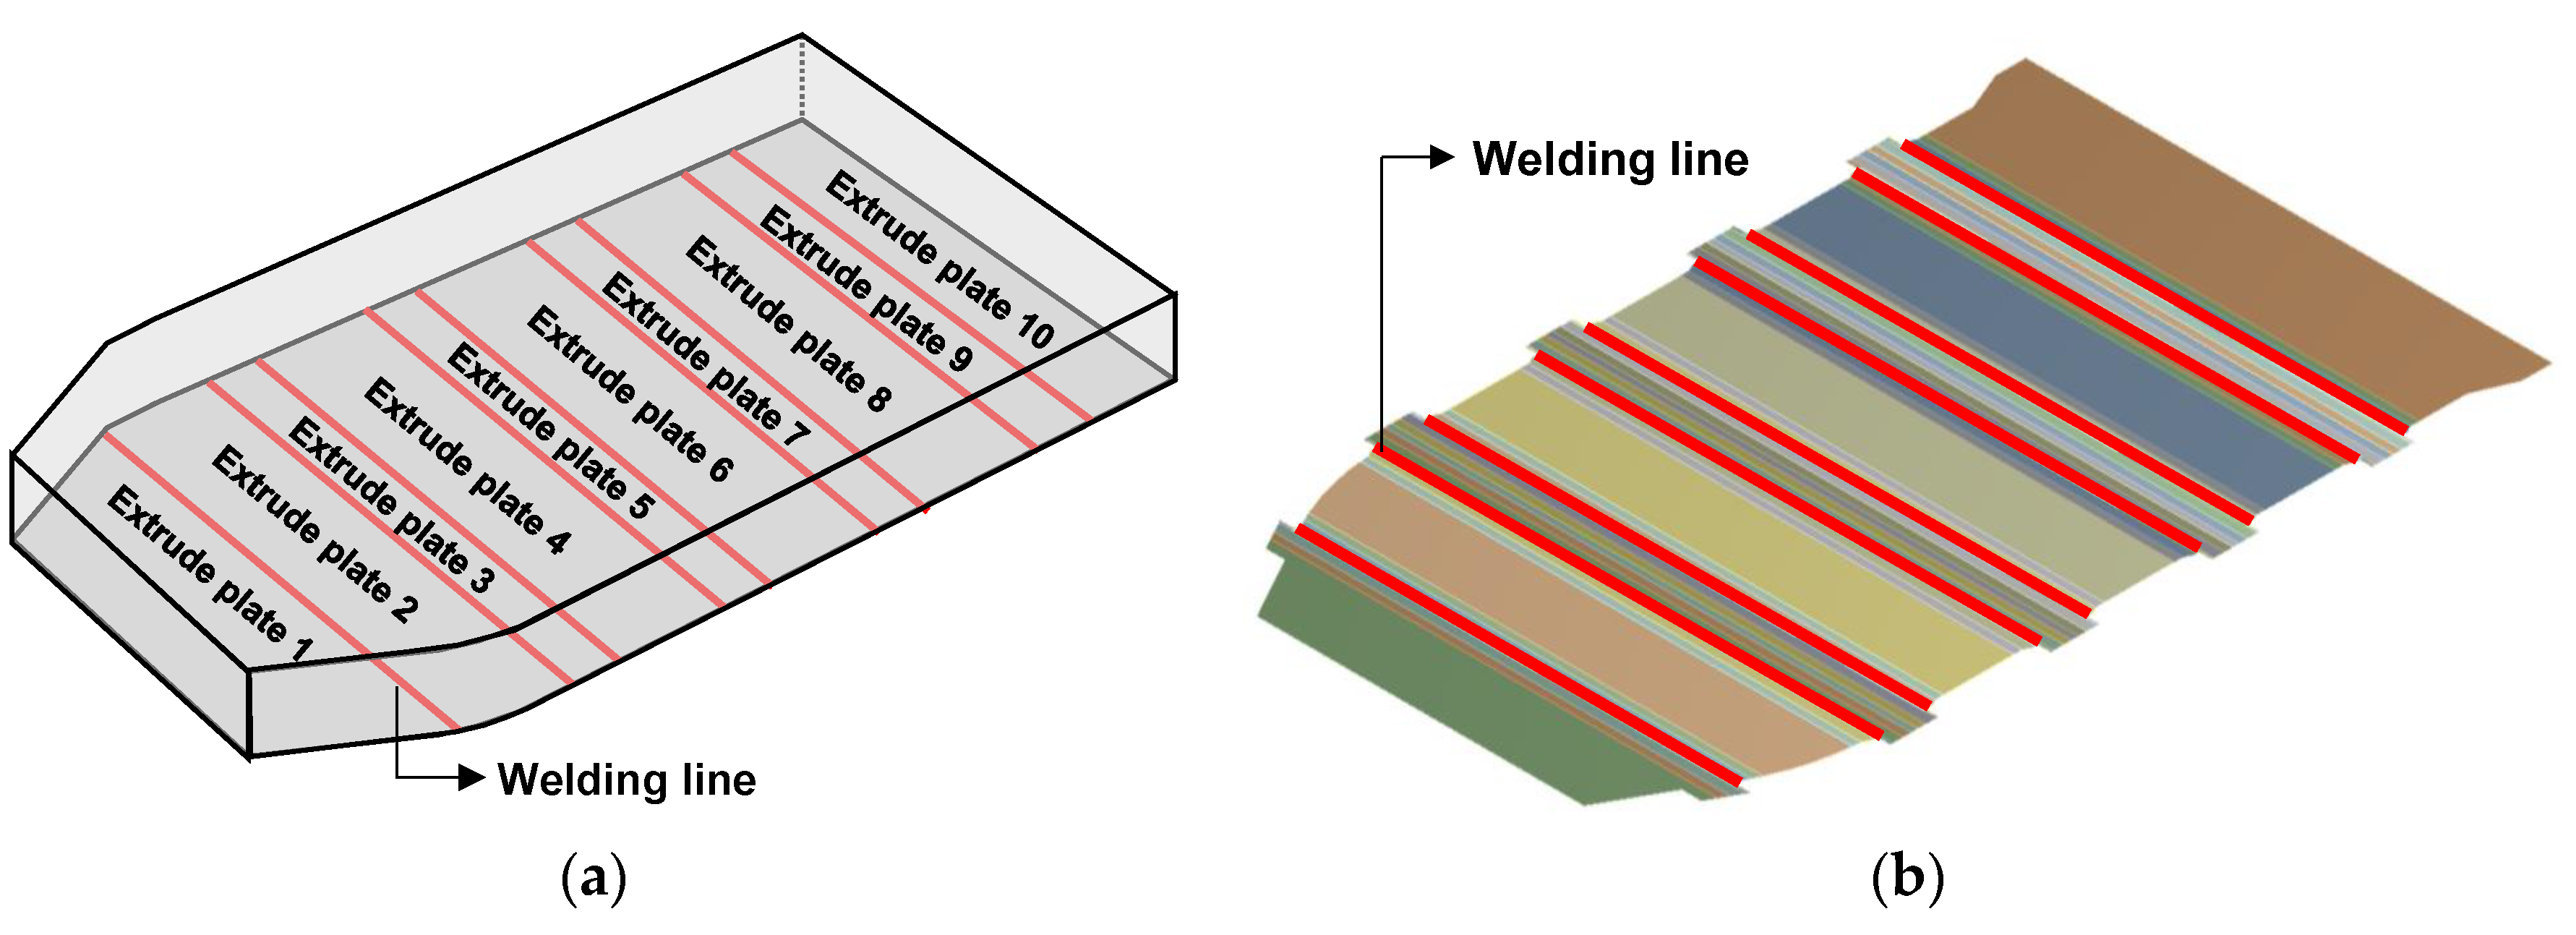
One of the great advantages of FSW is automation, as mentioned above. In reality, industrial sites have multiple welding lines and this process can be automated using FSW. The welding deformation of FSW is small compared to conventional fusion welding, but that does not mean that there is no welding deformation. In general, welding deformation modes that occur during fusion welding include transverse shrinkage, longitudinal shrinkage, rotational distortion, angular distortion, bending, and buckling [
10]. For the FSW of thin plates, there is hardly any temperature gradient at the upper surface in contact with the tool shoulder and at the bottom surface near the end of the tool pin, because of the thin thickness and the heat transfer to the bottom by the tool pin during welding [
11]. Therefore, the welding deformation mode of transverse shrinkage occurs in FSW. In the FSW automation process, the transverse shrinkage must be considered to correct the welding deformation from the previous step in the next step.
Figure 3 shows a section view of the transverse shrinkage problem, which occurs in actual FSW automation processes. In Step 1, the tool is initially set in the middle of Structures A and B, so there are no problems during the welding process. After the welding is finished in Step 1, we move on to Step 2. At this point, Structure C moves z mm to the position of Structure B, and the tool moves b mm, which is the width of Structure B. However, as shown in the Step 2, a gap occurs between Structures B and C, to be processed in Step 2, due to the welding deformation in Step 1. As a result, the position of the tool is also located on the left side of Structure C. The FSW gap becomes larger as the steps increase. In addition, the gap may not be joined after welding, and even if it is joined, the mechanical property values at the joint will be significantly reduced, thus having a great influence on the quality [
12,
13,
14]. This study calculated the transverse shrinkage for each step of welding for a 2.5 mm thick aluminum battery housing structure with nine welding lines. The structures and tools of each step were placed in the correct positions by reflecting the calculated welding deformation. Eventually, we could solve the quality issues that may occur during welding.
In this study, thermal and structural analyses of the local thermomechanical model and real size aluminum battery housing model were performed using ANSYS Workbench.
3. Calculating the Inherent Value under an Actual Welding Process Using a Local Thermomechanical Model
3.1. Inherent Strain Method
The thermal elasto-plastic analysis method can simulate the actual welding process, so the welding deformation and residual stress results of this method are known to be most similar to actual test results. Thermal elasto-plastic analysis calculates the distribution of temperature over time by analyzing the heat transfer according to the actual welding process. After applying the calculated temperature distribution into the structural analysis model as the thermal load, the structural boundary conditions by the welding jig are assigned to perform the analysis. Therefore, the numerical results are most similar to the experimental results, but the process takes a long period of time. This analysis method is the most suitable for test pieces, but is not suitable for actual-size structures because it requires a huge computational analysis time. Therefore, the inherent strain method was proposed to overcome those drawbacks.
The total strain (ε) is usually expressed as the sum of elastic strain (εe), plastic strain (εp), thermal strain (εth), and phase transformation strain (εpt), as shown in Equation (1). Permanent deformation occurs when an external force is applied to a structure, so long as the structure does not return to its original state after removing that force. Such permanent deformation is caused by permanent strain, and corresponds to plastic strain, thermal strain, and phase transformation strain. That is, subtracting the elastic strain from the total strain results in the permanent strain, as shown in Equation (2), which is defined as the inherent strain (ε*). In general, permanent deformation caused by welding includes thermal strain caused by the heat input during welding, the plastic strain caused by fixing the structure with the jig, and phase transformation strain caused by melting and solidifying the weld. However, phase transformation strain does not occur in FSW, which is a solid-state welding process. That is, the inherent strain in FSW is expressed as the sum of plastic strain and thermal strain.
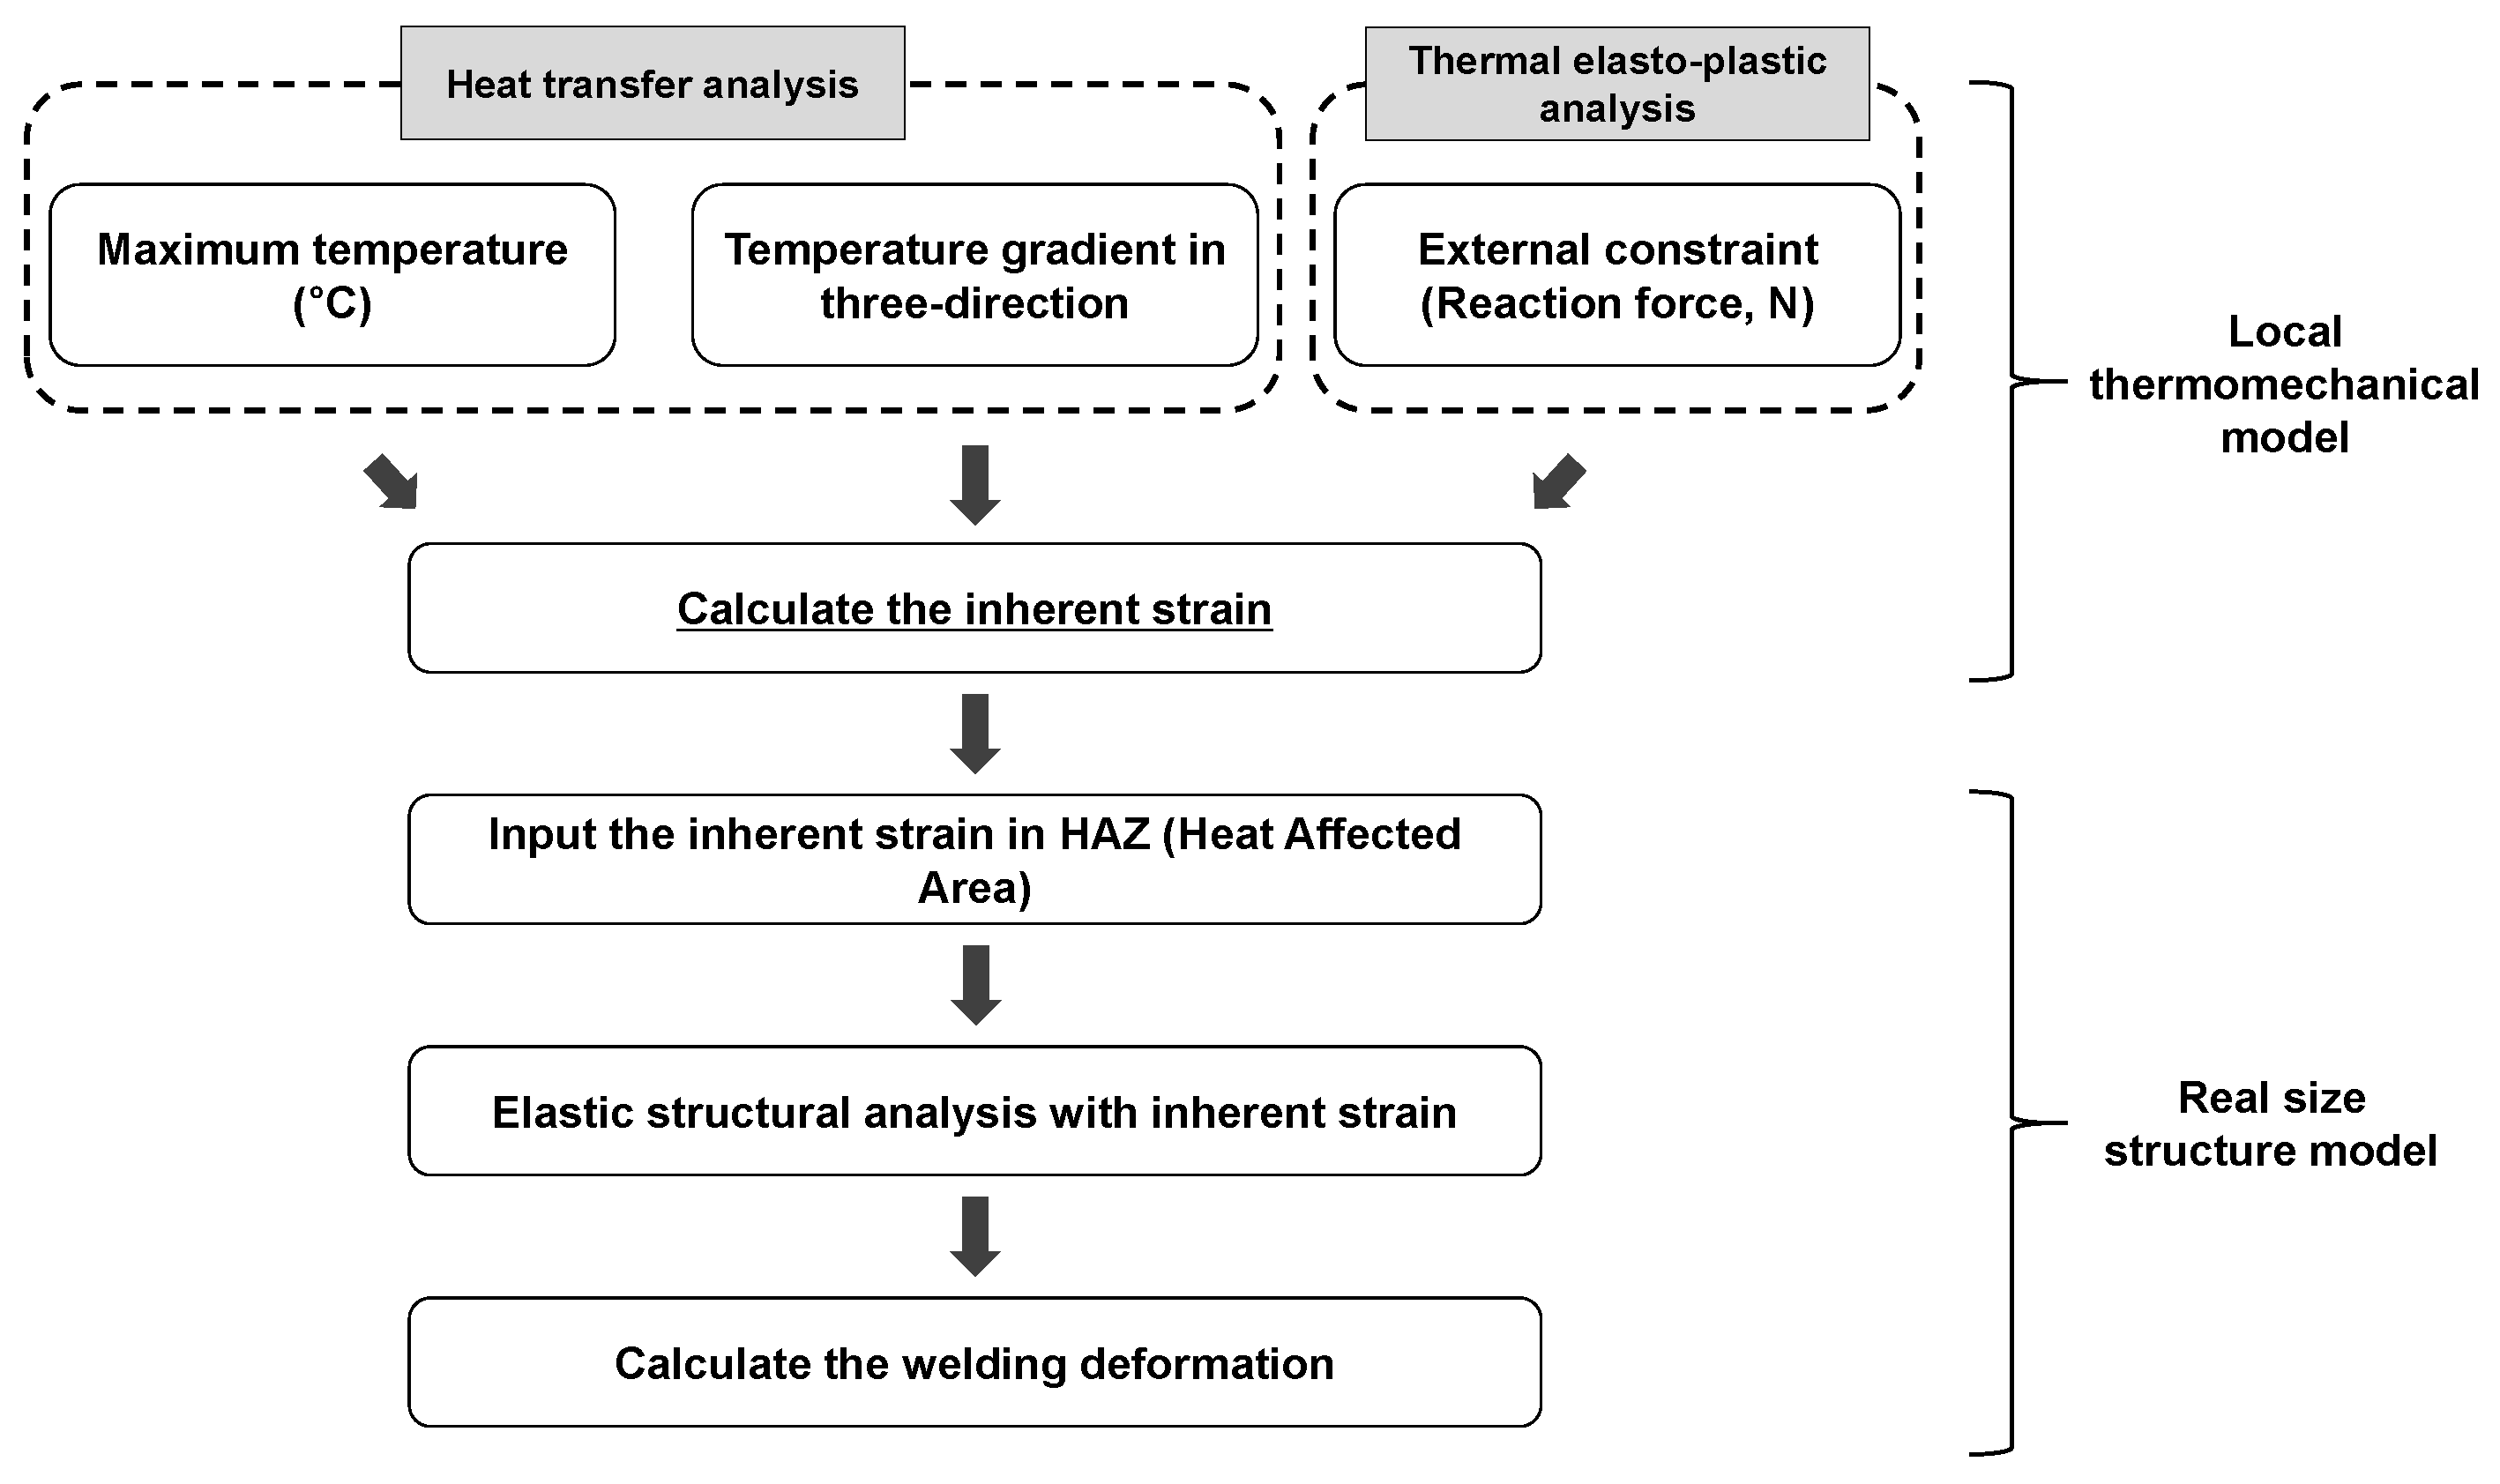
The inherent strain method calculates the final inherent strain remaining in a structure after welding according to the welding process conditions. Then, it calculates the final strain and residual stress of the structure by performing an elastic analysis, inputting the inherent strain value into a finite element (FE) model.
In the case of FSW, unlike manual welding, automatic welding is performed under certain process conditions until the tool enters and exits. Thus, the temperature distribution is assumed as quasi-stationarity during the FSW process, and the welding deformation and residual stress values are repeatedly distributed according to the direction of the welding line. These results can be confirmed in the research of Kang et al. [
15]. This means that the inherent strain value is also repeatedly distributed along the direction of the welding line. In that respect, it is easy to apply the inherent strain method to FSW. Therefore, if the inherent strain value can be calculated in a reasonable manner according to the welding process condition, we can significantly reduce the analysis time compared to the thermal elasto-plastic analysis method and obtain numerical results similar to experimental results.
The inherent strain method was proposed according to the following background. Many welding processes are carried out in the shipbuilding industry; and the piece assembly, sub-block assembly, and block assembly are performed to assemble the initial hull structure. As a result of the welding deformation during each stage of assembly, the structure differs from the initial design due to multiple assembly tolerances. The welding deformation calculation using thermal elasto-plastic analysis requires an excessively long analysis time; the inherent strain method was developed to solve this issue. The equivalent loading method based on inherent strain was initially developed; this method calculates the shrinkage force and the moment, which causes the deformation of the structure, considering the area of the heat affected zone, and then replaces them with equivalent loads to calculate the deformation of the structure [
16,
17,
18,
19]. However, the problem of the equivalent loading method is that compressive residual stress occurs on the welds because the shrinkage force is applied as load. When heat is applied, actual welds are subject to shrinkage because thermal expansion is suppressed by the surrounding structures and constraints. On the contrary, when the welds are cooled to room temperature after welding, they are subject to tensile force because thermal shrinkage is suppressed by the surrounding structures and constraints. Due to this mechanism, tensile residual stress ultimately remains in the weld. The equivalent strain method based on inherent strain has been proposed to implement such a mechanism and has been used by various researchers to study welding characteristics [
20,
21].
3.2. Factors Determining the Inherent Strain Value
The factors that affect inherent strain value in FSW include the maximum temperature during welding, the temperature gradient in the vertical direction of welding line, and the size of the reaction force received by the weld according to the position of the jig that restrains the structure during welding.
The three dimensional solid-spring model proposed by Kim et al. was used to calculate the inherent strain value [
20]. This model can calculate the inherent strain value considering the maximum temperature, temperature gradient, and reaction force.
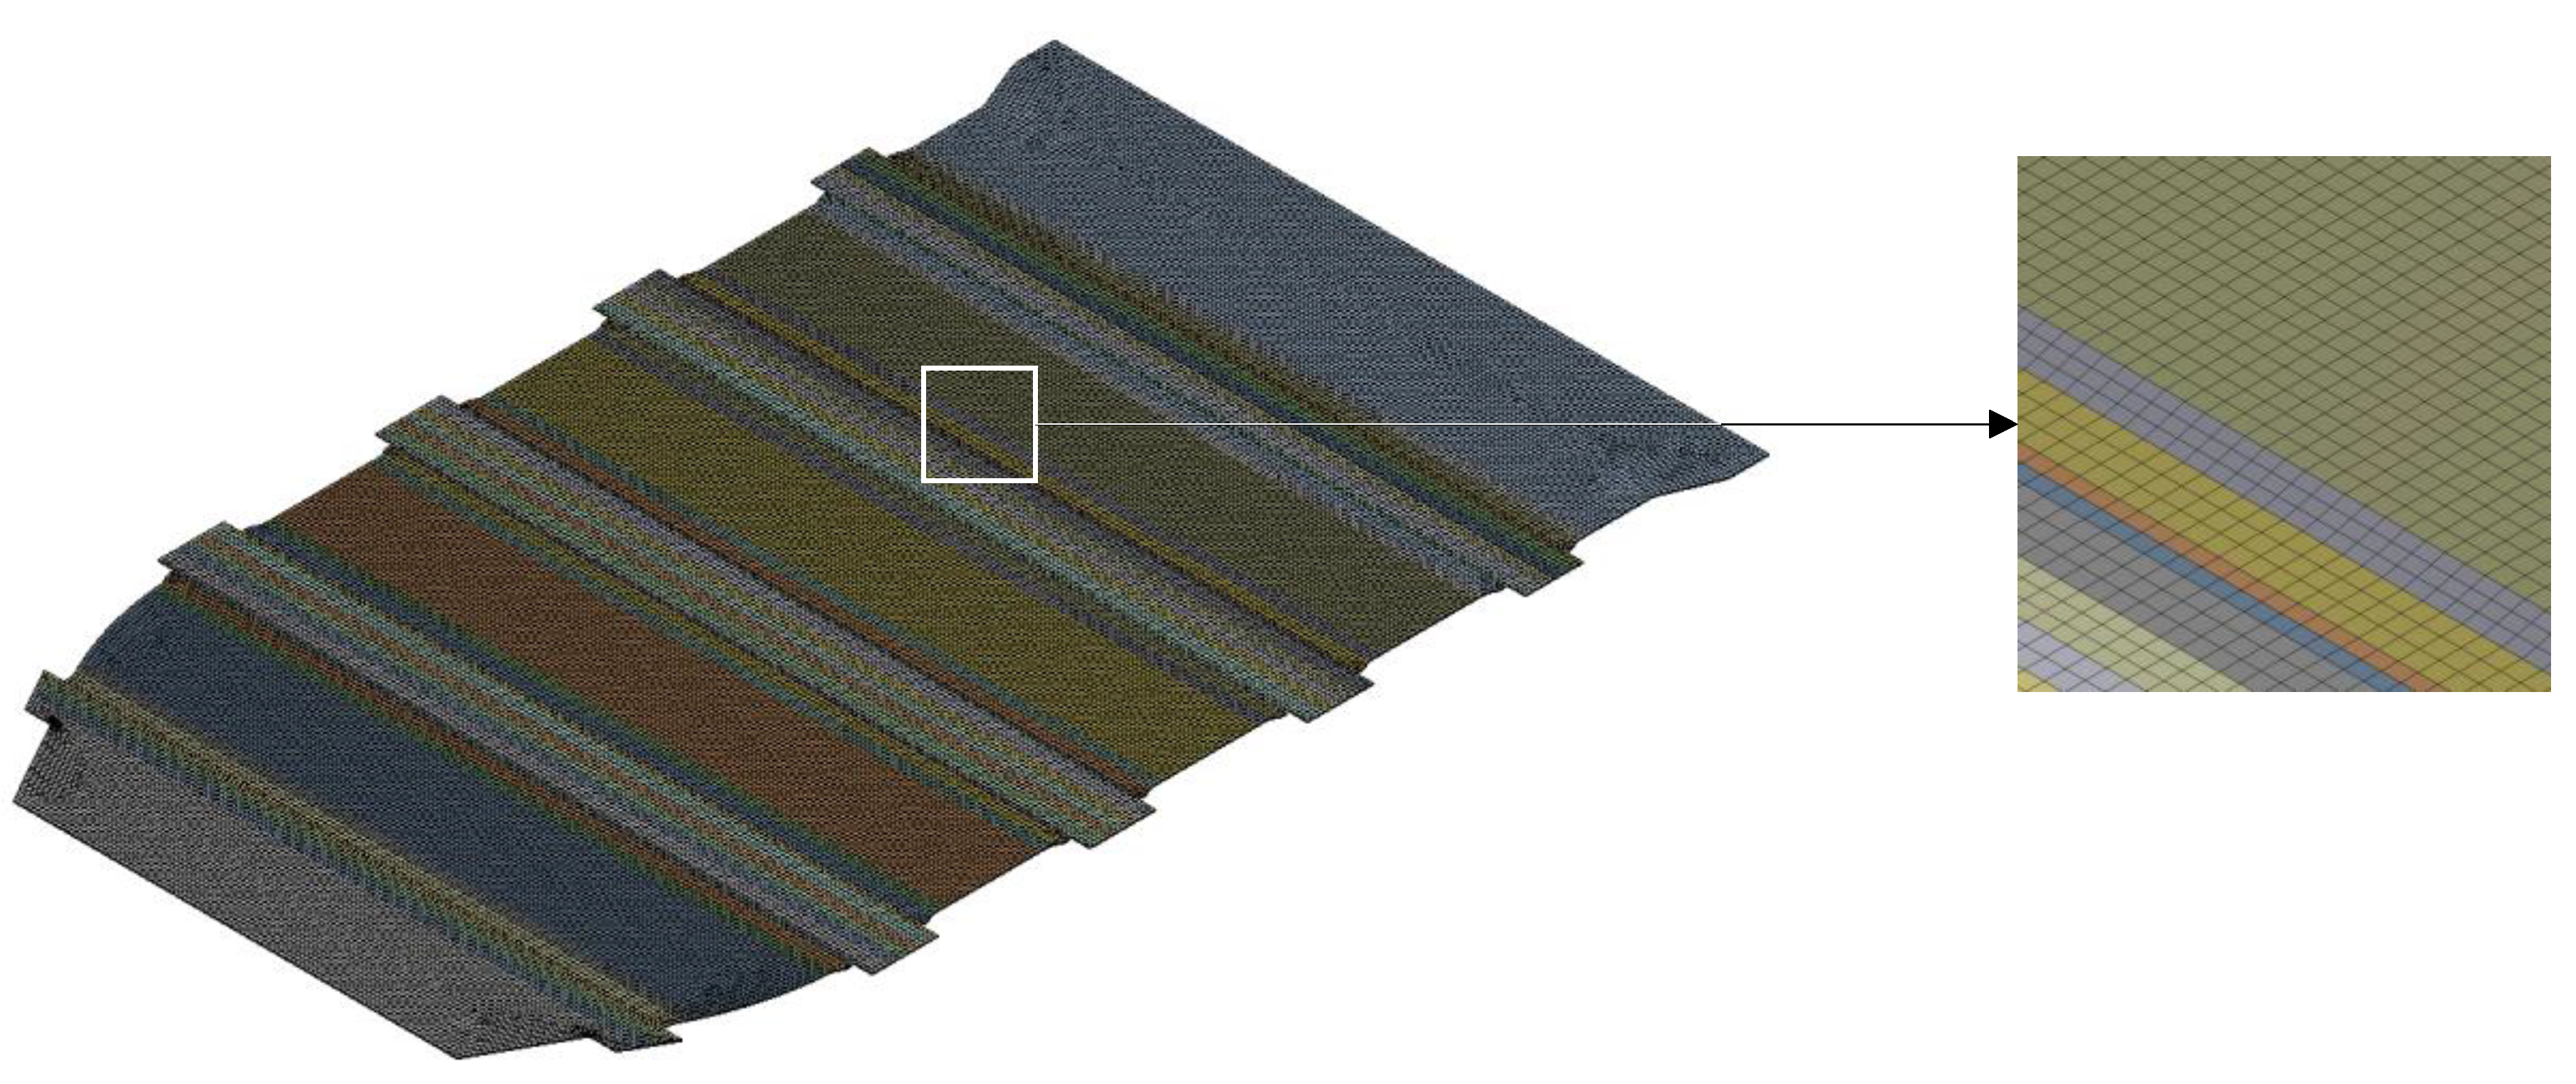
Figure 7 shows the process of calculating the final welding deformation of a structure using the inherent strain value.
3.3. Heat Transfer Analysis Using the Local Thermomechanical Model
A heat transfer analysis was performed to calculate the maximum temperature and the temperature gradient in the vertical direction of the welding line during welding, which affect the inherent strain value. First, we used the equivalent heat source equation by Reynolds et al., which considers the bottom of the tool shoulder, lateral of the tool pin, and the bottom of the tool pin, to analyze the heat transfer, as shown in Equation (3) below [
22]. We assumed that the bottom surface of the shoulder was flat and the tool pin had a cylindrical shape, in order to simplify the heat source calculation in the analysis.
where η is the welding efficiency, ω is the rotation speed, τ is the shear stress, R
s is the radius of the shoulder, R
p is the radius of the pin, and H
p is the height of the pin. Under the full sliding condition, the shear stress on the surface of the workpiece is expressed as
where μ is the friction coefficient, P is the normal pressure, and F
N is the downward force.
The welding efficiency and the friction coefficient in Equations (3) and (4) are calculated through the actual experiment. The welding efficiency can be defined as a single value according to the process, but the friction coefficient cannot be expressed as a single value because it changes according to temperature [
5]. This study performed a heat transfer analysis under the welding conditions of a 2000 RPM rotation speed and a 1000 mm/min traveling speed, which were derived as the optimum conditions from the previous experiment. In addition, the welding efficiency and friction coefficient values were determined, after correction, based on the temperature data collected through the experiment. In order to analyze the FSW heat transfer, we prepared a calculation flow chart, as shown in
Figure 8, to calculate the temperature distribution during welding. This process is necessary to calculate the maximum temperature and the temperature gradient in the vertical direction of the welding line in order to obtain the inherent strain value.
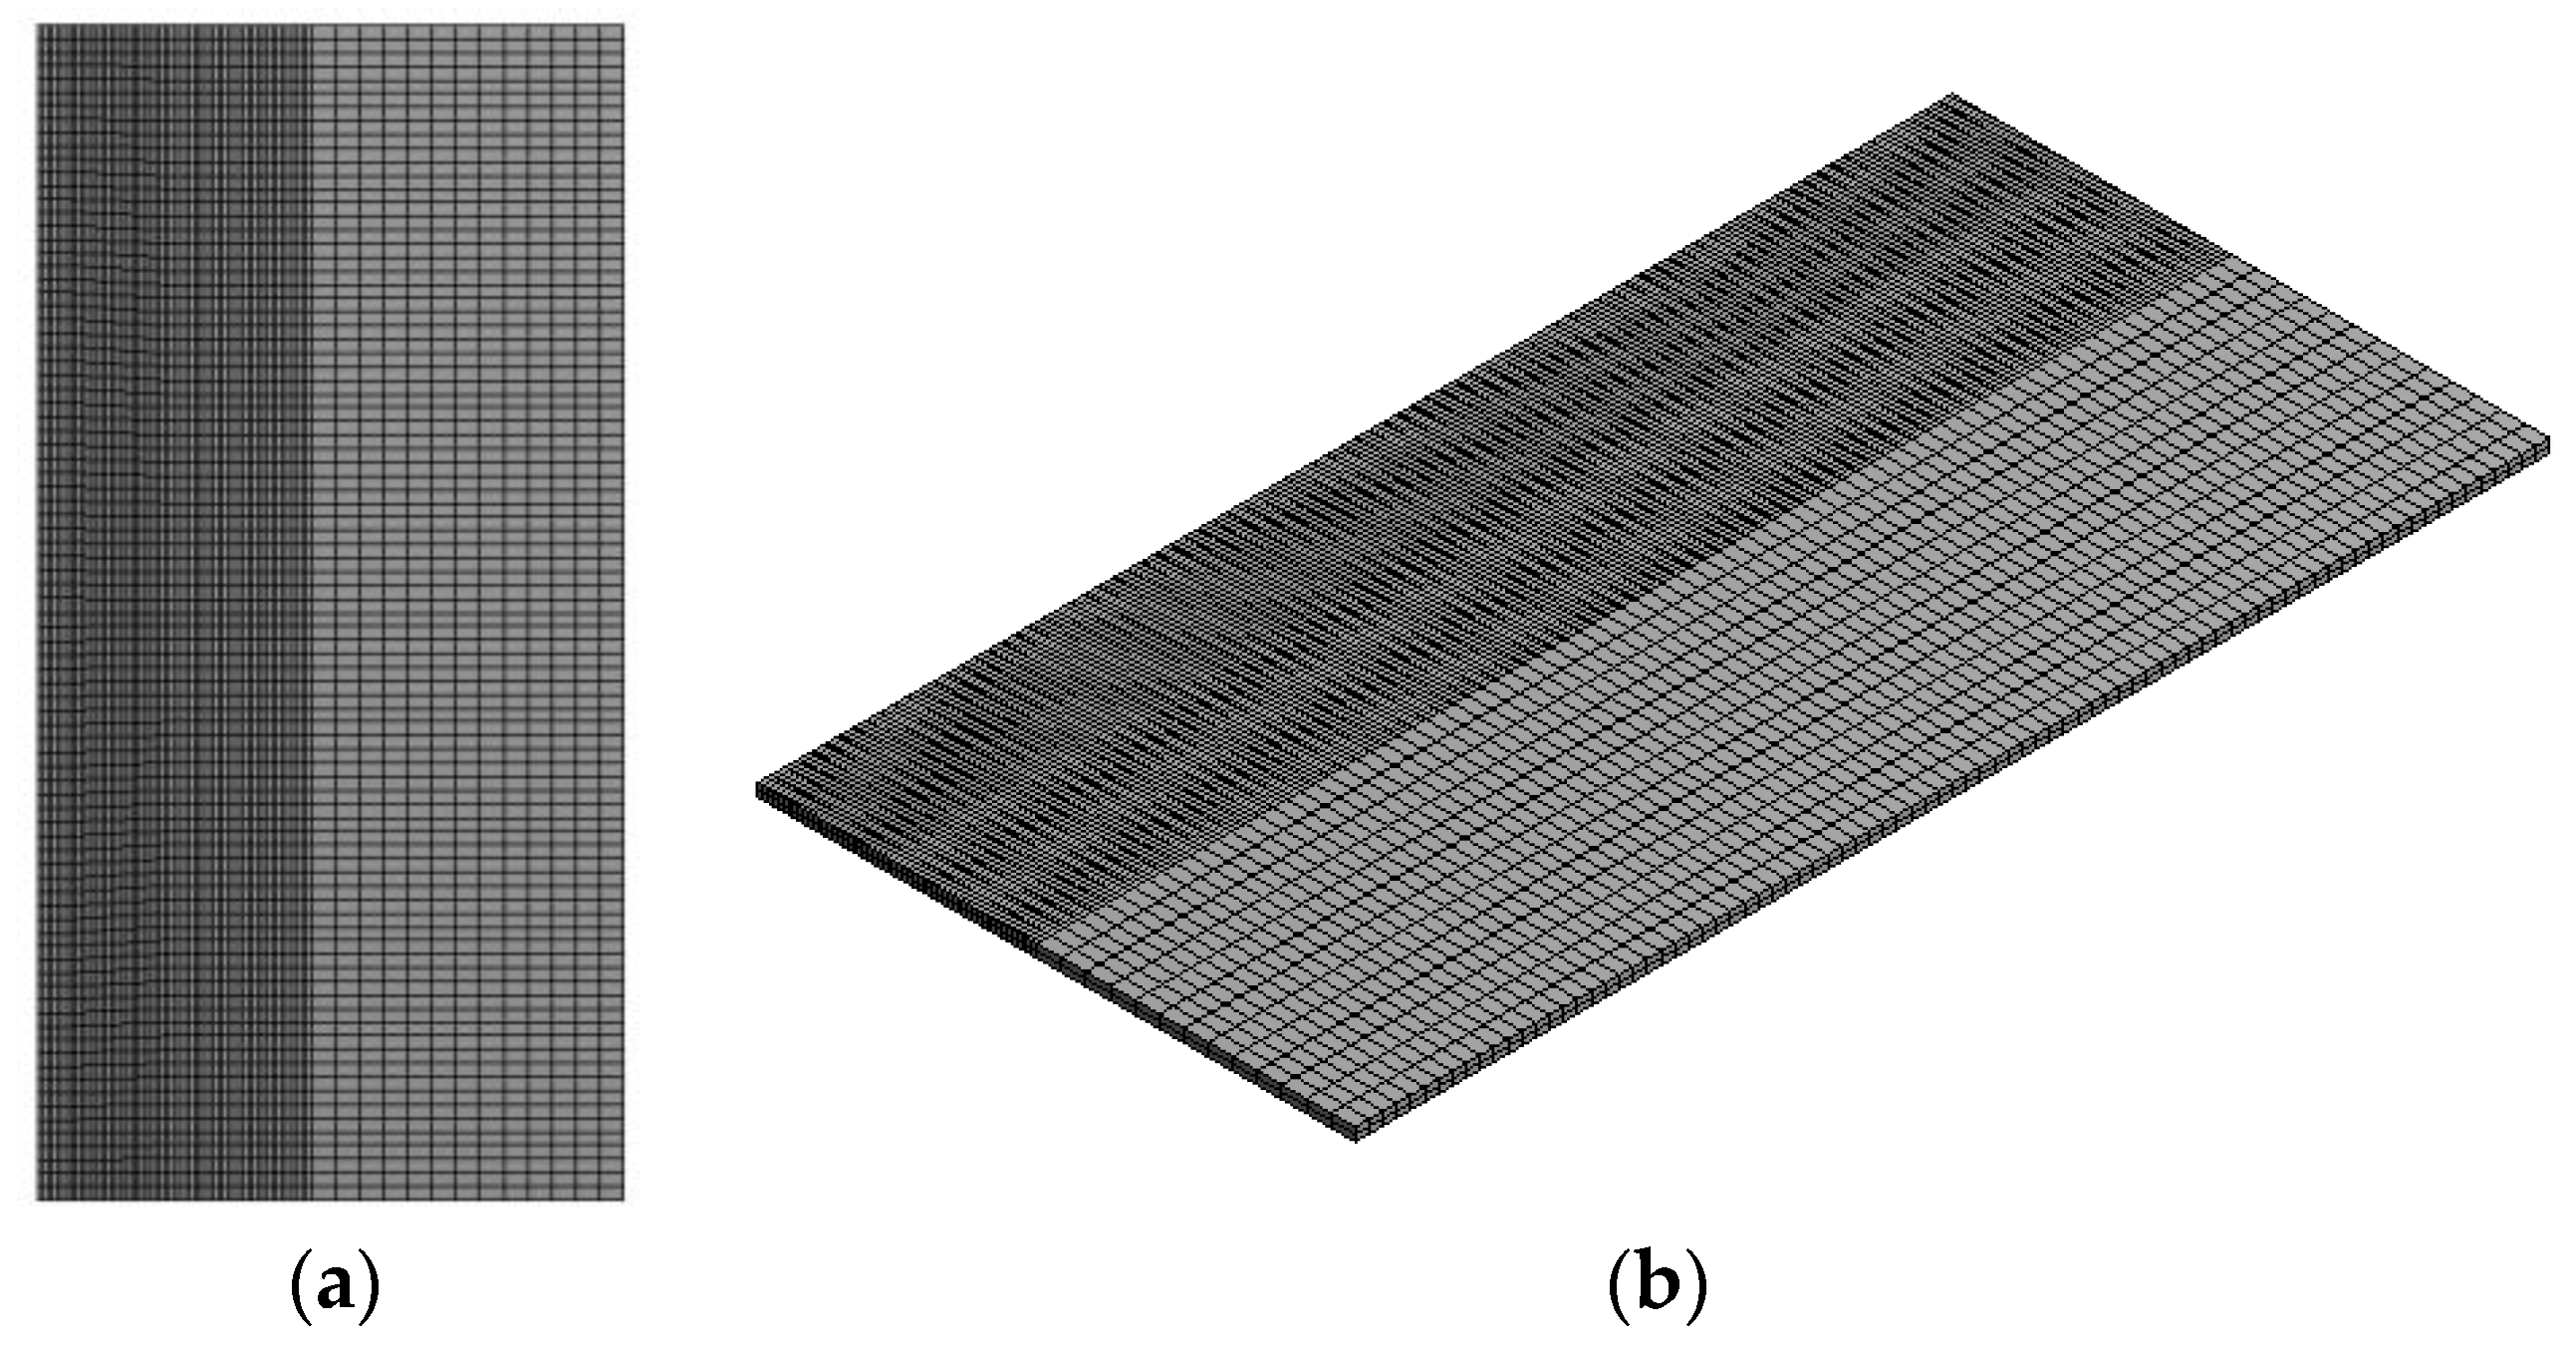
The local thermomechanical model on simplified geometry, from which it extracts the inherent strain to be used in the subsequent FE model, is shown in
Figure 9. Provided that the temperature difference between the advancing side and the retreating side is about 10% in the results of the conventional heat flow analysis that considers bilateral asymmetry, we simplified the local thermomechanical model by assuming bilateral symmetry for the analysis. Since the size of the actual structure is large, it is reasonable to perform the analysis using the results of the advancing side. In addition, we used the values in
Figure 10 as the density, specific heat, and thermal conductivity, which are temperature-dependent material properties for heat transfer analysis.
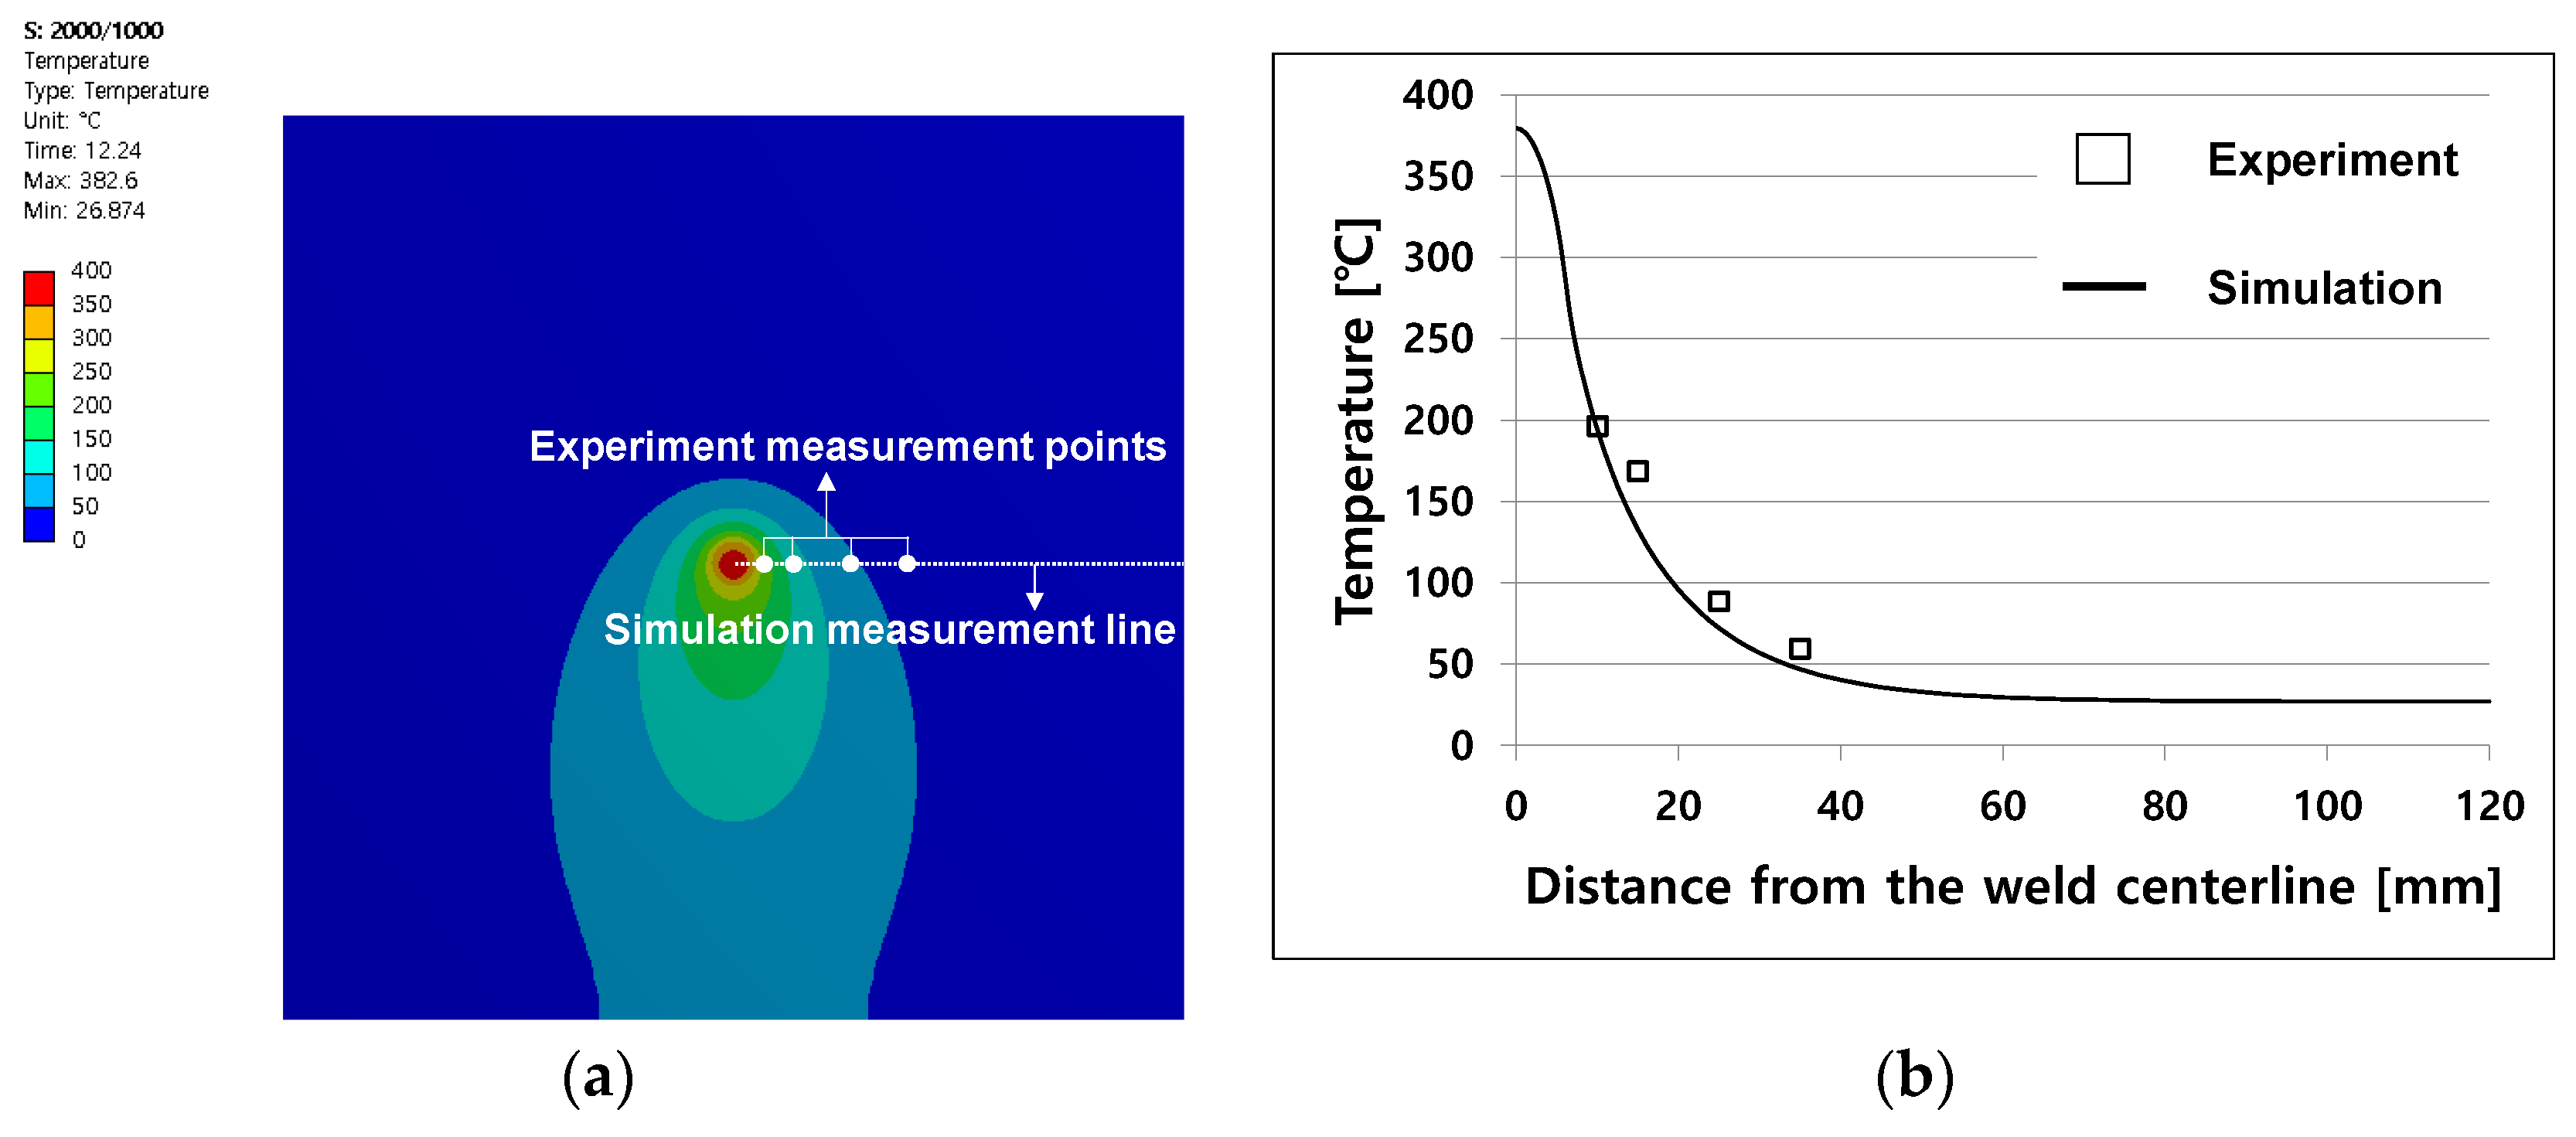
Figure 11 compares the experimental results with the numerical results.
Figure 11a shows the temperature distribution when the heat transfer analysis is located in the center of the test piece.
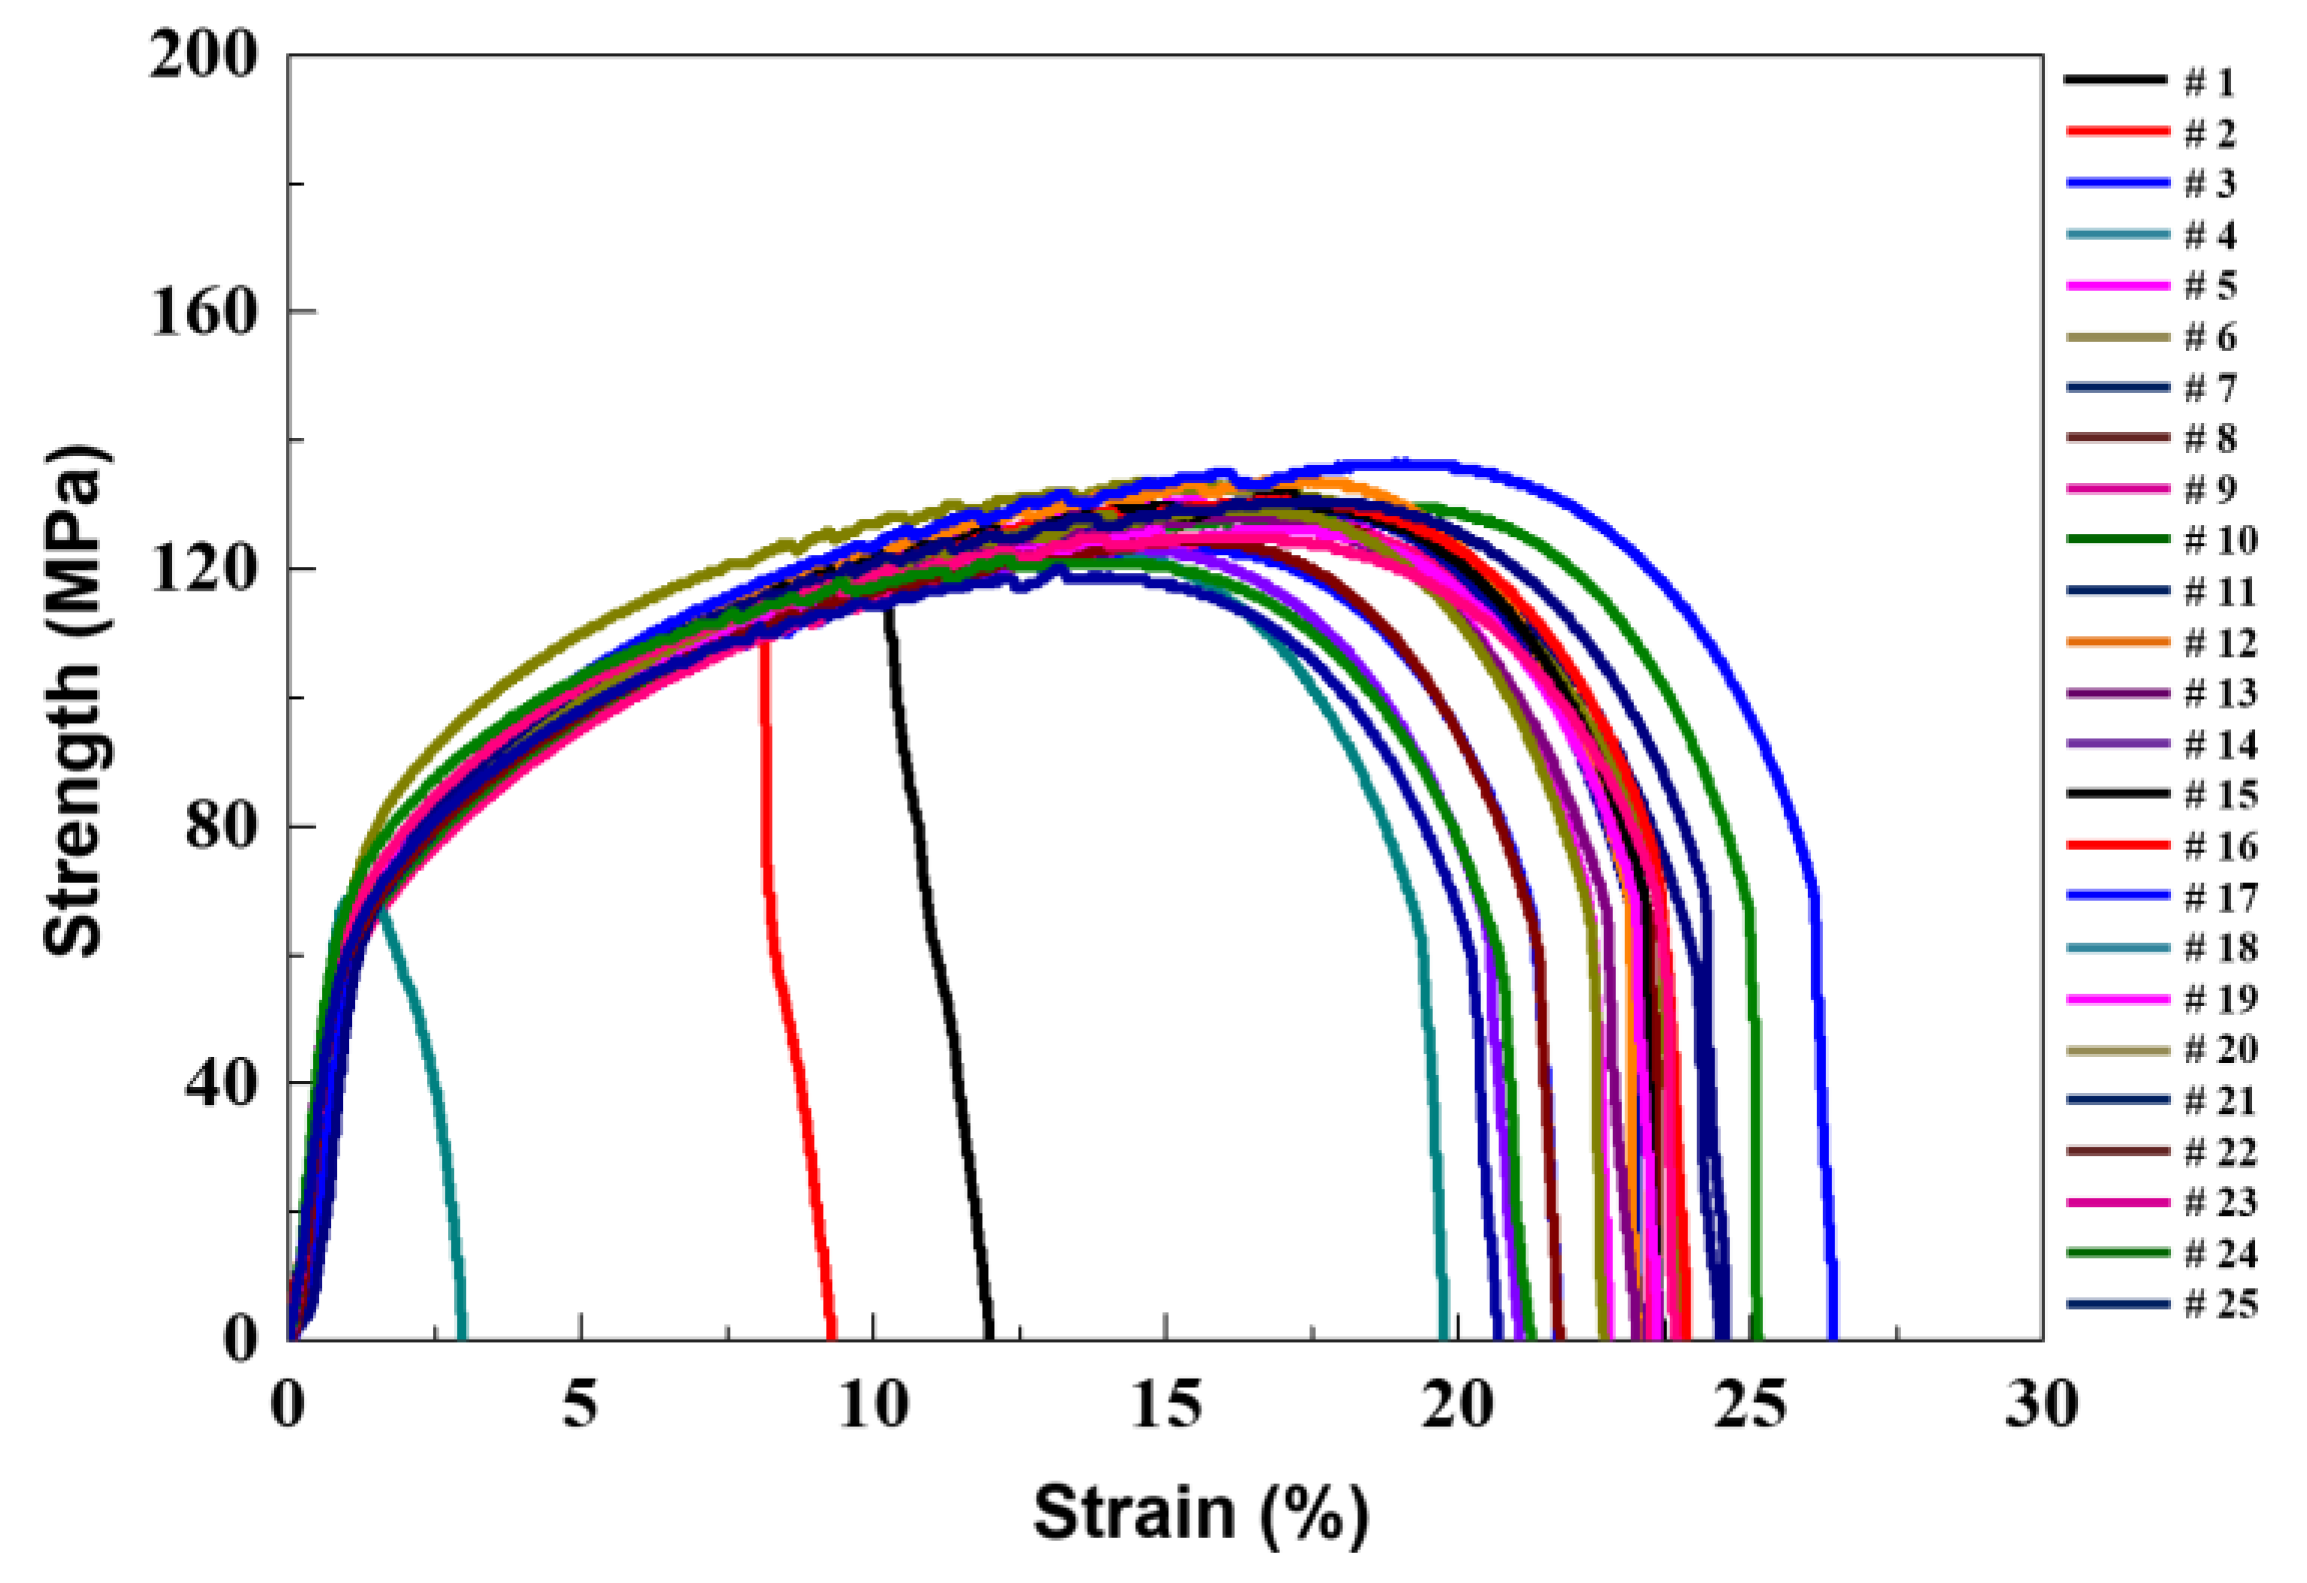
Figure 11b shows the temperature distribution in the vertical direction of the welding line in the FE model, which is compared with the experimental results. The experiment was performed once for 25 welding process conditions and the box marking in
Figure 11b shows the experimental results. We confirmed that both results were similar.
Based on the results of heat transfer analysis in
Figure 11, we can calculate the maximum temperature and the temperature gradient, which are factors that affect the inherent strain. We can calculate the temperature gradient, as shown in Equation (5) below, considering that the maximum temperature reached 383 °C and the temperature of the heat affected zone of aluminum in FSW was about 300 °C [
11].
The temperature gradient calculated using the equation above is 0.78.
3.4. Thermal Elasto-Plastic Analysis Using the Local Thermomechanical Model
We can calculate the reaction force at the constraint region of the structure by performing a thermal elasto-plastic analysis, using the above heat transfer analysis model. It is necessary to apply the exact constraint position of the actual structure to the local thermomechanical model, because the reaction force changes depending on the constraint position of the structure. The constraint position of the actual structure was also considered in the local thermomechanical model, as shown in
Figure 12 below.
As shown in
Figure 12, the model is symmetrical based on the welding line. The length of the heat input region in the model above is 6 mm, since the diameter of the tool shoulder is 12 mm. A 20 mm wide constraint region is located 30.5 mm from the end of the heat input region. Since this region is fixed using jigs during the actual FSW process, the FE model was configured to fix six degrees of freedom. The structural analysis was performed by entering the temperature distribution over time, calculated through the heat transfer analysis as the thermal load. As in the heat transfer analysis, the temperature-dependent material properties in
Figure 13 were used for the structural analysis.
As a result of calculating the reaction force in the structural analysis under the given welding conditions, the value was 855 N. We performed the heat transfer analysis and the thermal elasto-plastic analysis above to calculate the maximum temperature, temperature gradient, and reaction force, which are factors that affect the inherent strain. The inherent strain was calculated under the conditions of 2000 RPM rotation speed and 1000 mm/min traveling speed using the 3D solid spring model proposed by Kim et al. [
20]. The inherent strain value under the conditions above was calculated to be −7.875 × 10
-3.
5. Conclusions
Currently, welding technology is actively applied in most industries except the aerospace industry. In particular, the proportion of welding is quite high in the shipbuilding industry. In other industries as well, the application of new welding technology is increasing due to the desire to overcome the disadvantages of existing welding technology, thus the development of new welding technology is being pursued. In addition, the application of welding automation technology is increasing. Failure to properly predict the welding deformation in each process can lead to problems not only in product quality but also in the process. Therefore, welding deformation must be predicted and reflected in the process. Analysis using the inherent strain method, before performing expensive experiments, is a more efficient way to predict the welding process.
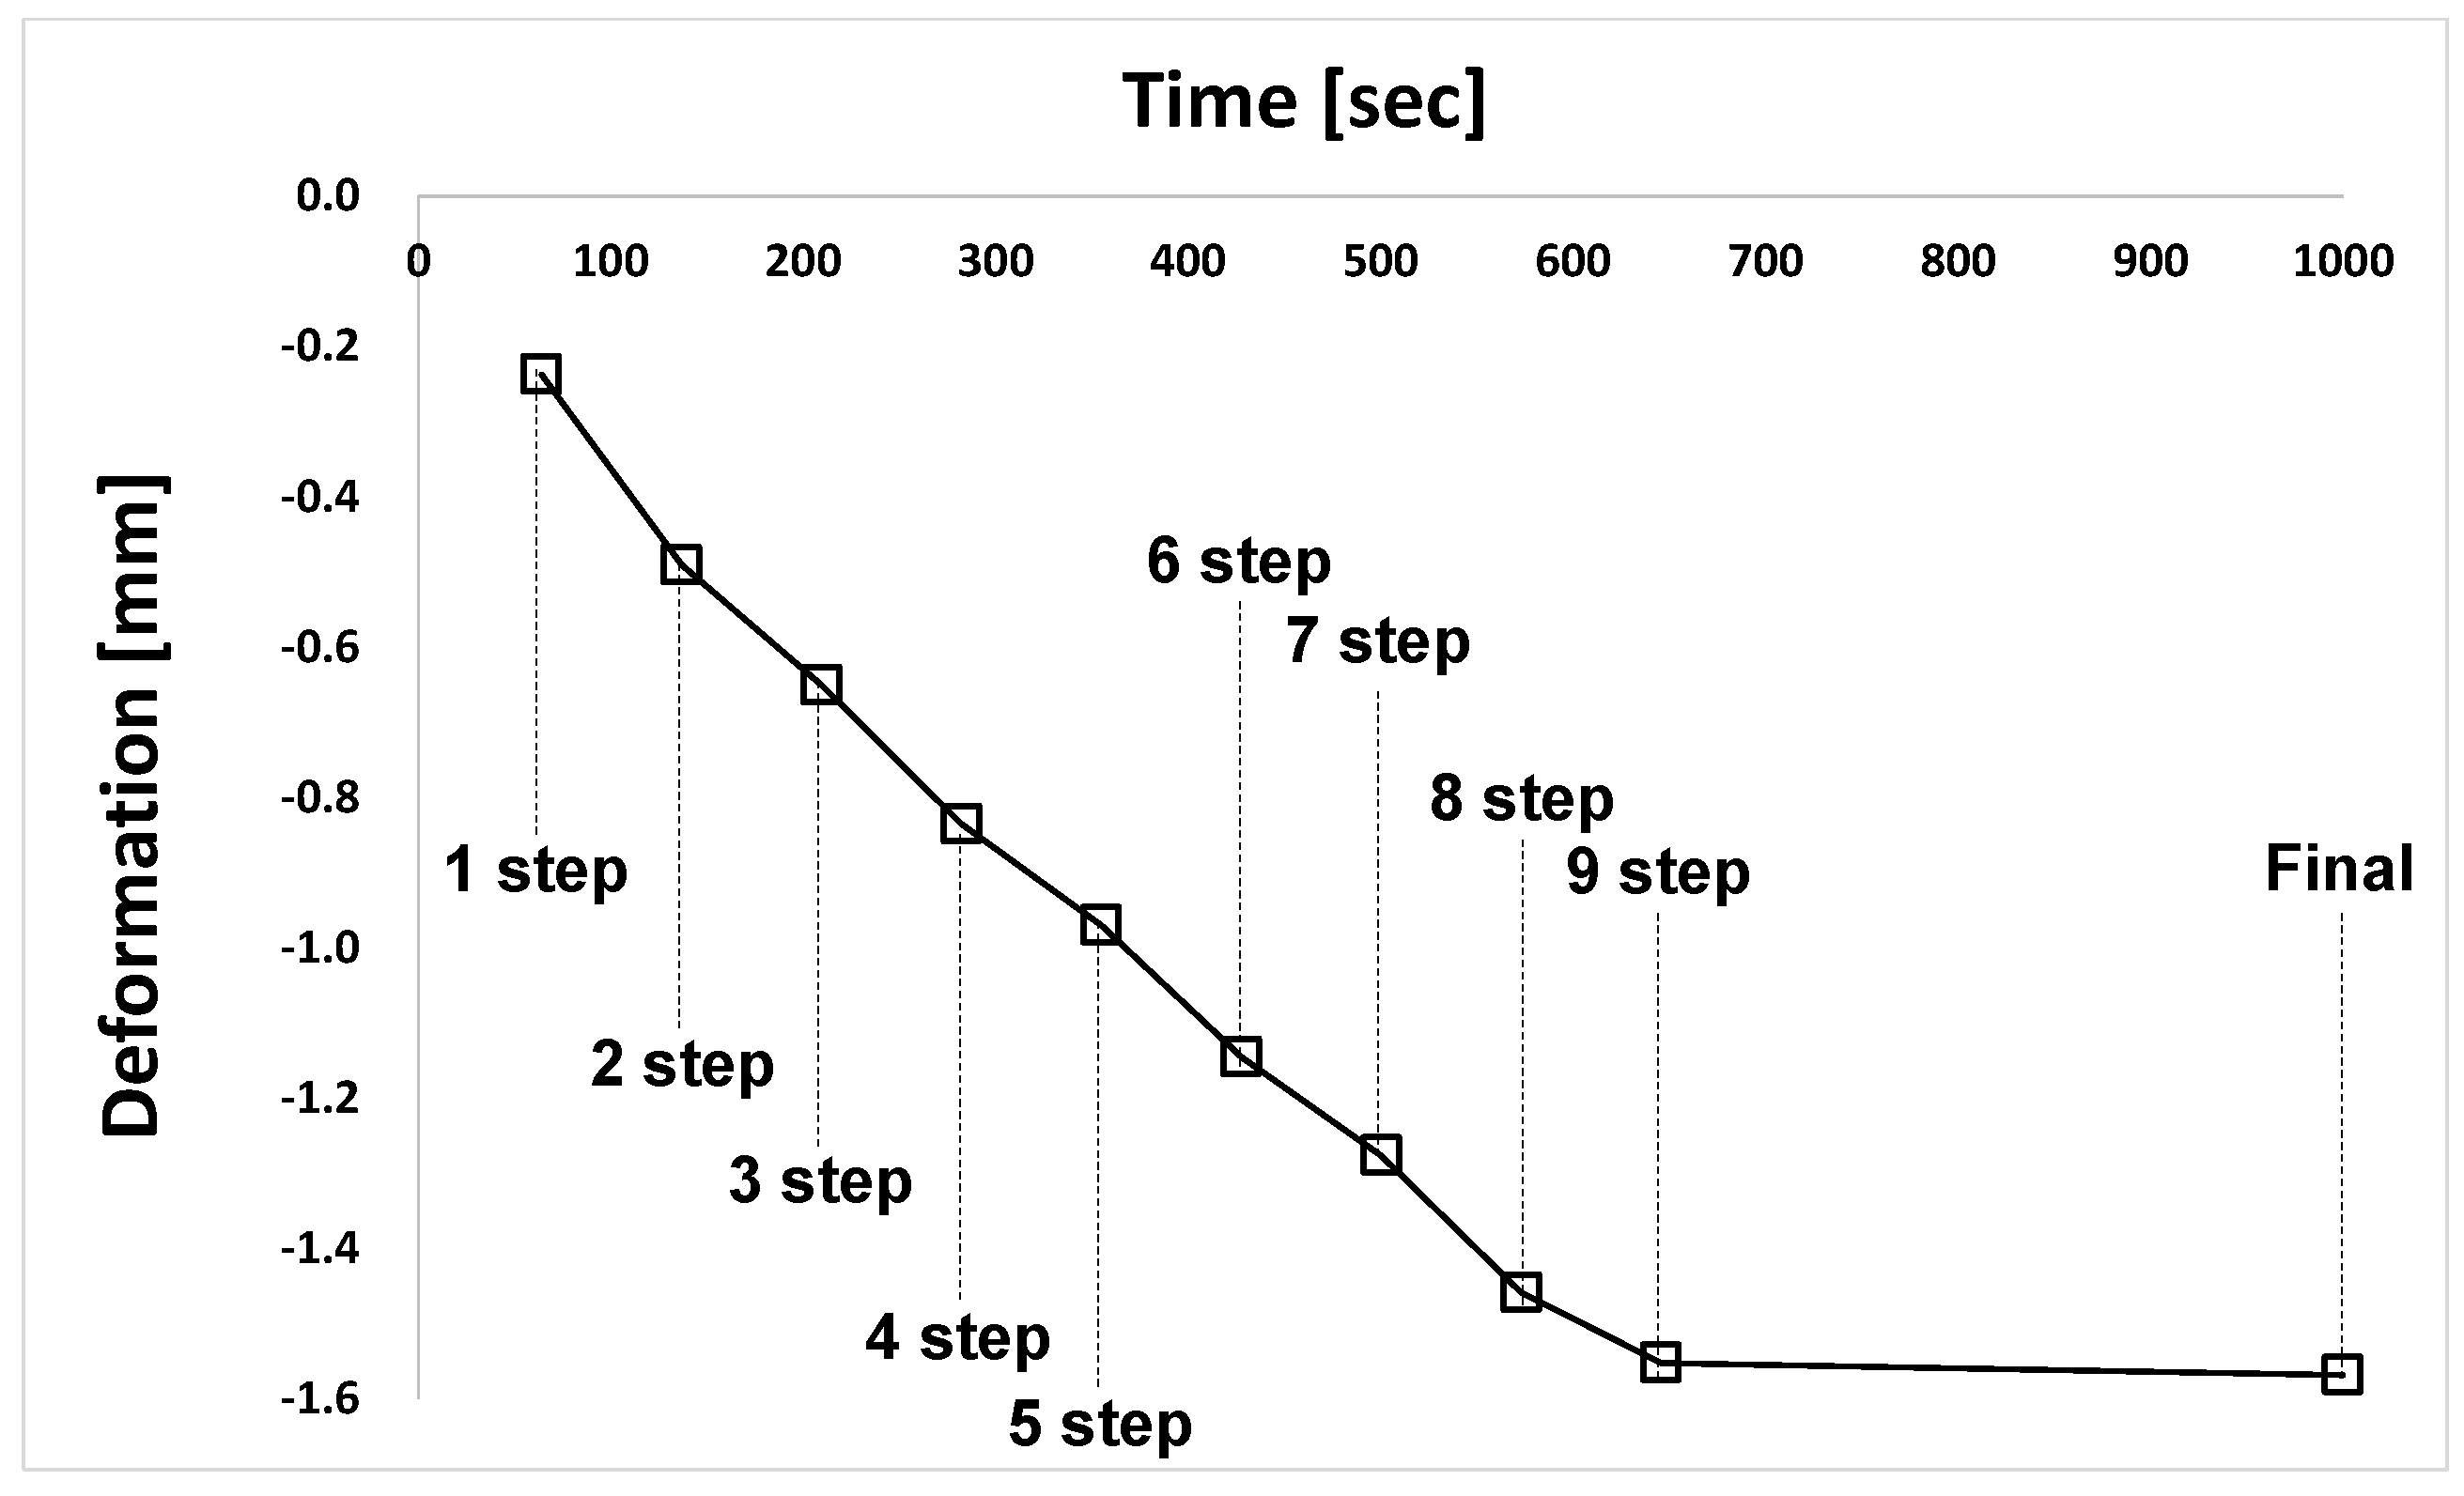
This study was performed on a large structure (aluminum alloy battery housing for electric vehicle) with multiple FSW lines. In the case of FSW, a small amount of the transverse shrinkage mode occurs after welding, and therefore, the tool and the workpieces are not placed in the correct position at each welding step. This problem has a significant influence on the quality of the final product (especially, the tensile strength, elongation, and hardness at the joints). In order to resolve these issues, we calculated the welding deformation of each welding step using the inherent strain method. The factors affecting inherent strain values are maximum temperature, temperature gradient, and reaction force. The calculated welding deformation (transverse shrinkage) was used as a value to correct the positions of the tool and the test piece at each welding step in the actual process, to solve the problem.
In addition, since the thermal elasto-plastic analysis method is not suitable for large structures, because it requires a long time for analysis, we applied the inherent strain method and reduced the analysis time to 1/30. As the numerical results also showed an 11.1% error compared to the experimental results, the method proposed in this study was confirmed to be reasonable.
The inherent strain method proposed in this study has a great advantage for calculation of the welding deformation of large structures, such as those for the automobile, shipbuilding, aviation, and railway industries. The analysis time is greatly reduced, and the analysis results are similar to the experimental results. In the future, it will be very helpful to improve the quality by applying the inherent strain method to various industrial fields, and predicting the welding deformation and correcting it.

