Article

Effect of Venturi Structures on the Cleaning Performance of a Pulse Jet Baghouse

School of Environmental Science and Engineering, Donghua University, Shanghai 201620, China
*
Author to whom correspondence should be addressed.
Appl. Sci. 2019, 9(18), 3687; https://doi.org/10.3390/app9183687
Submission received: 8 August 2019 / Revised: 31 August 2019 / Accepted: 3 September 2019 / Published: 5 September 2019
(This article belongs to the Section Environmental Sciences)

Abstract

:

Featured Application

The experimental data and opinions of this study are expected to provide guidance for the application of venturi tube in the dust cleaning of the pulse jet baghouse.

Abstract

In order to study the effect of venturi structures on the cleaning performance of a pulse jet baghouse, several cleaning tests are carried out applying the pulse jet test bench. Experiments are performed using different filter bags with venturi tubes of varying throat diameters and lengths. Peak pressure and peak pressure arrival time are selected to evaluate the cleaning efficiency under different conditions. On this basis, a series of comparative experiments are conducted between a typical venturi-type and a new venturi tube design on a semi-industrial pulse jet baghouse. The effects of the new venturi-type on baghouse cleaning performance and dust emission are studied. The results show that pulsing air pressure has a significant effect on bag-cleaning performance; the larger the throat diameter and the shorter the venturi length, the higher the peak pressure and the shorter the peak pressure arrival time. This improves the cleaning efficiency of the filter bags. The new venturi design changes the distribution of the cleaning pressure in the vicinity of the bag mouth, effectively extending the cleaning cycle and reducing the energy consumption as well as reducing the dust emission concentration of the baghouse.

Graphical Abstract

1. Introduction

The baghouse is a high-efficiency dust removal device widely used in the treatment of pollutants present in industrial flue gases. In these types of operations, particulate matter in the dust-laden flue gas is filtered and trapped by the filter bags, and a dust cake is deposited on the surface of the filter bag. With an increasing dust cake thickness, the operating resistance of the baghouse continuously increases [1,2]. Therefore, it is necessary to clean the dust cake on a regular basis, and the pulse jet cleaning is the method most commonly used for this purpose [3,4]. Pulse jet cleaning usually uses compressed air, which is injected into the filter bag through the bag mouth with an instant release mode. At the same time, the compressed air entrains a large amount of secondary airflow near the bag mouth to enter the filter bag. The dust cake falls off from the surface of the filter bag under the combined action of primary compressed air and secondary airflow, thus achieving the purpose of the bag cleaning [5,6,7].
Effective cleaning of filter bags is of great significance for a stable baghouse operation. Such processes maintain reasonable filtration resistance and reduce operational energy consumption. Among them, the installation of venturi tubes in the filter bags improves the efficiency of filter bag cleaning. Some scholars have studied the effect of venturi on the cleaning performance of the baghouse. Morris [8] determined that the installation of venturi can reduce the energy consumption of the pulse jet baghouse during a stable operation by about 30% on average. Grannell et al. [9] considered that the venturi tube should be preferred when the dust cake is too viscous to be easily cleaned by the compressed air. Cursley et al. [10] demonstrated that bag cleaning performance was dissimilar when five different shapes of venturi tubes were used on a cleaning test. In addition, in the absence of the venturi tube, a higher pulsing air pressure should be used in order to achieve the same cleaning effect. Lu et al. [11,12] conducted an experimental study on the cleaning performance of filter bags in the presence and absence of venturi. The results showed that when the filter bag displayed a high resistance coefficient, a proper cleaning effect was only achieved in the presence of the venturi tube. Tsai et al. [13] determined that when the residual resistance of the filtration system was high, the use of venturi produced an elevated pulse pressure on the inner wall of the filter bag, improving the cleaning effect. Bi et al. [14] found out that when the same cleaning effect was achieved, the consumption of compressed air required by the filter bag with the venturi tube was about 40% lower than that without the venturi tube. Andersen et al. [15] pointed out the importance of optimizing venturi tube design in low-pressure filters by computational fluid dynamics (CFD) numerical simulation, and considered that the working principle of the venturi was to restrict backflow, which was detrimental to the pressure rise in the bags.
Previous research has reported that the cleaning performance of filter bags was affected by the presence of the venturi tubes as well as by their shapes. This, in turn, affected the cleaning baghouse performance. However, studies on the effect of venturi structural parameters on the cleaning performance of the filter bag, and of the venturi tube type on dust cleaning performance and the dust emission concentration of the baghouse, are limited. This paper reports on the effect of different lengths and throat diameters of venturi tubes on the cleaning performance of long filter bags (8000 mm). Given that filter bags with typical venturi tubes display poor cleaning efficiency in the bag mouth area, a new venturi type is designed. This new tube is tested in order to determine the cleaning performance and dust concentration in the baghouse emissions.

2. Materials and Methods

2.1. Theoretical Background

Former study [16] has shown that under the action of the cleaning airflow, when the dust cake and the filter bag are moving radially outward and separated due to the action of the filter bag tension, the separation force per unit area is given by Equation (1), as follows:
F d = 1.65 m c m 5 / 6 K 1 2 ( P p k D 2 t R ) 1 / 3 ,
where F d is the separation force per unit area when the dust cake is separated from the filter bag, N; m c is the mass of the dust cake present on the filter bag surface per unit area, kg; m is the sum of the filter material and dust cake masses per unit area, kg; K is the elastic coefficient of the filter bag; P p k is the peak pressure of the cleaning airflow on the side wall of the filter bag, Pa; D is the free displacement of the filter material and dust cake, m; and t R is the peak pressure arrival time, s.
According to Equation (1), the main factors affecting the cleaning effect (separation force F d ) are the peak pressure P p k and the peak pressure arrival time t R when the filter material is selected and the filtration process is in equilibrium. This means that, the greater the peak pressure and the shorter the peak pressure arrival time, the greater the separation force of the dust on the filter bag and the better the cleaning effect [17,18,19,20]. In this paper, P p k and t R (the definitions of peak pressure and peak pressure arrival time shown in Figure 1) were selected to characterize the separation performance of the filter bag and the dust cake (the cleaning performance).

2.2. Experimental Materials

Figure 2 shows the two types of venturi tubes that were tested in this research as well as their arrangement in the bag cage. Figure 2a–c shows the bag cage in which the typical venturi was installed, and Figure 2d–f corresponds to the bag cage adapted with the new venturi-type tube. Taking the typical venturi as reference, the position of the new venturi in the bag cage was moved upward. With this modification, the air inlet in the new venturi was located above the filter bag mouth plane. The inlet and outlet diameters of both types of venturi tubes were of 120 mm and 80 mm, respectively. The throat diameter ( d e ) and length (h) of the typical venturi tube were the test variables.

2.3. Experimental Design

In this study, we first determined the effects of the pulsing air pressure ( P p u ) and the pulsing air injection time ( t P ) on the filter bag cleaning performance. Based on these results, the experimental conditions for testing the effect of the venturi structure on the cleaning performance of the filter bag were selected. For this purpose, the influence of the throat diameter and length on the cleaning performance of filter bag was determined for both the typical and the new venturi tubes. Experimental results were then compared. Finally, a semi-industrial experiment was carried out in order to compare the effects of the two venturi tubes used in the present research on the cleaning performance and dust emission concentration of the baghouse. Experimental design and arrangement are shown in Table 1.

2.4. Experimental Apparatus

Figure 3 shows the experimental bench approach for determining the performance of the pulse jet cleaning. This consists of a compressed air supply system, a pulse jet system, a filter bag and bag cage installed with the venturi tube (Figure 2), and a data acquisition system. The compressed air was supplied by an air compressor (Model AX2025; PUMA Inc., Memphis, TN, USA); the air tank was used to store the compressed air and maintain a constant the pulsing airflow pressure, which was monitored by a pressure gauge (Model Y-60A; Shanghai Automation Instrument Co., Ltd., Shanghai, China). The pulse controller (Model DMK-3CS; SBFEC. Inc., Shanghai, China) was used to control the opening and closing time of the electromagnetic pulse valve (Model DMF-Y-102S; SBFEC. Inc., Shanghai, China), thus adjusting the blowing time of the compressed pulsing air (the pulsing air injection time). The distance between the nozzle and the bag mouth was 170 mm, and the diameter of the nozzle hole was 18 mm. The tested filter bag was made of polyester with a thickness of 1.8 mm, a diameter of 130 mm and a length of 8000 mm. The bag cage diameter was 125 mm, and the length 7950 mm. The position distribution of the measuring points on the filter bag is shown in Figure 3b. The measuring points located 1000, 4000, and 8000 mm from the mouth of the bag were named “top”, “middle”, and “bottom”, respectively. The pressure transmitters (Model 316B2ER; Shanghai Automation Instrument Co., Ltd., Shanghai, China, measurement accuracy: 0.1Pa) were installed at the filter bag measuring points for collecting the cleaning pressure data. An oscilloscope (Model DPO 2014; TEKTRONIX, INC., Beaverton, OR, USA, sampling accuracy: 1 ns) and computer were used to record the duration of the cleaning pressure. In this paper, the effect of the venturi structure on the cleaning performance of the filter bag was studied by collecting the peak pressure and the peak pressure arrival time at different points on the test filter bags.
Based on the results related to the influence of the venturi tube structure on the filter bag cleaning performance, this research group determined the effects of two types of venturi on the cleaning performance and dust emission concentration of the baghouse in a semi-industrial scenario. Figure 4 shows a semi-industrial baghouse experimental device, which can simulate the working characteristics of a baghouse under real filtering conditions. The semi-industrial baghouse was designed with a dust feeder, a pulse jet cleaning system, a filtering unit, a power system, and a test system. The dust feeder was able to control the dust concentration in the dust-laden airflow of the baghouse by adjusting the amount of dust generated. The air volume and the filtration velocity in the baghouse were regulated with a fan and a flow meter in the power system. The baghouse operating resistance was monitored with a pressure transducer, and the dust emission was measured in 6 s intervals using a dust spectrometer (Model 1.108; Grimm Aerosol Technik GmbH & Co., Ainring, Germany). The filtering unit was composed of six polyester filter bags with a diameter of 130 mm and length of 1500 mm. The experimental conditions were as follows: the dust concentration was maintained at 100 g/m3; the dust for the test was made of alumina particles with a weight-mean diameter of 4 μm; the filtration velocity in the baghouse was set to 2 m/min, and the operating pressure drop of the dust cleaning to 1000 Pa; and particulate matter in the dust-laden airflow was captured by the filter bag and deposited on its surface. This increased the operating resistance in the baghouse. When the filtration resistance measured by the pressure transducer reached the preset value of 1000 Pa, the system automatically released the compressed pulsing air to clean the filter bag, which continued filtering the dust-laden airflow. Once the baghouse filtration resistance reached again 1000 Pa, the system started performing the next cleaning step. The time between any two cleaning intervals of the system was called a cleaning cycle. When testing the cleaning performance of the baghouse with the two types of venturi tubes, the experiments were continuously operated for 24 h under the same filtration-cleaning cycle conditions. After system stabilization, the number of cleaning cycles (N) and the dust emission concentrations C i (i = 1,2,3…600) of the baghouse were continuously recorded for 1 h, and the average filtration cycle time T ¯ and average dust emission concentration C ¯ of the baghouse were calculated according to the Equations (2) and (3), respectively:
T ¯ = 3600 N
C ¯ = i = 1 600 C i 600

3. Results and Discussion

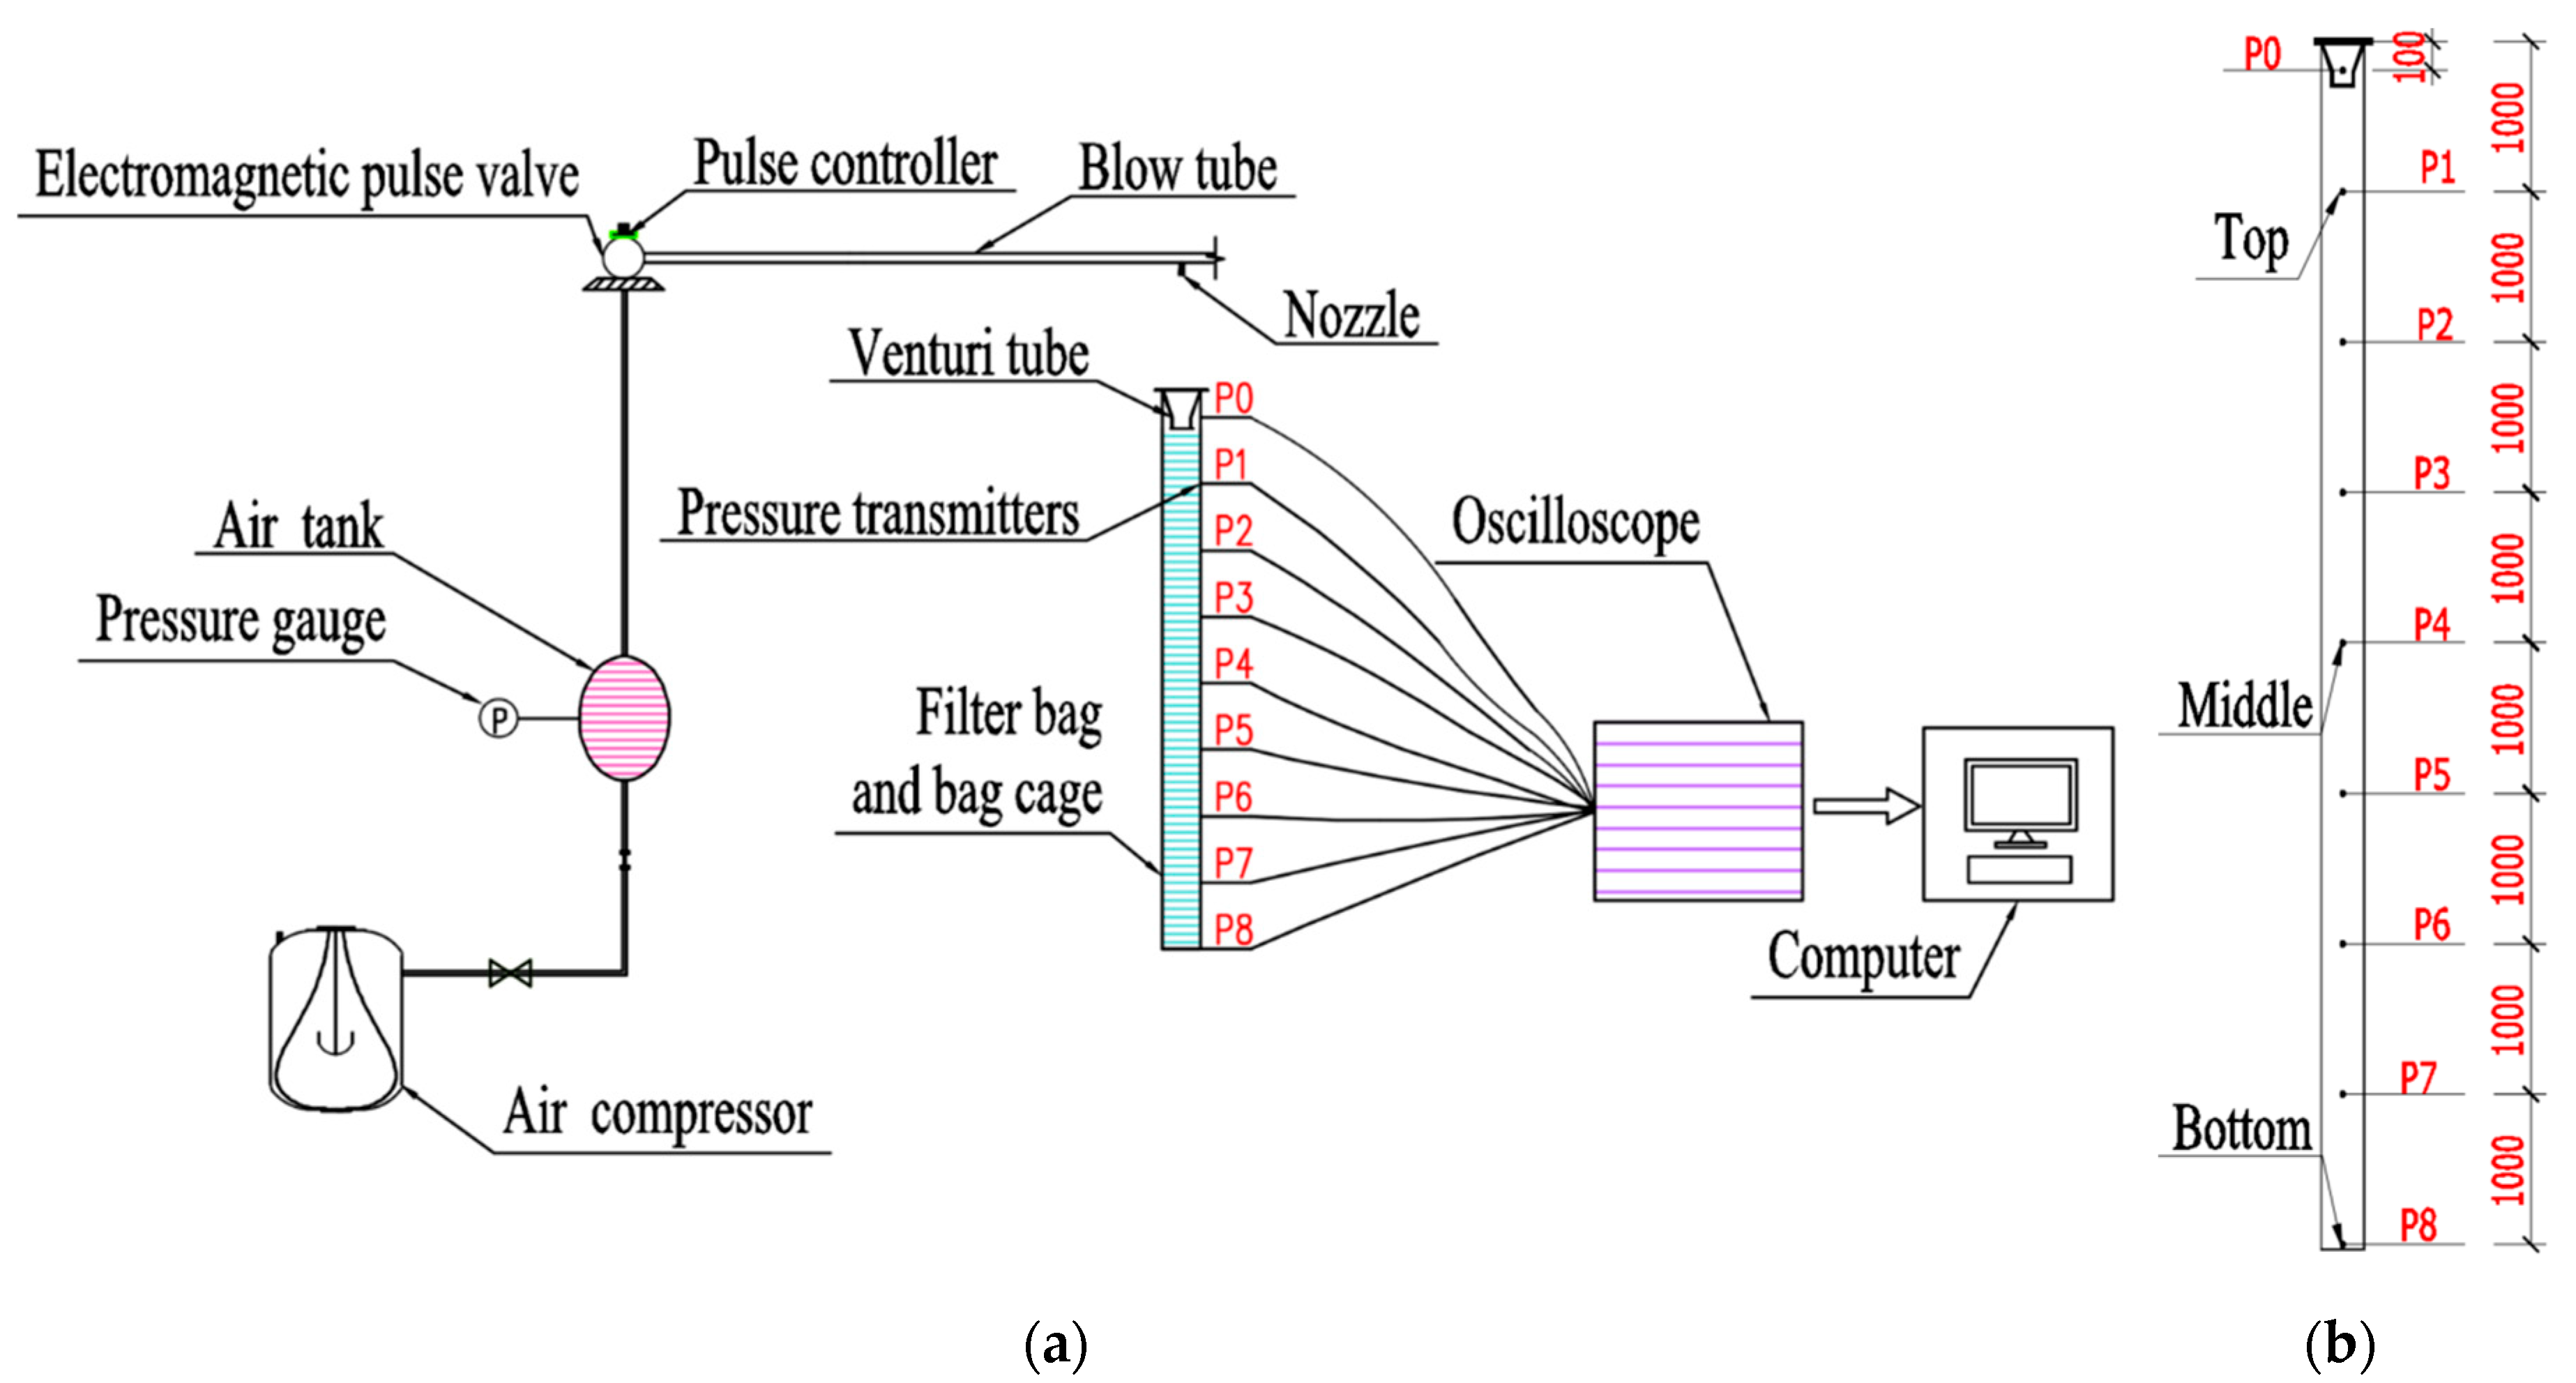
3.1. Effect of Pulsing Air Pressure and Pulsing Air Injection Time on the Cleaning Performance of the Filter Bag

Figure 5 shows the peak pressure distribution of the airflow in the filter bag under different pulsing air pressure values (0.3, 0.4, and 0.5 MPa) at a pulsing air injection time of 100 ms. According to the data, the peak pressure ( P P k ) on the side wall of the filter bag increased with increasing pulsing air pressure values ( P P u ) and the peak pressure decreased from the top (1000 mm) to the bottom (8000 mm) in the bag. In addition, the attenuation range of the peak pressure in the upper half of the filter bag was significantly greater than that observed in the lower half. This occured because when the compressed airflow was ejected from the nozzle, it would move downward rapidly and induce a large amount of secondary airflow to enter the filter bag. The compressed airflow (the primary airflow) and the secondary airflow mixed to form the total cleaning airflow. The cleaning airflow expanded as it moved downward, thus increasing the air pressure in the space it passed through. Moreover, due to the air permeability of the filter bag, the cleaning airflow was continuously diffused to the outside of the filter bag. Furthermore, the cleaning airflow would rub against the filter bag in the downward movement process, which inevitably consumed a certain amount of energy. Therefore, the peak pressure on the filter bag decreased with the increase of the distance between the measuring points and the bag mouth. On the other hand, the greater the pulsing air pressure, the greater the kinetic energy of the cleaning airflow, the more the amount of the cleaning airflow diffused outside the filter bag, and the more intense the friction with the filter bag, so the peak pressure differed greatly on the upper part of the filter bag under different pulsing air pressure values. When the cleaning airflow moved to the lower half of the filter bag, the friction between the cleaning airflow and the filter bag was weakened due to the energy attenuation of the cleaning airflow so that the gap of the peak pressure on the lower part of the filter bag became smaller under the different pulsing air pressure values. Further analysis showed that, at a pulsing air pressure ( P p u ) of 0.5 Mpa, the peak pressure of the filter bag at the three measuring points was 53.57% (top), 51.04% (middle), and 113.33% (bottom) higher than that obtained with a pulsing air pressure of 0.3 MPa, respectively. A similar analysis comparing a pulsing air pressure of 0.4 MPa and 0.3 MPa indicated that the values were of 28.57% (top), 30.21% (middle), and 83.33% (bottom), correspondingly. However, when the pulsing air pressure was 0.4 MPa, the peak pressure at the three measuring points was only 16.28% (top), 13.79% (middle), and 14.06% (bottom) lower than that obtained at a pulsing air pressure of 0.5 MPa. This indicated that as the pulsing air pressure increased, the rate of increase in the peak pressure of the filter bag decreased.
Figure 6 shows that the peak pressure arrival time ( t R ) decreased with an increase in the pulsing air pressure ( P P u ) at the three measuring points. In addition, at the “top” point, the peak pressure arrival time values obtained under the three different pulsing air pressures were almost the same. Moreover, with an increasing distance between the measuring points and the bag mouth, the difference between the peak pressure arrival time under the three pulsing air pressures increased. The peak pressure arrival time at the “bottom” point was 262 ms (0.3 MPa), 204 ms (0.4 MPa), and 202 ms (0.5 MPa); thus, when the pulsing air pressure was 0.3 MPa, the peak pressure arrival time at the lower part of the filter bag was significantly higher than that obtained at a pulsing air pressure of 0.4 and 0.5 MPa. This result was consistent with the regular pattern related to the influence of different pulsing air pressure values ( P P u ) on the peak pressure ( P P k ), namely, for long filter bags, when the cleaning airflow passed through the upper half of the filter bag, due to the very high airflow velocity, the time of the cleaning airflow reaching the “top” point was similar under different pulsing air pressures, which meant the peak pressure arrival time at the “top” point tended to be the same. However, in the lower half of the filter bag, under different pulsing air pressures, the energy attenuation of the cleaning airflow was different, so that the peak pressure arrival time values were different. In addition, when the pulsing air pressure was 0.4 MPa and 0.5 MPa, the difference between the peak pressure arrival time at the three measuring points was small. Additionally, it was observed that the higher the pulsing air pressure, the greater the consumption of compressed air, and the higher the energy consumption of the cleaning bag. Moreover, high pulsing air pressure values caused excessive cleaning of the filter bag, destroying the initial layer of dust cake and reducing the filtration efficiency of the filter bag. Therefore, when selecting the pulsing air pressure, the relationship between the cleaning effect, the energy consumption of the pulse jet cleaning device, and the filtration efficiency of the filter bag should be systematically considered. In this investigation, a pulsing air pressure value of 0.4 MPa was selected to carry out the follow-up experimental study.
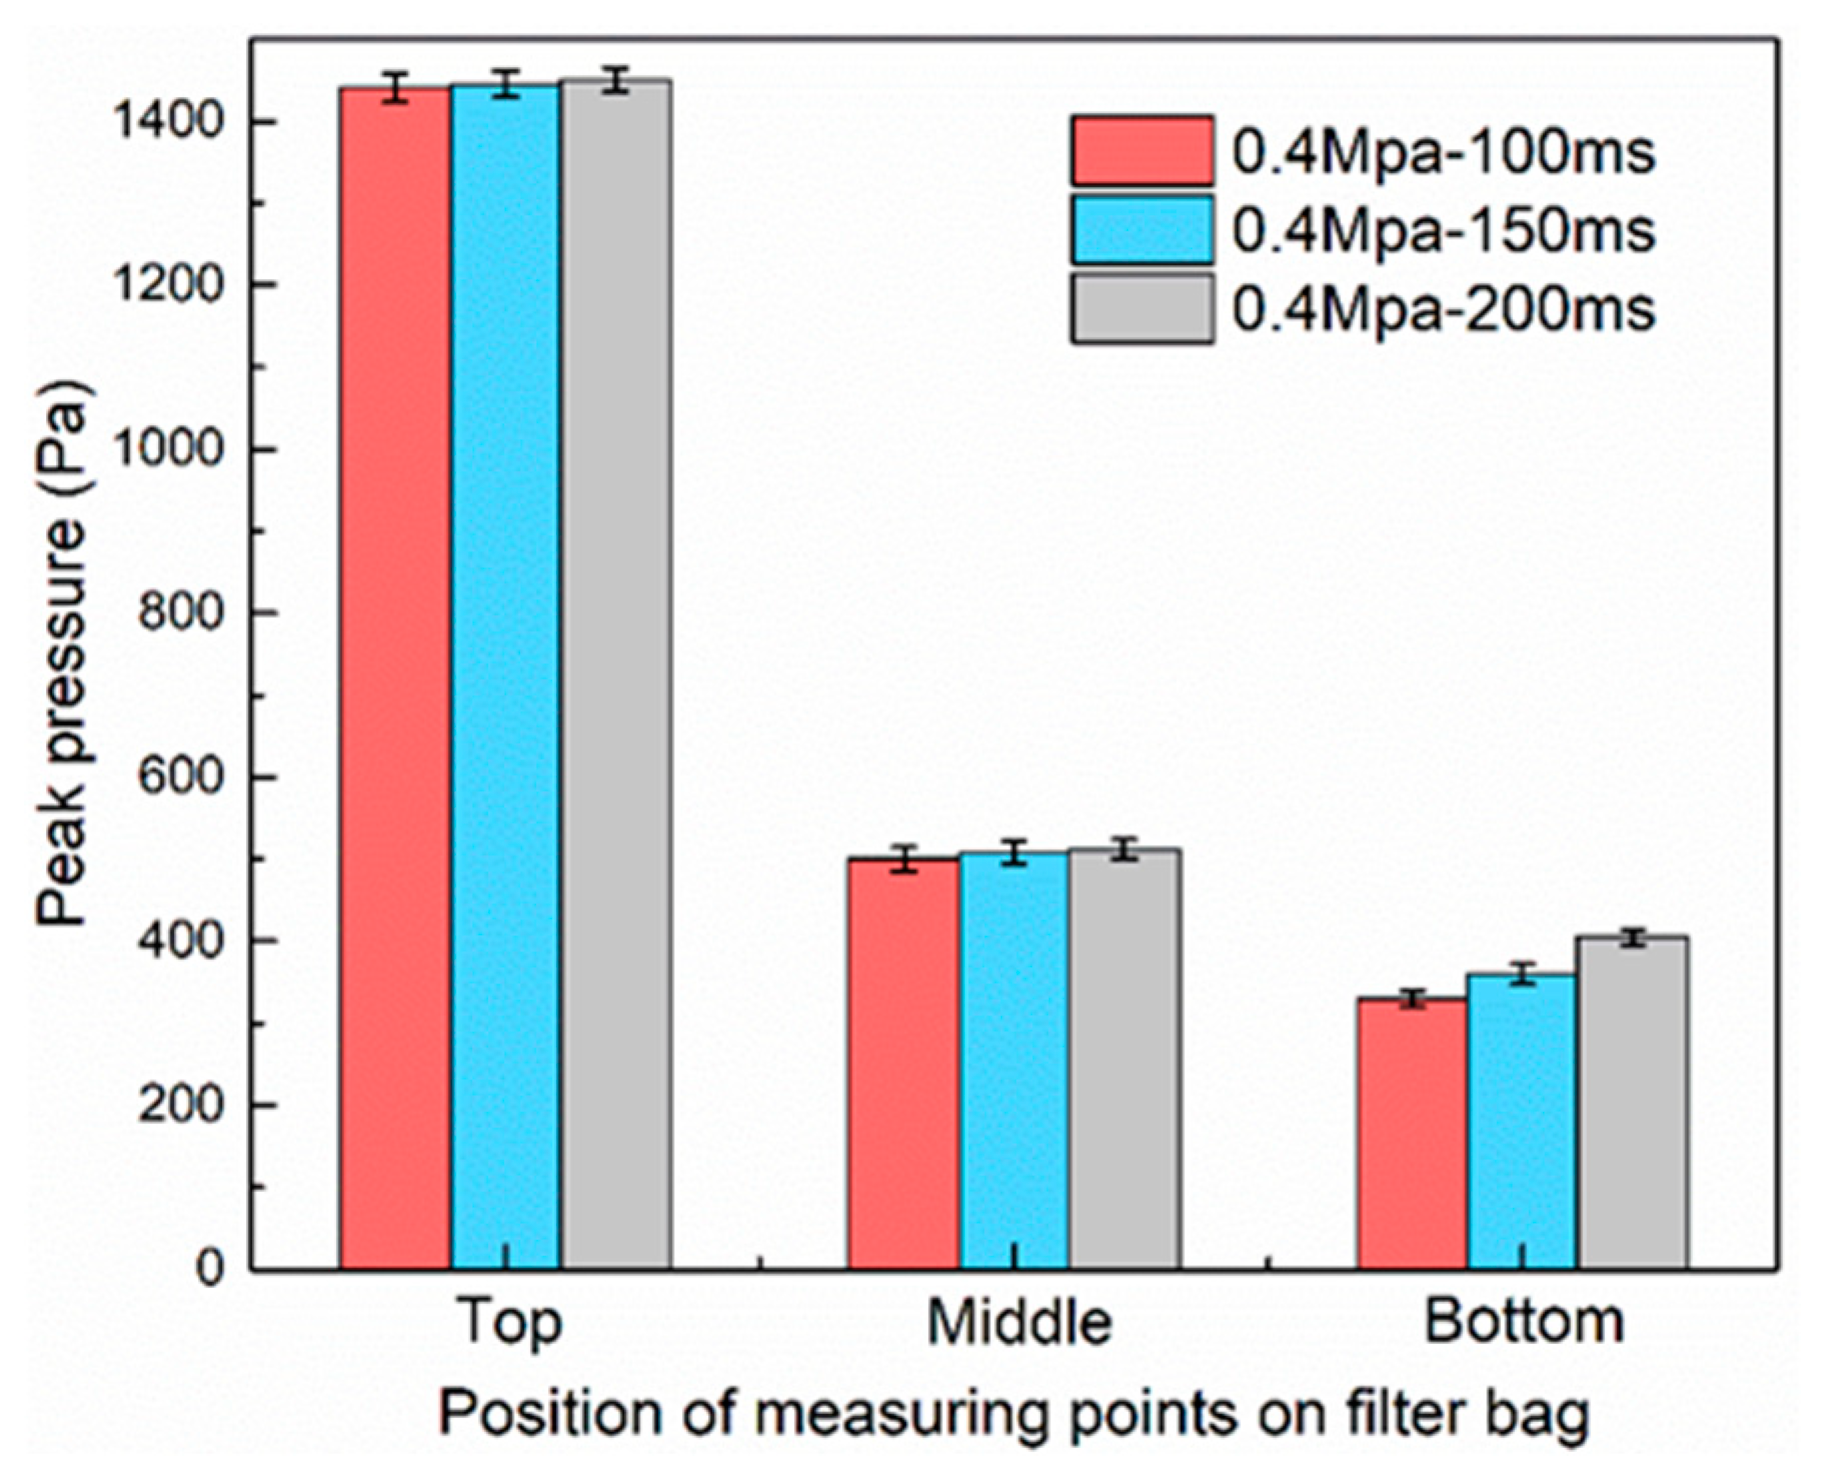
According to Figure 7, at a constant pulsing air pressure ( P P u ) value of 0.4 Mpa, the effect of different pulsing air injection times (100, 150, and 200 ms) on the peak pressure was not significant. This figure shows that applying the three injection times previously mentioned, the peak pressure of the filter bag was similar in the two measuring points labeled as “top” and “middle”, respectively. However, these values were significantly different at the measuring point labeled as “bottom”. On the other hand, Figure 8 shows that the peak pressure arrival time ( t R ) increased with increasing pulsing air injection time values ( t P ) , and the difference between the peak pressure arrival time ( t R ) at the same measuring point increased when the distance between the measuring points and the bag mouth increased. This indicates that the influence of the pulsing air injection time ( t P ) on both the peak pressure ( P P k ) and the peak pressure arrival time ( t R ) was not the same. This phenomenon may be explained by the fact that, at a constant value of the compressed pulsing air pressure, by increasing the pulsing air injection time, the amount of compressed air injected into the filter bag also increases; in addition, the peak pressure arrival time at the “top” measuring point was less than 40 ms, which was significantly smaller than the injection time of the compressed pulsing air set in the experiment. This indicates that the cleaning airflow pressure at the “top” measuring point had reached its peak value before the end of the pulsing air injection. Therefore, the compressed airflow injected between the peak pressure arrival time and the end of the pulsing airflow injection had no significant influence on the peak pressure and the peak pressure arrival time at the point labeled as “top”. On the other hand, with the increase of the injection time, the total flow volume of the primary airflow increased, which in turn increased the total flow volume of the secondary airflow and ultimately led to the increase of the total amount and duration of the cleaning airflow. Therefore, at the “bottom” point, the total amount of the cleaning airflow increased, leading to an increase in the refluxing of the cleaning airflow (this reflux was generated when the cleaning airflow reached the bottom of the bag), thereby causing the peak pressure to become larger. In addition, the increase of the refluxing lengthened the reflux action time of the cleaning air flow, which in turn increased the peak pressure arrival time. According to the test results, when the pulsing air pressure was constant, increasing the pulsing air injection time did not significantly increase the peak pressure; on the contrary, the peak pressure arrival time increased, which was not favorable for the cleaning process. Moreover, it increased the consumption of compressed air, also increasing energy consumption. In the follow-up test, the pulsing air injection time was set to 100 ms.

3.2. Effect of Venturi Length and Throat Diameter on the Cleaning Performance of the Filter Bag

Figure 9a illustrates the variation of the peak pressure on the filter bag under different venturi throat diameters (40, 50, and 60 mm) at a pulsing air pressure of 0.4 Mpa, pulsing air injection time of 100 ms, and venturi length of 200 mm. The peak pressure in the point P0 was negative, later increasing until reaching a maximum value at the point P1. Subsequently, the peak pressure decreased with an increasing distance from the measuring point to the bag mouth. Finally, the peak pressure rose again at point P8. As shown in 
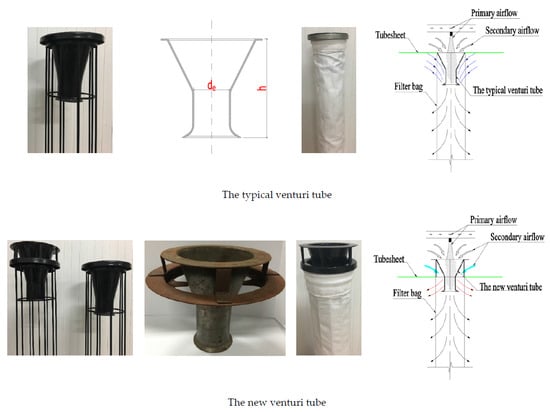
Figure 9b, when the typical venturi-type tube was installed in the bag cage, the area near the bag mouth was in the “blind action zone” of the cleaning airflow (primary airflow and secondary airflow). In addition, when the cleaning airflow was ejected from the venturi tube, the airflow outside the filter bag near P0 would be induced to the inside, creating a negative pressure zone in the area near the bag mouth. It can be seen that the area near P0 is the one with the worst cleaning performance. This inference is consistent with the literature [3,20]. Since, in this point, the dust layer cannot be effectively cleaned, the filter material in this area loses its filtration ability. Thus, it should be considered that installing the typical venturi-type tube implies that the area near the filter bag mouth will exhibit low filtration performance. The maximum value of the peak pressure occurred at P1, which was consistent with the results of literature [21,22]. In the process of moving downward from the bag mouth, the cleaning airflow expanded and diffused outside the filter bag. Since the cleaning airflow could not be infinitely expanded, and the consumption and energy loss of the cleaning airflow accompanied the whole process, it was inevitable that there would be a maximum pressure on the side wall of the filter bag. After the maximum pressure occurred, the expansion effect of the cleaning airflow decreased and the energy attenuation increased. Later, the peak pressure on the filter bag decreased. The peak pressure at P8 was larger than that obtained at P7, which was likely caused by the refluxing of the cleaning airflow.
According to Figure 9a and Figure 10, with an increase in the venturi throat diameter, the peak pressure on the filter bag increased and the peak pressure arrival time decreased. This indicates that a better cleaning effect can be obtained by increasing the throat diameter of the venturi. This may be explained by the fact that the smaller the venturi throat diameter, the greater the resistance of the clearing airflow (the primary airflow + the secondary airflow) passing through the venturi, which led to the greater energy loss of the cleaning airflow, thus making the peak pressure smaller and the peak pressure arrival time greater.
Figure 11 and Figure 12 show the influence of different venturi lengths (160, 180, and 200 mm) on the peak pressure and the peak pressure arrival time, respectively. Experiments were run at a pulsing air pressure of 0.4 MPa, pulsing air injection time of 100 ms, and a venturi throat diameter of 60 mm. According to the results, as venturi tube length decreases, the peak pressure increases; however, the peak pressure arrival time decreases. This suggests that it is possible to improve the cleaning effect by reducing the length of the venturi tube. In addition, when reducing the venturi length, a larger effect was observed on the peak pressure in the upper half of the filter bag, compared to that in the second half. On the contrary, a more significant effect was observed in the lower half of the bag for the peak pressure arrival time under the same reduced-venturi length condition. This occurred because, for the cleaning airflow, the venturi tube is a resistance component. The longer the venturi tube, the longer the distance the cleaning airflow moves in the tube, and the greater the energy loss of the cleaning airflow. Thus, the peak pressure on the filter bag decreases and the peak pressure arrival time increases. In addition, according to the test results, when the cleaning pressure in point P4 (4000 mm) reached its peak value, the injection of compressed pulsing air was not finished (100 ms). This indicates that the increase of the cleaning pressure on the upper part of the filter bag was within the time range of the continuous action of the compressed air, which made the velocity of the cleaning airflow in the upper part of the filter bag very large, so that the time for the the cleaning airflow to reach the P0~P4 point under different venturi tube lengths was almost the same. Thus, the peak pressure for the upper half of the filter bag with different venturi tube lengths was reached at the same time, but the peak pressure was quite different (especially for P1). For the lower half of the filter bag, the longer the length of the venturi tube, the greater the energy loss of the cleaning airflow, and the longer the time for the cleaning airflow to reach the P5~P8 point, which made the peak pressure smaller and the peak pressure arrival time greater.

3.3. Effect of the New Venturi-Type on the Cleaning Performance of the Filter Bag

Figure 13a and Figure 14 display the results for the effects of two types of venturi tubes on the cleaning performance of the filter bags. Experiments were performed at a pulsing air pressure of 0.4 MPa, a pulsing air injection time of 100 ms, and a venturi throat diameter and length of 60 mm and 160 mm, respectively. Data showed that, when using the new venturi tube and for every measuring point, the peak pressure was higher and the peak pressure arrival time was shorter compared to the values obtained when using the typical venturi tube. The filter bag with the new venturi displayed a positive peak pressure at P0 (200 Pa). It is obvious that this new tube had an effect on the peak pressure in the area near the filter bag mouth. Since the new venturi was placed at a higher height compared to that for the typical venturi (as shown in Figure 2), when a compressed airflow (primay airflow) was injected into the new venturi, two streams of secondary airflow near the bag mouth were generated. As shown in Figure 13b, the secondary airflow that is above the inlet enters the venturi, mixes itself with the primary airflow, and is later ejected. On the other hand, the secondary airflow that is below the venturi inlet enters the filter bag through the side of the venturi, and later mixes itself with the cleaning airflow at the venturi outlet. Therefore, when the new venturi was installed, the area near the bag mouth was impacted from the inside to the outside of the bag by the secondary airflow. This produced a positive peak pressure in P0. In addition, given that in the new venturi the secondary airflow was larger than that in the typical venturi, the peak pressure observed at P1 in the filter bag adapted with the new venturi was significantly higher than that where the typical type venturi was installed. In this case, the value increased by about 440 Pa. Data also demonstrated that, when the flow rate of the secondary airflow increased, the new venturi did not extend the action time of the secondary airflow on the lower half of the filter bag. This effect was different to that obtained when the pulsing air injection time was increased. Therefore, the peak pressure arrival time on the filter bag with the new venturi was shorter than that observed when using the typical venturi-type (See Figure 14).

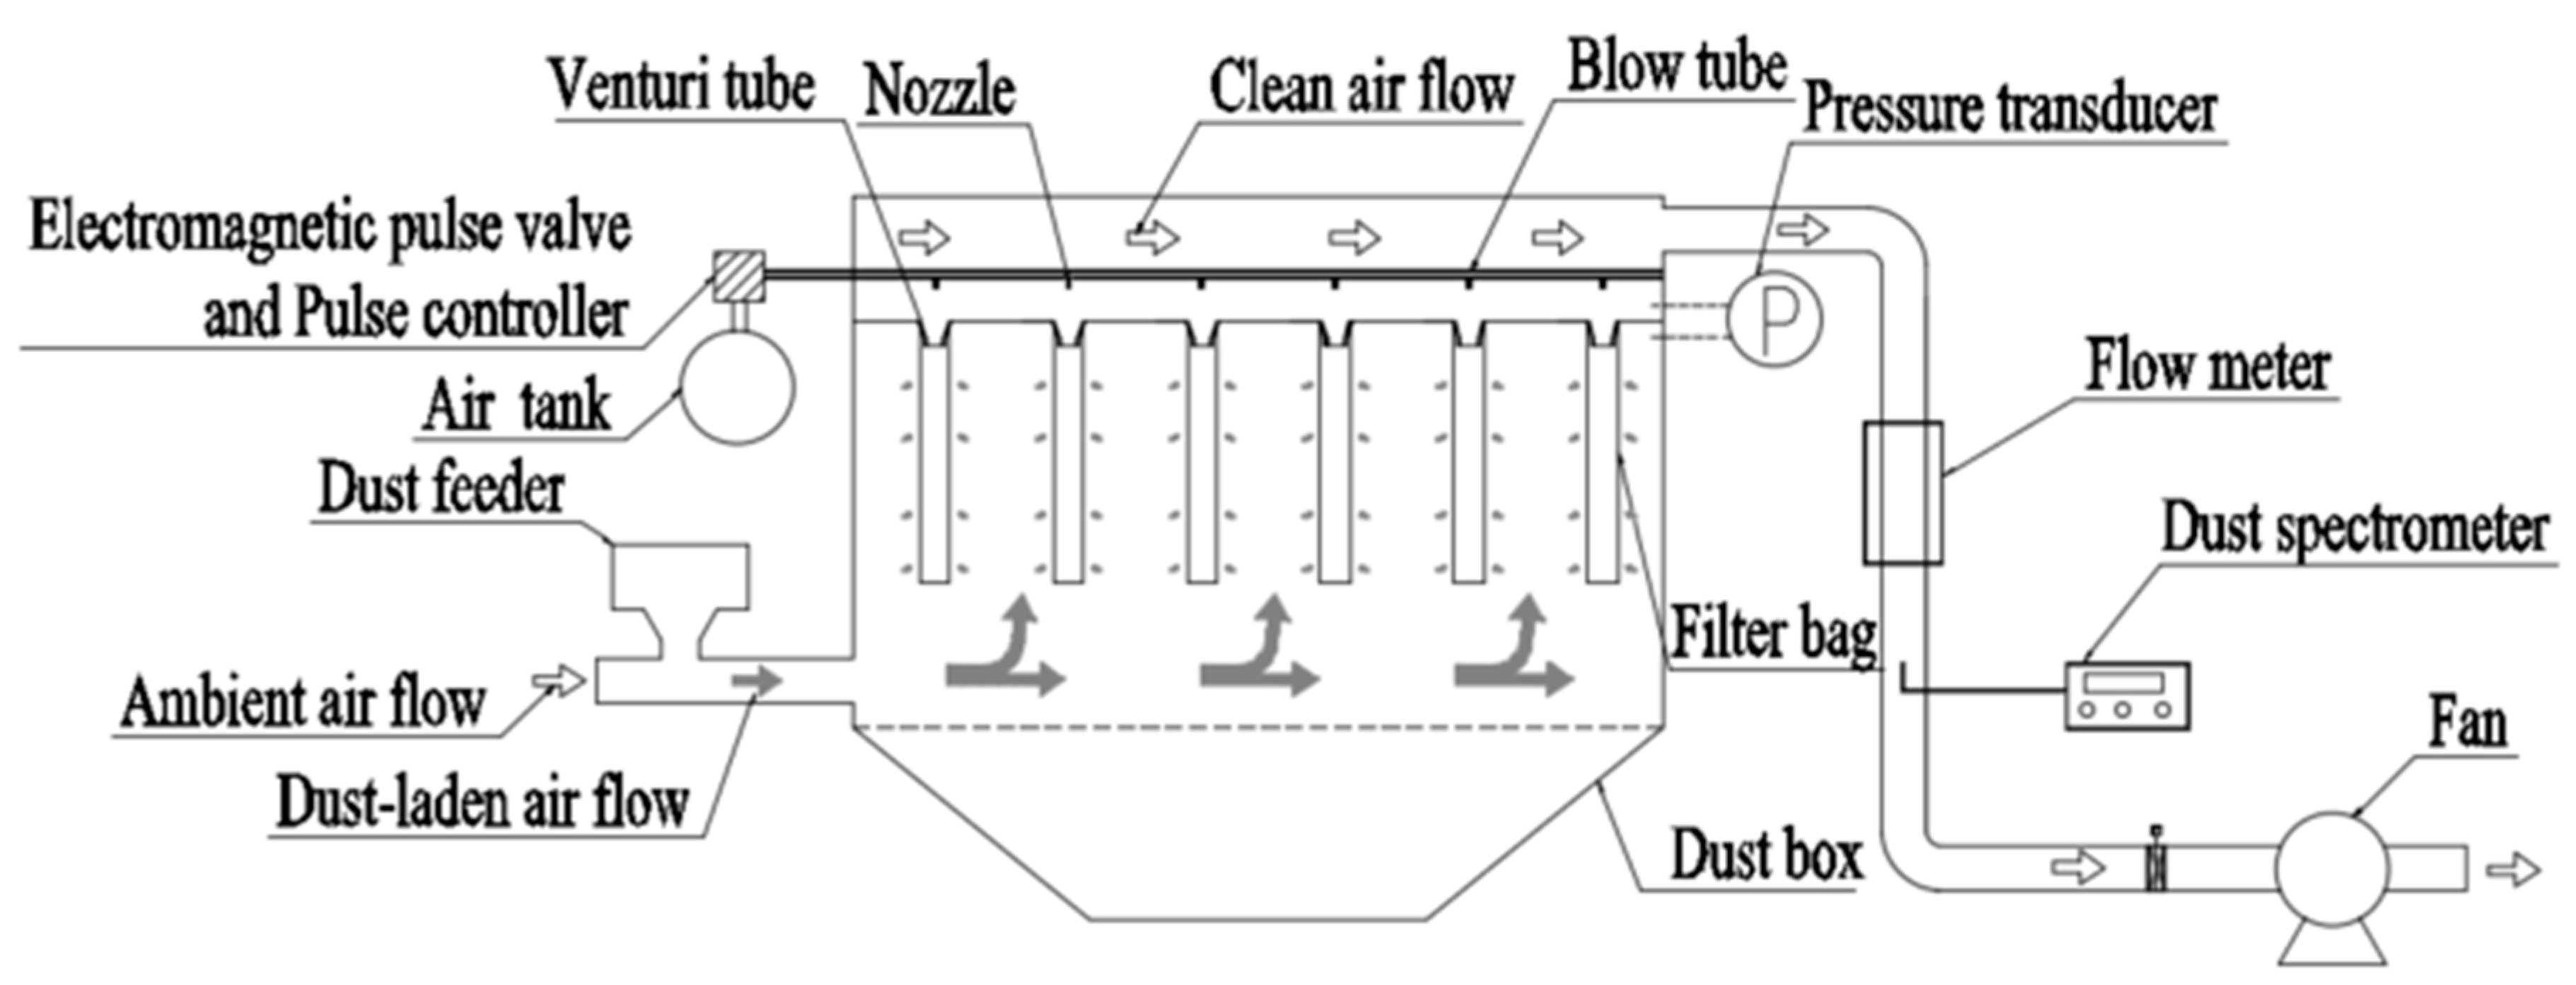
3.4. Effect of the New Venturi-type on the Baghouse Cleaning Performance

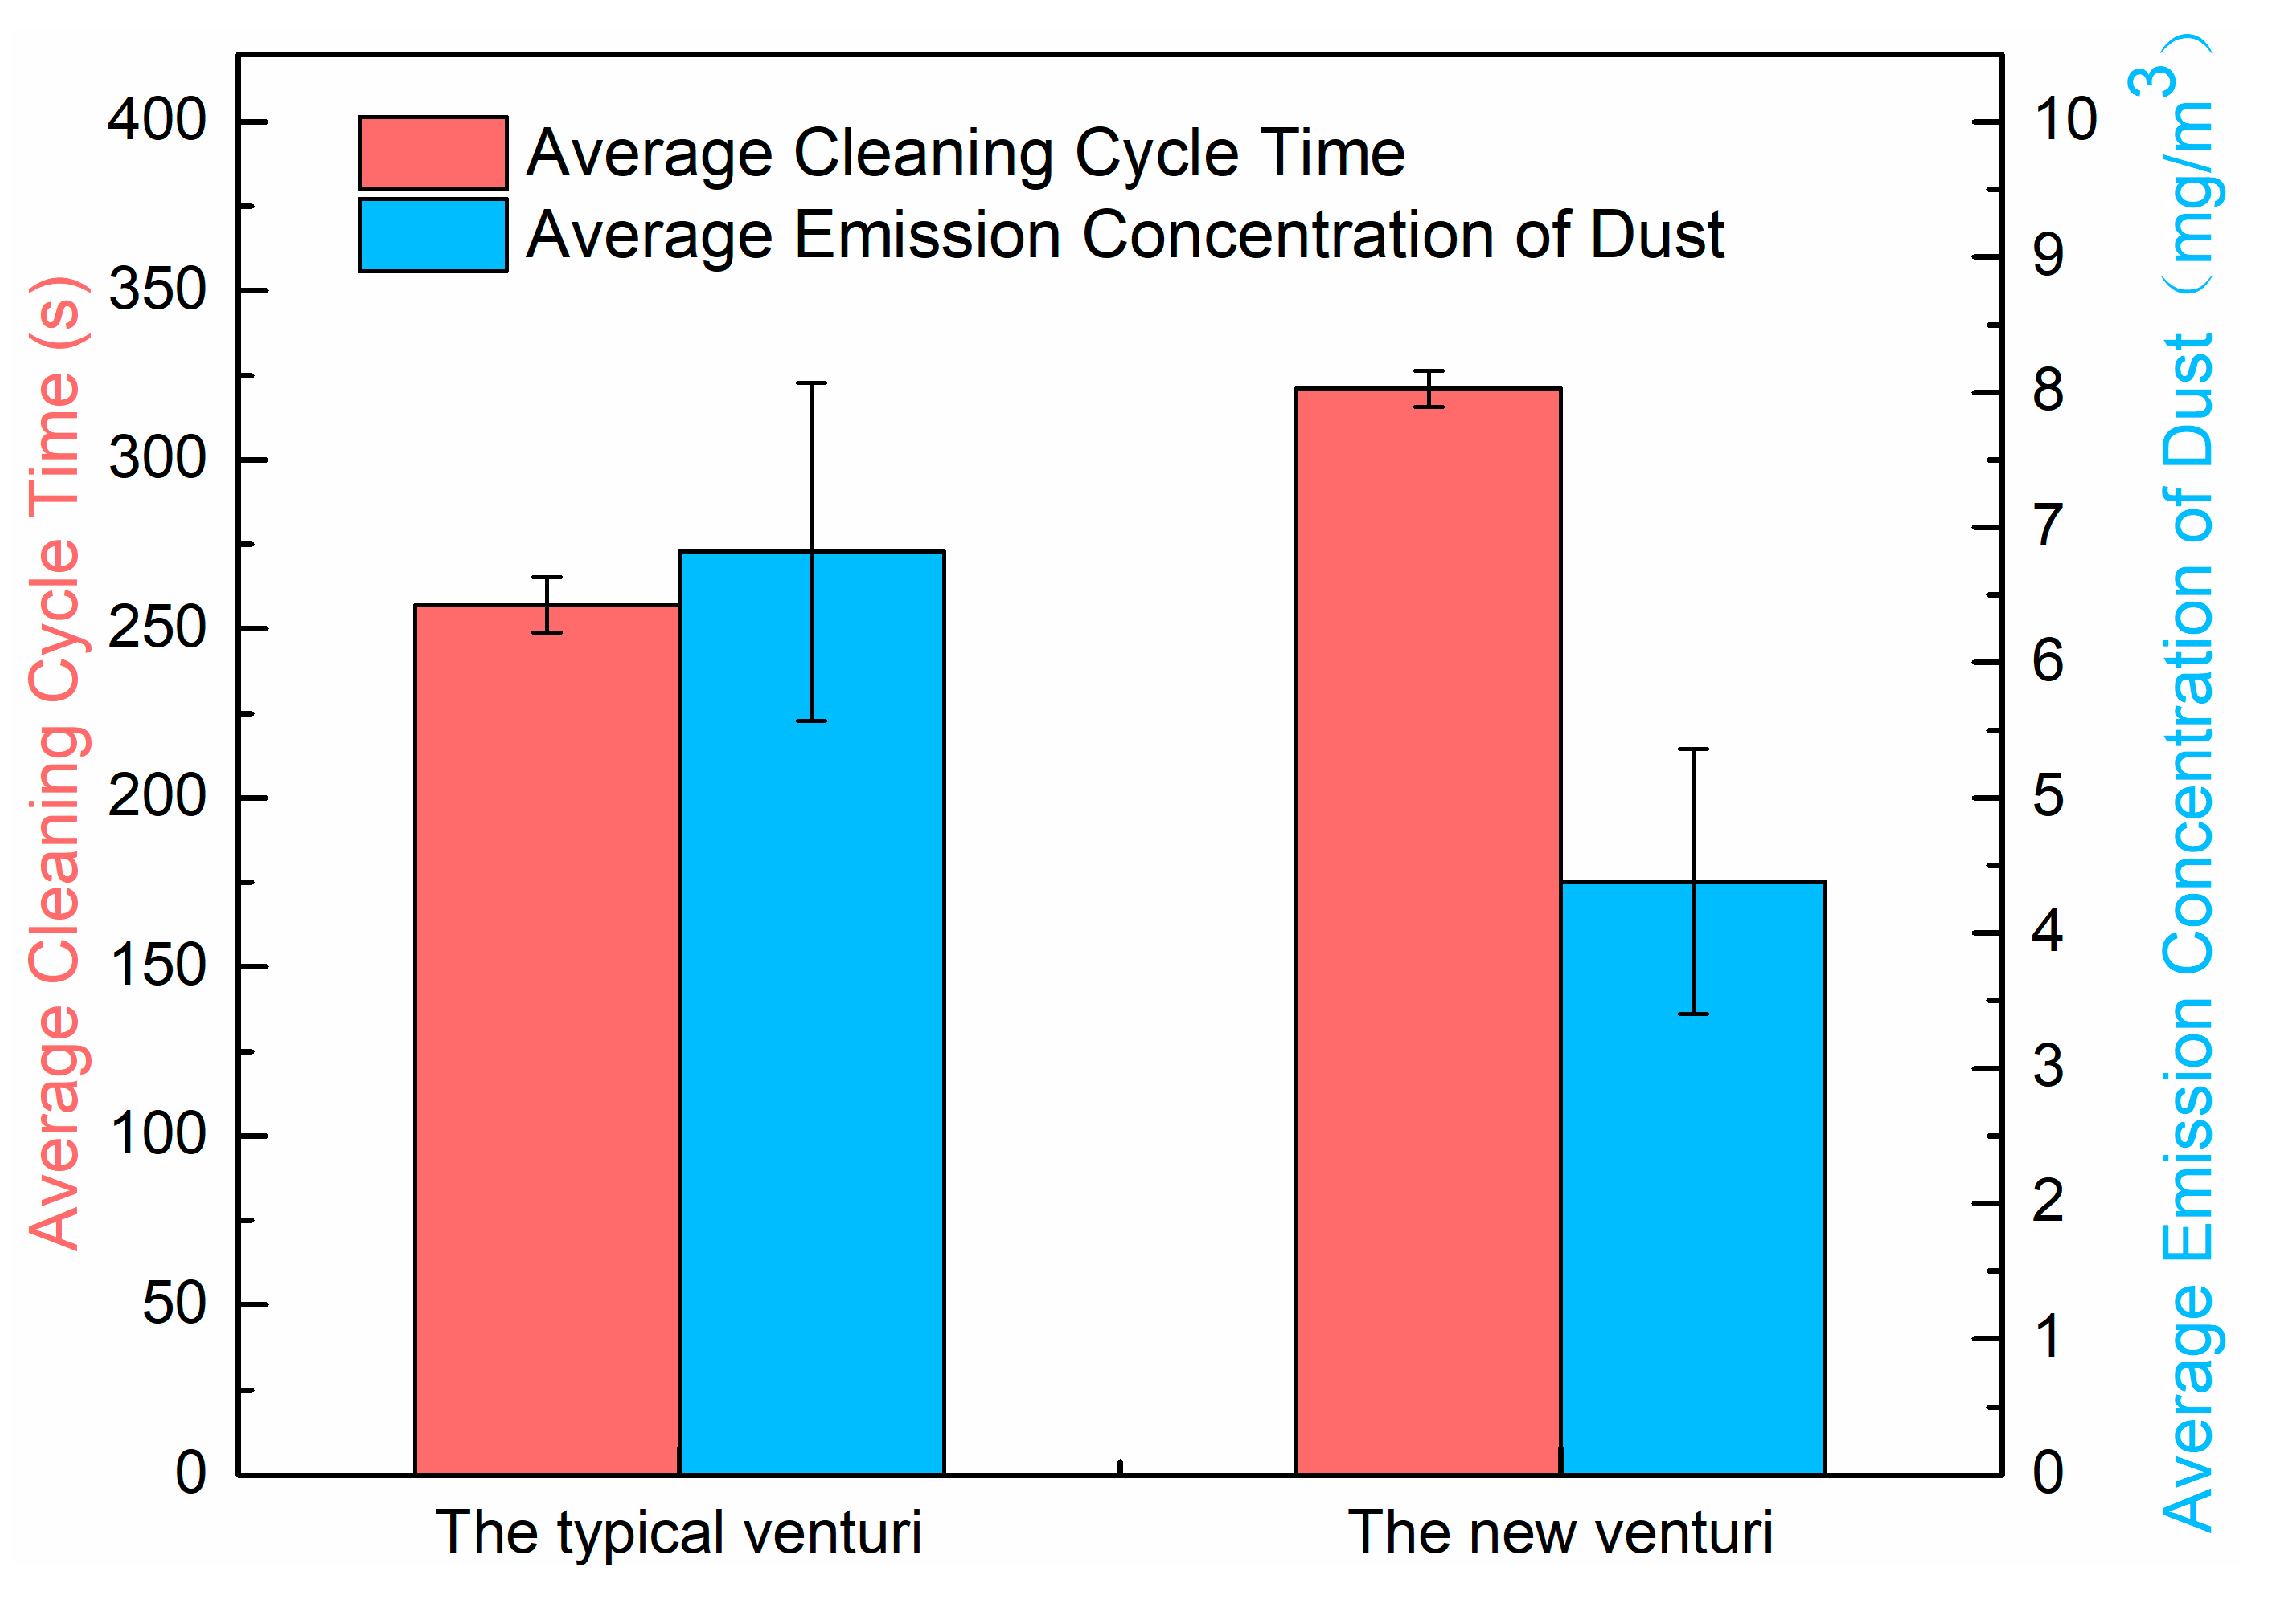
Experimental results for the cleaning cycle time and dust emission concentration of baghouses adapted with the typical or the new venturi tubes are shown in Figure 15. In these experiments, the pulsing air pressure was set to 0.4 MPa and the pulsing air injection time to 100 ms. According to the data, the average cleaning cycle time of the baghouse with the new venturi (321 s) was significantly longer than that of the baghouse with the typical one (257 s). The test conditions of the two groups were identical, which indicated that the baghouse adapted with the new venturi displayed better dust cleaning performance. In this new tube, the cleaning airflow was more efficient in removing the dust cake deposited on the filter bag. Therefore, after dust cleaning, the baghouse installed with the new venturi displayed lower resistance, and the cleaning cycle time increased. Thus, compared to the baghouse with the typical venturi, the one with the new venturi tube showed longer cleaning cycle time, less compressed air consumption, and lower dust cleaning energy consumption during the same filtration time. In addition, the average dust emission concentration was lower in the new venturi baghouse (4.38 mg/m3), compared to the typical one (6.82 mg/m
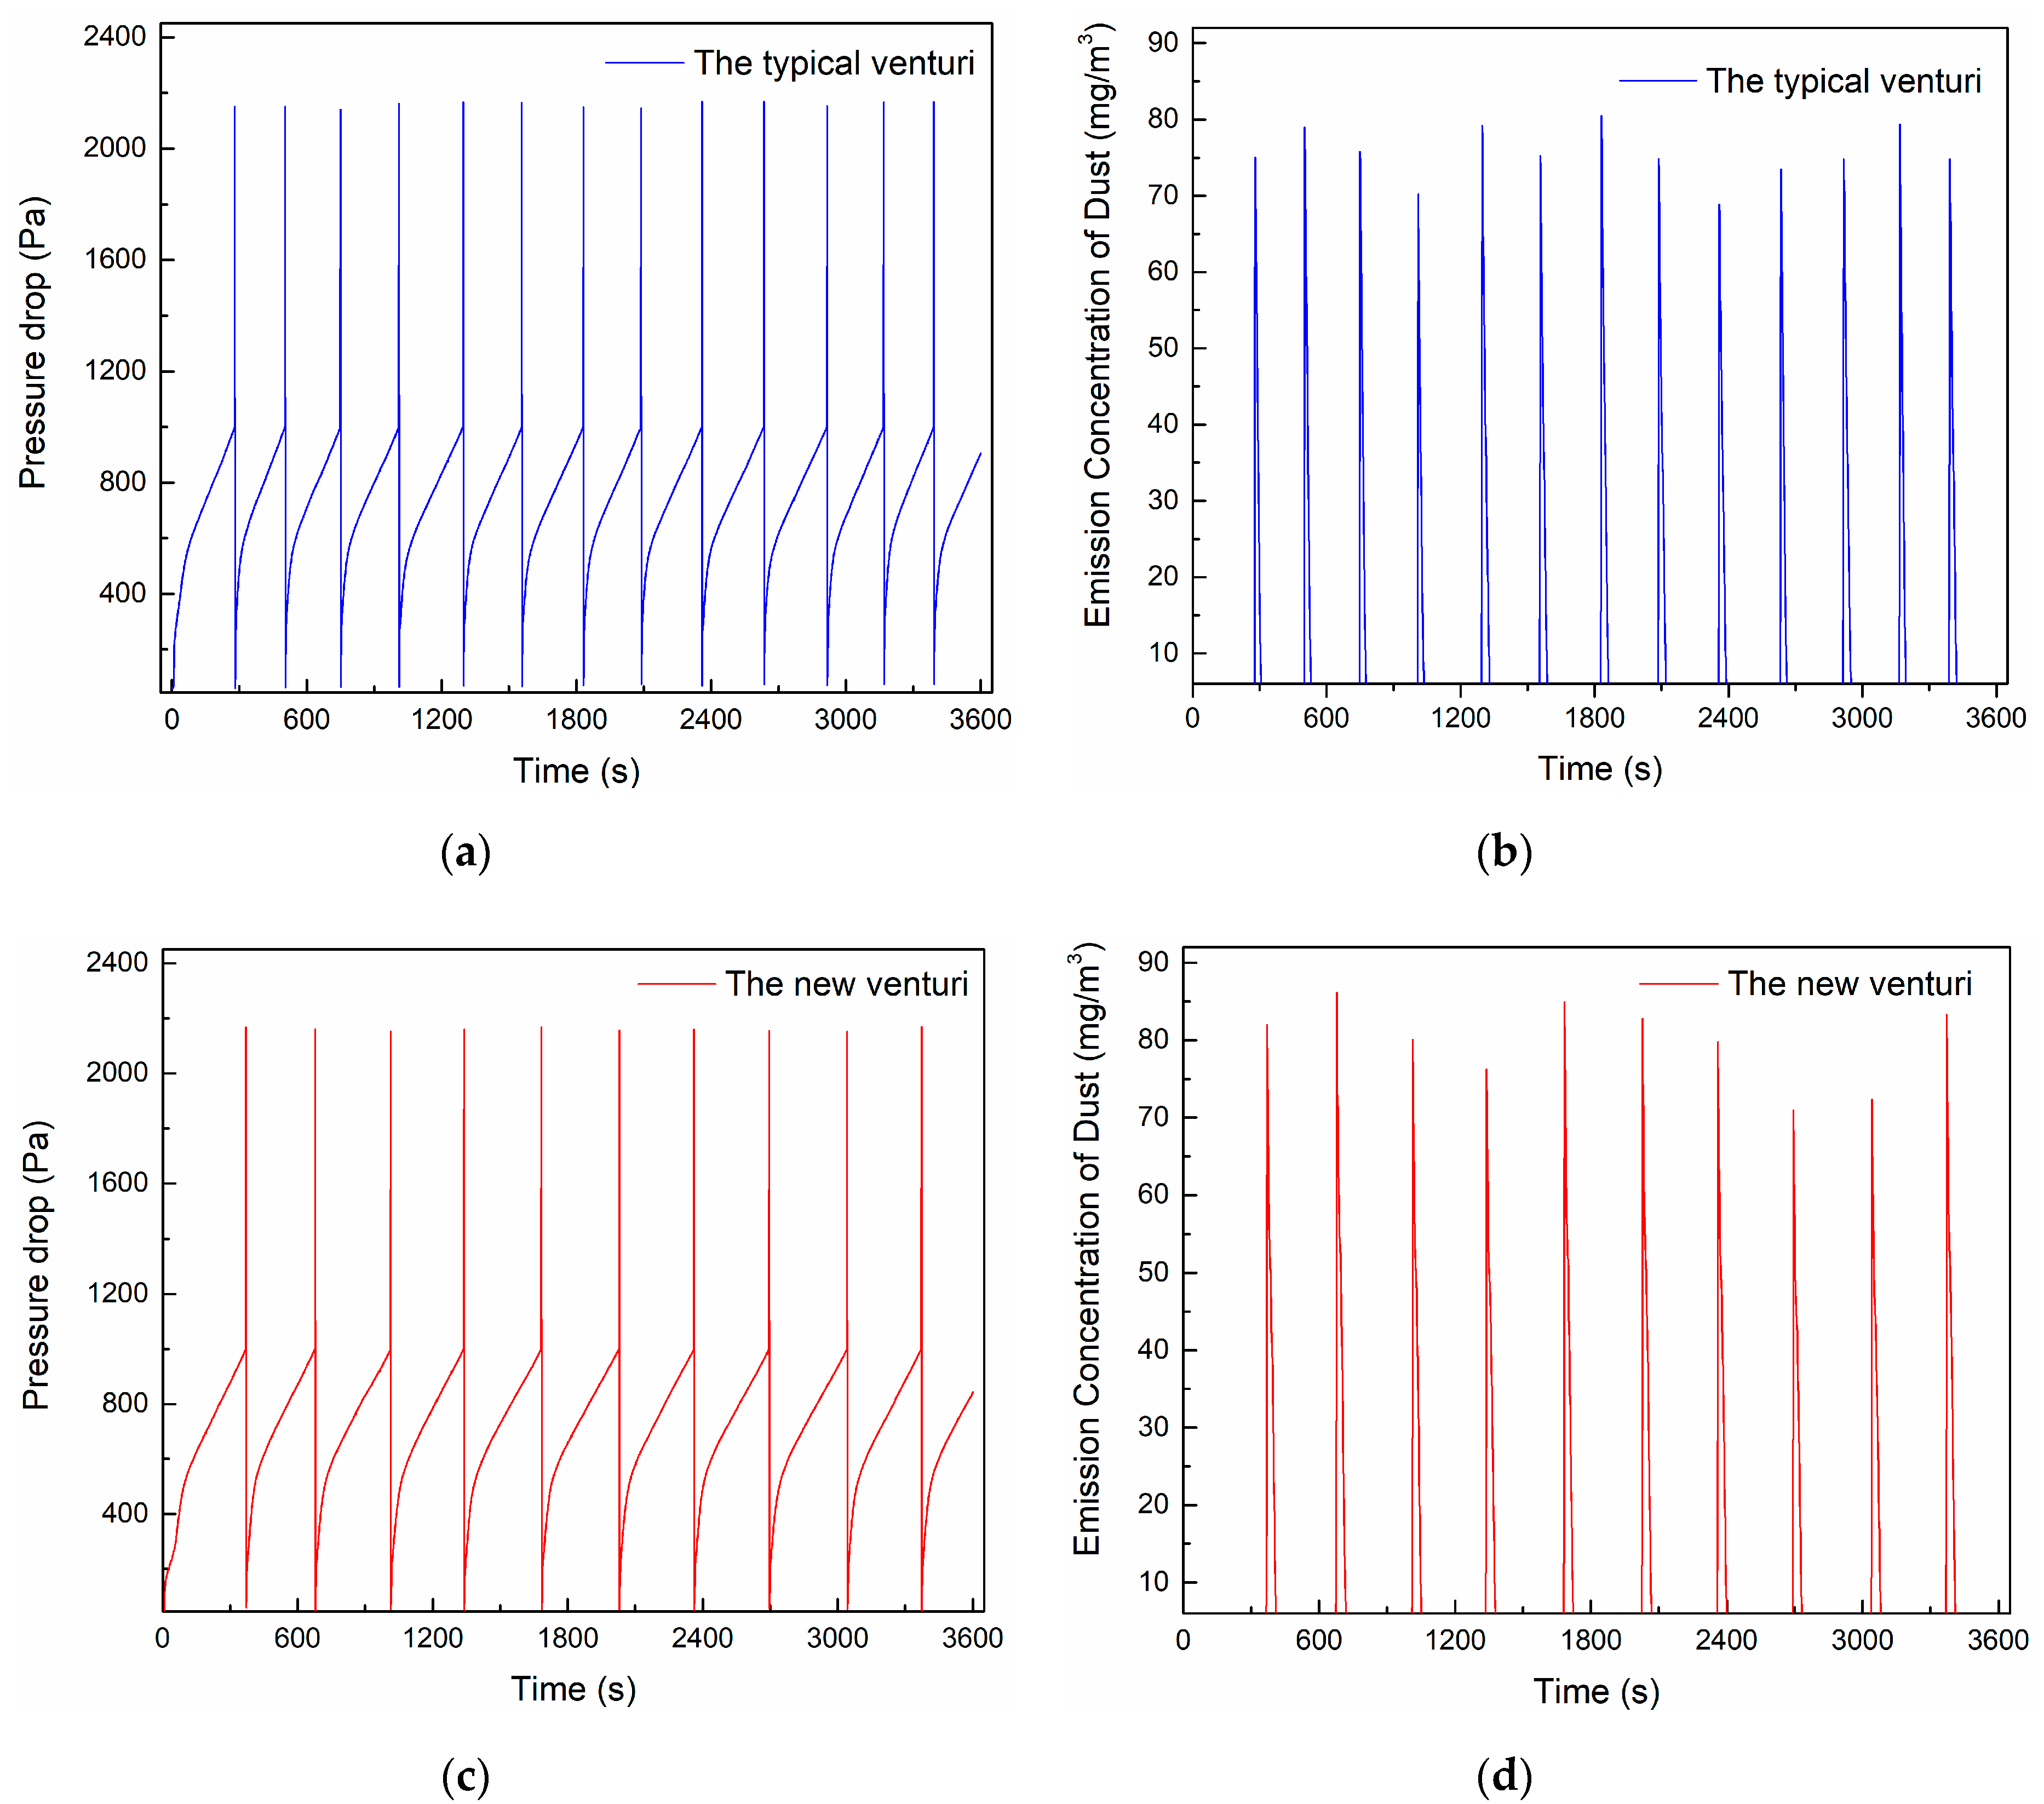
3). These results may indicate that the new venturi baghouse displayed a better control effect on dust emission. A potential explanation for this phenomenon is as follows: the cleaning airflow might have destroyed the dust cake deposited on the filter bag. In consequence, the filter bag was exposed to the dust-laden airflow. Shortly after the cleaning and before the dust cake was redeposited again, an instantaneous peak of the dust emission concentration occurred [23,24,25]. During the 1-h test period, the baghouse with the typical venturi showed a shorter cleaning cycle and more bag cleaning times (as shown in Figure 16). Additionaly, the number of peak values for the dust emission concentrations, the dust leakage quantity, and the dust emission concentration were higher. Additionally, in the new venturi-type design, the dust cleaning pressure in the area near the mouth of the filter bag was changed into a positive one. This allowed a more effective removal of the dust cake deposited near the mouth of the filter bag (Figure 13b). Thus, compared to the baghouse adapted with the typical venturi-type (as shown in Figure 9b), the former displayed a larger filtration area. This was one of the reasons for the low dust emission concentration of the baghouse installed with the new venturi.

4. Conclusions

In this paper, the effect of venturi structures on baghouse dust cleaning performance was reported. Peak pressure and peak pressure arrival time were tested on the filter bags. On this basis, a new venturi-type tube was designed, and the influence of the new device on the cleaning cycle time and dust emission concentration of the baghouse were studied. The specific conclusions are as follows:
  • The pulsing air pressure had a great influence on the cleaning performance of the filter bag: the greater the pulsing air pressure, the greater the peak pressure and the smaller the peak pressure arrival time. Increasing the pulsing air injection time had no significant effect on the peak pressure of the filter bag; however, it increased the peak pressure arrival time, which might have weakened the dust cleaning efficiency.
  • The smaller the venturi throat diameter, the greater the resistance of the cleaning airflow passing through the venturi, and the greater the cleaning airflow energy loss, thus reducing the peak pressure and increasing the peak pressure arrival time. In additon, the shorter the venturi length, the smaller the resistance and the cleaning airflow energy loss, the larger the peak pressure, and the shorter the peak pressure arrival time.
  • Compared with the typical venturi, in the new design, the peak pressure as well as the secondary volumetric airflow entering the filter bag increased. In addition, the peak pressure distribution changed, and a positive pressure was achieved near the bag mouth. With this, the area near the filter bag mouth can be effectively cleaned and the filtering capacity properly restored. This effect is equivalent to increasing the filtration area in the vicinity of the bag mouth, compared with the typical venturi.
  • Compared to the typical venturi baghouse, the one with the new design displayed longer average cleaning cycle time and lower energy consumption. Additionally, the new venturi tube reduced the average dust emission concentration and improved the dust-collecting effect of the baghouse.

Author Contributions

X.L. had the original idea for the study and performed the research. All authors of this paper also participated directly, either in the planning, execution, or analysis of this study. H.S. was responsible for the recruitment and follow-up of study participant. All authors read and approved the final manuscript.

Funding

This research was supported by the National Key Research and Development Program of China (Grant No. 2018YFC0705300) and the Fundamental Research Funds for the Central Universities (Grant No. CUSF-DH-D-2017093).

Acknowledgments

The authors would like to thank all the editors and reviewers who provided constructive feedback and suggestions.

Conflicts of Interest

The authors declare no conflict of interest.

References

  1. Thomas, D.; Penicot, P.; Contal, P.; Leclerc, D.; Vendel, J. Clogging of fibrous filters by solid aerosol particles experimental and modelling study. Chem. Eng. Sci. 2001, 56, 3549–3561. [Google Scholar] [CrossRef]
  2. Jeon, K.J.; Jung, Y.-W. A simulation study on the compression behavior of dust cakes. Powder Technol. 2004, 141, 1–11. [Google Scholar] [CrossRef]
  3. Simon, X.; Chazelet, S.; Thomas, D.; Bémer, D.; Régnier, R. Experimental study of pulse-jet cleaning of bag filters supported by rigid rings. Powder Technol. 2007, 172, 67–81. [Google Scholar] [CrossRef]
  4. Lo, L.M.; Chen, D.-R.; Pui, D.Y.H. Experimental study of pleated fabric cartridges in a pulse-jet cleaned dust collector. Powder Technol. 2010, 197, 141–149. [Google Scholar] [CrossRef]
  5. Sievert, J.; Löffler, F. Fabric cleaning in pulse-jet filters. Chem. Eng. Process. Process Intensif. 1989, 26, 179–183. [Google Scholar] [CrossRef]
  6. Saleem, M.; Krammer, G. Effect of filtration velocity and dust concentration on cake formation and filter operation in a pilot scale jet pulsed bag filter. J. Hazard. Mater. 2007, 144, 677–681. [Google Scholar] [CrossRef]
  7. Simon, X.; Bémer, D.; Chazelet, S.; Thomas, D.; Régnier, R. Consequences of high transitory airflows generated by segmented pulse-jet cleaning of dust collector filter bags. Powder Technol. 2010, 201, 37–48. [Google Scholar] [CrossRef]
  8. Morris, W.J. Cleaning mechanisms in pulse jet fabric filters. Filtr. Sep. 1984, 21, 50–54. [Google Scholar]
  9. Grannell, S.K.; Seville, J.P.K. Effect of Venturi Inserts on Pulse Cleaning of Rigid Ceramic Filters; Karlsruhe Institute of Technology (KIT): Karlsruhe, Germany, 1999. [Google Scholar]
  10. Morris, K.; Cursley, C.J.; Allen, R.W.K. The role of venturis in pulse-jet filters. Filtr. Sep. 1991, 28, 33–36. [Google Scholar] [CrossRef]
  11. Lu, H.C.; Tsai, C.J. A pilot-scale study of the design and operation parameters of a pulse-jet baghouse. Aerosol Sci. Technol. 1998, 29, 510–524. [Google Scholar] [CrossRef]
  12. Lu, H.C.; Tsai, M.L.; Tsai, C.J. The influence of different types venturi on bag cleaning performance. J. Aerosol Sci. 1998, 29, 241. [Google Scholar] [CrossRef]
  13. Tsai, C.-J.; Tsai, M.-L. Effect of filtration velocity and filtration pressure drop on the bag-cleaning performance of a pulse-jet baghouse. Sep. Sci. Technol. 2000, 35, 211–226. [Google Scholar] [CrossRef]
  14. Bi, Y.X.; Zhang, M.X.; Chen, J.D.; Chen, H.Y.; Qian, Y.L.; Zhou, R. Influence of venturis on bag cleaning of a pulse-jet filtration system. Chin. J. Environ. Eng. 2013, 7, 4481–4485. [Google Scholar]
  15. Andersen, B.O.; Nielsen, N.F.; Walther, J.H. Numerical and experimental study of pulse-jet cleaning in fabric filters. Powder Technol. 2016, 291, 284–298. [Google Scholar] [CrossRef]
  16. Humphries, W.; Madden, J.J. Fabric filtration for coal-fired boilers:dust dislodgement in pulse jet filters. Filtr. Sep. 1983, 20, 40–42. [Google Scholar]
  17. Lu, H.C.; Tsai, C.J. Influence of design and operation parameters in bag-cleaning performance of puls-jet baghouse. J. Environ. Eng. 1999, 125, 583–591. [Google Scholar] [CrossRef]
  18. Lo, L.M.; Hu, S.-C.; Chen, D.-R.; Pui, D.Y.H. Numerical study of pleated fabric cartridges during pulse-jet cleaning. Powder Technol. 2010, 198, 75–81. [Google Scholar] [CrossRef]
  19. Yan, C.; Liu, G.; Chen, H. Effect of induced airflow on the surface static pressure of pleated fabric filter cartridges during pulse jet cleaning. Powder Technol. 2013, 249, 424–430. [Google Scholar] [CrossRef]
  20. Qian, Y.; Bi, Y.; Zhang, M.; Chen, H.; Xu, G. Effect of filtration operation and surface treatment on pulse-jet cleaning performance of filter bags. Powder Technol. 2015, 277, 82–88. [Google Scholar] [CrossRef]
  21. Li, J.-W.; Shen, H.-G.; Yang, Y.; Qu, X.-Y.; Huang, H. Experimental study and analysis on the sidewall maximum pressure of the pulse bag filter. J. Saf. Environ. 2016, 16, 268–271. [Google Scholar]
  22. Lü, J.; Yan, C.-P.; Yuan, C.-Y.; Fu, Y.; Li, X.; Chen, H.-Y. Effect of the pulse pressure and the jet distance on the cleaning performance of the long pulse-jet filter bag. J. Saf. Environ. 2016, 16, 285–288. [Google Scholar]
  23. Yao, Y.P.; Shen, Z.A.; Liu, M.L. Research on dust emissions impact factors of electrostatic fabric hybrid particulate collector and fabric filter. Environ. Eng. 2016, 34, 70–74. [Google Scholar]
  24. Shim, J.; Joe, Y.-H.; Park, H.-S. Influence of air injection nozzles on filter cleaning performance of pulse-jet bag filter. Powder Technol. 2017, 322, 250–257. [Google Scholar] [CrossRef]
  25. Liu, X.; Shen, H.; Nie, X. Study on the filtration performance of the baghouse filters for ultra-low emission as a function of filter pore size and fiber diameter. Int. J. Environ. Res. Public Health 2019, 16, 247. [Google Scholar] [CrossRef] [PubMed]
Figure 1. Schematic diagram of peak pressure and peak pressure arrival time at a measuring point.
Applsci 09 03687 g001
Figure 2. The two types of venturi tubes and their arrangement in the bag cage and filter bag. (a) Bag cage with the typical venturi. (b) Structural parameters of the typical venturi. (c) Typical venturi tube installed in a filter bag. (d) Comparison of bag cages adapted with the two types of venturi tubes. (e) The new venturi. (f) The new venturi tube installed in a filter bag.
Applsci 09 03687 g002
Figure 3. Experimental bench approach for determining the pulse jet cleaning performance. (a) Schematic diagram of the pulse jet cleaning experimental device and (b) the distribution of the measuring points on the filter bag. P0–P8 are the numbers of the measuring points.
Applsci 09 03687 g003
Figure 4. Semi-industrial baghouse experimental device.
Applsci 09 03687 g004
Figure 5. Effect of the pulsing air pressure on peak pressure of filter bag.
Applsci 09 03687 g005
Figure 6. Effect of pulsing air pressure on the peak pressure arrival time.
Applsci 09 03687 g006
Figure 7. Effect of the pulsing air injection time on peak pressure of filter bag.
Applsci 09 03687 g007
Figure 8. Effect of the pulsing air injection time on the peak pressure arrival time of filter bag.
Applsci 09 03687 g008
Figure 9. Effect of venturi throat diameter on the peak pressure of filter bag. (a) Plotted data indicates the peak pressure at each measuring point on the filter bags with different venturi throat diameters. (b) Schematic diagram showing the distribution of the cleaning pressure on a filter bag with the typical venturi-type tube.
Applsci 09 03687 g009
Figure 10. Effect of venturi throat diameter on peak pressure arrival time.
Applsci 09 03687 g010
Figure 11. Effect of venturi length on the arrival time of peak pressure.
Applsci 09 03687 g011
Figure 12. Effect of venturi length on peak pressure arrival time.
Applsci 09 03687 g012
Figure 13. Effect of the new venturi-type on peak pressure. (a) Peak pressure at each measuring point. (b) Schematic diagram showing the cleaning pressure distribution on a filter bag with the new venturi tube.
Applsci 09 03687 g013
Figure 14. Peak pressure arrival time measured in different points of the filter bag adapted with the new venturi tube.
Applsci 09 03687 g014
Figure 15. Average cleaning cycle time and average dust emission concentration of baghouses adapted with a typical venturi tube or a new venturi design.
Applsci 09 03687 g015
Figure 16. The variation of operating resistance and dust emission concentration of baghouses adapted with a typical venturi tube or a new venturi design. (a) The variation of operating resistance of baghouse with the typical venturi. (b) The variation of dust emission concentration of baghouse with the typical venturi. (c) The variation of operating resistance of baghouse with the new venturi. (d) The variation of dust emission concentration of baghouse with the new venturi.
Applsci 09 03687 g016
Table 1. Experimental design and arrangement.
Test DeviceTest No.The Pulsing Air Pressure.
P p u
(MPa)
The Pulsing Air Injection Time.
t P
(ms)
The Type of Venturi.The Throat Diameter of Venturi.
d e
(mm)
The Length of Venturi.
h
(mm)
Experimental bench for the performance of pulse jet cleaning
(see Figure 3)
10.3, 0.4, 0.5100Typical40200
20.4100, 150, 200Typical40200
30.4100Typical40, 50, 60200
40.4100Typical60160, 180, 200
50.4100New60160
Semi-industrial baghouse experimental device
(see Figure 4)
60.4100Typical60160
70.4100New60160

