Featured Application
Finite element theory was applied to determine the accuracy of a human anatomy model for potential use in the field of biomechanics. Furthermore, the proposed evaluation system can be applied in other prosthetic and orthotic research applications.
Abstract
Recent technologies have suggested the utilization of three-dimensional (3D) printing technology to enhance the fabrication accuracy of prosthetics. Accordingly, simulations are used to obtain precise parameters for subject-specified prosthetic socket. This study proposes an evaluation system to measure the accuracy of a subject-specific 3D transfemoral residuum model during the interaction with the socket in conjunction with the application of finite element methods. The proposed system can be used in future validations of socket fabrication. The evaluation is based on the measurement of the residuum’s soft tissue deformation inside two types of prosthetic sockets. In comparison with other studies, the 3D models were constructed with magnetic resonance images (MRI) with the aid of computer-aided design (CAD) software. The measurement of soft tissue deformation was conducted based on the measurement of the volumetric value of fat, muscle and skin in the pre- and post-donning phases. The result yielded a promising correlation coefficient value between the simulation and the experiment in the soft tissue deformation evaluation. The relation of the muscle–fat ratio in the residuum is extremely important in the determination of the ability of the prosthetic to deform. The environment during the socket fitting session was similar to that defined by the set boundary conditions in simulations. In view of the promising results of this study, the evaluation system proposed herein is considered reliable and is envisaged to be used in future research.
1. Introduction
Prosthetic device manufacturing has increased tremendously owing to an increased demand in recent years. This demand has been driven by the increase of amputees that require the prosthetic device to perform their daily routines. In Japan, the proportion of amputees increased to 22.4% compared to the statistic reported five years ago because the number of patients with peripheral vascular disease has increased []. Conventional prosthetic device manufacturing has been depended on hand craftsmanship, expertise skills and experience. As a result, current socket design and fitting are inconsistent and vary among prosthetic manufacturers. Furthermore, the process requires considerable time before the end product is obtained and it is really exhausting for the patients who are mostly elderly citizens []. Recent developments and applications in biomechanics introduced the utilization of a three-dimensional (3D) printing system to enhance the process of socket design. As reported by Zuniga [], 3D printers have been utilized to develop prosthetic devices using antibacterial filaments. The investigation found that the 3D printer is capable of developing effective antibacterial finger prosthesis. Furthermore, the potential of 3D printing in the fabrication of the transfemoral prosthetic socket has also been discussed. According to Nguyen et al. [], the design and 3D printing of the transfemoral prosthetic socket required less time compared to conventional methods. However, the evaluation for 3D printing prefabrication has not been discussed in most of the previously published research studies [,,,].
Finite element analysis (FEA) is extensively used in the evaluation of human anatomy models. For example, in Reference [], internal strains of transtibial prosthetics have been investigated during load bearing using FEA. Furthermore, investigation of specified prosthetic socket interactions with the transfemoral residuum was also conducted with the same method by measuring the interface pressure on the surface of the residuum []. In addition to the prosthetic and orthotic field, FEA was also extensively used in dentistry to develop a future implant. In Reference [], the development of finite element models from medical images was presented using automated methods. As a result, the proposed methodology revealed its potential to solve linear elasticity problems in two-dimensional (2D) and 3D implementations. Even though the FEA method was extensively used in the evaluation of a 3D model in terms of the stress distribution [], strain measurement and mechanical properties, the geometrical and volumetric changes in the simulation can also be analyzed. For instance, in Reference [], an approach to modelling the contact interface between transtibial residuum and prosthetic socket has been developed. However, the presented model was used to investigate the stress distribution along the residuum and no indication of comparison with experimental comparison were observed. Volumetric changes constitute an important quantitative factor for the determination of the level of comfort during the period the prosthetic socket is worn. In Reference [], they concluded that patient-specific analyses of the residuum were important for evaluation of potential deep tissue injury as a result from soft tissues changes inside the prosthetic socket. The outcome enables the expert designer to modify the prosthesis and thus improve the stability and durability of the prosthetic socket. Combination of the FEA method with image processing allows the development of a geometrical model system for pre- and post-fabrication evaluation of prosthetic devices.
In this study, we propose an overall evaluation scheme of two 3D transfemoral prosthetic socket models constructed using magnetic resonance images (MRI) (based on the UCLA and manual casting compression technique (MCCT)) in conjunction with a finite element method (FEM). The evaluation is based on the geometrical and volumetric changes of a residuum model before and after the simulation of the donning procedure. The geometrical model is compared with the model developed with precise image processing (IP) software that was considered as most accurate model to the real residuum. The procedure adopted in this study includes the following steps. First, the finite element models of the residuum and prosthetic socket were developed using MRI with the aid of CAD software using a construction methodology created by our team. The donning simulation was then performed which was created based on real-fitting conditions. The simulation results are converted to cross-sectional data along the z axis and reconstructed to imitate the MRI image specifications. The soft tissue volume is calculated based on the reconstructed simulated images. Finally, the volume calculations are compared with the experimental outcomes. The study is motivated by the high demand for the prosthetic socket in recent years but the process of socket fabrication requires special treatment and craftmanship from prosthesis and an alternative method of pre-fabricated socket evaluation is necessary to shortening the overall process.
2. Materials and Methods
The study involved three subjects. The main criteria of the selected subjects are that they must have a single above knee (transfemoral) amputated leg. All selected subjects have more than 5 years of experience wearing the prosthetic socket. The subjects are a volunteer and have no conflict of interest in the research. The magnetic resonant (MR) images for the subjects were obtained using a Siemens Magneton Symphony Maestro class 1.5 T. The MR image was chosen owing to its ability to generate excellent soft-tissue contrast and to differentiate soft tissues and muscle boundaries [,]. In Reference [], MR image also has been used to create the resemblance of residuum model. However, the created model only utilized the outer area of the residuum cross section image. Residuum model created in the study is categorized into 3 main parts namely fat, muscle and bone. The adipose tissue part is assumedly merged with the fat part because of the similarities of their mechanical properties. Two Ischial–Ramal–Containment (IRC) socket types—namely UCLA and MCCT—were used in this study. The IRC–UCLA socket is a standardized transfemoral prosthetic socket that is extensively used, while the IRC–MCCT is a socket introduced by Professor Yukio Agarie in Japan. The socket was inspired and created based on the standard IRC socket. The difference between the two sockets is that the stability of the IRC–MCCT socket was improved by the adjustment of the anterolateral and sagittal directions of the IRC–UCLA socket [], as shown in Figure 1 and the method used to produce the IRC–MCCT socket uses MCCT.
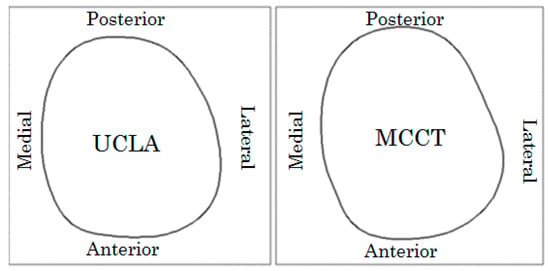
Figure 1.
Top cross-sectional views of the sockets constructed based on theUniversity of California Los Angeles (UCLA) and manual casting compression technique (MCCT) types. The different lateral sides toward the anterior direction are clearly distinguished.
2.1. Finite Element Model Construction
Instead of using a 3D scanner, this study has proposed a low-cost, accurate method where computer-aided design (CAD) Creo software (PTC Ltd., New Delhi, India) has been used to construct the transfemoral residuum and its socket. The utilization of MR images is recommended because its provided distinction between muscle, fat, skin inside the soft tissue image []. Each subject provided 30 MR images which are aligned in the vertical direction with 5 mm spacings between successive images, as shown in Figure 2a. In every image, 36 trajectory lines were drawn from the center point of the residuum slice every 10°, as shown in Figure 2b. Every intersection between each trajectory line and the residuum slice is plotted and connected with a spline curve function using CAD software to generate a cross-section for the image, as shown in Figure 2c. Finally, every cross-section will be combined to construct the 3D model of the residuum shown in Figure 2d. The same procedure will be implemented to create the socket model. The socket model was created using the real size of the prosthetic and not a residuum shape offset as practiced in most previous research studies. The design method has been discussed in detail in Reference [].
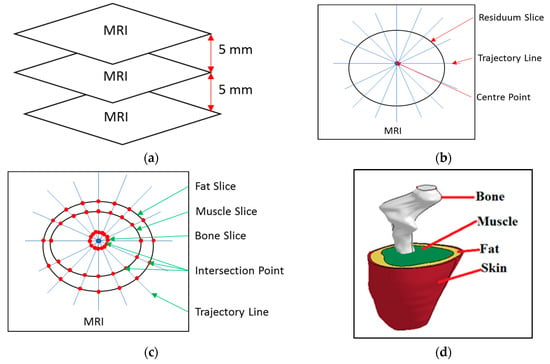
Figure 2.
3D model construction process. (a) Magnetic resonance (MR) images aligned horizontally with 5 mm spaces between successive images. (b) Trajectory line construction from the center point. (c) Plot of an intersection between the residuum slice and trajectory line. (d) Constructed 3D model based on the combination of the intersection of the spline curve from every image with the use of a sweep blend function in the computer aided design (CAD) software.
Creo 3 (PTC Ltd., New Delhi, India) is a CAD software used to generate a surface dimension file format such as an initial graphics exchange specification (IGES) file and standard triangular language (STL) file and it enabled the meshing process to be conducted directly without file conversion. In this study, the model is required to be meshed using Ls-Prepost software (Livermore Ltd., California, CA, US) with a tetrahedra element is set to be the main element type.
2.2. Simulation Boundary Condition
The fitting procedure is an effort used to maximize the comfort and functionality of a prosthetic limb and to achieve an appropriate fit. It is effectively a trial-and-error method used to determine the socket volume and shape. This study has used the fitting procedure condition as a benchmark for the simulation condition. The basic principle in the simulation relies on the fact that the residuum ought to move toward the socket. In the residuum, 50% of its body weight is at the top to emulate the bipedal stance, as shown in Figure 3a. Regarding the socket, the horizontal movement has been constrained to realize the contact between the residuum, as shown Figure 3b. The first contact was defined as the surface-to-surface contact between the socket and residuum with a coefficient of friction of 0.5, as suggested in Reference [,]. The second contact was defined as the tied contact between bone–muscle and muscle–fat. The contact defined the base on the hypothesis of relative motion between skin–fat and fat–muscle was neglected [].
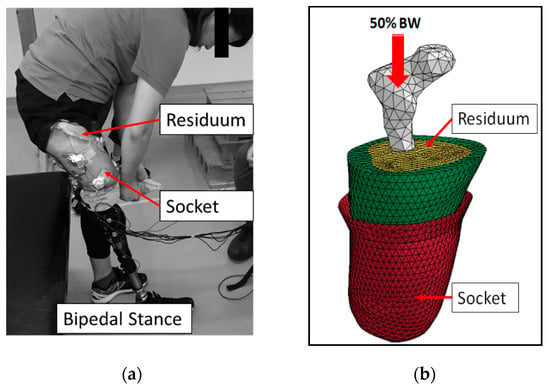
Figure 3.
Simulation boundary condition. (a) Actual fitting session and bipedal stance. (b) Donning simulation of the fitting session with 50% of body weight (BW).
2.3. Mechanical Properties Used in Simulations
The material properties were classified into solid and viscoelastic. The bone and socket were categorized as solid materials and were defined as homogenous and linearly elastic, according to Hooke’s law, based on which stress varies linearly with strain. The bone was modeled with a Young’s Modulus (YM) of 17,700 MPa and a Poisson’s ratio (PR) of 0.3 []. Acrylic plastic was used to construct both sockets with YM and PR values equal to 1885 MPa and 0.39, respectively. Viscoelastic materials are representative for skin, fat and muscle and where defined as soft tissues. The viscoelastic formulation parameter used in the simulation was listed in Table 1 where C, S, T and K, respectively denote the invariants of the right Cauchy deformation tensor, spectral strength, characteristic time and bulk modulus [,,].

Table 1.
Mechanical properties of viscoelastic material.
2.4. Simulation and Acquisition Outcomes
For simulation purposes, LS–DYNA software (Livermore Ltd., California, US) was used to generate the nonlinear dynamic donning simulation. The simulation was conducted in the case of donning with the MCCT and UCLA sockets in the bipedal stance position. At the end of the simulation, the shape of the residuum was deformed and was fitted to the socket. The analysis of the geometrical and volume changes was conducted at the end of the simulation following the steps listed in Figure 4.
Figure 4.
Flow chart of outcome acquisition process.
First, the completed simulation model was sectioned horizontally every 5 mm from the bottom of the model. The sliced model was trimmed and converted into a binary image. Binary images were used to calculate the area of the residuum’s cross-section (Ai) during the donning process. The volume of the residuum was calculated with Equation (1), where A and h respectively denote the cross-sectional area and the height between successive cross-sections.
To calculate the pixel ratio of the simulation image, a raw volume ratio was calculated for both the simulations and experiments. The volume ratios (RV) for the simulations and experiments were determined based on Equation (2), whereby Vp and Vs respectively denote the volume of the part and cross-section in a single image. Fixed average volume ratios of simulations and experiments are shown in Equation (3), whereby RSV, REV and n, respectively denote the simulation volume ratios, experiment volume ratios and numbers of utilized images.
The actual volume of the simulation was determined by multiplying the average volume ratio (RFA) with the cross-sectional volume for every layer of the model. Finally, the model volume was compared with the value obtained from the image processing (IP) analysis.
IP analysis was calculated by Matlab (MathWork) by summarizing an area of cross section from the filtered MR image. The image was converted into the desired scale and transformed into a binary image. In the binary image, every white pixel’s area was summarized. The calculation was continually performed in every MR image. The volume of the IP model was calculated by inserting the calculated area into Equation (1).
3. Results
In this study, a three tetrahedral finite element model was created corresponded to the number of subjects. Every subject provided with two prosthetic socket model corresponded to UCLA and MCCT socket. Table 2 shows the list of number of element and nodes for each of the subject and their socket.

Table 2.
List of elements and nodes unit.
Table 3 showed the list of subjects’ profiles involved in the study. The study focused on the transformation of the geometrical model based on the donning simulation. The result was collected from three parts of the model before and after donning was completed. Figure 5a shows an initial environment for the donning simulation, while Figure 5b shows the simulation result after the donning process is completed. The complete residuum model was then sectioned in 30 cross-sections along the z axis, binary images were generated, as shown in Figure 5c, which shows the fat part of subject A as an example.

Table 3.
Subject profiles.
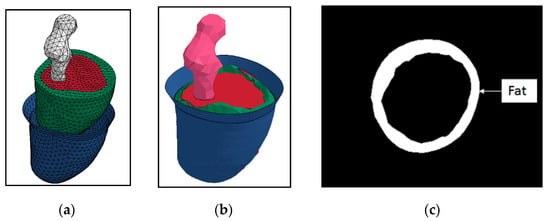
Figure 5.
(a) Initial condition of donning simulation. (b) Results of complete donning simulation for subject A. (c) Sample of binary image created from subject A to complete the donning process.
All the part volumes were determined layer-by-layer for each subject, as shown in Figure 6. The results consist of the image processing measurement (IP) and finite element simulation (FEA) outcomes for the three subjects with errors between both measurements. The volume measured before donning is denoted by the NO symbol. The corresponding volumes after the residuum was donned in both the MCCT and UCLA sockets are denoted with the symbols MCCT and UCLA, respectively.
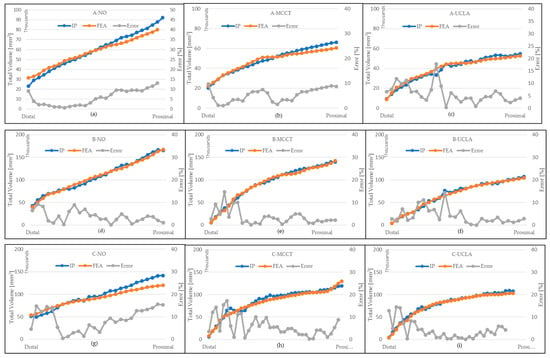
Figure 6.
Volumes of all parts in every layer for each subject. IP denotes the measurement of volume from image processing method, finite element analysis (FEA) denotes the measurement of volume from a simulation and Error denotes the percentage of differences between image processing (IP) and FEA measurement. (a) Volumes for subject A without socket and with (b) MCCT and (c) UCLA sockets. (d) Volumes for subject B without socket and with (e) MCCT and (f) UCLA sockets. (g) Volumes for subject C without socket and with (h) MCCT and (i) UCLA sockets.
Increased correlation coefficient values (R2) were obtained in most of the models and the errors (Err) which occurred for the total volumes are acceptable, as shown in Table 4. Increased correlation values (>0.9) indicate the similarities of the FEA model to the actual residuum. This is attributed to the fact that the IP model yielded the most accurate volume measurements. All the FEA models yielded average errors which were less than 9% for each layer.

Table 4.
Correlation coefficient values of residuum volumes for the FEA and IP models and average errors.
Figure 7 shows the anterior cross-sectional views of the FEA residuum models of the three studied subjects before and after the penetration of the residuum models inside the sockets. It is clearly shown that the residuum has changed into the socket shape after its complete penetration. The movement of the soft tissue during the process is not controlled by the user. In other words, the changes of the soft tissue depended on the simulation boundary condition.
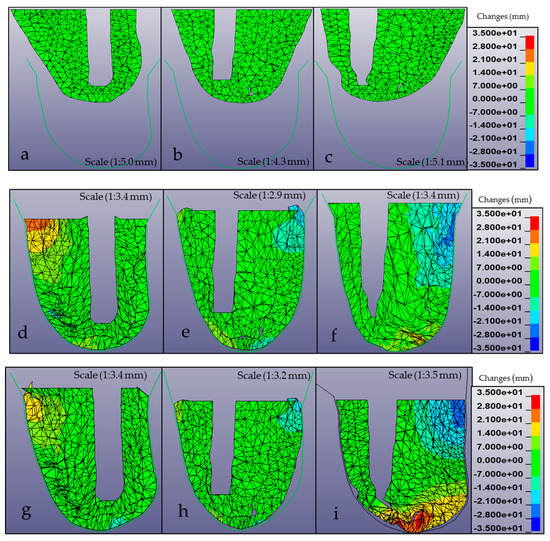
Figure 7.
Heat map of a residuum deformation from anterior cross-section view before and after the donning process. (a–c) Residuum models shown before the donning process for subjects (a) A, (b) B and (c) C. (d–f) Results of complete donning into the MCCT socket for subjects (d) A, (e) B and (f) C. (g–i) Corresponding results of the complete donning into the UCLA socket for subjects (g) A, (h) B and (i) C.
Volumetric changes were observed for soft tissue parts only when the bone part was considered as solid and unchanged. Figure 8 shows the deformation graph of the residuum during the insertion into the MCCT and UCLA socket for both simulations and measurements. The measurement included the deformations of the total soft tissue, fat and muscle. The error bars indicate different volume values for IP and FEA data. The positive and negative values indicate that the volumes respectively increased or decreased during the complete donning process. The correlation coefficient between simulations and measurements remained high. In most cases, fat changes are significant compared to muscle and they mostly contribute to the total soft tissue deformation. In the cases of subjects A and C, the fat and muscle volume decreased in the distal area while they increased in the proximal area in both socket types. However, the fat rapidly changed in the proximal area and corresponded to the enlargement of the muscle. The maximum increase of fat volume occurred in the distal end, whereby during the fitting session, the residuum was theoretically pushed toward the distal end before the socket was vacuumed. The decrease of the volume corresponded to the increase of the residuum length. When the fat was pushed downward, the residuum was shrunk to fit the socket and the total length of the residuum pushed the distal fat. The result supported the assumption that during socket penetration, the residuum tended to shrink to fit the socket shape by pushing the soft tissue downward and thus allowed the length of the residuum to increase.
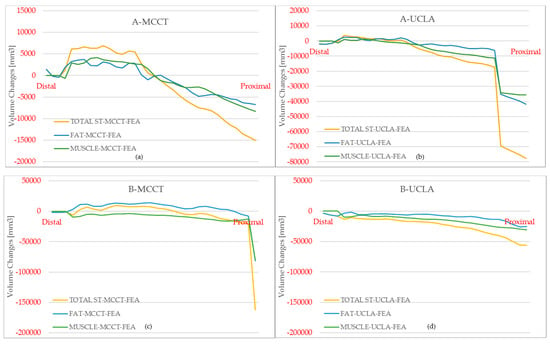

Figure 8.
Variations of the volumes of deformed soft tissue for total soft tissue, fat and muscle. (a) Results for subject A with the MCCT socket. (b) Results for subject A with the UCLA socket. (c) Results for subject B with the MCCT socket. (d) Results for subject B with the UCLA socket. (e) Results for subject C with the MCCT socket. (f) Results for subject C with the UCLA socket.
The simulation (FEA) results for subjects A and C indicate that the fat increases in the distal area of the MCCT socket are 18.5% and 23.69%, respectively shown in Figure 8. Additionally, in the distal area of the UCLA socket, the fat respectively increased by 6.63% and 1.68%. However, in the proximal area, the fat respectively decreased by 7.53% and 3.67% in the MCCT socket and by 11.96% and 1.99% in the UCLA socket. Based on the evoked outcomes, we can verify that the fat volume increased in the distal area and decreased in the proximal area of the residuum. The increase of the fat’s volume in the distal area led to the increase of the residuum length.
4. Discussion
In this study, the geometrical changes had a primary role in the determination of the efficiency of the overall evaluation system. In order to check the result of donning simulation, a special process for taking the MRI data wearing the developed sockets is necessary. This process is a burden for the subjects, so we limited the number of subjects when we applied to the ethical committee of our university. Even though the number of subjects participating in the study is low, it is enough to accomplish the geometrical changes observation objective.
In the cases where geometrical changes occurred, the correlation coefficient value was high in most cases. However, in most cases, low differences of the volumetric value occurred between simulations and measurements.
During the complete donning process, a higher deformation was observed in the fat part. The deformation of the fat part represented almost 70% of the total deformation and the changes were mostly in the distal area where the muscle volume was low. Th effects of the mean muscle density on deformation were more pronounced than those for fat and the lower volume of the muscle allowed the fat to deform in an easier manner.
The simulation results from subject B showed a unique pattern of deformation based on the hypothesis that the fat volume decreased by 21.03% and 15.18%, respectively, in both the proximal and distal areas of the UCLA socket. The increased muscle–fat volume ratio in the residuum most likely affected the deformation because the density of each material affected the movement of the fluid inside the residuum. Subject B had the highest soft tissue volume among all the tested subject residuum values. As a result, the volume of the fat in the distal area has not significantly changed during the complete donning process. Even though subject B is the shortest in height among the others, the diameter of the residuum of subject B is the highest. There is no significant difference in the comparison of the simulation and measurement results for both sockets and a high-correlation coefficient value is estimated for these sets. Subject B has a history of wearing the socket. In this respect, the muscle has become used to the local environment and the elasticity of the residuum is likely to be low and tends to shrink during its insertion into the socket.
Figure 9 shows the error distributions of soft tissue volumes between FEA and IP measurements in every layer for each subject with and without sockets. The differences detected in the measured and simulated values are most likely caused by the fact that in the simulation cases, the muscle and the fat part are considered as one entity, while in real cases both parts are connected to each other. Furthermore, the internal fat inside the muscle was ignored in simulations, which led to fat volume decreases.
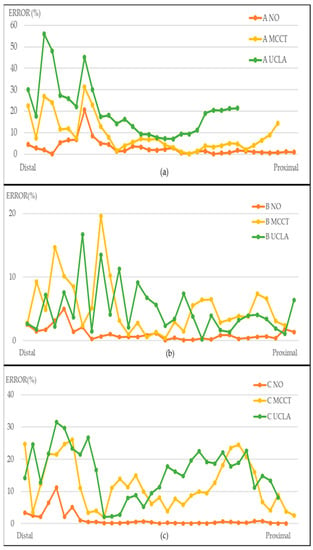
Figure 9.
Error distributions of soft tissue volumes between FEA and IP from the distal end to the proximal area with and without sockets. Results for subjects (a) A, (b) B and (c) C.
The highest error observed in the distal area of all part models is shown in Figure 10. Specifically, the average errors for the distal areas were respectively equal to 2.88%, 9.33%, 11.92%, 1.04% 13.07%, 13.1%, 1.26%, 12.02% and 20.09%, for subjects A, B and C, without the socket and with the MCCT and UCLA sockets. The error in the proximal area was 32% lower than the average distal area in every model. A significant error was observed in the distal area, most probably because the simulation model was designed from a visually clear, large planar area in the distal end, while the IP measurement was based on the differentiation of a small area which was very precise. In addition, the limitation on the meshing mechanism which was restricted to 20,000 units elements also affected the volume measurement in the FEA model. Furthermore, the boundary condition in the simulation reflected the result whereby most of the body weights of the subjects were located at the top parts of the residuum at which the force was not well distributed within the distal area because the soft tissue material had a high elasticity and density. As a result, the deformation in the distal area was not significant compared to the deformation in the proximal area.
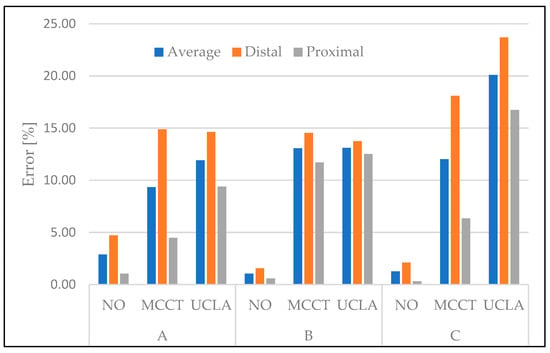
Figure 10.
Comparisons of average errors of IP–FEA for every tested model within the average, distal and proximal areas.
The graphical comparison between the FEA model and the actual MR images of the residuum is shown in Figure 11. The comparison is discussed in two parts and includes the position on the bone and the geometrical structure of the soft tissue. From the results, we can confirm that the FEA model was created at its actual inner position. Specifically, for subject A, the bone position was on the right side of the model, thus indicating that the residuum should be on the left. By contrast, for subjects B and C, the bone positions were on the left side, which indicates that the location of the residuum should be on the right side. After the complete penetration, the fat part of the FEA model tended to combine inside the muscle part owing to the fact that the density of the fat was lower compared to muscle. Correspondingly, this allowed the fat to deform easily compared to other tissues.

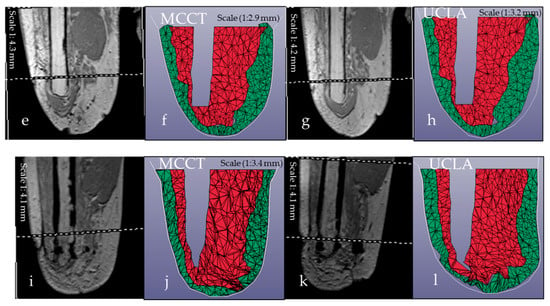
Figure 11.
Graphical comparison of FEA model and MRI during complete donning. (a,c) MR images of the residuum for subject A in the (a) MCCT and (c) UCLA sockets. (b,d) FEA simulation results for subject A after the completion of donning inside the (b) MCCT and (d) UCLA socket. (e,g) MR images for the residuum of subject B in the (e) MCCT and (g) UCLA sockets. (f,h) FEA simulation results of subject B after the completion of donning inside the (f) MCCT and (h) UCLA sockets. (i,k) MR images for the residuum of subject C in the (i) MCCT and (k) UCLA socket. (j,l) FEA simulation results of subject C after the completion of donning inside the (j) MCCT and (l) UCLA sockets.
5. Conclusions
In this study, the overall qualitative evaluation of the MCCT and UCLA sockets was presented in terms of the effects of the socket on the residuum’s geometrical changes. The results showed that the simulations and measurements for every subject exhibited considerable correlations and similarities. The FEM model created by the suggested method possessed various similarities with the real residuum. The differences detected were attributed to post operation scarring and to some merged skin on the residuum that cannot be created by the meshing method in the 3D construction. The calculation of geometrical changes was completed based on the bipedal stance condition, which has been extensively used in previous studies [,]. The increased correlation of the FEA and IP pressure outcomes confirmed that the finite element pressure distribution was reliable and could support the research objective.
The study also showed the efficiency of the FEM model created by the proposed method as an evaluation tool for the socket before its fabrication with 3D printing. The system was initiated to help engineers and manufacturers undergo an evaluation procedure before the transfemoral socket was fabricated by the 3D printer. Even though the simulation ignored the relative movement between each part inside the residuum, the results are still promising because the deformation of the residuum depends on the fluid movement inside the soft tissue parts []. The system is low-cost and low-maintenance and has user friendly interfaces with an added value for prostheses and fabricators to run as an evaluation system. The system was also able to reduce the time consumption during the fitting sessions and the number of sessions required for each subject. According to the promising results of this study, the system can potentially serve as an alternative method to the evaluation of the prefabricated socket. The use of the system and its capabilities is envisaged to allow the pursuit of numerous other research studies to evaluate the transfemoral socket and their uses for the determination of the level of deep-tissue injuries that occur inside the socket and in any other soft tissues of the human anatomy involved with the application of external forces.
Author Contributions
M.S.J. was the principal investigator and contributed to the analysis, data collection and summarization; Y.A. was the MCCT and UCLA socket fabrication leader; K.O. and H.O. contributed to the muscle analogy and socket design studies; A.H. and Y.S. contributed to the methodological validation, revision and approval of the manuscript.
Funding
This research was funded by JSPS KAKENHI Grant Number JP18K12143.
Acknowledgments
This work was supported by JSPS KAKENHI Grant Number JP18K12143.
Conflicts of Interest
The authors declare no conflict of interests. The limitation of the study is the experiment was conducted with 3 subject using approved procedure from Shibaura Institute of Technology (SIT) human research ethical committee.
References
- Sugimoto, A. Charactheristic of Stump Shape and Stress during Gait Cycle for Transfemoral Prosthesis Socket. Master’s Thesis, Shibaura Institute of Technology, Tokyo, Japan, 2013. [Google Scholar]
- Zhang, L.; Zhu, M.; Shen, L.; Zheng, F. Finite element analysis of the contact interface between trans-femoral stump and prosthetic socket. In Proceedings of the 2013 35th Annual International Conference of the IEEE Engineering in Medicine and Biology Society (EMBC), Osaka, Japan, 3–7 July 2013; pp. 1270–1273. [Google Scholar]
- Zuniga, J.M. 3D printed antibacterial Prostheses. Appl. Sci. 2018, 8, 1651. [Google Scholar] [CrossRef]
- Nguyen, K.-T.; Benabou, L.; Alfayad, S. Systematic Review of Prosthetic Socket Fabrication using 3D printing. In Proceedings of the 2018 4th International Conference on Mechatronics and Robotics Engineering—ICMRE 2018, Valenciennes, France, 7–11 February 2018; pp. 137–141. [Google Scholar]
- Lacroix, D.; Patino, J.F.R. Finite element analysis of donning procedure of a prosthetic transfemoral socket. Ann. Bioeng. 2005, 39, 2972–2983. [Google Scholar] [CrossRef] [PubMed]
- Alotta, G.; Barrera, O.; Cocks, A.; Di Paola, M. The finite element implementation of 3D fractional viscoelastic constitutive models. Finite Elem. Anal. Des. 2018, 146, 28–41. [Google Scholar] [CrossRef]
- Giovannelli, L.; Ródenas, J.; Navarro-Jiménez, J.; Tur, M. Direct medical image-based Finite Element modelling for patient-specific simulation of future implants. Finite Elem. Anal. Des. 2017, 136, 37–57. [Google Scholar] [CrossRef]
- Sengeh, D.M.; Moerman, K.M.; Petron, A.; Herr, H. Multi-material 3-D viscoelastic model of a transtibial residuum from in-vivo indentation and MRI data. J. Mech. Behav. Biomed. Mater. 2016, 59, 379–392. [Google Scholar] [CrossRef] [PubMed]
- Lee, W.C.; Zhang, M.; Jia, X.; Cheung, J.T.; Lee, C.C.W. Finite element modeling of the contact interface between trans-tibial residual limb and prosthetic socket. Med. Eng. Phys. 2004, 26, 655–662. [Google Scholar] [CrossRef] [PubMed]
- Portnoy, S.; Siev-Ner, I.; Shabshin, N.; Gefen, A. Effects of sitting postures on risks for deep tissue injury in the residuum of a transtibial prosthetic-user: A biomechanical case study. Comput. Methods Biomech. Biomed. Eng. 2011, 14, 1009–1019. [Google Scholar] [CrossRef] [PubMed]
- Mehta, B.V.; Rajani, S.; Sinha, G. Comparison of image processing techniques (magnetic resonance imaging, computed tomography scan and ultrasound) for 3D modeling and analysis of the human bones. Int. J. Digit Imaging 2017, 10 (Suppl. 1), 203–206. [Google Scholar] [CrossRef] [PubMed]
- Udai, A.D.; Sinha, A.N. Processing magnetic resonance images for CAD model development of prosthetic limbs socket. In Proceedings of the 2008 IEEE Region 10 and the Third International Conference on Industrial and Information Systems, Kharagpur, India, 8–10 December 2008. [Google Scholar]
- Jamaludin, M.S.; Hanafusa, A.; Yamamoto, S.-I.; Agarie, Y.; Otsuka, H.; Onishi, K. Evaluation of the effect of the geometrical changes in prosthetic socket towards transfemoral residuum via finite element method. In Proceedings of the IEEE–EMBS Conference on Biomedical Engineering and Science (IECBES), Sarawak, Malaysia, 3–6 December 2018. [Google Scholar]
- Jamaludin, M.S.; Hanafusa, A. Accuracy evaluation of 3D reconstruction of transfemoral residual limb model using basic spline interpolation. IFMBE Proc. 2017, 68, 675–680. [Google Scholar]
- Portnoy, S.; Yarnitzky, G.; Yizhar, Z.; Kristal, A.; Oppenheim, U.; Siev-Ner, I.; Gefen, A. Real-time patient-specific finite element analysis of internal stresses in the soft tissues of a residual limb: A new tool for prosthetic fitting. Ann. Biomed. Eng. 2007, 35, 120–135. [Google Scholar] [CrossRef] [PubMed]
- Van Tuan, L.; Yamamoto, S.; Hanafusa, A. Finite element analysis for quantitative evaluation of a trans-femoral prosthesis socket for standing posture. Int. J. Comput. Appl. 2017, 170, 1–8. [Google Scholar]
- Untaroiu, C.; Darvish, K.; Crandall, J.R.; Deng, B.; Wang, J.-R. Characterization of the lower limb soft tissues in pedestrian finite element models. In Proceedings of the 19th International technical conference on the Enhanced Safety of Vehicles, Washington, DC, USA, 6–9 June 2005; Volume 5, pp. 124–131. [Google Scholar]
- Lee, W.C.; Zhang, M.; Mak, A.F.; Lee, C.C.W. Regional differences in pain threshold and tolerance of the transtibial residual limb: Including the effects of age and interface material. Arch. Phys. Med. Rehabil. 2005, 86, 641–649. [Google Scholar] [CrossRef] [PubMed]
- Sanders, J.E.; Fatone, S. Residual Limb Volume Change: Systematic Review of Measurement and Management. J. Rehabil. Res. Dev. 2011, 48, 949–986. [Google Scholar] [CrossRef] [PubMed]
- Zachariah, S.G.; Saxena, R.; Fergason, J.R.; Sanders, J.E. Shape and volume change in the transtibial residuum over the short term: Preliminary investigation of six subjects. J. Rehabil. Res. Dev. 2004, 41, 683. [Google Scholar] [CrossRef] [PubMed]
© 2019 by the authors. Licensee MDPI, Basel, Switzerland. This article is an open access article distributed under the terms and conditions of the Creative Commons Attribution (CC BY) license (http://creativecommons.org/licenses/by/4.0/).