Article

Residents’ Perceptions of and Response Behaviors to Particulate Matter—A Case Study in Seoul, Korea

School of Architecture, Hanyang University, 222 Wangsimni-ro, Seongdong-gu, Seoul 04763, Korea
*
Author to whom correspondence should be addressed.
Appl. Sci. 2019, 9(18), 3660; https://doi.org/10.3390/app9183660
Submission received: 31 May 2019 / Revised: 25 June 2019 / Accepted: 27 June 2019 / Published: 4 September 2019
(This article belongs to the Special Issue Indoor Air Quality)

Abstract

:
This study is interested in understanding the particulate matter perceptions and response behaviors of residents. The purpose of this study was to identify indoor air quality along with the response behaviors of residents in Seoul, to ascertain whether there is a difference in behaviors when particulate matter is present, according to the characteristics of residents and to grasp the nature of this difference. A questionnaire survey of 171 respondents was conducted. The questionnaire measured the indoor air quality perceived by residents, the health symptoms caused by particulate matter, residents’ response behaviors to particulate matter and the psychological attributes affecting those response behaviors. Residents of Seoul were divided into college students in their twenties, male workers in their thirties and forties and female housewives in their thirties and forties. The data were calibrated by SPSS 23 using a one-way analysis of variance (ANOVA) and multiple regression analyses. The results show that most people found particulate matter to be an important problem but were unable to do sufficient mitigation action to prevent its presence. Residents showed greater psychological stress resulting in difficulty going out than physical symptoms. The most influential factor on response behaviors was psychological attributes. Participants were aware of the risks of particulate matter but believed it to be generated by external factors; thus, they felt powerless to do anything about it, which proved to be an obstacle to response behaviors.

1. Introduction

In recent years, particulate matter (PM) has emerged as a big problem in Korea. According to the Organization for Economic Cooperation and Development (OECD)’s annual report on the concentration of ultra-particulate matter in countries by 2017, the mean population was exposed to PM2.5 and with pollution at 25.1 μg/m3, Korea was the second worst of the member countries [1], with a level twice as high as the average OECD member countries (12.5 μg/m3) and 2.5 times higher than the World Health Organization (WHO)’s annual average recommended concentration (10 μg/m
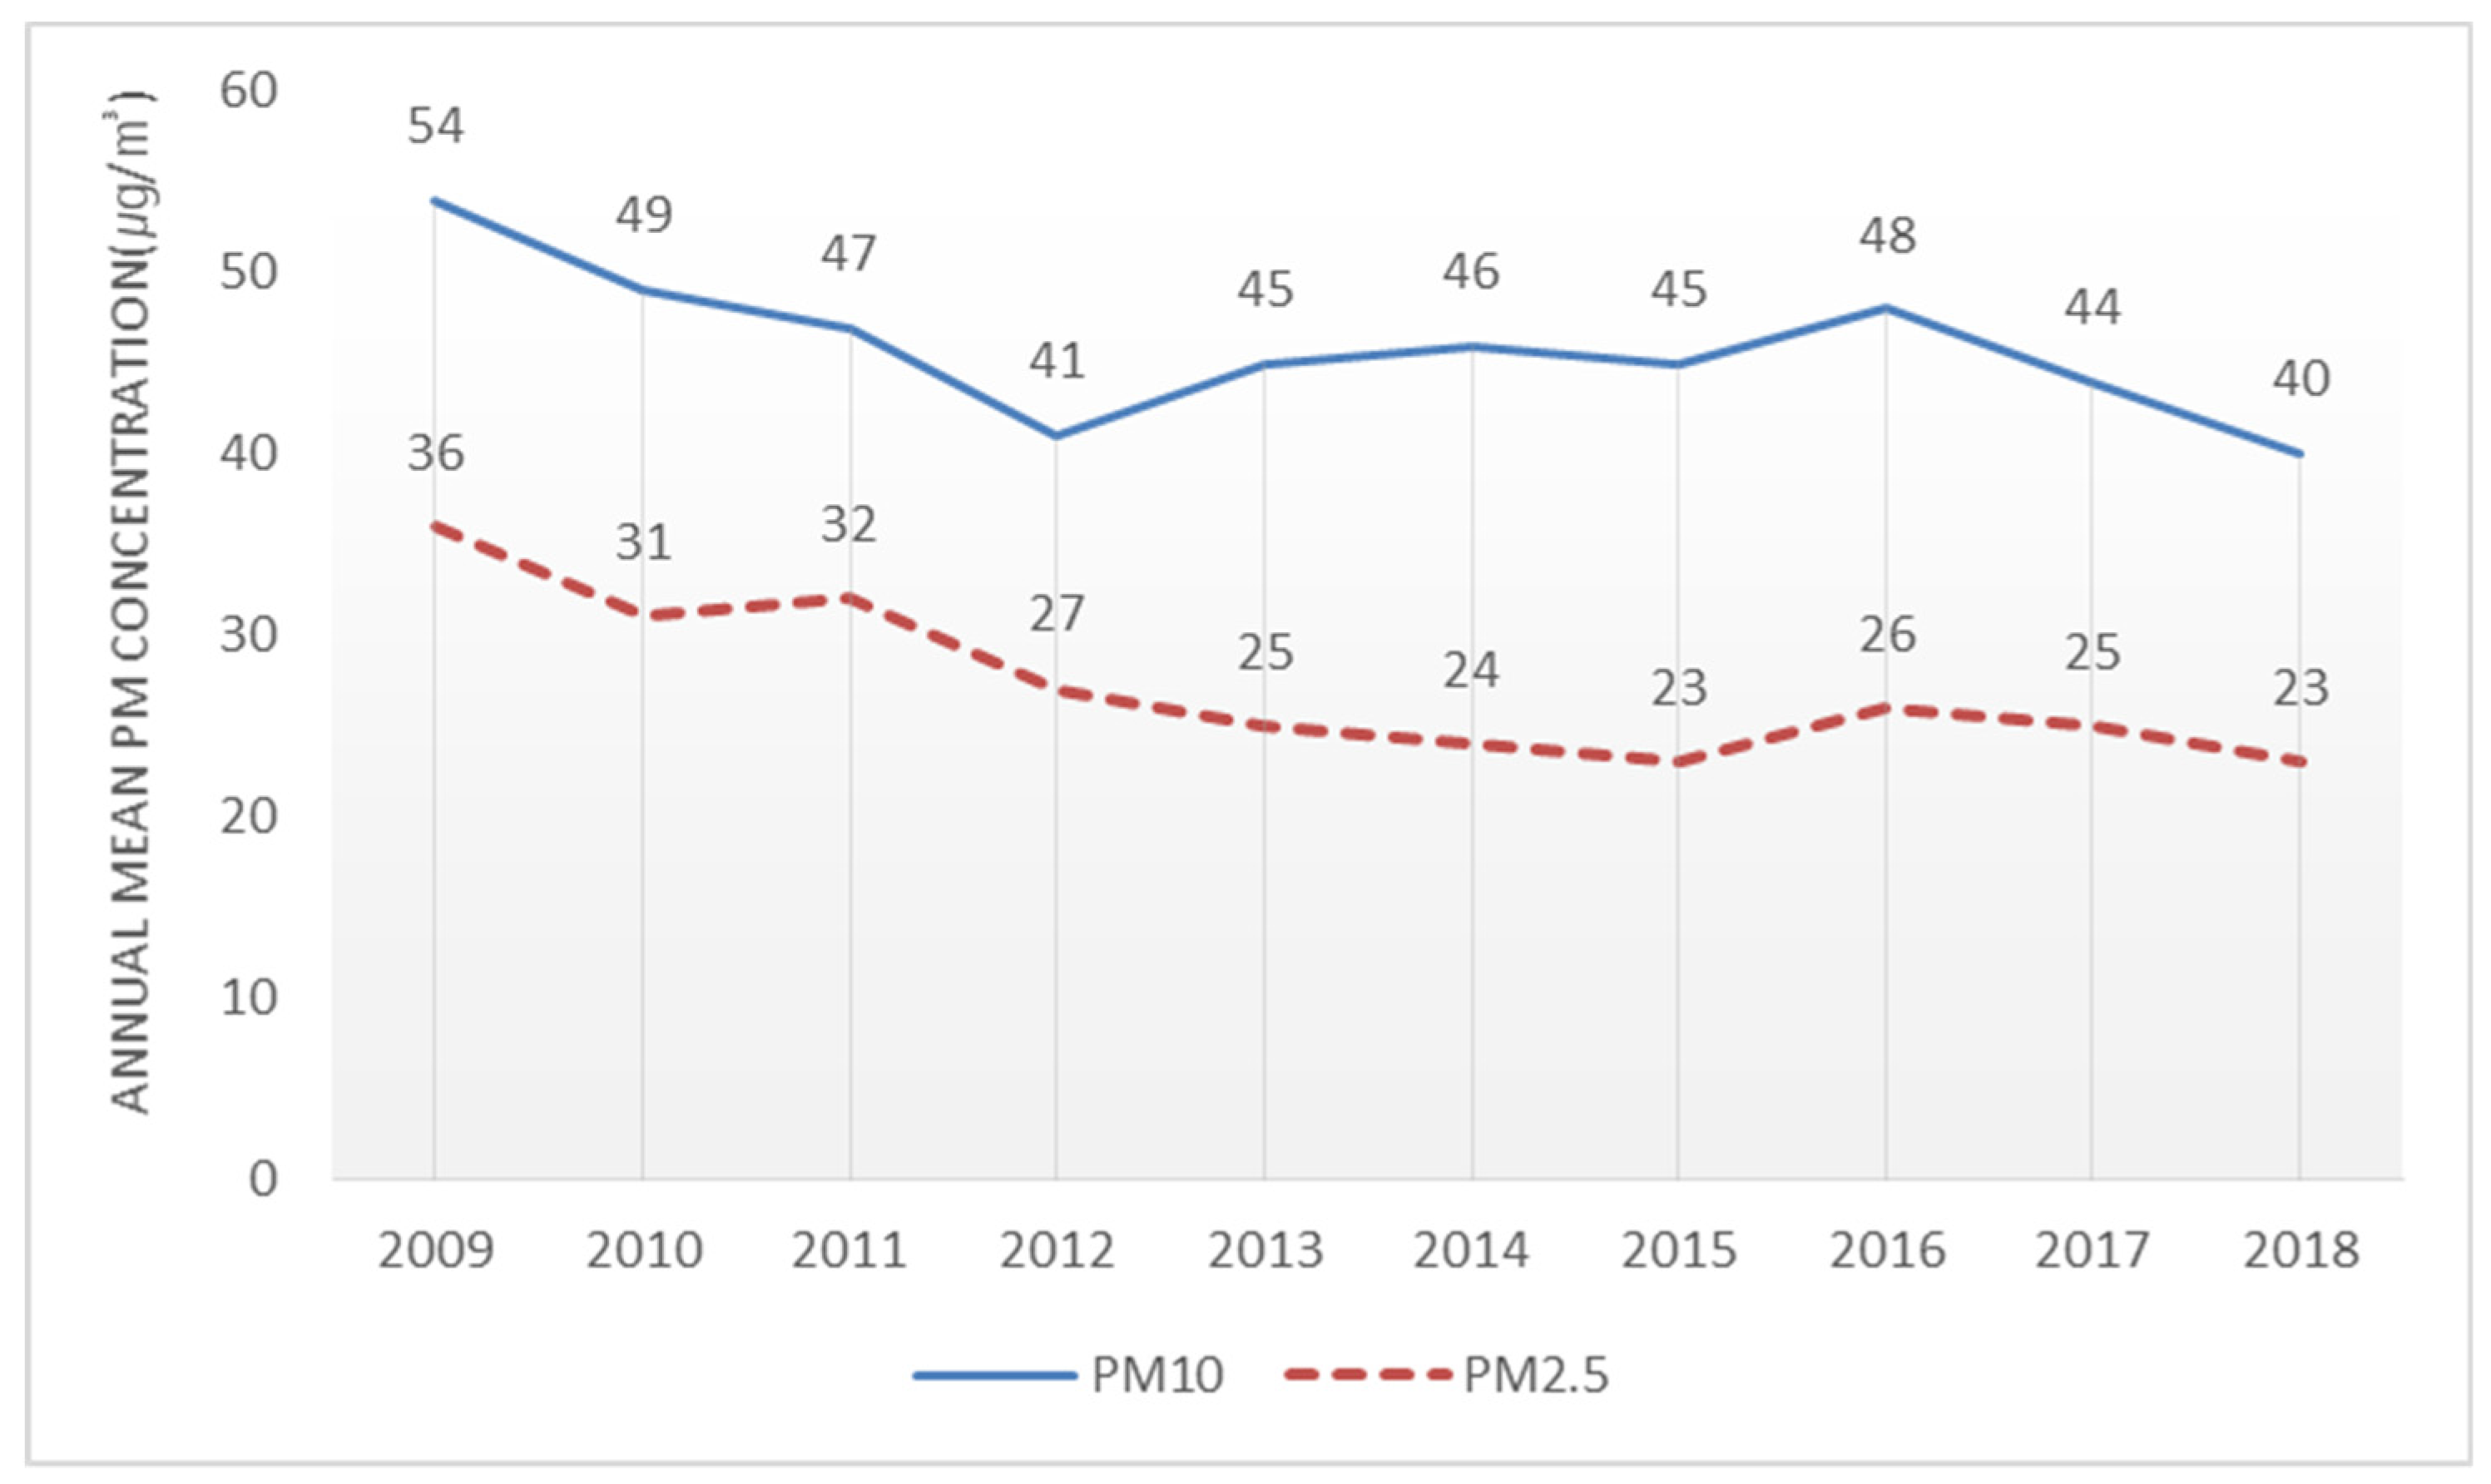
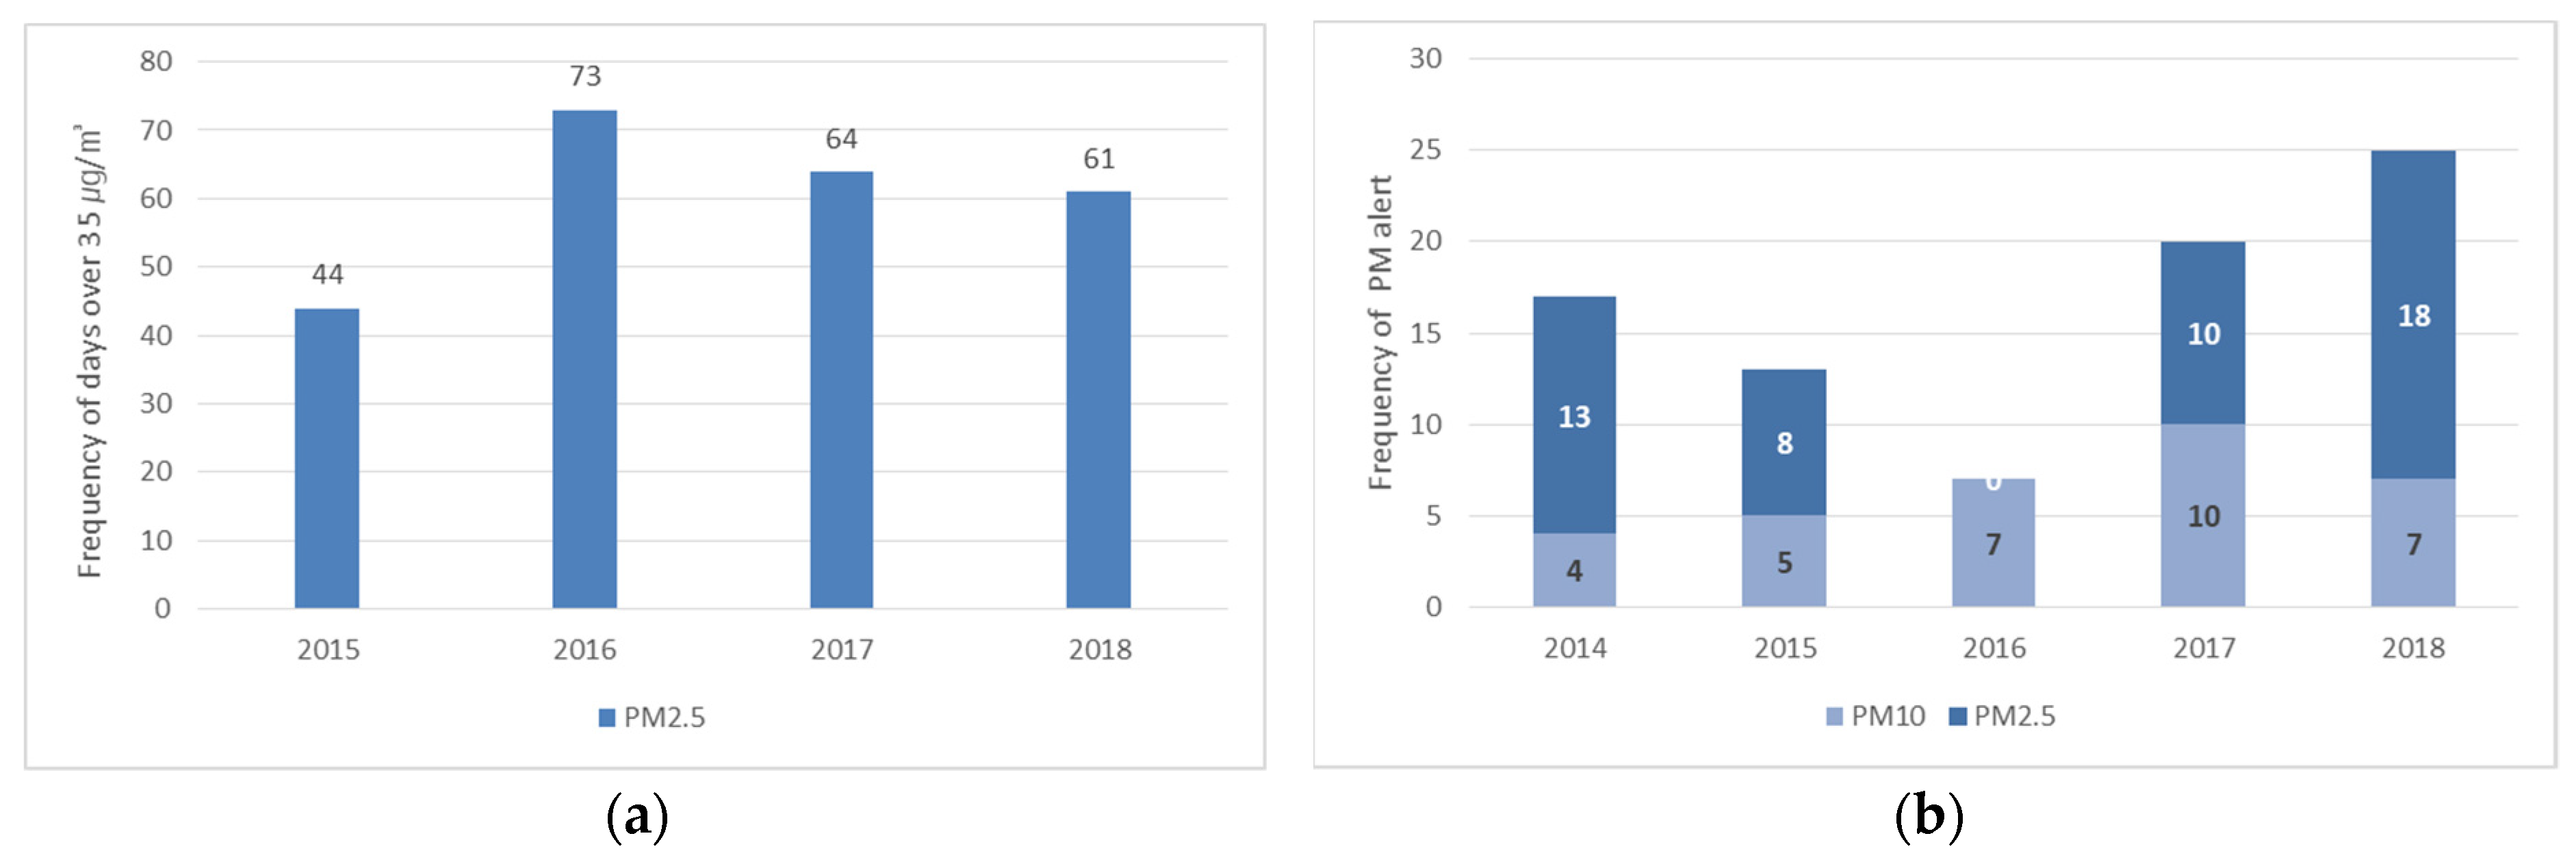
3). Based on Korea’s PM forecast, the number of “bad” (36–75 μg/m3) and “very bad” (more than 76 μg/m3) days in metropolitan areas increased from 62 in 2015 to 77 in 2018 [2]. In early March 2019, Korea experienced the most severe PM situation. In Seoul, an 8-day ultra-particulate matter warning (PM2.5 with a time-averaged concentration of more than 75 μg/m3 for 2 h) and 2 days (March 5 and 6) with an alert level (an average PM2.5 of more than 150 μg/m3 for 2 h) [3]. As a result, the PM levels became hazardous to health.
PM is a WHO Level 1 carcinogen that has negative effects on health, contributing to cardiovascular and respiratory diseases [4,5]. Choe and Lee [6] investigated the effect of particulate emissions on specific diseases in Seoul and found that the number of hospitalizations for various respiratory diseases increased as the amount of ultra-PM increased. Korea’s increase in PM is related to rapid economic growth. Large cities, such as Seoul, have high levels of energy use resulting from the concentration of population and economic activity and their direct emission of air pollutants is high. Further, since its geographical location is on the mid-latitude westerly wind area, seasonal influx of PM from neighboring China also affects the increase of PM in Korea [7].
According to the survey data on the perception of environmental problems among Koreans aged 13 and over, conducted by the Korea National Statistical Office (KNSO), 82.5% of respondents experience anxiety about PM [8]. Kim et al. [9] observed that Koreans regard PM as the most serious social risk factor. Because national concern about PM has been increasing, the government introduced a comprehensive plan for PM in 2017. In 2018, it attempted to reduce PM emissions by enforcing a Special Act on Particulate Matter in major cities across the country, including the capital region [10]. The Ministry of Environment, in consideration of atmospheric environmental standards and health effects, produced a PM forecasting system, which presents the levels of PM as well as countermeasures [11]. However, despite the various risk indicators for PM and notwithstanding the government measures, the residents of Seoul are notably passive in protecting individuals and society from PM despite viewing it as a threat [12]. To prevent and reduce the PM generated by anthropogenic rather than natural factors, public efforts must be accompanied by measures at the national level. Without ensuring that residents understand PM, it is predicted that reduction measures will be ineffective. Therefore, this study aims to identify levels of awareness of PM, recognition of indoor air quality, symptoms of PM exposure experienced by residents and coping behavior in relation to PM in Seoul. Specific research questions are as follows:
First, how do residents perceive the indoor air quality, how do they feel PM symptoms and how do they behave in response to PM?
Second, do the different characteristics of residents produce any variations in behavior in response to PM?
Third, what are the impediments to the proper responses to PM by residents?
In this study, we have sought to understand the perceptions of PM and the subsequent response behaviors of residents, as well as to identify the causes of these behaviors. It is critical to understand and solve the barriers to public engagement to avoid the worst consequences of PM. The results of this study are expected to be used as basic data for effective governmental measures to reduce PM.

2. Status and Risks of Particulate Matter in Korea

2.1. Characteristics of Particulate Matter Generation in Seoul

To identify the characteristics of PM generation in Seoul, we investigated the annual average concentration of PM along with its highest levels of concentration. As shown in Figure 1, the average concentrations of PM10 and PM2.5 in Seoul were calculated using Seoul’s atmospheric environment information from the past 10 years. From 2009 to 2018, the average annual concentration of PM10 in Seoul was 53.8 μg/m3 and the average annual concentration of PM2.5 was 27.2 μg/m3 [3]. The average annual concentration of PM10 decreased from 76 μg/m3 in 2002 to 41 μg/m3 in 2012 but this decline has since slowed. Since the government enacted the Special Act on the Improvement of the Air Quality in the Seoul Metropolitan Area and established and performed its Basic Plan for the Management of Air Quality in the Seoul Metropolitan Area in 2003, air pollution as well as PM concentrations have been reduced [7]. However, no further improvement has occurred since 2012.
The results of a survey of “bad” and “very bad” days exceeding a PM2.5 of 35 μg/m3 for an average of 24 h showed that 44 days in 2015, 73 days in 2016, 64 days in 2017 and 61 days annually on average were recorded as “bad” and “very bad”. This means that the number of days when the concentration of PM was significant is very large. This can be seen by comparing the number of PM warnings and days of alarm in Seoul. Figure 2 shows the number of PM and ultra-PM warning days using Seoul’s atmospheric environment information. If there is a PM10 of 150 μg/m3 or a PM2.5 of 75 μg/m3 for more than 2 h, a warning is issued. If there is a PM10 of 300 μg/m3 or a PM2.5 of 150 μg/m3 for more than 2 h, an alarm is issued. In 2018, there were 17 PM warning days, 1 PM alarm day and 7 ultra-PM warning days. Seoul residents were exposed to extremely high dust concentrations on these days.
This result is closely related to the monsoon season experienced in the geographical location of Korea. Korea’s winter atmospheric circulation is affected by the northwestern winds associated with the winter monsoon in East Asia and the location of the barometer over the Korean peninsula. Inflow from China and Mongolia in winter greatly affects the concentration of PM in Korea [13]. Figure 3 shows the changes in the concentrations of PM and ultra-PM from March 2018 to February 2019 [3]. It shows that the levels of PM are high in winter and spring and low in summer. Specifically, they are lowest in September and highest in January. The atmospheric environmental standards for domestic PM are below 50 μg/m3 on average for 24 h and below 25 μg/m3 on average per year. Korea’s levels exceed these standard values in all seasons except summer.
The air quality in Korea deteriorates considerably as the number of days with seasonally high concentrations of PM increase [14].

2.2. Domestic Particulate Matter Standards and Health Protection

The Ministry of Environment [2] proposed enhanced environmental standards for PM in 2018, taking into consideration national health effects, international standards, pollution status and achievability. Table 1 shows the WHO recommendations along with the standards in other regions. The concentration of PM in the domestic environment of higher than 50 μg/m3 far exceeds the WHO’s recommended level of an annual average PM10 of 20 μg/m3 and is much greater than that of other regions. In addition, the rate of achieving the annual PM environmental standard was around 60% in 2015 and the rate of achieving the 24 h environmental standard for PM2.5 and PM10 was very low at 4% and 10.7% respectively.
Considering public health, the Ministry of Environment has been conducting PM forecasting from February 2014 and ultra-PM forecasting with a warning system from January 2015 [2]. The PM forecasting system provides forecasts of the PM concentration four times a day for the present day, the following day and the day after that. The PM forecast is graded in four stages: “good”, “normal”, “bad” and “very bad” (Table 2). The PM warning system works to promptly inform the public when a high concentration of PM occurs and to reduce the damage. It is issued when the air quality is harmful to health. Air pollution alarms are classified into two stages—warning and alarm—as shown in Table 3. At the time of a PM alarm, there are eight countermeasures for people to take: remaining indoors; wearing a health mask; reducing external activities; washing the body after returning home; drinking water and eating fruits and vegetables; undertaking ventilation and indoor water cleaning; managing indoor air quality; and restricting air pollution inducing activities.

3. Materials and Methods

3.1. Participants and Questionnaire Design

This study surveyed the residents of Seoul. To identify differences in the response to PM associated with gender and age, respondents were divided into three groups. A total of 171 respondents were used for the analysis. The groups were 20-year-old college students (N = 70, gender = 32 male and 38 female, mean age = 21.88, SD = 2.33), 30- to 40-year-old male workers (N = 51, mean age = 41.11, SD = 5.45) and 30- to 40-year-old housewives (N = 50, mean age = 37.06, SD = 4.33). The questionnaire comprised five main parts. The first part included questions about the quality of indoor air perceived by residents in the home. The second part addressed the health of the residents in terms of objective symptoms, subjective symptoms and health behaviors concerning the symptoms. The third section elicited the residents’ responses to PM, dividing them into mitigating behavior, adaptive behavior and behavior intentions. The fourth part sought to ascertain the psychological causes of interference with the response behaviors of the residents to PM and the final content consisted of questions investigating the residents’ overall knowledge of PM.

3.2. Measures

3.2.1. Measuring Response Behaviors to Particulate Matter

Mitigating behavior and adaptive behavior are countermeasures to deal with risk. Swart and Raes [15] define “mitigation” as an anthropogenic intervention to reduce the sources of air pollution, whereas “adaptation” is an adjustment in natural or human systems in response to climatic stimuli. Mitigation is a way to reduce the cause of hazards associated with PM. Usually, the benefits of mitigating behavior are not seen in the short term, so it is considered a long-term countermeasure [16]. Mitigating behavior is a personal effort to reduce the generation of PM, which includes “using public transportation to reduce atmospheric gas generation”, “not using electricity and heating to restrain unnecessary energy use”, “using kitchen utensils that generate less harmful gas” and other similar measures. Adaptation refers to controlling the damage caused by PM.
Adaptive behavior can reduce the risks associated with PM by prophylactic and post-exposure measures that minimize the negative effects of PM [17]. In contrast to mitigating behavior, from which long-term effects arise, the effects of adaptive behavior are immediate and are characterized by the matching of subject and beneficiary [
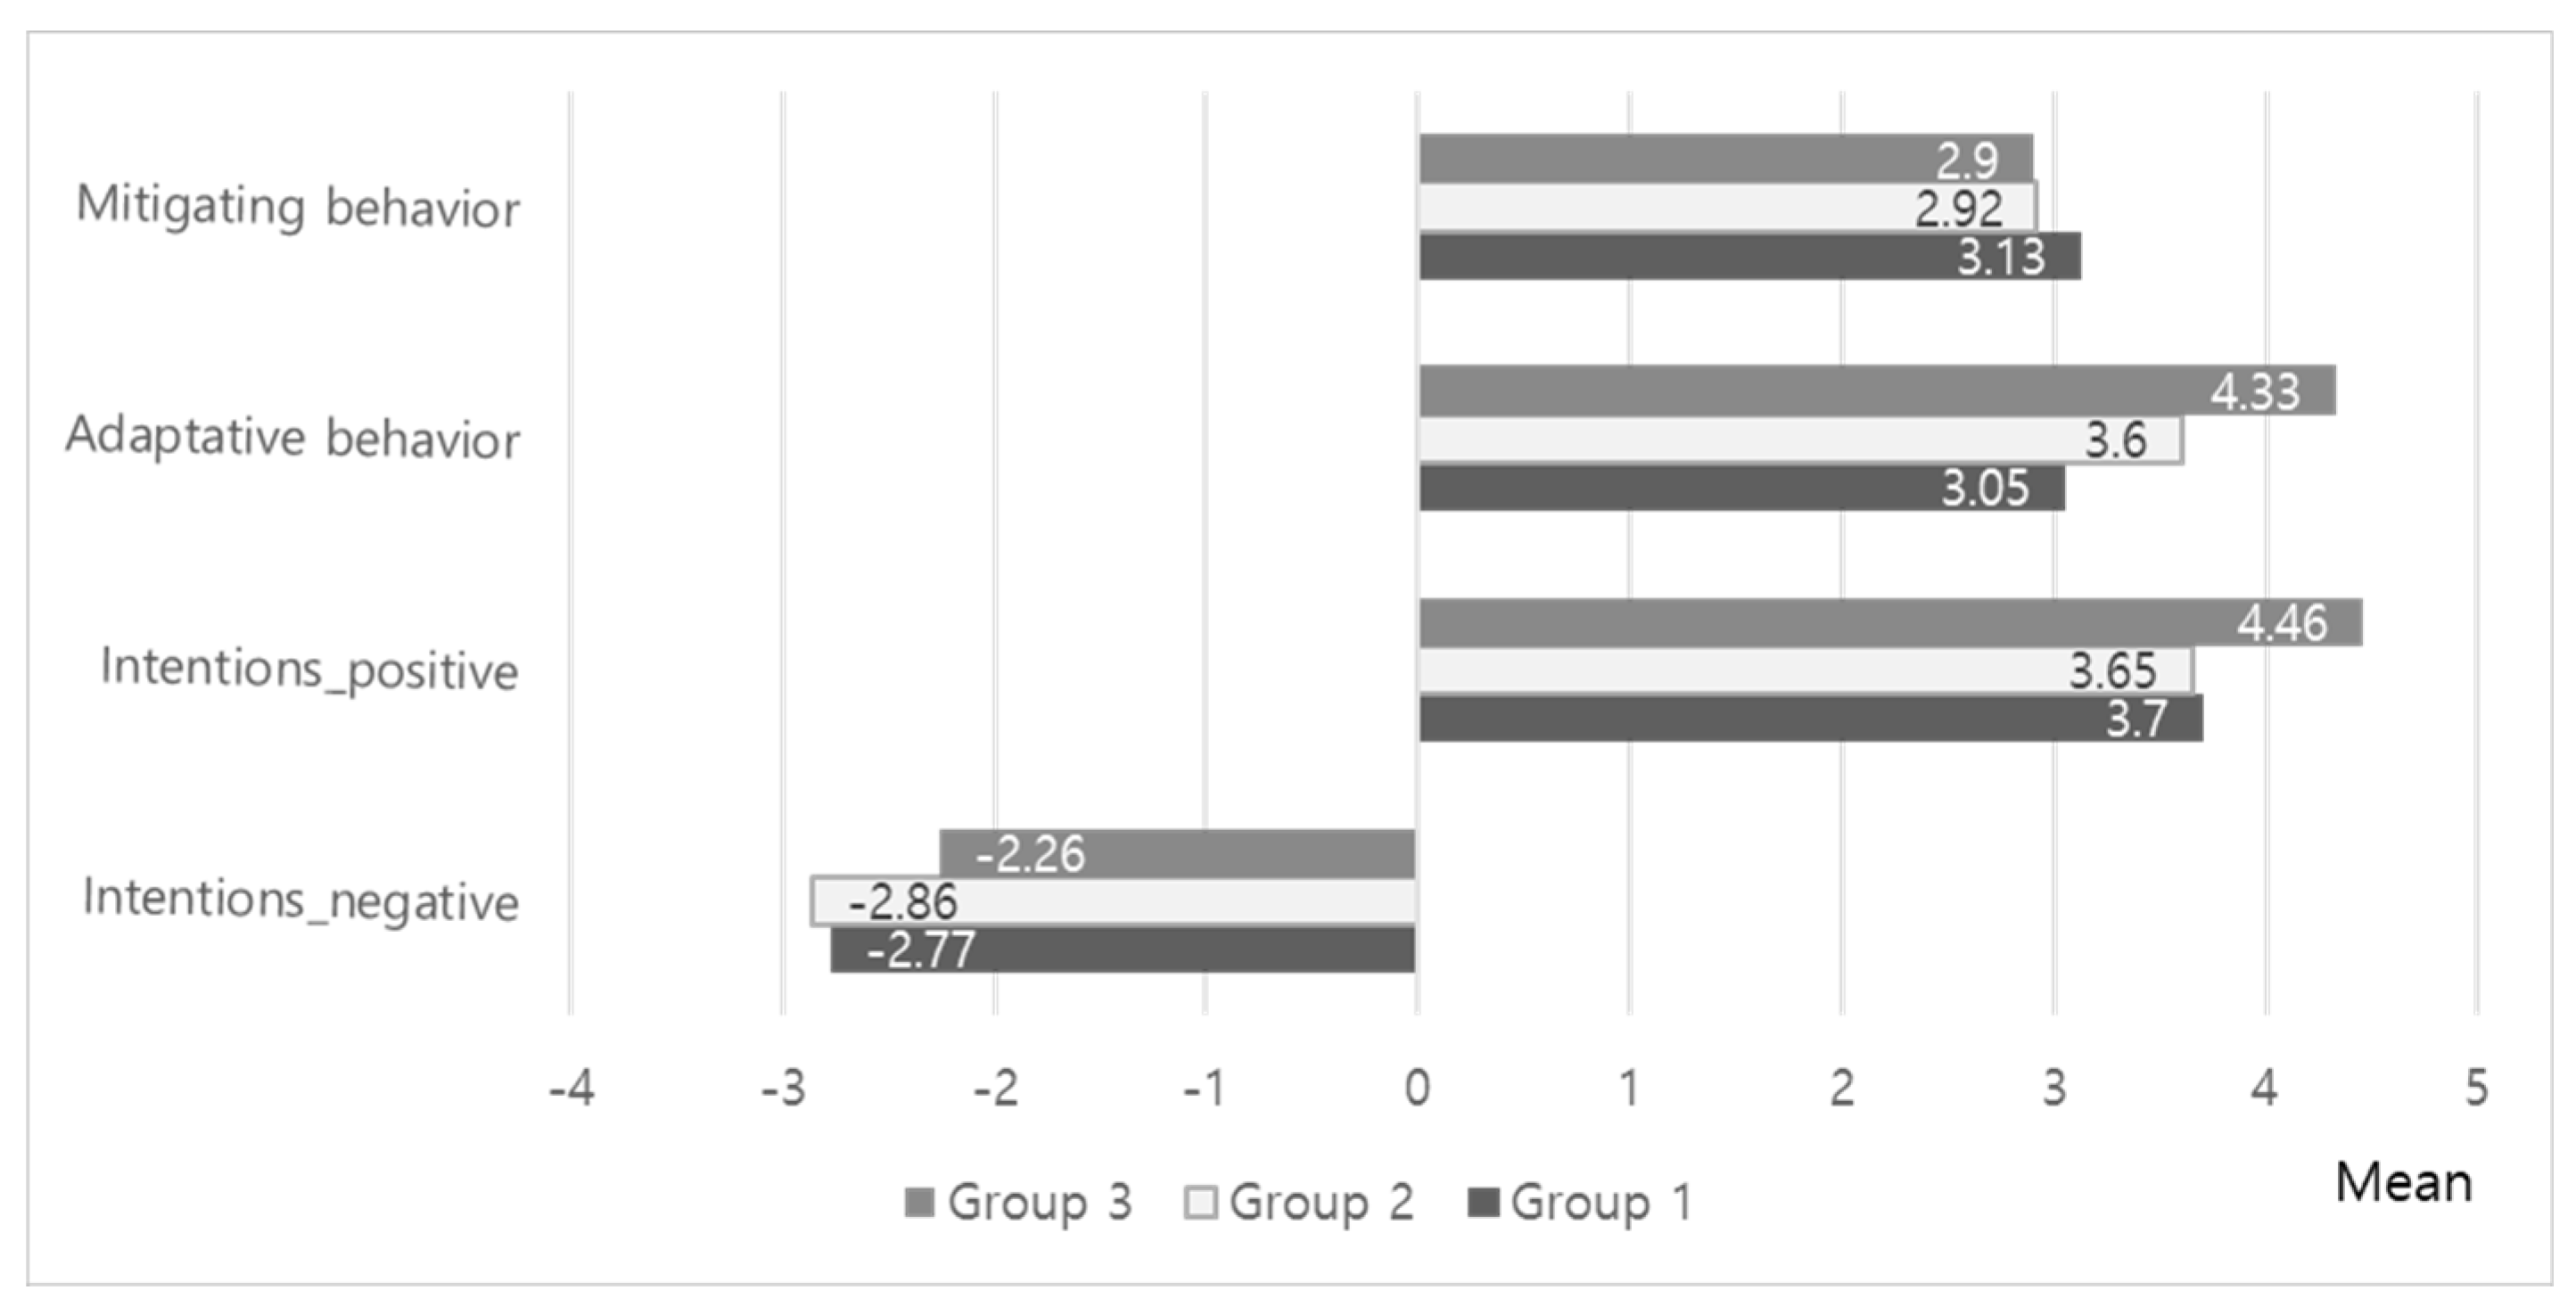
18]. Adaptive behavior is action to prevent the damage caused to individuals by high concentrations of dust. Behavioral intentions signify an individual’s specific willingness to act in response to PM and include two positive intentions. To achieve sustainable development policies, it is necessary to integrate mitigating actions that directly reduce the concentration of PM and adaptive prevention actions that reduce the impact of the existing dust risk. In this study, mitigating behavior, adaptive behavior and the behavioral intentions of Seoul residents are explored, as shown in Table 4.

3.2.2. Measuring Psychological Attributes that Hinder Reactions to Particulate Matter

Gilfford [19] observed that most people find environmental sustainability to be an important issue but that psychological barriers prevent them from engaging in sufficient actions to address it. These psychological barriers impede the behavioral choices that would facilitate mitigation, adaptation and environmental sustainability [20]. Risk perception is a factor that affects human attitudes and behavioral intentions and that is very important in making individual decisions about a behavior [21]. Brewer et al. [22] explained three dimensions of risk perception. The first is the likelihood that one will be harmed by the hazard; the second is susceptibility, referring to an individual’s constitutional vulnerability to a hazard; and the third is severity, indicating the extent of harm a hazard may cause. Psychological distance describes how individuals participate in future events [23]. The perceived distance of events indicates how they are mentally construed. As the perceived distance increases, events are interpreted as more abstract, decontextualized and conceived in generalized terms. When events become closer, they use more specific, contextualized and detailed features [
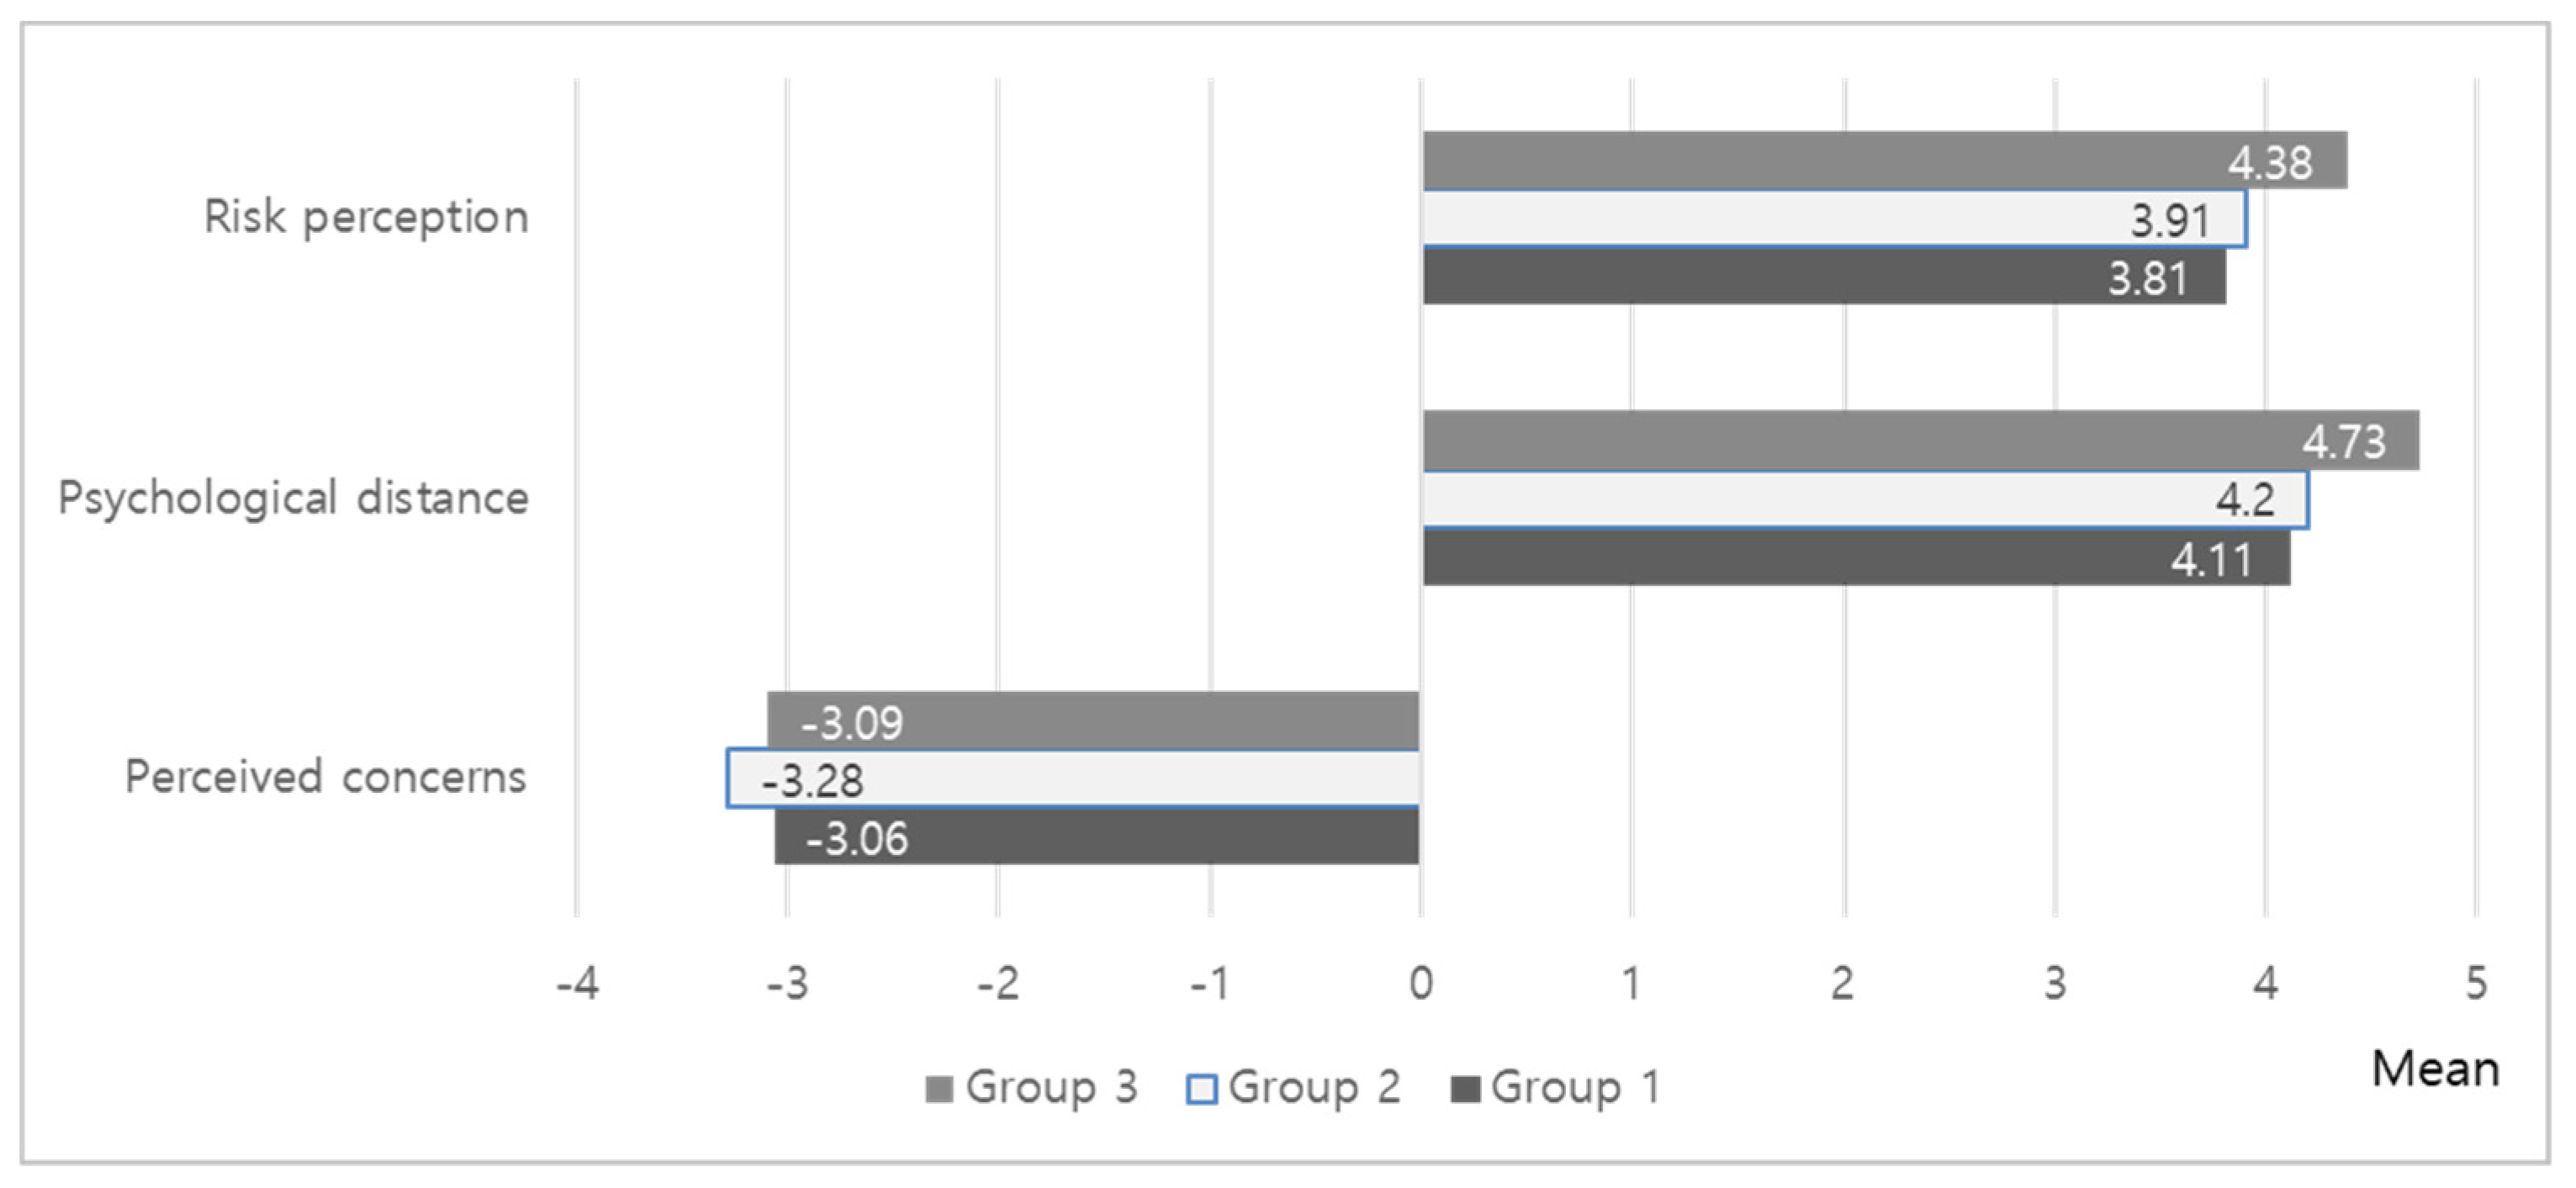
24]. The psychological distance for PM was evaluated using the four distance domains of geography, temporality, socialization and awareness. In addition, this research investigated various barriers increasing the perceived concern of the public, such as information distrust, externalizing responsibility and uncertainty about the causes of PM pollution. In this study, to understand the effects of response behaviors to PM, the psychological attributes of the residents were classified into nine concepts within three domains: “risk perception”, “psychological distance”, and “perceived concerns” (Table 5).

3.3. Methodology

This research used a questionnaire to collect its data; the survey was conducted online in March 2019 and the data were analyzed using IBM’s SPSS Statistics Program 23. The question concerning residents’ perceptions of indoor air quality comprised positive and negative language (the semantic differential method). We distinguished between positive vocabulary and negative vocabulary over five levels, asking residents to assign one level to each question according to their perceptions. The vocabulary used to measure the indoor air quality of residents included “bad”, “good”, “stuffy”, “refreshed”, “unpleasant”, and “comfortable”. A five-point Likert scale was used to assess the symptoms, behaviors and psychological responses of residents, ranging from “very unlikely” (1 point), to “unlikely” (2 points), to “average” (3 points), to likely (4 points), to “very likely” (5 points). Questions measuring residents’ knowledge of PM could be answered as “right” (○) or “wrong” (X) and the “right” answers were added to produce a score.
An ANOVA was used for the statistical analysis to determine whether there were differences in behavior as a response to PM, according to the characteristics of residents. Participants were divided into three groups based on their genders and ages: college students in their twenties, male workers in their thirties and forties and female housewives in their thirties and forties. In addition to the response behavior, we compared differences between the groups in terms of environmental exposures to PM, perceived symptoms and psychological attributes. Further, post-hoc tests were conducted to analyze variations between groups. Multiple regression analysis was conducted to identify the factors influencing response behavior.

4. Results

4.1. Perceived Indoor Air Quality and Overall Satisfaction

The perceived indoor air quality and the satisfaction of residents in Seoul were measured using a semantic differential approach. Residents assessed their perceptions of indoor air quality by comparing two opposing pairs of vocabulary in five steps. For example, the evaluation score for the first question on indoor air quality was divided into five levels, spanning two opposing experiences: “a lot of particulate matter” and “no particulate matter”. The more PM respondents perceived, the closer to 1 point they scored and the less PM they observed, the closer they scored to 5 points.
A total of 171 residents were analyzed and the results are shown in Table 6. Respondents’ answers to the four questions about the quality of indoor air produced an average score of approximately three (2.93–3.25) points. This score comprises the median value of 1 and 5, indicating that the residents of Seoul understand the indoor air quality to be normal. The evaluations of overall indoor air quality also averaged 3.21 points. However, the average score for the question, “Do you think seriously about or are you interested in the quality of indoor air where you live?” was 4.17 points (where 1 point indicated “not at all” and 5 points denoted “very much”), implying that respondents were interested in the air quality of their living spaces.

4.2. Particulate Matter Environmental Exposures and Perceived Symptoms

When measuring the outdoor activity times of respondents, it was found that they stayed outdoors for an average of 4.54 h (SD = 4.31) per day and the analysis of variance showed a statistically significant difference (p < 0.01) depending on the subject group. The results are shown in Table 7. The group of 20 college students and the group of 30- to 40-year-old male workers remained outside for an average of 5 h a day—specifically 5.12 h and 5.07 h respectively—while the group of 30- to 40-year-old housewives stayed outdoors for 3 h a day on average.
The physical symptoms and health problems experienced by residents as a result of PM were verified through objectively judged symptoms, such as cough, allergy and headache, as well as subjectively judged psychological symptoms, such as anxiety and stress. In addition, the extent of any actual treatment at the hospital because of these symptoms was investigated. The respondents’ answers ranged from “not at all” (1 point) to “very strongly” (5 points) and the results are shown in Table 8.
The average score for the response, “Thinking that particulate matter has a negative effect on my health” was 4.39, the highest and the average score for the response “Thinking that particulate matter causes problems in my life” was 4.00, the second highest. Symptoms such as respiratory problems and complications with nose, skin and eyes rated 3.69 and 3.66 respectively, revealing that the average scores for the objective symptoms of residents with health problems arising from PM were normal. These findings indicate that the psychological symptoms (Mean = 4.39) were more significant than the objective symptoms (Mean = 3.75); further, the incidence of direct treatment in hospitals (M = 3.15) for such symptoms was not significant (Figure 4). However, ANOVA analysis showed statistically significant differences according to subject groups. A Tukey post-hoc test was conducted to analyze the differences between the groups and the results showed that the perceived symptoms were greater among the group of housewives in their thirties and forties than in the group of college students in their twenties or in the group of male workers in their thirties and forties. Notably, the differences in psychological symptoms were pronounced among these groups (Table 8).

4.3. Behavioral Changes in Response to Particulate Matter

Residents’ response behaviors to the occurrence of PM were analyzed and the results indicate that adaptive behaviors (M = 3.66, SD = 0.95) controlling the damage caused by PM were more prevalent than mitigating behaviors (M = 2.98, SD = 1.03) to reduce the fundamental causes of PM, as shown in Table 9. The most common PM adaptive response behaviors were “AB1: Checking the PM concentration every day” (4.00 points) and “AB5: Washing your whole body thoroughly in running water after returning home” (3.78 points). Regarding behavioral intentions, the most common PM response behaviors were “BI2: Being willing to participate in actions to reduce particulate matter” (4.00 points) and “BI1: Being ready to experience immediate damage or inconvenience to reduce the particulate matter concentration” (3.69 points). For other responses, scores ranging from 2.50 to 3.50 were obtained, indicating that residents’ responses to PM were not significant. However, there were statistically significant differences among the groups (Table 9). In particular, the group of 30- to 40-year-old housewives showed higher scores for adaptive behavior and behavioral intentions than the other groups (Figure 5).

4.4. Barriers to Mild Behavioral Changes as a Response to Particulate Matter

We investigated the residents’ understandings of PM and their psychological causes as obstacles to behavioral changes to reduce and prevent PM.

4.4.1. Lack of Knowledge

The items indicating the residents’ knowledge of PM consisted of 10 authentic scales (true/false) based on data from experts and the Ministry of Environment. The respondents selected “correct” or “incorrect” in answer to each item and answers of “correct” were treated as single points, producing a total score between 0 and 10 points. Table 10 shows the results for the 171 respondents. The average knowledge of PM was 6.56 (SD = 1.44) and the results of the analysis are shown in Figure 6. Knowledge of PM did not vary among the groups.

4.4.2. Psychological Attributes of Particulate Matter

The results of the survey of the psychological influences on behavioral responses to PM show that risk perception (Mean = 4.01, SD = 0.76) and psychological distance (Mean = 4.32, SD = 0.73) achieved a higher than average score of 4.0 points (where 1 point = “not at all” and 5 points = “very much”). Table 11 shows the results of the analysis. Question 2 related to likelihood when considering residents’ risk perception—“If you continue to be exposed to particulate matter, you will be affected in a few years” (Item 4.5)—as did Question 1, “Contact with particulate matter is harmful to health” (4.35 points)’; both of these questions received the highest scores. The score for the residents’ perception of the psychological distance with which they regarded PM was higher than that for their risk perception. All questions concerning psychological distance were rated at greater than 4.0 and among them, the scores for Question 10, relating to the social implications of PM—”particulate matter is sure to be a serious social problem” (4.57 points)—and for Question 8, pertaining to the geographic and temporal significance of PM—“the risk of particulate matter is present very often or consistently” (4.47 points)—were the highest. Questions about perceived concerns, such as information distrust, the externalizing of responsibility and uncertainty, were reverse scored. Among them, Question 16, relating to the externalizing of responsibility—“The solution to the excess of particulate matter should be provided by the government rather than individuals” (−4.35 points)—and Question 15—“The problem of particulate matter is beyond my ability to solve” (−4.02 points)—received the highest scores. There was a statistically significant difference between the groups (Table 11). The group of housewives aged in their thirties and forties showed higher scores for risk perception and psychological distance than the other groups (Figure 7).

4.5. Factors Affecting Response Behaviors to Paticulate Matter

A multiple regression analysis was conducted to determine the factors with the greatest effect on residents’ response behaviors. Knowledge of PM, psychological attributes and PM-related symptoms were selected as factors influencing response behaviors and the analytical result was statistically significant (p < 0.05; F = 25.306, p-value = 0.000). Table 12 shows the evaluation of the contribution and statistical significance of the individual independent variables. Psychological attributes were the most influential factor on residents’ responses to PM, followed by PM-related symptoms.

5. Discussion and Conclusions

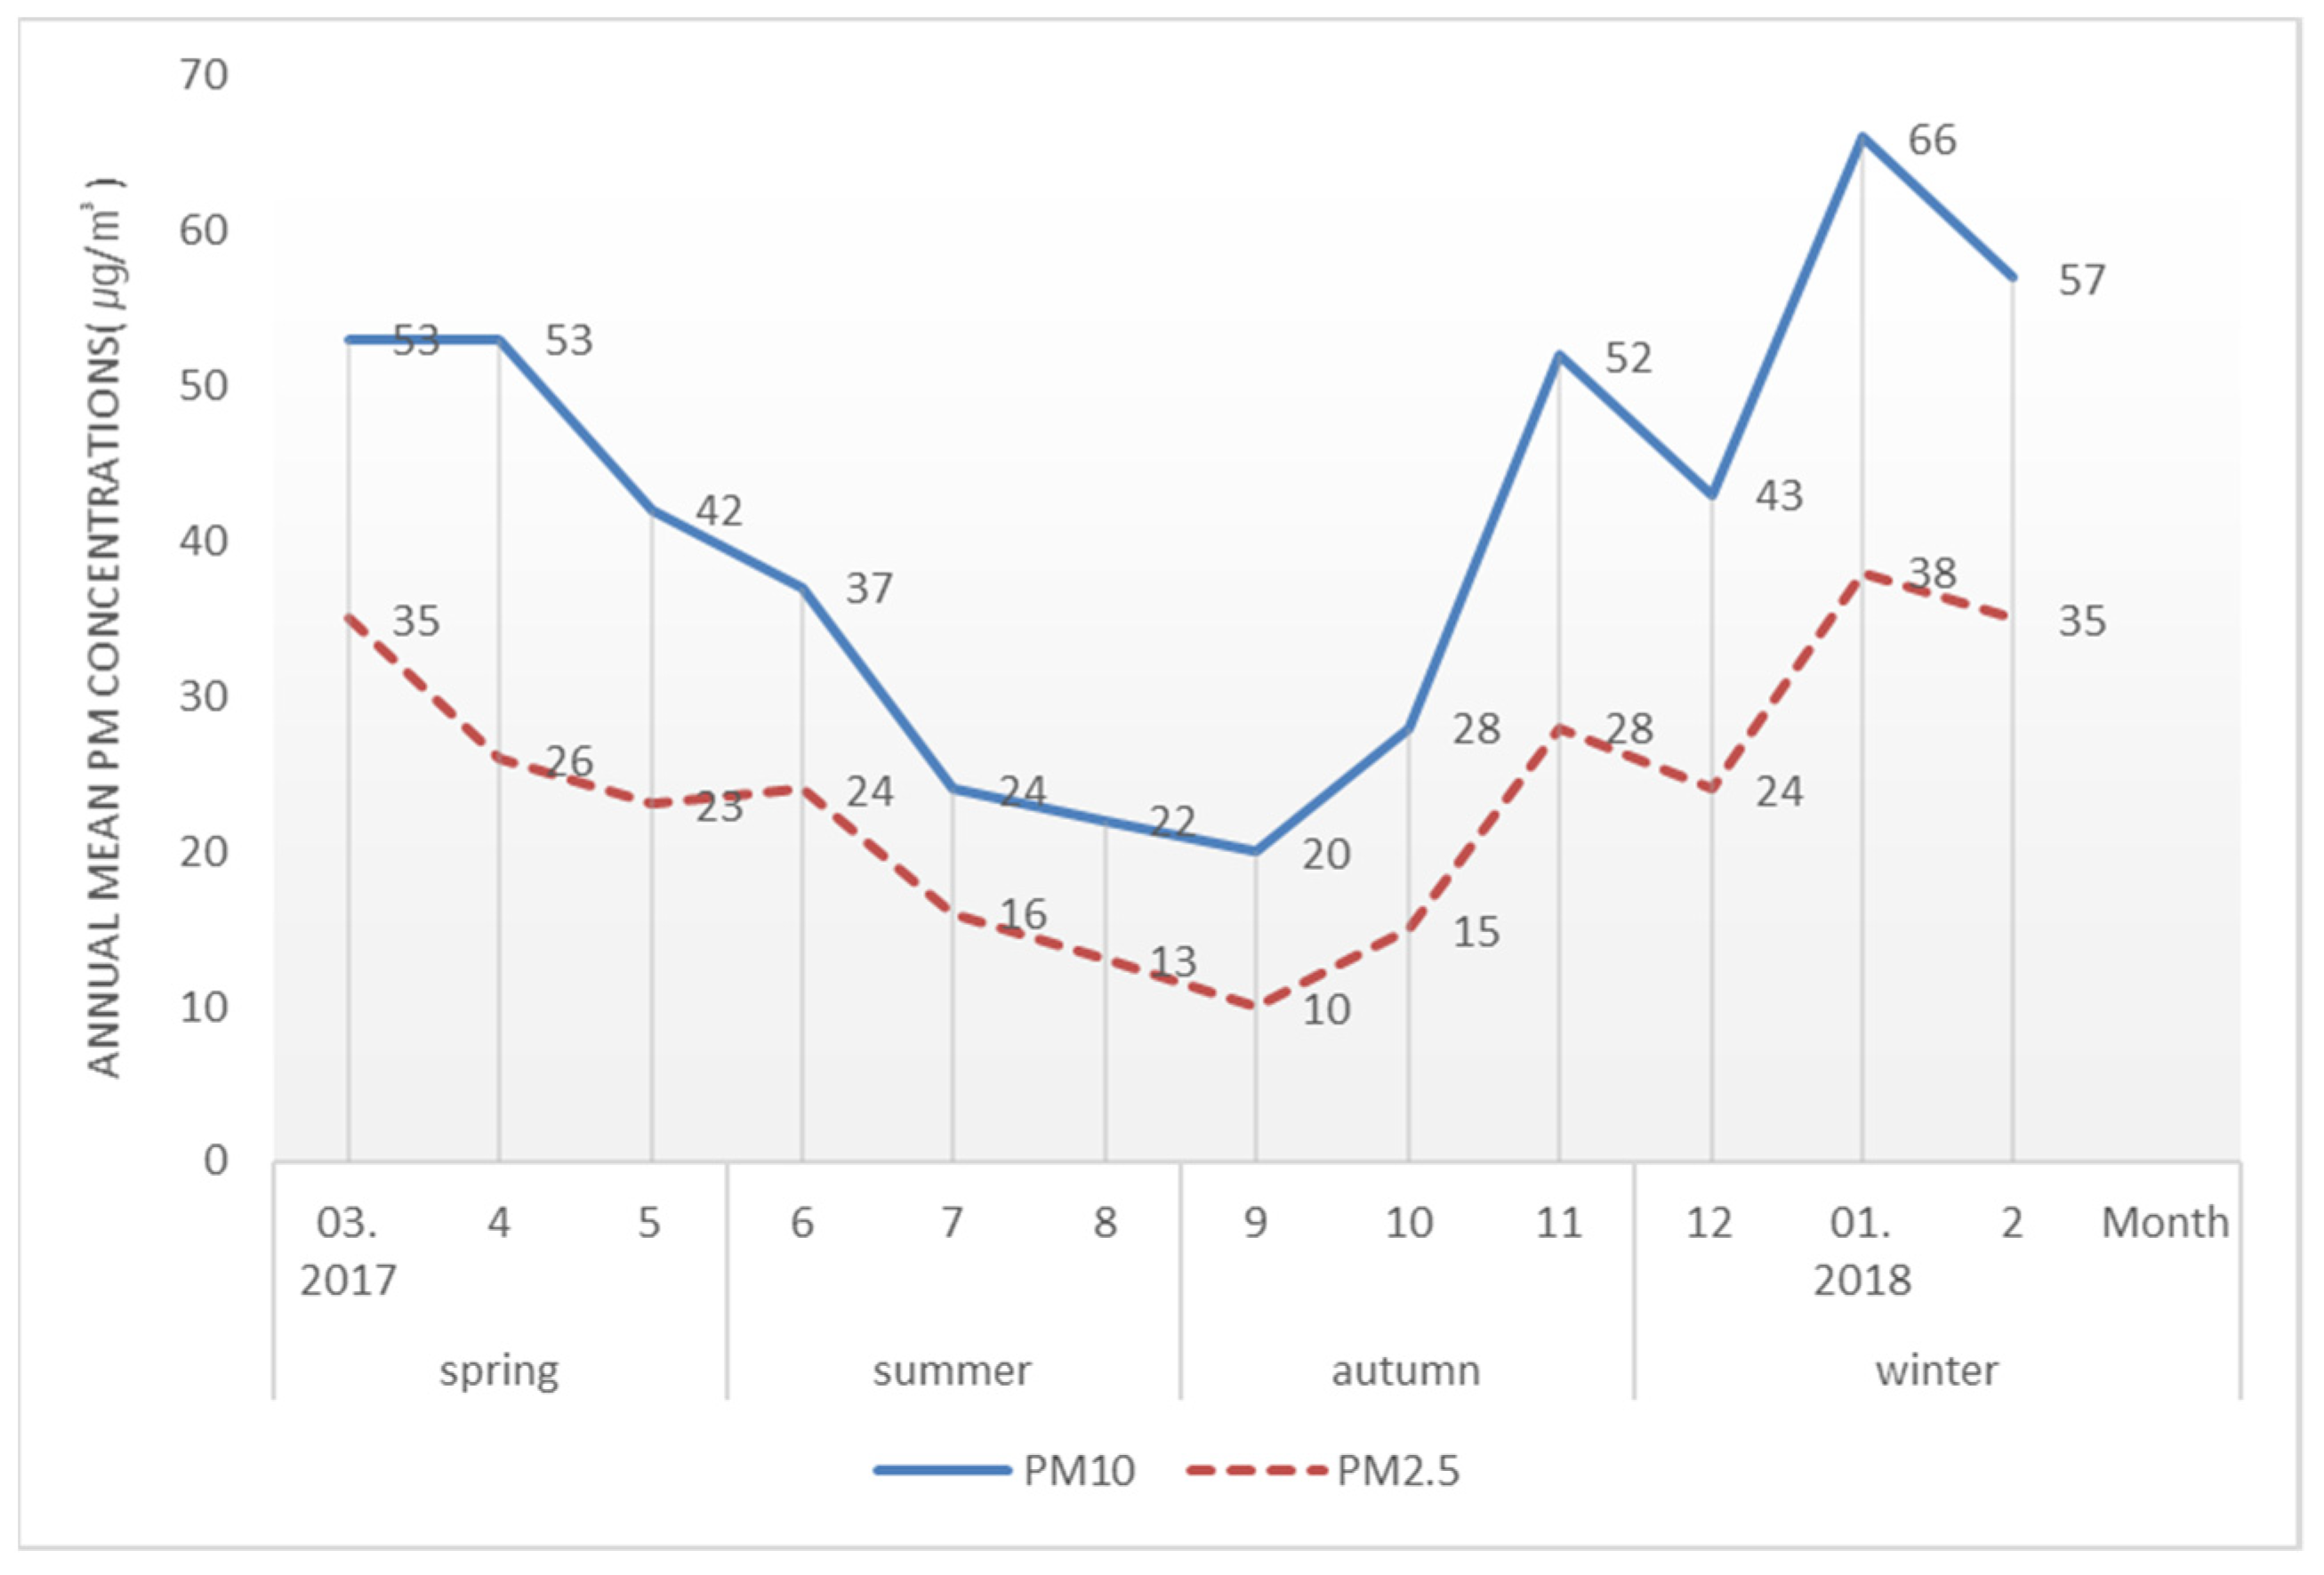
In Seoul, it is inadvisable to go out on any day, except in summer, as a result of the PM concentration and its effect on human health. When the WHO standard is applied, the concentration of PM in Seoul is revealed to be remarkably high and cases of excessive concentration exceeding the daily average atmospheric environment standard are also frequent. The government has been pursuing various policies to reduce PM concentration but the concentration of PM has not improved to the extent that people recognize any change. Research has shown that most people believe PM to be an important problem but do not undertake enough mitigating behaviors to prevent its occurrence. Reliable research should be preceded by an analysis of cause and effect before the preparation of PM countermeasures. We sought to understand residents’ perceptions of PM, their response behaviors and the psychological causes of these behaviors; the main findings of this study are as follows.
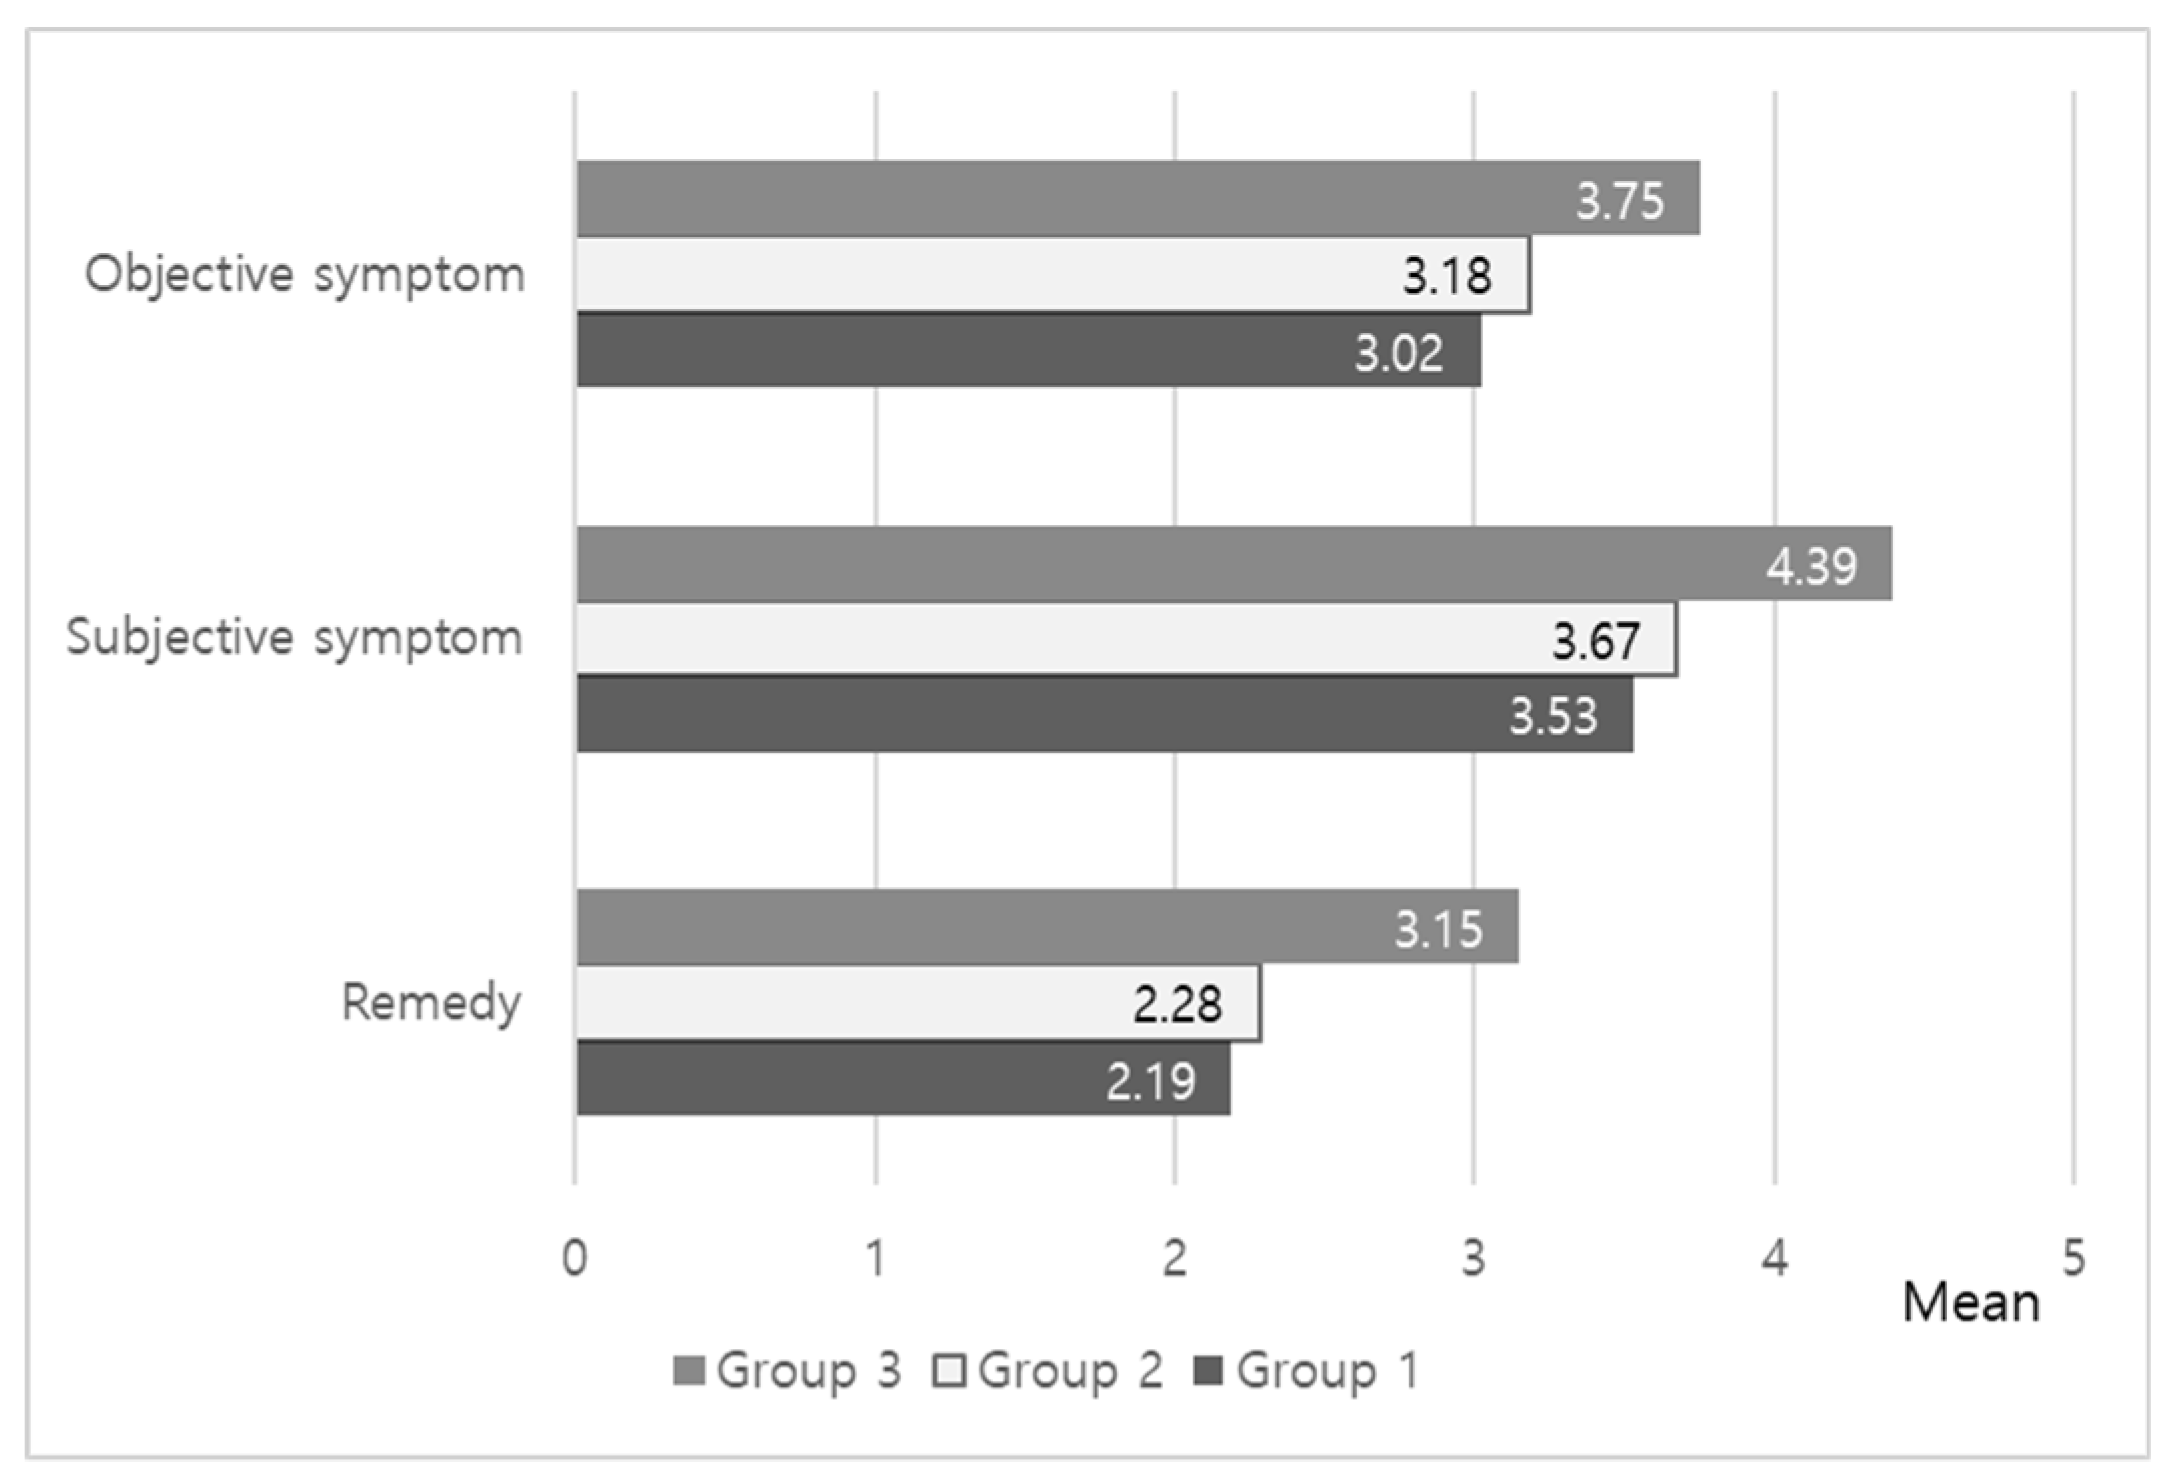
First, to identify the perceived indoor air quality of the residents, the questionnaire was distributed at a time when the concentration of PM had been significant throughout the year; thus, residents’ interest in indoor air quality was great. However, despite high outdoor concentrations of PM, the indoor air quality was not considered poor or dissatisfactory. The symptoms that residents attributed to PM were not physical, such as allergies or bronchitis. They more commonly experienced psychological stress or anxiety, feeling that PM had a negative effect on health and was interfering more frequently with daily life, in that residents were going out less often to avoid it.
Second, the problem with the PM-related behaviors of residents in Seoul was that many people did not take actual action despite their willingness to do so. Mitigating behavior to try to minimize PM generation was less common than adaptive behavior to protect individuals from the risks of PM. This may have been because of the nature of mitigating behavior, which often entails loss or inconvenience. Even if the risks associated with PM were largely recognized, it would be necessary to compensate for the loss when the habitual behavior of individuals was abandoned in favor of following the recommended behavior. Unlike preventive actions to protect individuals from PM, compensation for mitigating behavior is only likely to be achieved in the distant future and even then, such compensation would provide a social rather than an individual benefit. This suggests that more persuasive strategies should be employed to stimulate changes in individual behaviors for collective interests.
Third, the psychological characteristics of individuals can either hinder or promote action for environmental sustainability. The greater the perceived risk and the more psychological that risk, the more likely it is that an active response will occur. Analysis of the psychological factors affecting residents in Seoul revealed that they perceived the risk of PM to be very close (in terms of psychological distance). However, despite revealing significant levels of risk perception and psychological distance, the results of this study did not show active response behaviors. Attention must be paid to the externalizing of responsibility among the psychological causes of this lack of action. This study found distrust of and uncertainty about PM information to be largely unrecognized as causes of apathy; on the contrary, understanding PM saturation to be externally produced was the main reason for inaction. If external factors are emphasized as the cause of the problem, it is possible that individuals perceive the risk as uncontrollable, which may nullify their will to respond. The results of this study also suggest that residents’ psychological barriers have a negative effect on their response behaviors for the reduction of PM.
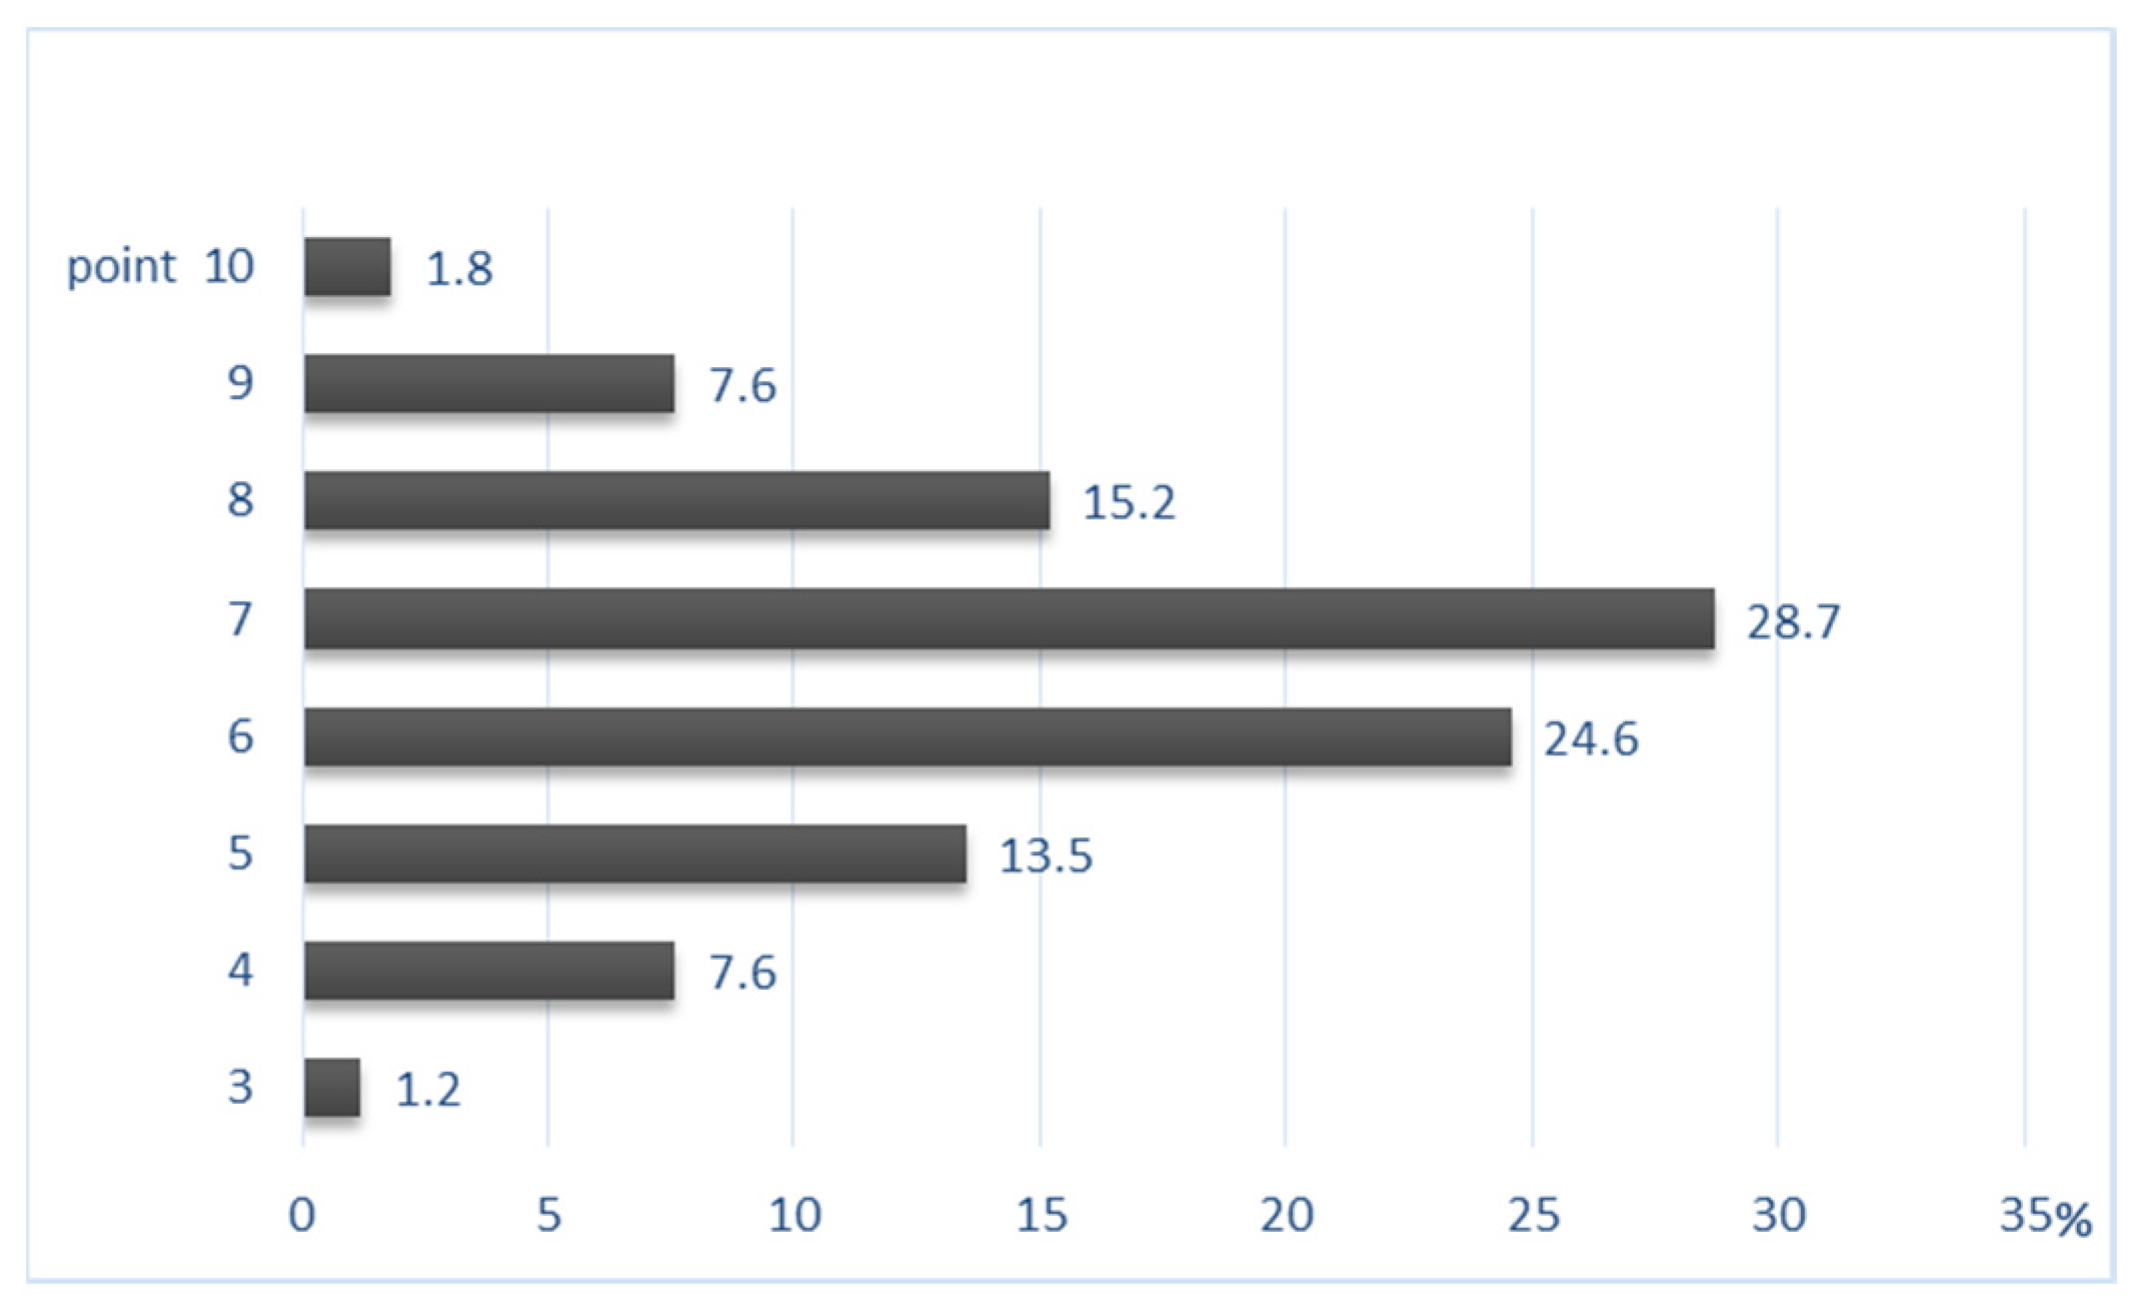
Fourth, the results of the correlation analysis show that the most influential factor in PM-related behavior was psychological attributes but that physical symptoms also affect response behaviors to PM. This result is meaningful in that it indicates desirable directions for PM policy. Based on the analysis of psychological factors, it was found that, because PM is also produced by individuals, active prevention is likely to occur if the importance of personal responses is conveyed. While knowledge of PM was not found to significantly affect response behaviors, residents in Seoul showed an average score of 6.56 out of 10 for PM knowledge. Lack of knowledge and understanding of the PM problem hinders appropriate response behavior. It is necessary to provide accurate and correct PM education and continuously available reliable information to enhance the knowledge of PM. In addition,
There was significant variation in residents’ perceptions, response behaviors and psychological attributes concerning PM based on gender and age. Conversely, the time during which residents undertook external activities exposed to PM did not significantly affect PM-related symptoms or behavior. In contrast to college students in their twenties and male workers in their thirties and forties who remained outdoors for 5 h on average, women in their thirties and forties who stayed outdoors for only 3 h on average responded more sensitively to PM-related symptoms and their commitment to PM reduction and mitigating actions was much greater. Similarly, the results of the psychological factor analysis for PM showed that the group of women in their thirties and forties were more aware of the risks than the other groups and felt those risks to be closer psychologically. However, it is the younger generations who will become the subjects of society in future and will need to face these problems and solve them. There is an urgent need for plans to increase awareness of the risks and the will of the public to act.
Government efforts to reduce PM have focused primarily on expensive communication campaigns. However, the results of this study suggest that the mere encouragement of attitudinal change is not effective; public engagement in terms of accurate PM knowledge, health education and the study of various personal characteristics and psychological causes is required.
This study identified residents’ thoughts, response behaviors and psychological factors relating to PM and showed that personal characteristics, cognition and emotions affect behavioral intentions. Unlike previous studies, the significance of this research is that it seeks to understand residents’ behaviors in a multidimensional way. Psychological factors are expected to be used effectively to motivate individuals to protect themselves from the risks of PM exposure. The residents of Seoul involved in this study were well aware of the risks of PM but felt that its generation and any possible solutions were external and therefore beyond their control. This situation is likely to prevent public action to protect individuals and the society. It is recommended that we shift our focus from risk and attention to participation and action. It is expected that a proper direction for efficient PM reduction can be established using these results.

Author Contributions

Conceptualization, M.E.C. and M.J.K.; methodology, M.E.C. and M.J.K.; formal analysis, M.E.C.; investigation, M.E.C.; data curation, M.J.K.; writing—original draft preparation, M.E.C.; writing—review and editing, M.J.K.; supervision, M.J.K.; funding acquisition, M.J.K.

Funding

This research was supported by a grant (19AUDP-B127891-03) from the Architecture & Urban Development Research Program funded by the Ministry of Land, Infrastructure and Transport of the Korean government.

Conflicts of Interest

The authors declare no conflict of interest.

References

  1. OECD. OECD Statistics. 2019. Available online: https://stats.oecd.org/index.aspx?queryid=72722 (accessed on 24 March 2019).
  2. Ministry of Environment. Particulate Matter Status. 2019. Available online: http://www.me.go.kr/cleanair/sub02.do#2 (accessed on 12 March 2019).
  3. Seoul Metropolitan Government. Seoul Atmospheric Environment Information. 2019. Available online: http://cleanair.seoul.go.kr/air_pollution.htm?method=average (accessed on 29 April 2019).
  4. Sacks, J.D.; Stanek, L.W.; Luben, T.J.; Johns, D.O.; Buckley, B.J.; Brown, J.S.; Ross, M. Particulate matter—Induced health effects: Who is susceptible? Environ. Health Perspect. 2011, 119, 446–454. [Google Scholar] [CrossRef] [PubMed]
  5. Pope, C.A., III; Burnett, R.T.; Thun, M.J.; Calle, E.E.; Krewski, D.; Ito, K.; Thurston, G.D. Lung cancer, cardiopulmonary mortality, and long-term exposure to fine particulate air pollution. JAMA 2002, 287, 1132–1141. [Google Scholar] [CrossRef] [PubMed]
  6. Choe, J.I.; Lee, Y.S. A study on the impact of PM2.5 emissions on respiratory diseases. Korea Environ. Policy Adm. Soc. 2015, 23, 155–172. [Google Scholar] [CrossRef]
  7. Lee, H.J.; Jeong, Y.M.; Kim, S.T.; Lee, W.S. Atmospheric circulation patterns associated with particulate matter over south Korea and their future projection. J. Clim. Chang. Res. 2018, 9, 423–433. [Google Scholar] [CrossRef]
  8. Korean Statistical Information Service. Recognition of Environmental Problems (PM Inflow). 2019. Available online: http://kosis.kr/statisticsList/statisticsListIndex.do? (accessed on 1 April 2019).
  9. Kim, Y.; Lee, H.; Kim, H.; Moon, H. Exploring message strategies for encouraging coping behaviors against particulate matter. Korea J. Commun. Inf. 2018, 92, 7–44. [Google Scholar]
  10. Hwang, I.C. Particulate matter management policy of Seoul: Achievements and limitations. Korea Assoc. Policy Stud. 2018, 27, 27–51. [Google Scholar]
  11. Han, H.; Jung, C.H.; Kim, H.S.; Kim, Y.P. The revisit on the PM10 reduction policy in Korea. J. Korea Environ. Policy Adm. 2017, 25, 49–79. [Google Scholar]
  12. Yang, W.H. Changes in air pollutant concentrations due to climate change and the health effect of exposure to particulate matter. Health Welf. Policy Forum 2019, 269, 20–31. [Google Scholar]
  13. Park, S.; Shin, H. Analysis of the factors influencing PM2.5 in Korea. Korea Environ. Policy Adm. Soc. 2017, 25, 227–248. [Google Scholar]
  14. Kim, Y.P. Air pollution in Seoul caused by aerosols. Korea Soc. Atmos. Environ. 2006, 22, 535–553. [Google Scholar]
  15. Swart, R.O.B.; Raes, F. Making integration of adaptation and mitigation work: Mainstreaming into sustainable development policies? Clim. Policy 2007, 7, 288–303. [Google Scholar] [CrossRef]
  16. Klein, R.J.T.; Schipper, E.L.F.; Dessai, S. Integrating mitigation and adaptation into climate and development policy: Three research questions. Environ. Sci. Policy 2005, 8, 579–588. [Google Scholar] [CrossRef]
  17. Brouwer, R.; Schaafsma, M. Modelling risk adaptation and mitigation behaviour under different climate change scenarios. Clim. Chang. 2013, 117, 11–29. [Google Scholar] [CrossRef]
  18. Wilbanks, T.J.; Sathaye, J. Integrating mitigation and adaptation as responses to climate change: A synthesis. Mitig. Adapt. Strateg. Glob. Chang. 2007, 12, 957–962. [Google Scholar] [CrossRef]
  19. Gifford, R. The dragons of inaction: Psychological barriers that limit climate change mitigation and adaptation. Am. Psychol. 2011, 66, 290–302. [Google Scholar] [CrossRef] [PubMed]
  20. Finell, E.; Tolvanen, A.; Pekkanen, J.; Minkkinen, J.; Ståhl, T.; Rimpelä, A. Psychosocial problems, indoor air-related symptoms, and perceived indoor air quality among students in schools without indoor air problems: A longitudinal study. Int. J. Environ. Res. Public Health 2018, 15, 1497. [Google Scholar] [CrossRef] [PubMed]
  21. Ferrer, R.; Klein, W.M. Risk perceptions and health behavior. Curr. Opin. Psychol. 2015, 5, 85–89. [Google Scholar] [CrossRef] [PubMed] [Green Version]
  22. Brewer, N.T.; Chapman, G.B.; Gibbons, F.X.; Gerrard, M.; McCaul, K.D.; Weinstein, N.D. Meta-analysis of the relationship between risk perception and health behavior: The example of vaccination. Health Psychol. 2007, 26, 136–145. [Google Scholar] [CrossRef] [PubMed]
  23. Menon, G.; Chandran, S. When a day means more than a year: Effects of temporal framing on judgments of health risk. J. Consum. Res. 2004, 31, 375–389. [Google Scholar]
  24. Jones, C.; Hine, D.W.; Marks, A.D.G. The future is now: Reducing psychological distance to increase public engagement with climate change. Risk Anal. 2017, 37, 331–341. [Google Scholar] [CrossRef]
Figure 1. Annual mean particulate matter (PM) concentration in Seoul (2009–2018).
Applsci 09 03660 g001
Figure 2. High PM concentration days: (a) days exceeding a PM2.5 of 35 μg/m3 on average for 24 h; (b) PM and ultra-PM warning and alarm days (Source: Seoul Atmospheric Environment Information).
Applsci 09 03660 g002
Figure 3. Seasonal dust concentrations in Seoul.
Applsci 09 03660 g003
Figure 4. Physical symptoms of particulate matter experienced by residents.
Applsci 09 03660 g004
Figure 5. Residents’ response behaviors to particulate matter.
Applsci 09 03660 g005
Figure 6. Residents’ total knowledge of particulate matter.
Applsci 09 03660 g006
Figure 7. Residents’ psychological influences.
Applsci 09 03660 g007
Table 1. Comparison of air quality standards for PM (Source: Ministry of Environment).
CategoryStandard TimePM StandardsStandard Achievement Rate (2015)
KoreaWHOUSAEU
PM2.5 (μg/m3)yearly151012, 152565.0%
24 h352535-4.0%
PM10 (μg/m3)yearly5020-4065.6%
24 h100501505010.7%
Table 2. Particulate matter forecast grade (2018).
PM Concentration (μg/m3, Average for 24 h)GoodNormalBadVery Bad
PM100–3031–8081–150over 151
PM2.50–1516–3536–75over 76
Table 3. Particulate matter warning and alarm issuing grade (2018).
CategoryWarning IssuingAlarm Issuing
PM10PM10 hourly average concentration over 150 μg/m3 for 2 hPM10 hourly average concentration over 300 μg/m3 for 2 h
PM2.5PM2.5 hourly average concentration over 75 μg/m3 for 2 hPM2.5 hourly average concentration over 150 μg/m3 for 2 h
Table 4. Responsive behaviors to particulate matter.
Question: What do you do when Particulate Matter Occurs?
Mitigating behaviorMB1 Using public transportation to reduce atmospheric gas generation
MB2 Refraining from using electricity and heating for the reduction of unnecessary energy use
MB3 Using kitchen appliances that generate less harmful gas
Adaptive behaviorAB1 Checking the levels of particulate matter concentration every day
AB2 Wearing a particulate matter mask on high particulate matter density days
AB3 Refraining from going out when the concentration of particulate matter is high
AB4 Turning on an air purifiers to reduce particulate matter concentration
AB5 Washing the whole body thoroughly in running water after returning home
AB6 Wiping dust from the floor with a damp cloth and undertaking indoor water cleaning
Behavioral intentionsBI1 Being ready to suffer immediate damage or inconvenience to reduce particulate matter concentrations.
BI2 Being willing to participate in actions to reduce particulate matter
BI3 Not feeling any urgency to change my behavior to prevent particulate matter pollution
BI4 Thinking that changes in my behavior do not affect particulate matter reduction
BI5 Not knowing what concrete action may be taken to reduce particulate matter
Table 5. Psychological attributes.
Question: What Are your Thoughts in Response to Particulate Matter?
Risk perceptionLikelihood1. Contact with particulate matter is a health hazard
2. If I continue to be exposed to particulate matter, I will be damaged in a few years
Susceptibility3. Particulate matter is an important problem for me
4. I am more affected by the risk of particulate matter than other risks
Severity5. The risks of particulate matter for health are very serious
6. Even short-term contact with particulate matter can increase the likelihood of cancer and early death
Psychological distanceGeographic and Temporal7. The particulate matter condition is more serious in Korea than in other countries
8. The risk of particulate matter is present very often or constantly
Social9. Particulate matter will have a significant impact on me and my family
10. Particulate matter is sure to be a serious social problem
Awareness11. I am very concerned about particulate matter
12. I am interested in issues related to particulate matter
Perceived concernsInformation distrust13. I cannot trust the information about particulate matter
14. The risk of particulate matter is greatly exaggerated
Externalizing responsibility15. The problem of particulate matter is beyond my ability to solve
16. The solution to the excess of particulate matter should be provided by the government rather than individuals
Uncertainty17. The damage caused by particulate matter is unclear
18. It is difficult to measure health damage arising from particulate matter
19. Particulate matter does not affect me right now
Table 6. Perceptions of and satisfaction with air quality.
Perceptions ofMeanStd. Deviation
1 Point5 Points
Indoor air qualityvery badvery good3.260.91
a lot of particulate matterlittle particulate matter2.940.98
stuffyrefreshed2.931.02
unpleasantcomfortable3.250.92
Satisfactiondissatisfactionsatisfaction3.211.10
no thought or interestmuch thought and interest4.171.10
Two phrases corresponded to 1 point and 5 points respectively and between these two phrases were expressions valued at 2 points (signifying the perception of slightly more PM), 4 points (signifying the perception of slightly less PM) and 3 points (signifying the perception of an average amount of PM).
Table 7. Average daily external activity time.
Group 1Group 2Group 3F (p-Value)
MeanStd DeviationMeanStd DeviationMeanStd Deviation
5.12 h3.435.07 h5.493.20 h3.813.54 (0.031)
Group 1: 20-year-old college students; Group 2: 30- to 40-year-old male workers; Group 3: 30- to 40-year-old housewives.
Table 8. Health-related symptoms experienced by residents as a consequence of particulate matter.
PerceivedMeanF (p-Value)
Group 1Group 2Group 3Total
Objective symptomSuffering from cough, hoarseness, bronchitis, respiratory distress and difficulty breathing3.543.504.083.693.33 (0.038 *)
Experiencing clogged nose, rhinitis, sneezing, allergy and atopic symptoms, such as itchy or swollen skin or dry eyes3.513.434.103.663.76 (0.025 *)
Suffering from headache, arthritis and other pain2.612.923.382.924.38 (0.014 *)
Experiencing the deterioration of an already present illness2.422.883.382.847.57 (0.001 **)
Subjective symptomSuffering increased stress and fatigue3.343.504.143.627.23 (0.001 **)
Feeling worried and anxious3.183.604.303.6312.84 (0.000 ***)
Thinking that particulate matter has a negative effect on my health4.214.274.784.398.55 (0.000 ***)
Thinking that particulate matter causes problems in my life3.713.684.724.0017.55 (0.000 ***)
Thinking that particulate matter reduces my performance and concentration3.203.314.023.476.80 (0.001 **)
RemedyI have recently been to the hospital for any of the above symptoms1.942.153.002.318.96 (0.000 ***)
I have recently been taking medication for some of the above symptoms2.122.313.042.456.19 (0.003 **)
I have recently taken a break at home because of some of the above symptoms2.512.393.422.747.80 (0.001 **)
* p < 0.05, ** p < 0.01, *** p < 0.001. Group 1: 20-year-old college students; Group 2: 30- to 40-year-old male workers; Group 3: 30- to 40-year-old housewives.
Table 9. Residents’ response behaviors to particulate matter.
Behavior TypeMeanF (p-Value)
Group 1Group 2Group 3Total
Mitigating behaviorMB14.042.822.603.2519.63 (0.000 ***)
MB22.803.003.002.910.49 (0.613)
MB32.552.943.122.832.91 (0.057)
Adaptive behaviorAB13.553.804.844.0019.63 (0.000 ***)
AB22.773.354.283.3820.36 (0.000 ***)
AB32.823.414.323.4319.53 (0.000 ***)
AB42.773.924.323.5619.03 (0.000 ***)
AB53.483.764.243.785.55 (0.005 **)
AB62.913.353.983.3513.37 (0.000 ***)
Behavioral intentionsBI13.483.454.243.6912.11 (0.000 ***)
BI23.913.864.284.003.72 (0.026 *)
BI3 1−2.72−2.82−1.82−2.4912.44 (0.000 ***)
BI4 1−2.54−2.82−2.12−2.504.88 (0.009 **)
BI5 1−3.05−2.94−2.86−2.960.42 (0.657)
* p < 0.05, ** p < 0.01, *** p < 0.001, 1 Reverse scored for negative perceptions. Group 1: 20-year-old college students; Group 2: 30- to 40-year-old male workers; Group 3: 30- to 40-year-old housewives.
Table 10. Residents’ knowledge of particulate matter.
KnowledgeNumber of Correct Answers (%)
1. The influx of particulate matter is mainly caused by artificial actors, such as boilers, automobiles and power generation facilities138 (80.7)
2. More than 80% of particulate matter is from abroad, as a result of the yellow dust and smog from China39 (22.8)
3. Preliminary reduction measures against emissions of particulate matter are implemented nationwide and are targeted based on particulate matter concentration43 (25.1)
4. Ultra-particulate matter comprises very thin, small particles but causes deterioration of visibility in places where the flow of air is stagnant, creating obstacles to traffic and navigation118 (69.0)
5. When there is a particulate matter alarm, schools can prohibit outdoor classes, adjust the times of travel to and from school and temporarily shut down151 (88.3)
6. Domestic particulate matter concentrations are similar to those in major cities of other OECD countries, such as New York and London141 (82.5)
7. Even when exposure occurs for only a short time, particulate matter can penetrate directly into the alveoli, resulting in asthma, lung disease and even death119 (69.6)
8. The mask is a quasi-drug certified by the Food and Drug Administration that can only prevent exposure to particulate matter if the product is marked “KF94” or “KF80”133 (77.8)
9. Generally, high concentrations of particulate matter occur in spring and summer89 (52.0)
10. It is helpful to eat fruits and vegetables that are rich in water and vitamin C to combat the effects of high dust concentrations152 (88.9)
Table 11. Psychological influences on residents’ response behaviors.
Psychological AttributesMeanF (p-Value)
Group 1Group 2Group 3Total
Risk perceptionLikelihood14.084.334.744.358.58 (0.000 ***)
24.444.294.824.506.22 (0.002 **)
Susceptibility34.104.194.624.285.11 (0.007 **)
42.843.073.683.156.70 (0.002 **)
Severity54.104.154.584.274.69 (0.010 *)
63.343.413.863.513.10 (0.048 *)
Psychological distanceGeographic and temporal74.184.194.604.302.99 (0.053)
84.414.254.804.478.13 (0.000 ***)
Social93.924.194.704.2311.01 (0.000 ***)
104.444.434.924.5710.55 (0.000 ***)
Awareness114.024.134.764.279.96 (0.000 ***)
123.704.004.604.0511.86 (0.000 ***)
Perceived concerns 1Information distrust13−2.97−3.62−3.80−3.4010.84 (0.000 ***)
14−2.40−2.43−1.52−2.1513.65 (0.000 ***)
Externalizing responsibility15−4.04−3.96−4.084.020.30 (0.741)
16−3.98−4.52−4.704.3511.91 (0.000 ***)
Uncertainty17−2.68−2.88−2.78 −2.770.36 (0.692)
18−2.97−3.01−2.88−2.950.15 (0.857)
19−2.40−2.50−1.88−2.284.08 (0.019 *)
* p < 0.05, ** p < 0.01, *** p < 0.001, 1 Reverse scored for negative perceptions. Group 1: 20-year-old college students; Group 2: 30- to 40-year-old male workers; Group 3: 30- to 40-year-old housewives.
Table 12. Multiple regression analysis of the response behaviors to particulate matter.
VariableBStd ErrorBetat Valuep-Value
Constant8.1033.577 2.2650.025
Knowledge of PM0.6300.4430.0951.4240.156
Psychological attributes0.3730.0820.3754.5550.000
PM-related symptoms0.1910.0700.2192.7370.007
Note: R = 0.55, R2 = 0.31, Adj. R2 = 0.30.

