Article

Proposal of Laser-Induced Ultrasonic Guided Wave for Corrosion Detection of Reinforced Concrete Structures in Fukushima Daiichi Nuclear Power Plant Decommissioning Site

1
Tsuruga Comprehensive Research and Development Center, Japan Atomic Energy Agency, Fukui 914-8585, Japan
2
Collaborative Laboratories for Advanced Decommissioning Science, Japan Atomic Energy Agency, Fukushima 319-1195, Japan
*
Author to whom correspondence should be addressed.
Appl. Sci. 2019, 9(17), 3544; https://doi.org/10.3390/app9173544
Submission received: 3 July 2019 / Revised: 21 August 2019 / Accepted: 23 August 2019 / Published: 29 August 2019

Abstract

:
Remote-controlled, non-destructive testing is necessary to detect corrosion of the reinforced concrete structures at the Fukushima Daiichi Nuclear Power Plant (NPP) de-commissioning site. This work aims to demonstrate that laser-induced ultrasonic guided wave technology can be applied to achieve this task. Hence, accelerated electrolytic corrosion is performed on a reinforced concrete specimen fabricated by embedding a steel rod into mortar. Waveforms of the laser-induced ultrasonic guided wave on the rod are measured with a previously employed piezoelectric transducer (PZT) probe, for each fixed corrosion time. Based on the results of Fourier and wavelet transforms of the waveforms, issues concerning the detection and extent of rebar corrosion are discussed. It is exhibited that the changes in bonding strength due to corrosion are distinguishable in the frequency domain of the ultrasonic signal.

1. Introduction

1.1. Background and Motivation

De-commissioning the Fukushima Daiichi Nuclear Power Plant (NPP) is one of the most important challenges we must overcome, an effort that will take decades. In general, structures deteriorate over time; a de-commissioning site is no exception, making safe and continuous work difficult. The earthquake and subsequent tsunami damaged the site’s reinforced concrete structures, while seawater injection damaged those inside the Primary Containment Vessel. Such structures are not only the targets to be dismantled but also comprise an important basis for future de-commissioning work, meaning it is imperative that these structures do not collapse during work. The current status of the Fukushima Daiichi NPP can be observed on the Tokyo Electric Power Company website [1,2]. To guarantee workability hereafter, we have begun developing non-destructive testing and structural health monitoring techniques for the Fukushima Daiichi NPP [3,4].
Na et al. [5,6,7,8] have reported a testing method for the interface condition between concrete and rebar with an ultrasonic guided wave. Their work considered the arrangements of the ultrasonic sensor and transmitter, as well as its effect on the ultrasonic signals. Meanwhile, Miller et al. [9] investigated the Time of Flight change in a propagating ultrasonic guided wave due to corrosion and mass load. Most recently, Beata Zima [10] conducted research on the guided wave on the rod of reinforced concrete from theoretical, numerical, and experimental perspectives. These research papers provide useful information on and insight into testing methods for the Fukushima Daiichi NPP. However, these previous endeavors employed Piezoelectric Transducer (PZT) or Electromagnetic Transducer (EMAT) in their work, neither of which accounted for remote operations.
To accommodate the aging of the reinforced concrete structure, many researchers have addressed remote non-destructive testing. For example, Kurahashi et al. [11] reported on the Laser-hammering method, which irradiates the concrete surface using a pulsed-laser. The excited ultrasonic waves generated by the pulsed-laser are measured using a remote Laser Doppler Vibrometer (LDV). Akamatsu et al. [12], on the other hand, presented a testing method using Long Range Acoustic Devices and LDV.
These approaches target remote and rapid operations; however, they focus on the cracks or voids near the concrete surface, which is not suitable for detection of inner corrosion. Non-destructive testing for the de-commissioning site must have the integration potential for a remotely controllable robot system, in order to avoid radiation exposure. Hence, in this paper, we focus our interest on laser technology. A pulsed-laser can excite ultrasonic waves [13] and a continuous wave laser can be applied to dig holes in the concrete surface [14] to expose the rebar. Flexible optical fiber cable can guide the laser in narrow or complicated spaces, and various LDVs are commercially available.

1.2. Methodology for Testing Reinforced Concrete Structures

Figure 1 depicts the typical deterioration process of reinforced concrete: A long-term or external force causes cracks to allow water intrusion; rust, then, starts to appear on the rebar, which pushes the concrete away. As a result, the bonding between the rebar and concrete weakens, and the number of cracks increases. The rebar eventually dissolves in the water, which decreases the diameter of the rebar rapidly. The bonding strength is different in each phase of the deterioration. When the reinforced concrete is healthy, the bonding between the rebar and the surrounding concrete is strong; however, when the diameter of the rebar becomes thinner due to corrosion, the bonding strength weakens.
Ultrasonic guided wave technology [15,16] is a form of propagation, in which the smallest dimension of the structure restricts the diffracted wave so that the energy can travel further; meaning it can propagate over long distances along longitudinal directions simultaneously. Various works that aimed to apply non-destructive testing and structural health monitoring have been reported [17]. In this study, we focus on the following point of view: When the bonding is strong, the ultrasonic wave propagated on the rebar can be modeled as an ultrasonic guided wave on a double-layer rod, where the first layer is the rod and the second layer is infinite concrete. In this case, the stress and displacement in the rod are constrained by the surrounding concrete, and the resulting ultrasonic waveform is quite complicated. When the bonding is weakened enough due to corrosion, the ultrasonic wave can be modeled as a single-layer cylindrical rod.
Figure 2 displays our concept of the detection method, based on an ultrasonic guided wave and applied laser technologies, for the corrosion of the reinforced concrete structure of the Fukushima Daiichi NPP. In our concept, an ultrasonic guided wave is excited by irradiating the rebar with a pulsed-laser, after uncovering the concrete. The ultrasonic waveform, which changes depending on the degree of deterioration, is measured at another measurement point.

2. Experimental and Analysis Method

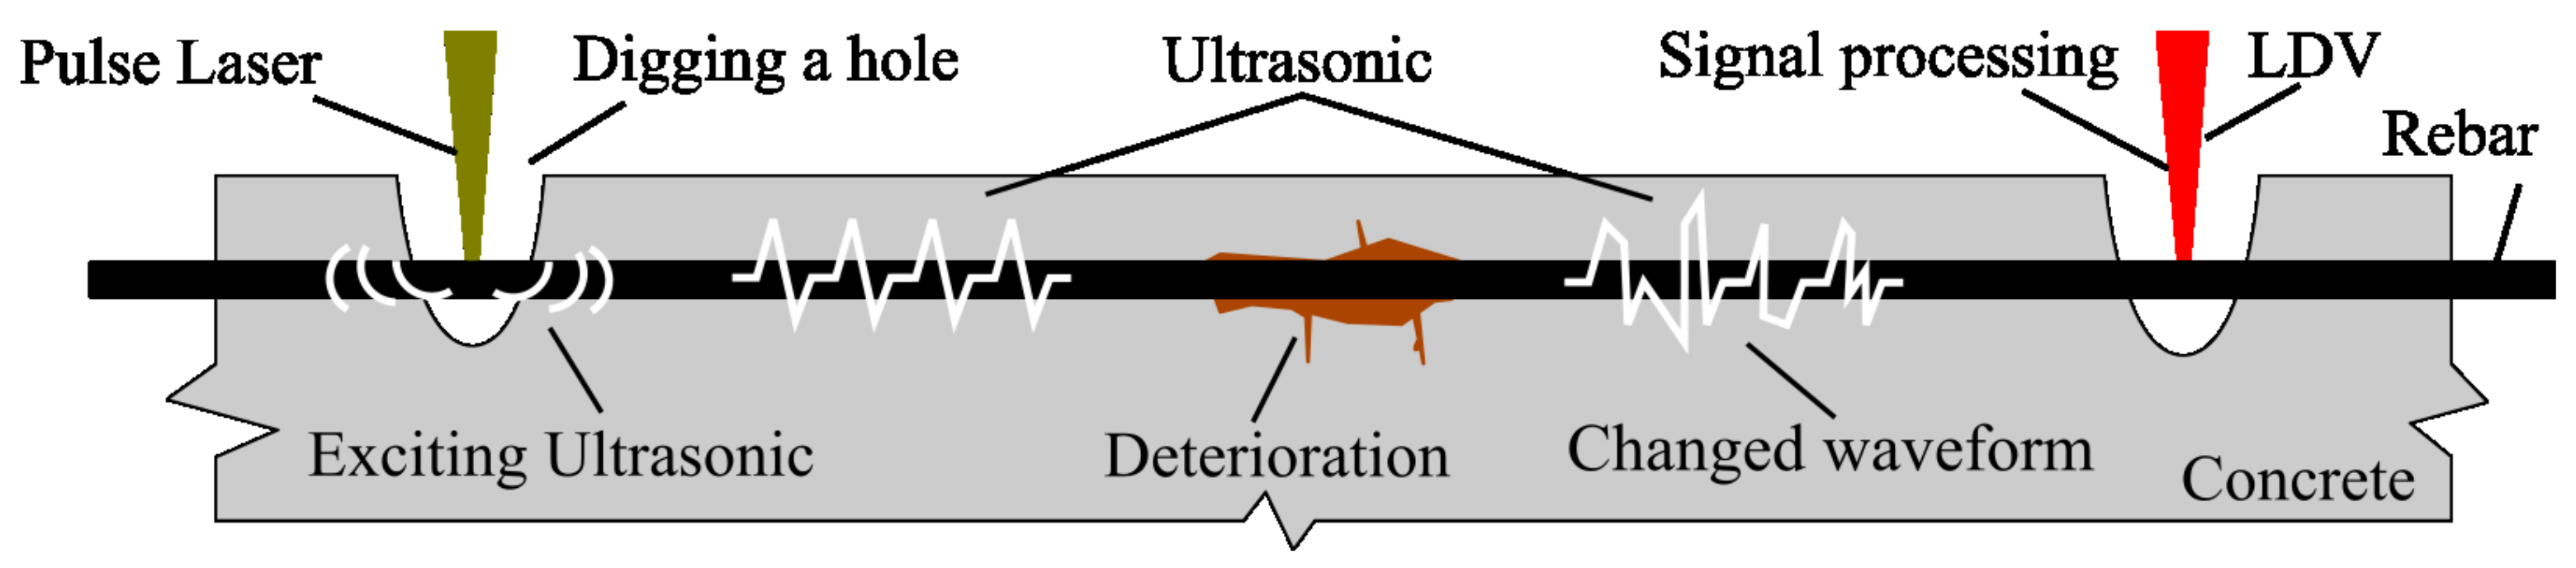
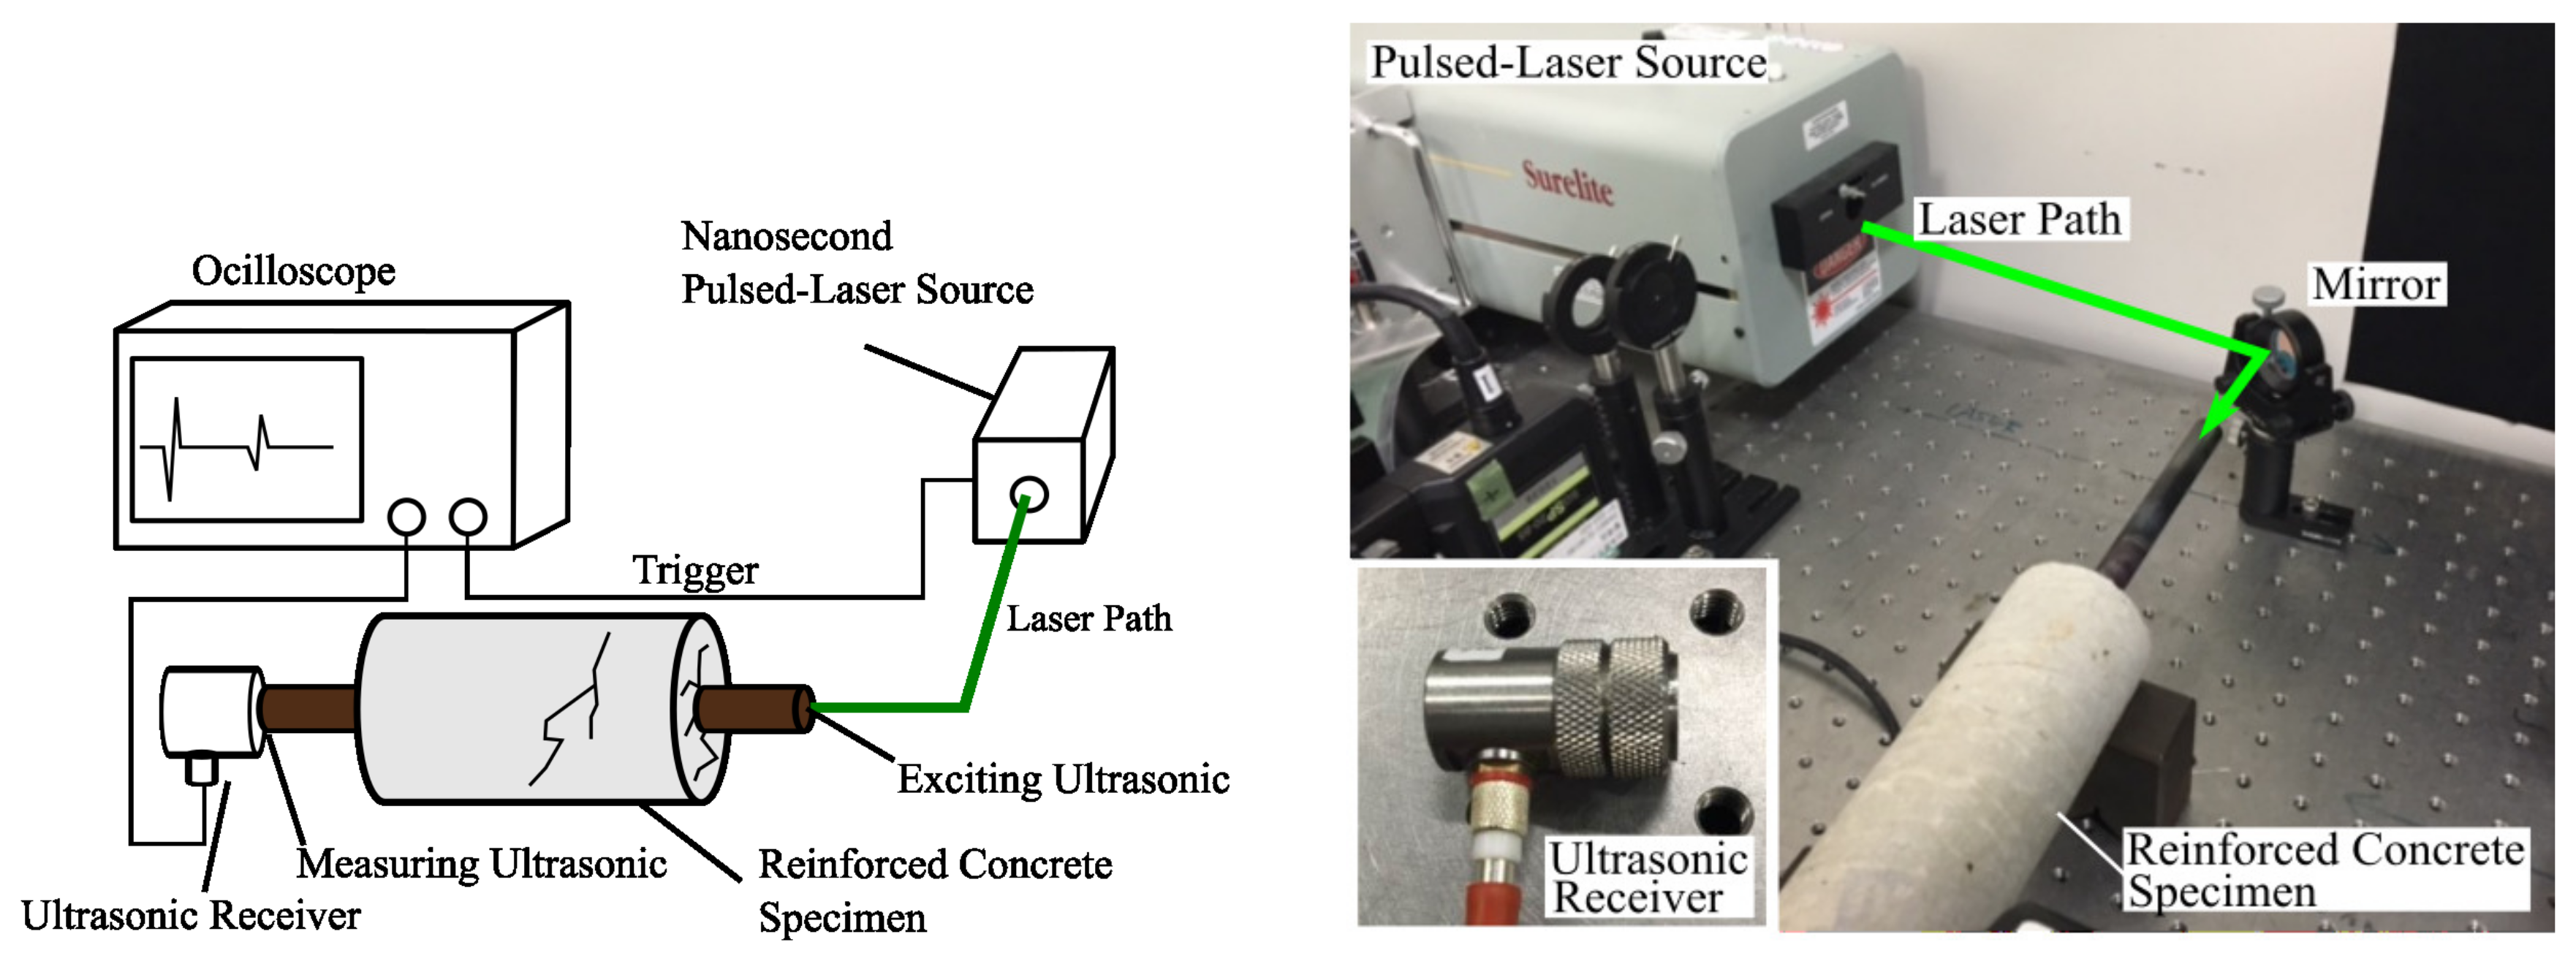
2.1. Setup and Procedure

Figure 3 presents a schematic illustration and actual photo of the experimental setup. Note that a PZT ultrasonic probe was used as the sensor, which is composed of an oscilloscope, an ultrasonic receiver (B10C5N W-335, GNES Corp., Kyoto, Japan), a nanosecond pulsed-laser source (Surelite: SL-2-10, Continuum, Milpitas, CA, USA), and a reinforced concrete specimen. The ultrasonic guided wave is excited by irradiating the pulsed-laser on the bottom surface of the rod, and the waveform is measured, at the opposite surface, by the ultrasonic probe. Parameter settings of the pulsed-laser source are listed in Table 1. Investigation of the ultrasonic signals obtained from the experiment was conducted through Fourier and wavelet analyses, in order to compare the signals with the group velocity dispersion curves.

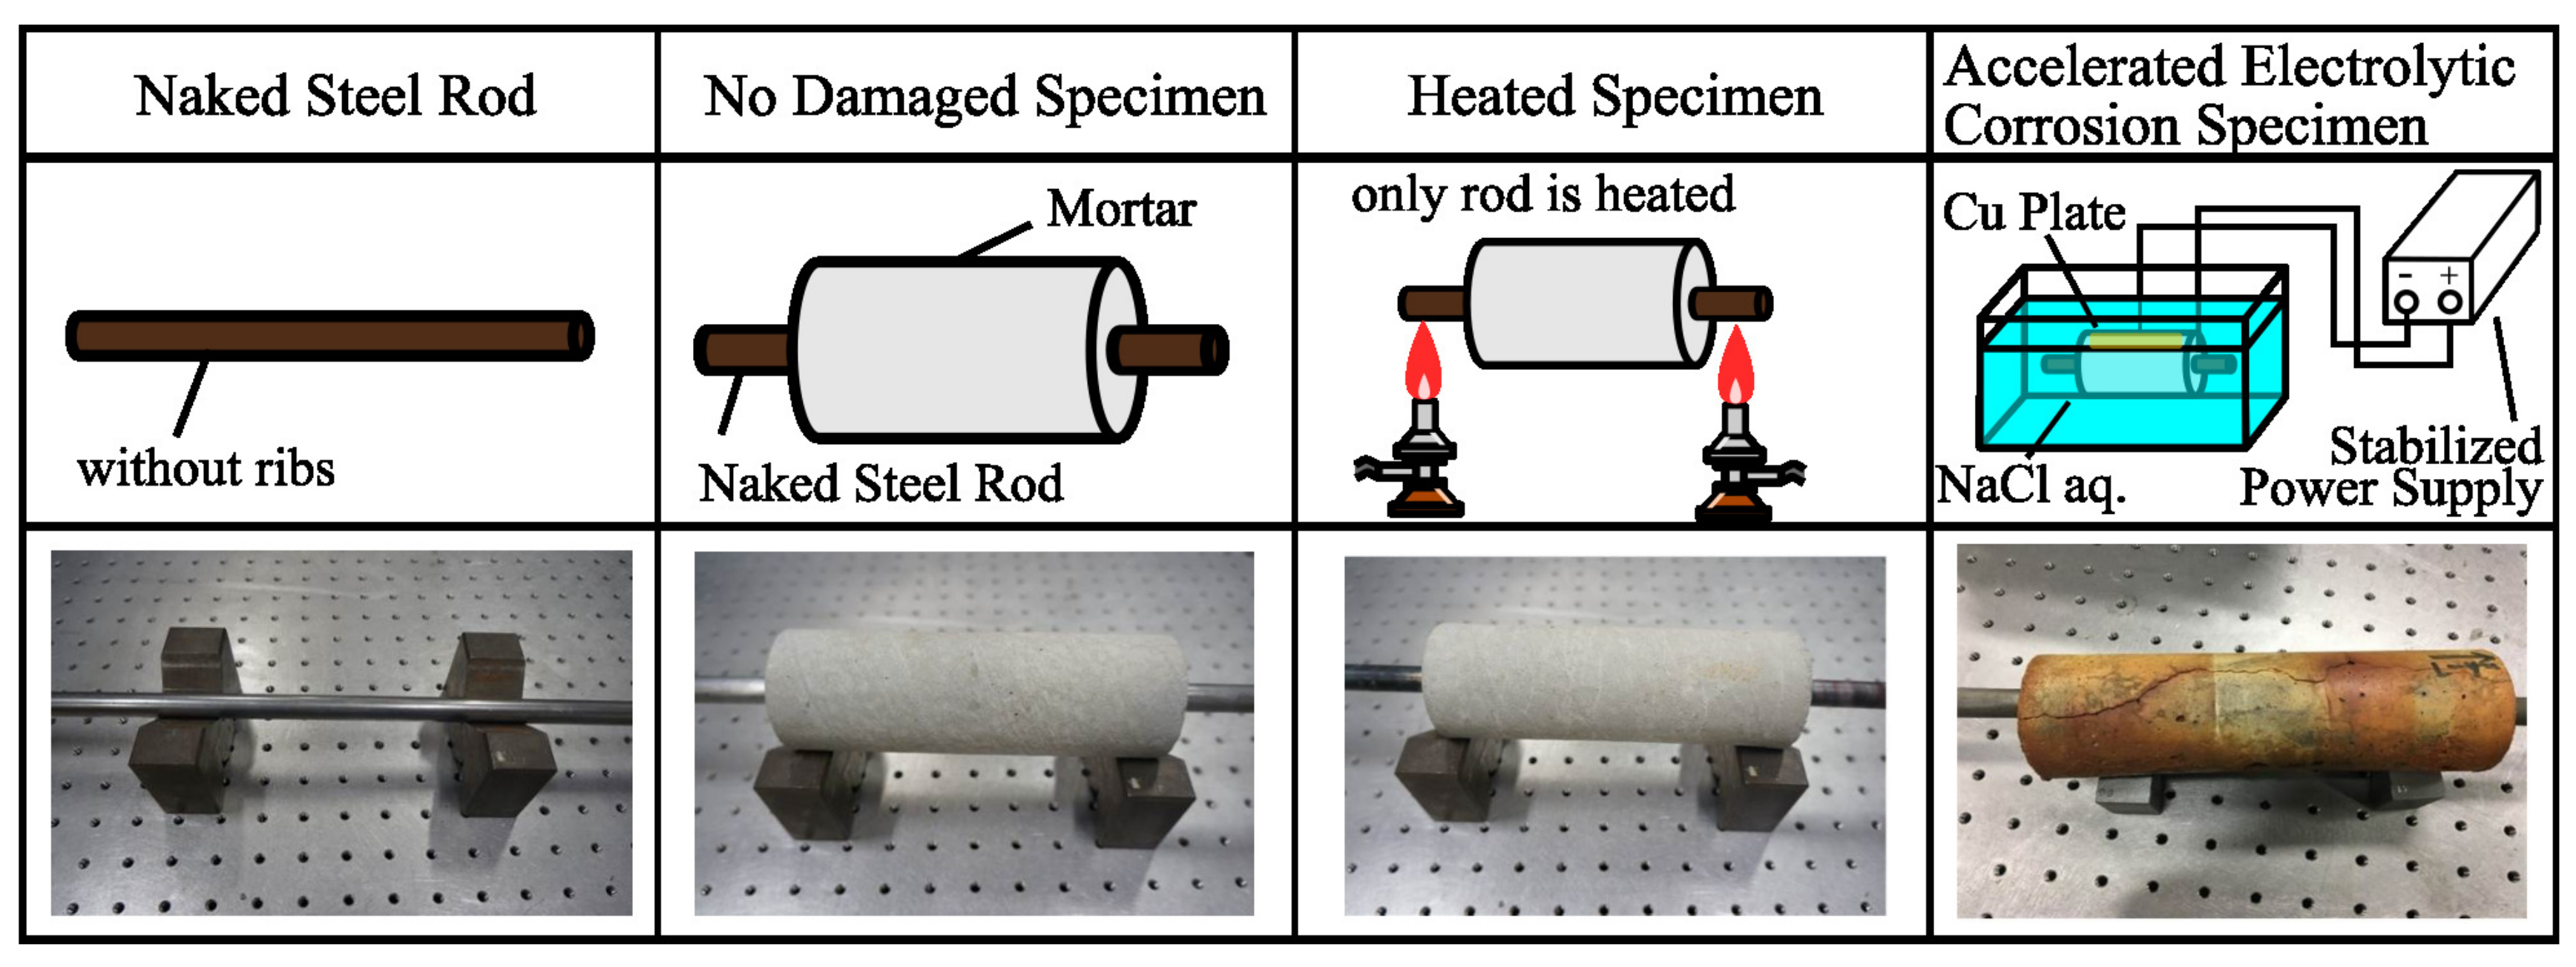
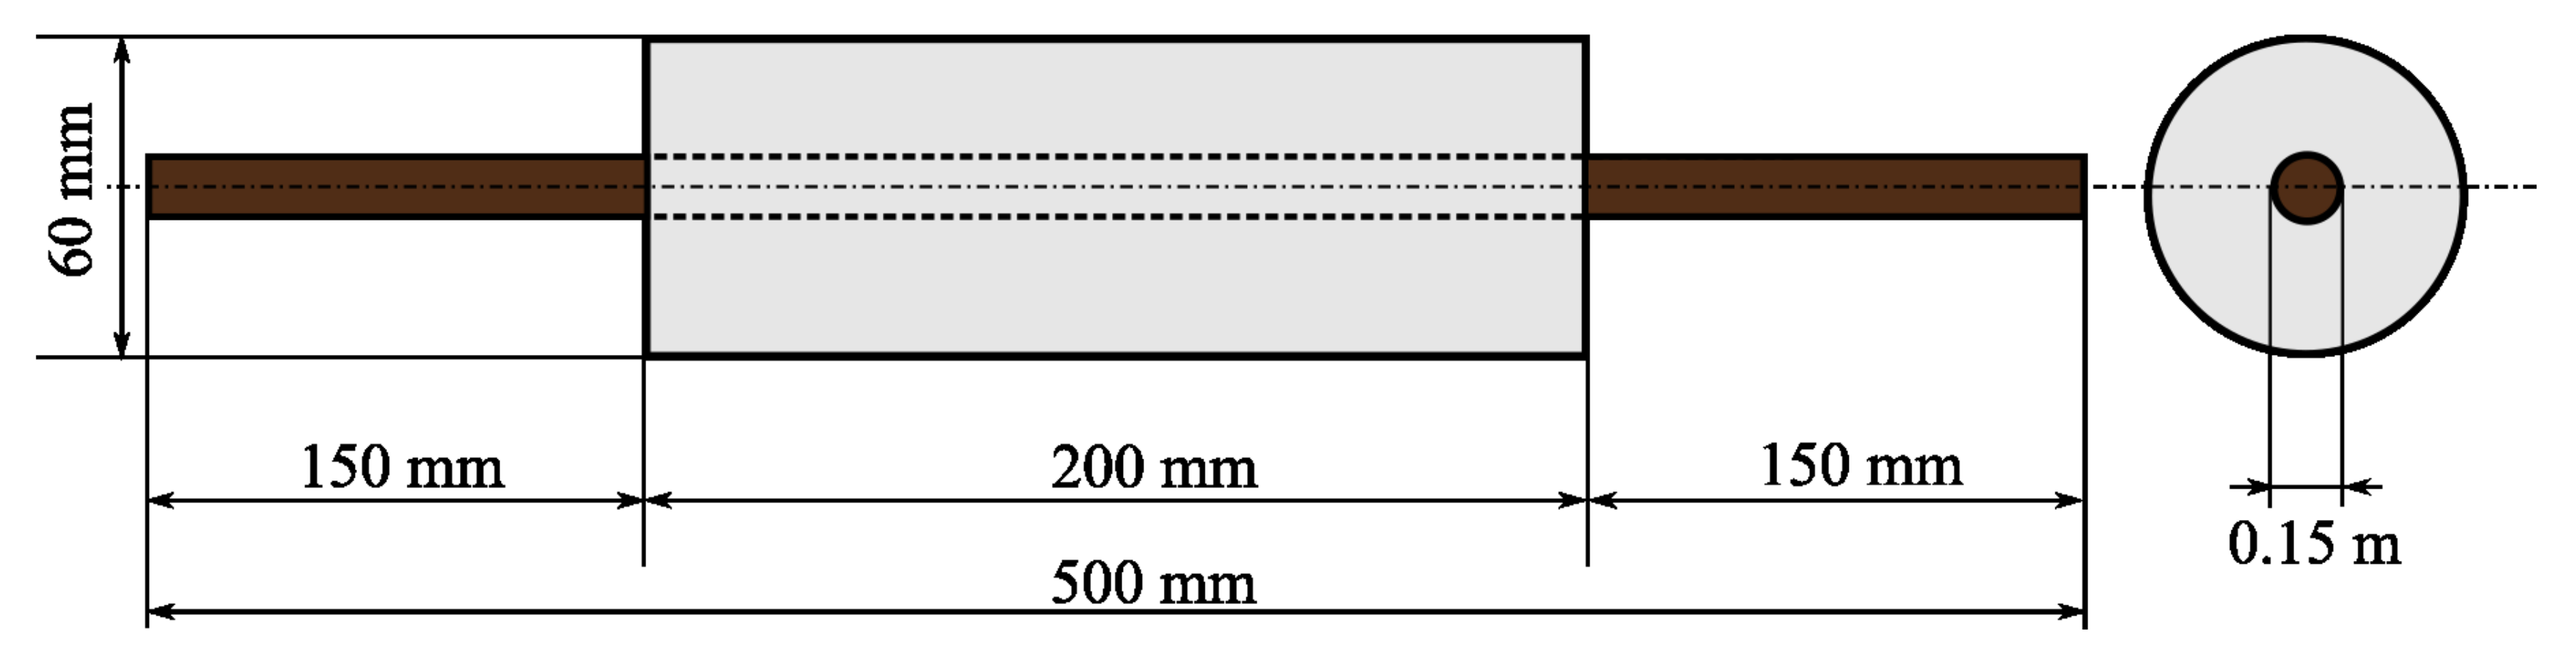
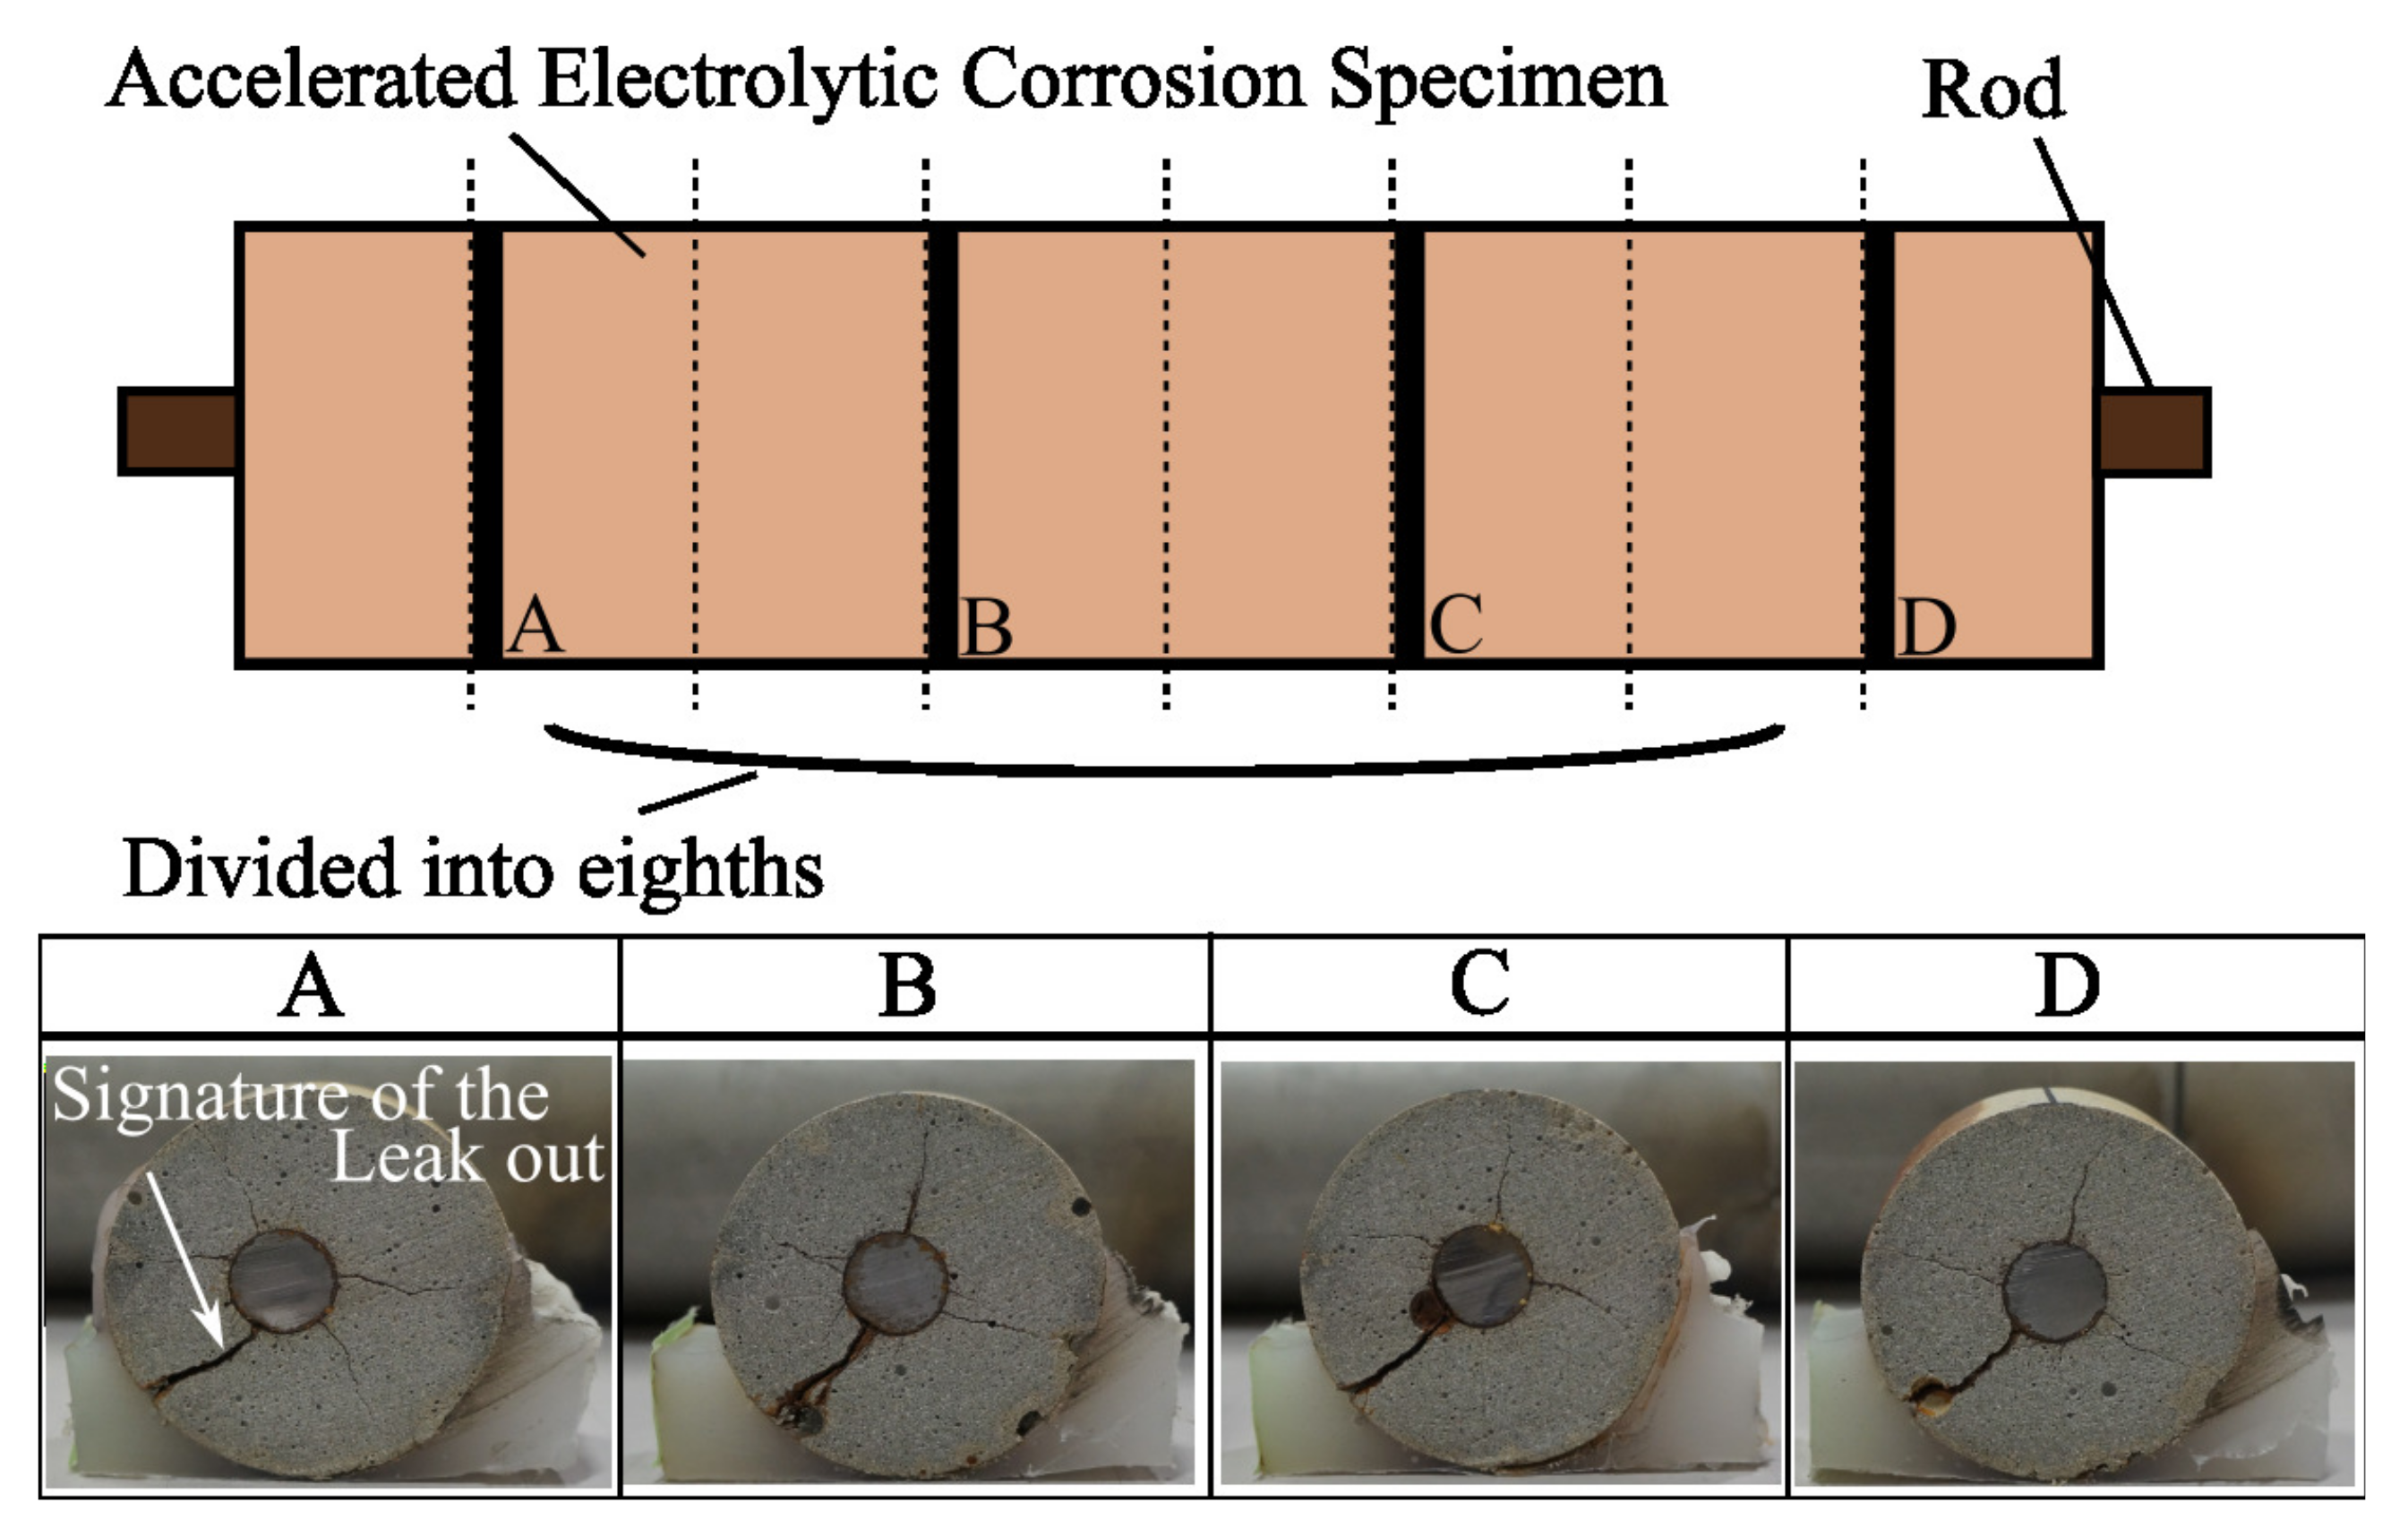
2.2. Reinforced Concrete Specimens

Four specimens of reinforced concrete, each with different bonding strengths between the rod and outer mortar, were prepared for the experiment; denoted as the naked steel rod, intact, heated, and accelerated electrolytic corrosion specimens. The naked steel rod had no ribs, making it easy to analyze the waveform. The intact specimen was made by embedding a naked steel rod into cylindrically poured mortar. On the other hand, the heated specimen was made by burning the rod with a gas burner torch, and the accelerated electrolytic corrosion specimen was made by dipping the intact specimen into a sodium chloride water bath electrified with a stabilized power supply. The steel rod and the copper plate attached to the mortar were connected to the anode side and cathode side, respectively. Two amperes of electric current were passed for up to 60 h. Figure 4 outlines the schematics of the specimens along with actual photos, while Figure 5 details the dimensions of the specimens.

2.3. Signal Analysis Method

Wavelet transform (WT) [18] is a time-frequency translation of the time-series signal, which is an alternative to the Short Time Fourier Transform (STFT). It is known that a sufficiently large time window is appropriate for characterizing low-frequency components in the time-series signal. On the contrary, a narrow time window is adequate for characterizing high-frequency components. The theoretical justification for this lies in Heisenberg’s uncertainty principle, which dictates that a fixed time window cannot simultaneously maintain adequate resolution in time and frequency [18]. This presents a disadvantage for the STFT and supports our choice of WT. WT has been applied to various fields to analyze ultrasonic signals [19,20,21], as the wavelet coefficients in the time-frequency co-ordinate can be presented as a contour map, which illustrates characteristic features of the ultrasonic signal at a glance. In this work, the WT is written as follows:
W T ( u , s ) = + U ( t ) ψ ^ ( t u s ) d t ,
where u, s, U ( t ) , and ψ ^ ( t ) are the time shift parameter, scaling parameter, ultrasonic signal, and complex conjugate of the mother wavelet function, respectively. The mother wavelet function ψ ( t ) is defined as:
ψ ( x ) = 1 2 π σ e x p ( x 2 σ 2 ) e x p ( 2 π x ) .
The Gabor mother wavelet was selected because it has the best balance between time and frequency resolution, based on the uncertainty principle, and as previous studies using the Gabor mother wavelet have successfully characterized ultrasonic signals [19,20,21].
The group velocity dispersion curve is the frequency–velocity curve of the ultrasonic guided wave, which is obtained by calculating the characteristic equation [15]. In this experiment, we assumed that the symmetric logitudinal mode is dominant, as pulse-laser ablation was used for exciting the ultrasonic wave [13]. Therefore, the Pochhammer frequency equation was used to obtain the dispersion curves, as follows:
2 α β ( β 2 + k 2 ) J 1 ( α a ) J 1 ( β a ) ( β 2 k 2 ) J 0 ( α a ) J 1 ( β a ) 4 k 2 α β J 1 ( α a ) J 0 ( β a ) = 0 ,
α = ω 2 C L 2 k 2 1 2 , β = ω 2 C T 2 k 2 1 2 , C p = ω k ,
where a, ω , k, C L , C T , J, and C p are the rod radius, circular frequency, wavenumber, longitudinal and transverse bulk wave velocities, Bessel function of the first kind, and phase velocity, respectively. The phase velocity of each vibration mode can be obtained by substituting k and ω satisfying Equation (3) into C p of Equation (4). Meanwhile, the group velocity dispersion curve is obtained from the following equation by substituting C p into Equation (4).
C g ( f ) = ω k = C p 2 ( C p ω C p ω ) 1 = C p 2 ( C p f C p f ) 1 .
The result of the WT can be mapped onto frequency–velocity co-ordinates by dividing the length of the rod, L, used in this experiment by time shift parameter, u. Then, W T ( L / u , s ) of the ultrasonic signal obtained from the experiment and C g ( f ) are compared, and the modes contained by the ultrasonic signal are investigated.

3. Results

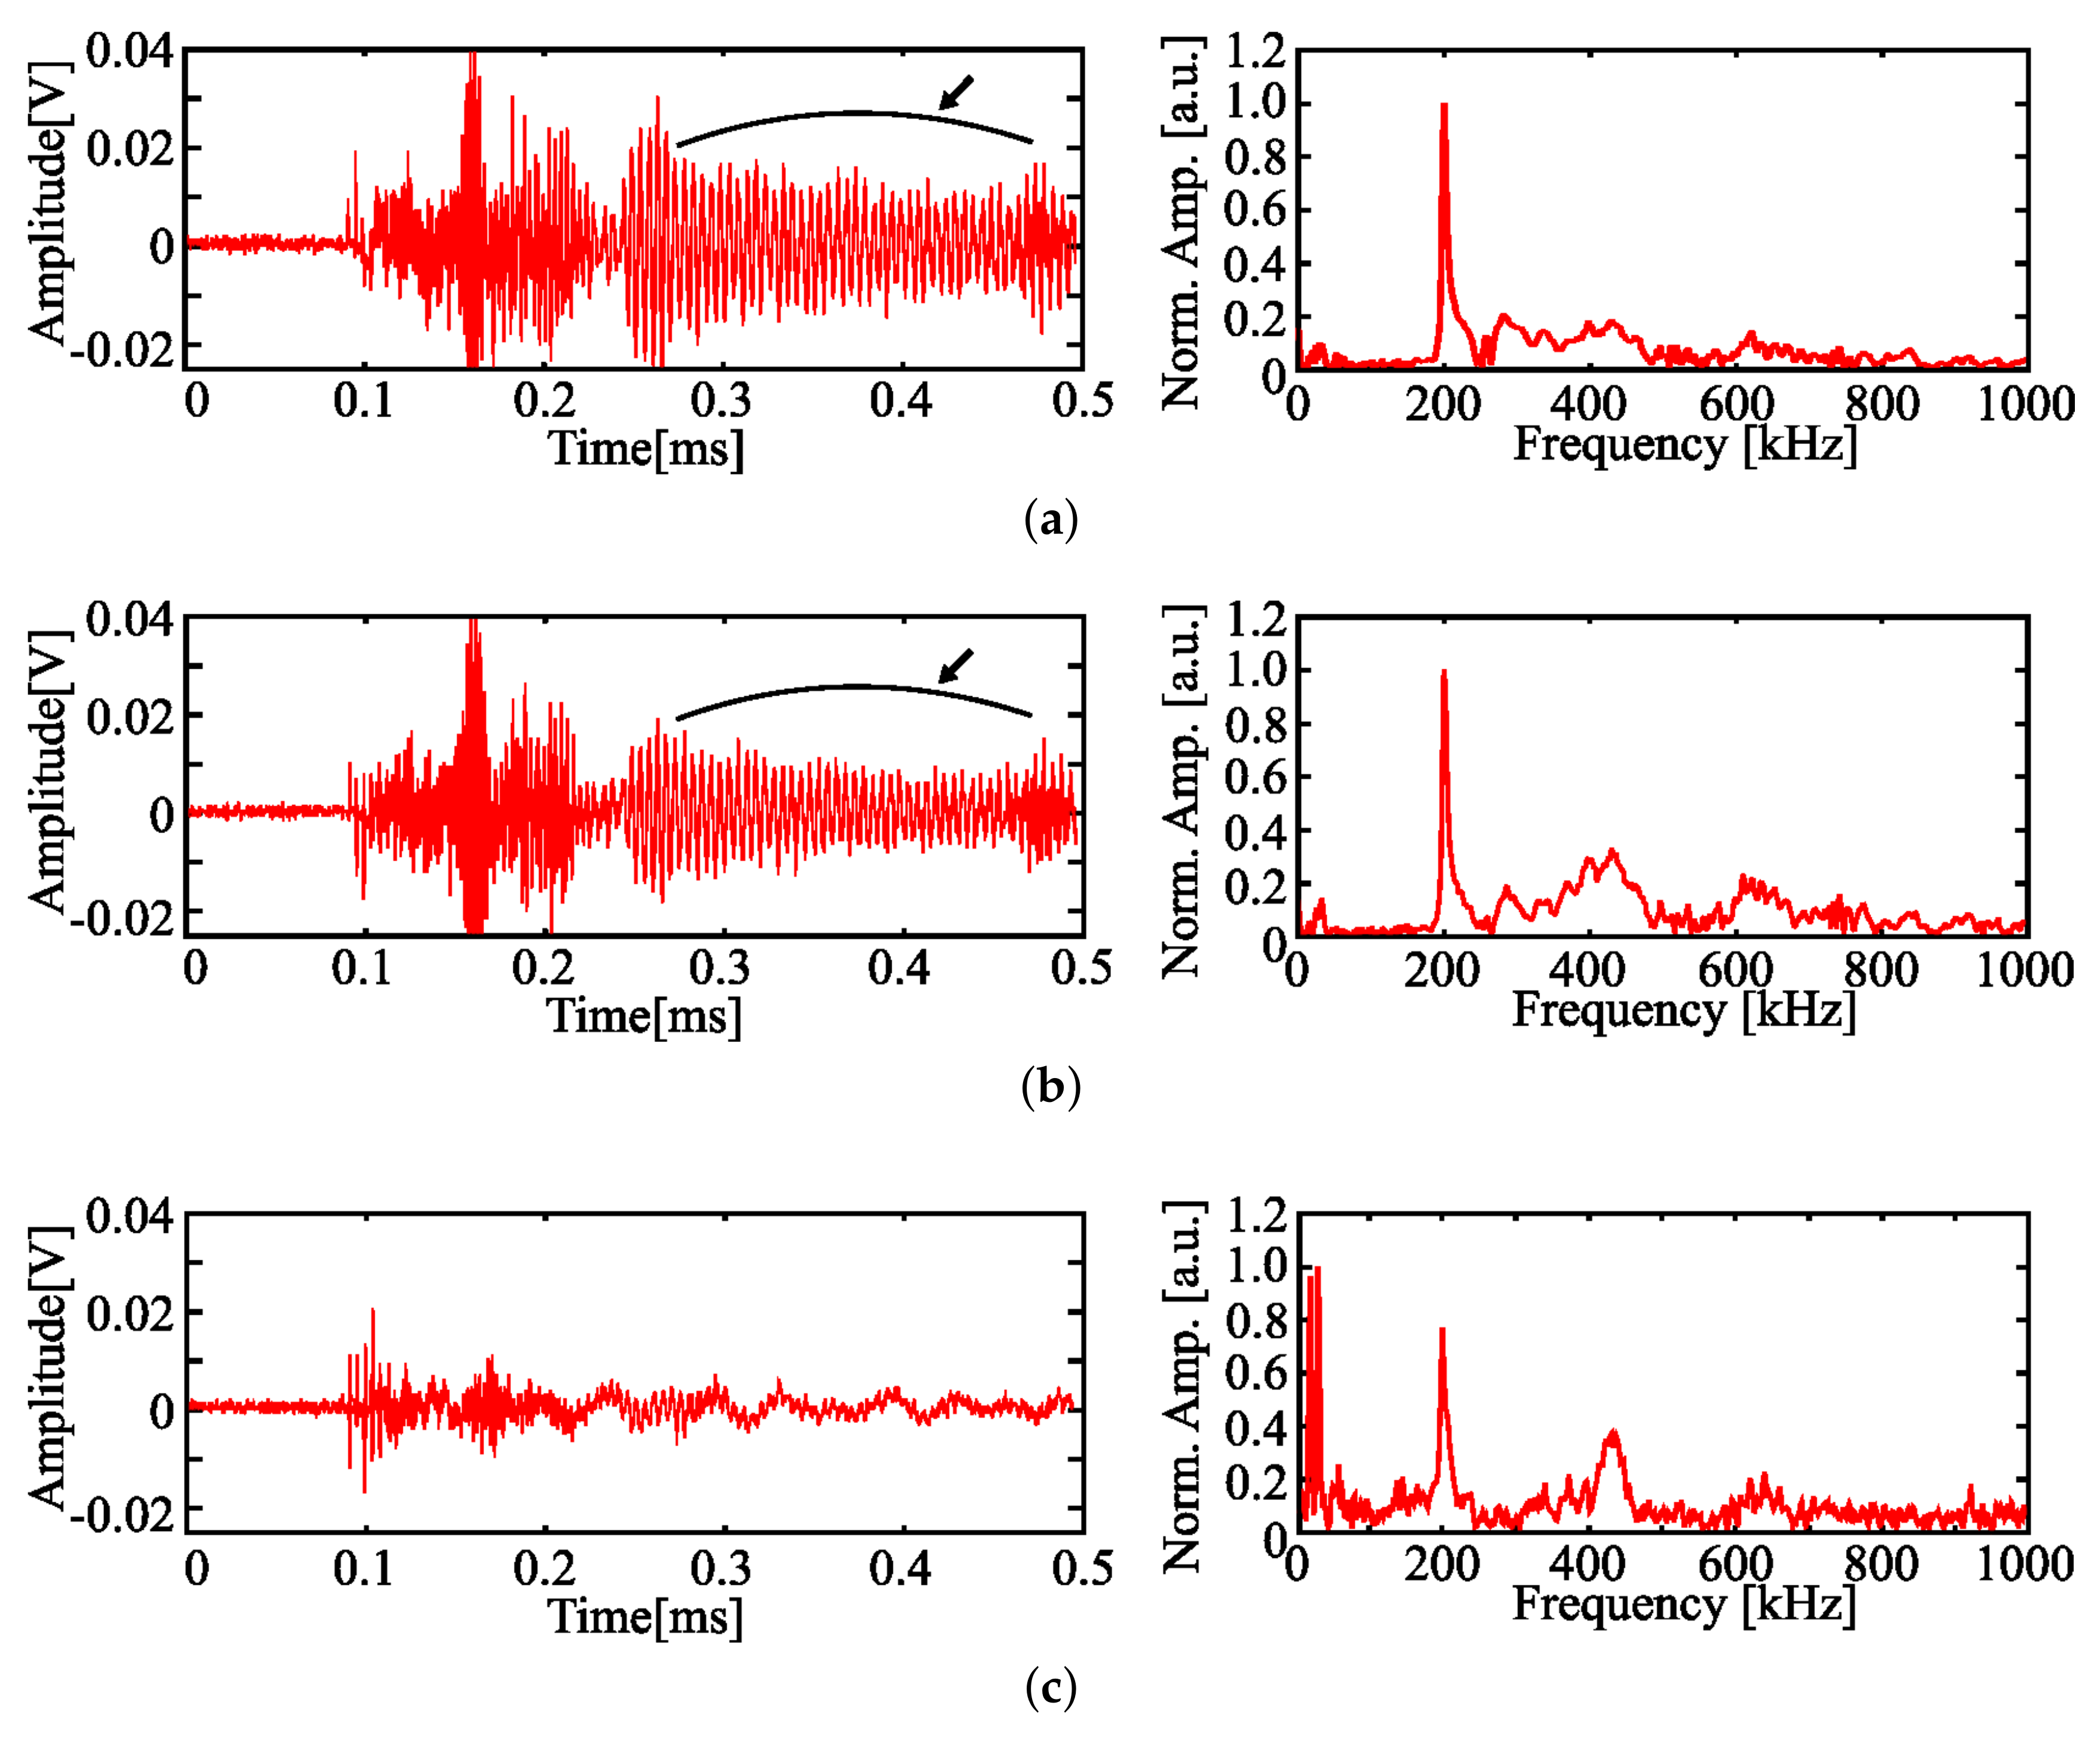
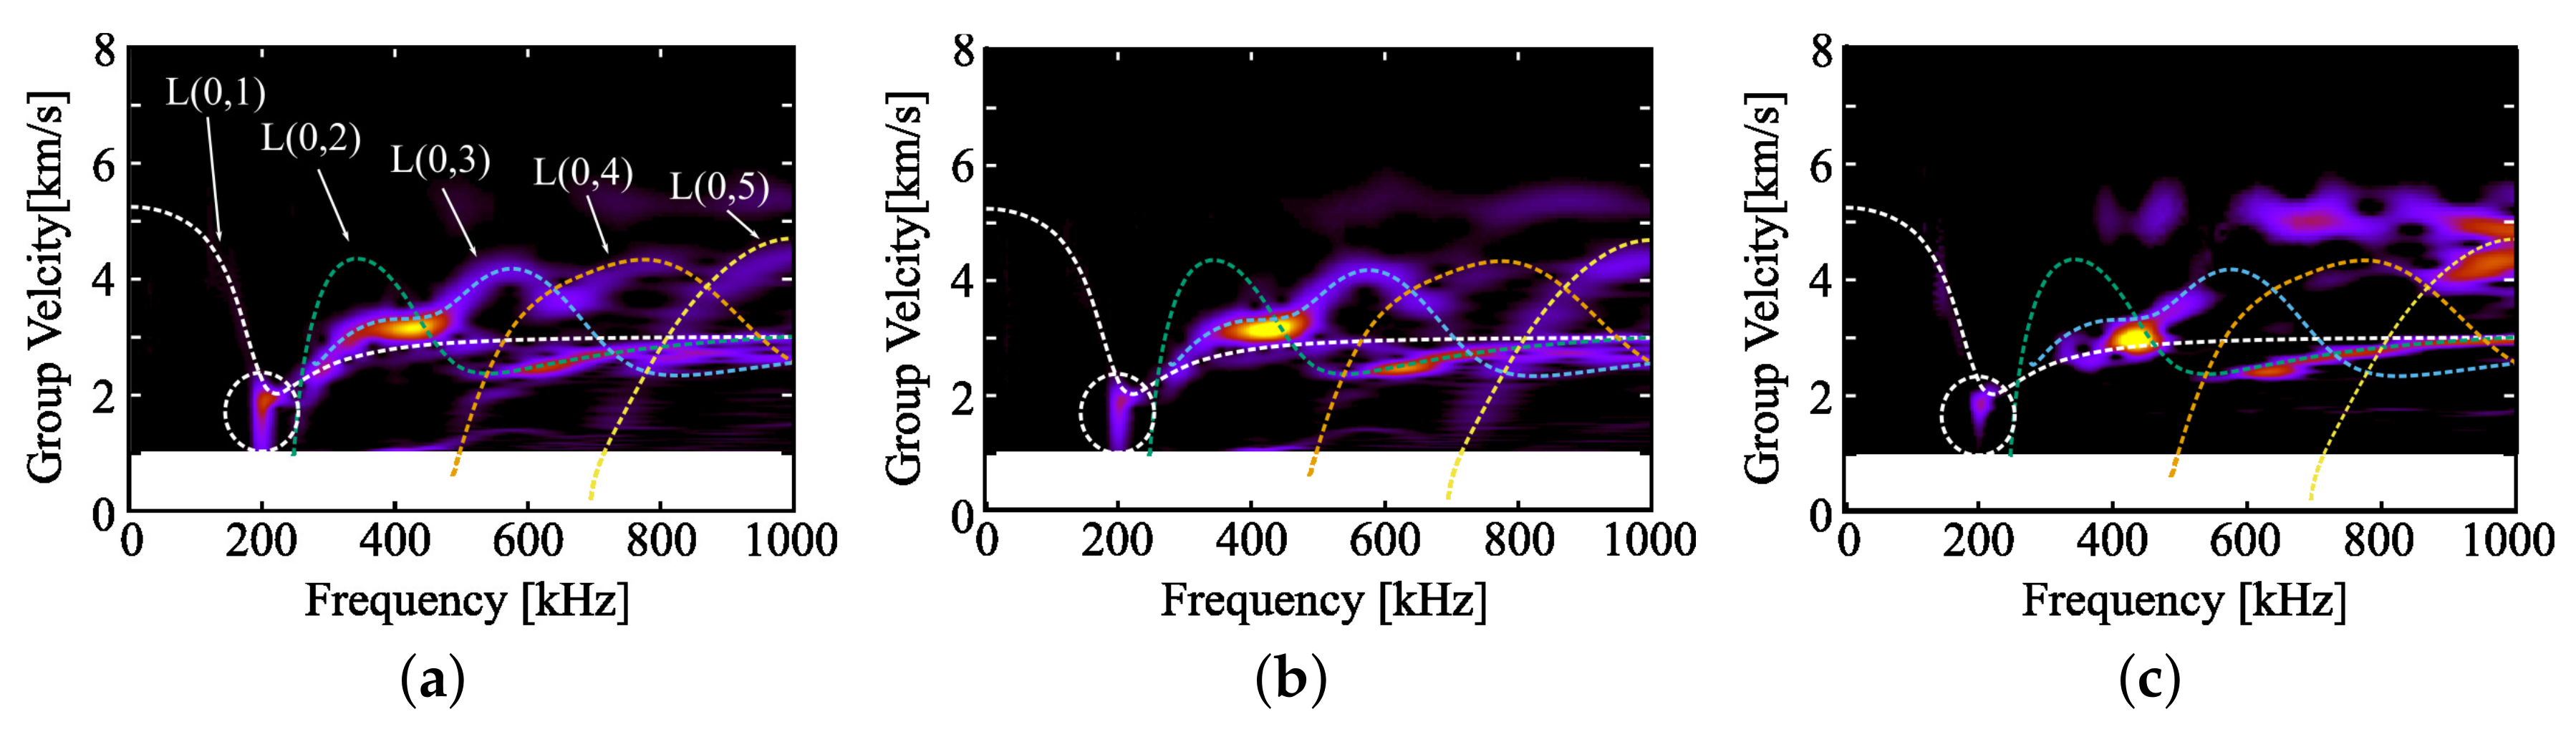
3.1. Result of Naked Steel Rod, Heated, and Intact Specimens

The first experiment was conducted on the naked steel rod, heated, and intact specimens, in terms of bonding. The naked steel rod had no bonding, while the heated specimen had weakened bonding due to thermal expansion and contraction; on the other hand, the intact specimen had strong bonding. The ultrasonic waveforms and frequency spectrums are exhibited in Figure 6, and Figure 7 demonstrates the comparison between the analytical group velocity dispersion curve and the WT of the ultrasonic waveform. Figure 6a–c represent the naked steel rod, heated, and intact specimens, respectively. Further, L(n, m) in Figure 7 represents the n-th circumferential order and m-th longitudinal guided wave mode. The mother wavelet used for the WT was the Gabor wavelet of Equation (2) and σ = 4.5. This value was selected by trial and error to improve visibility in the contour plot. The bulk longitudinal wave velocity, C L ; bulk torsional wave velocity, C T ; and radius, a; used to calculate the group velocity in Equations (3)–(5) were 5889 m/s, 3148 m/s, and 7.5 mm, respectively.

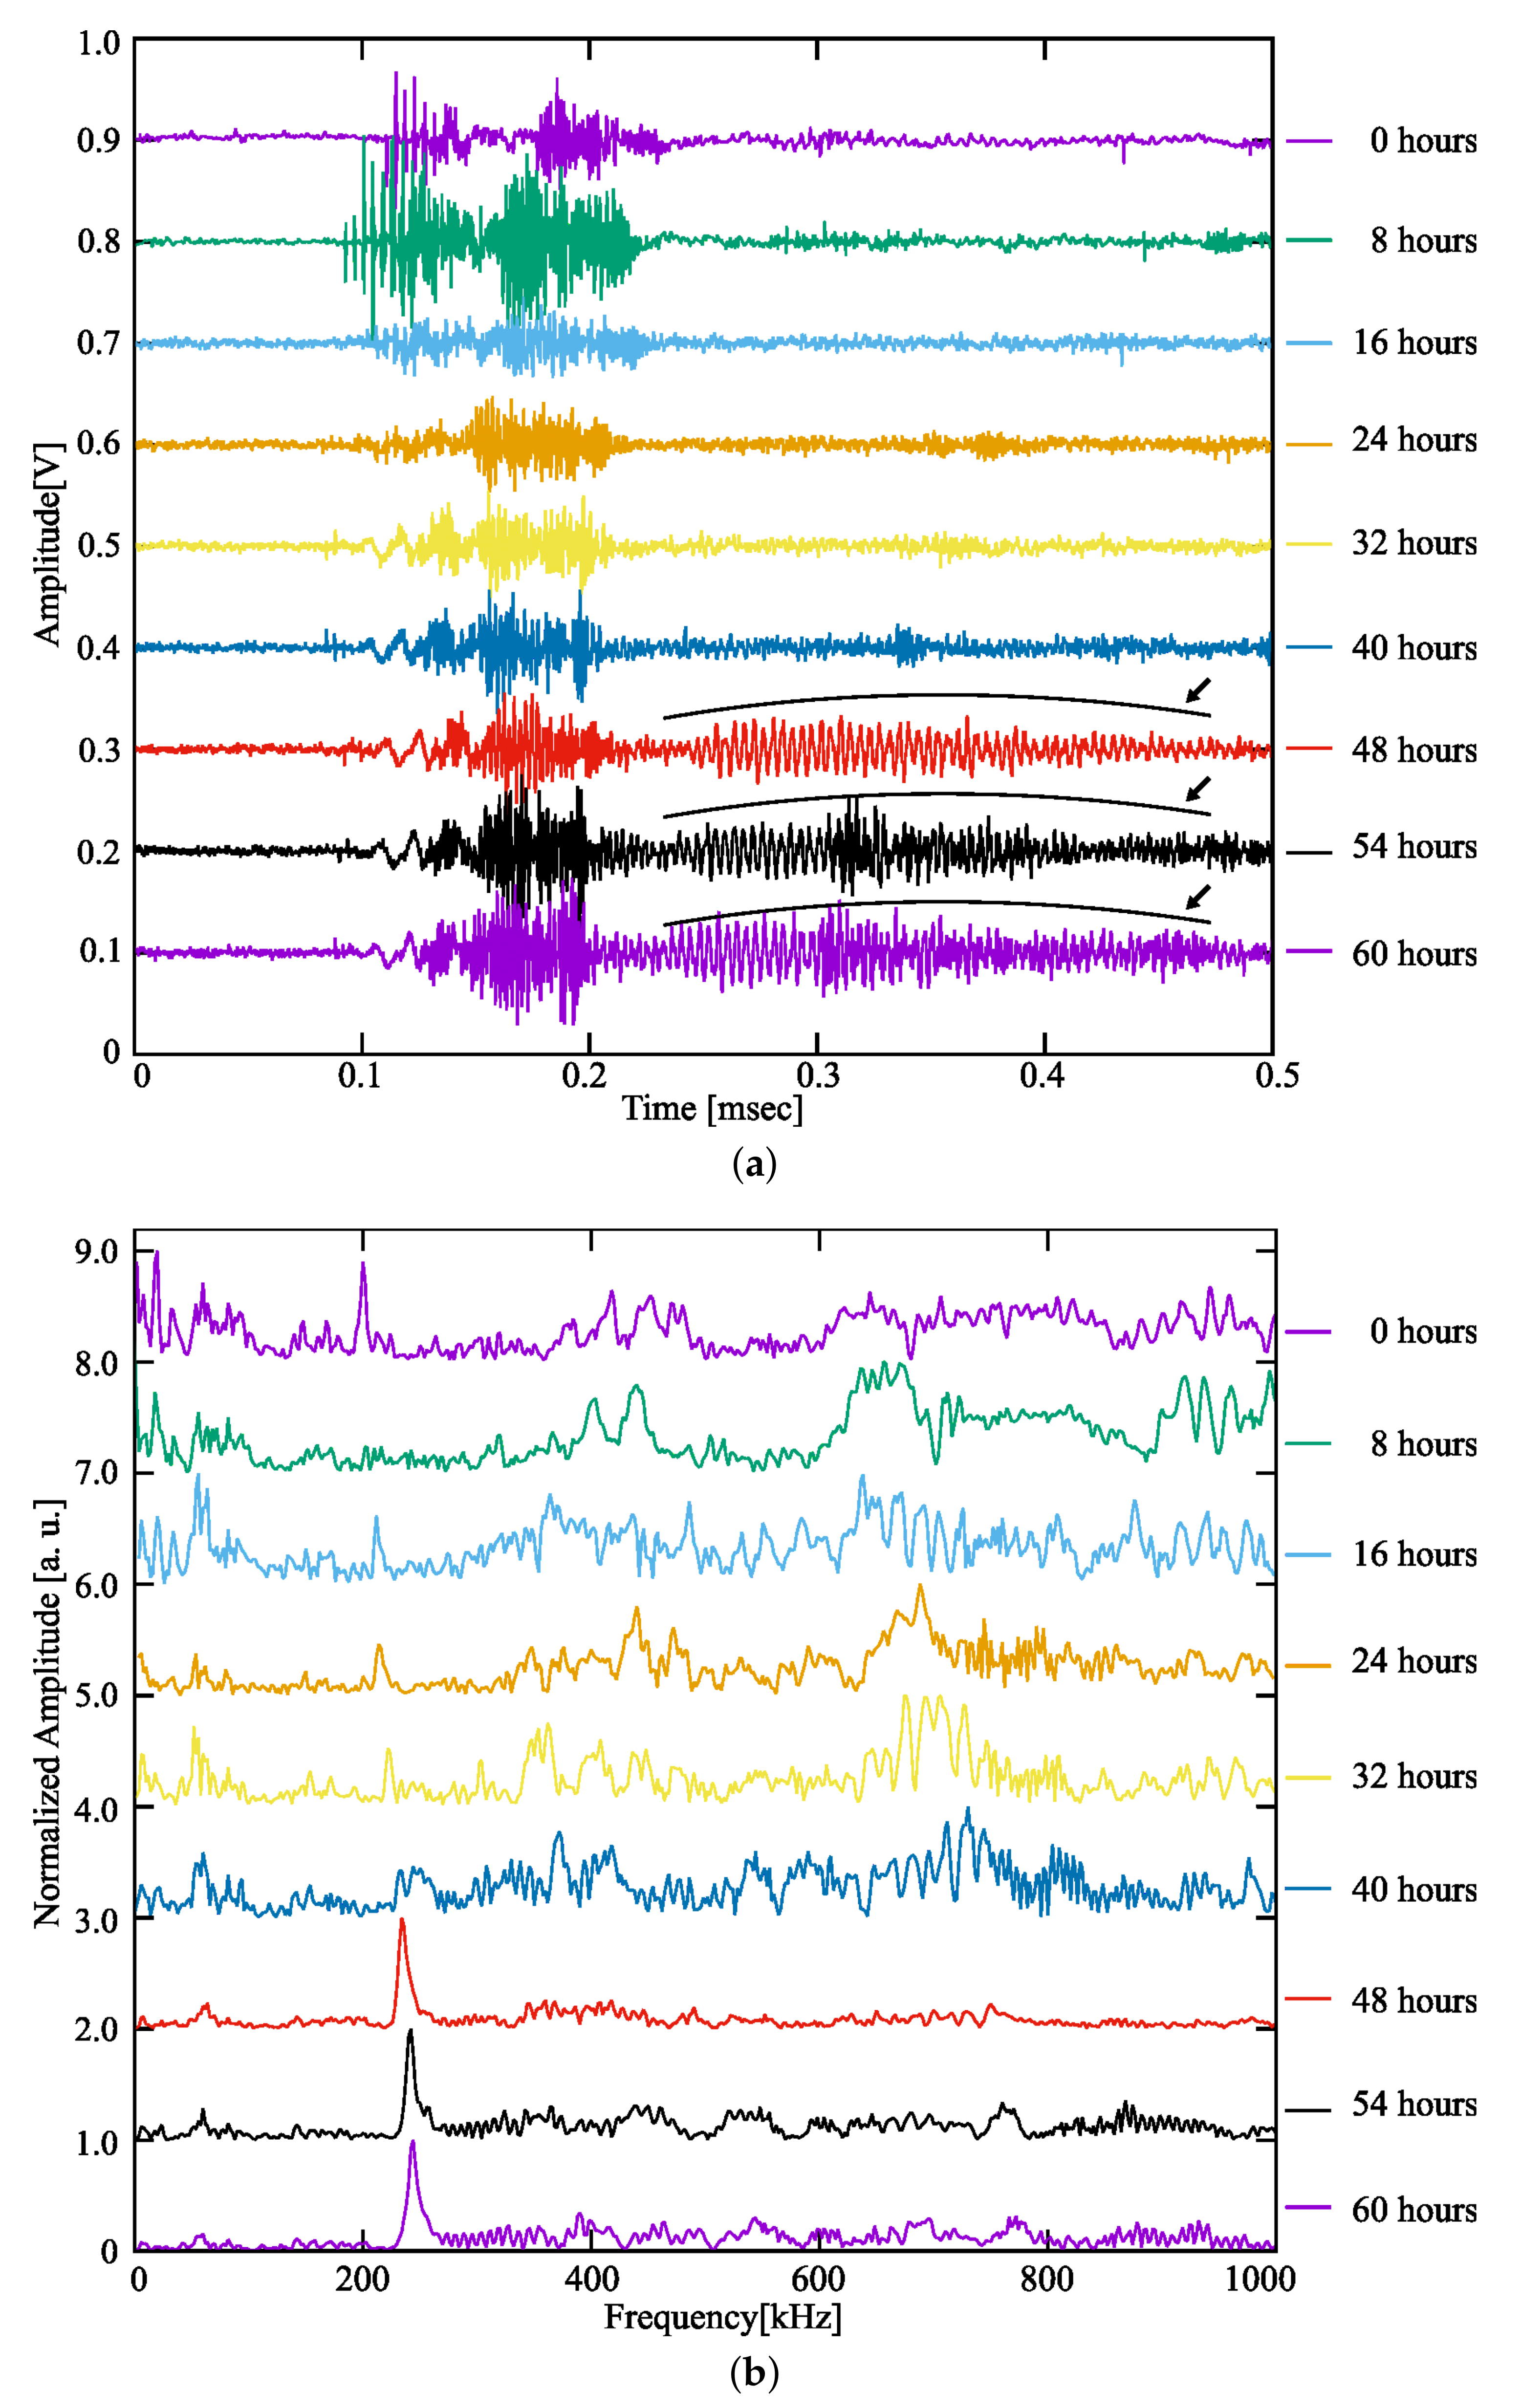
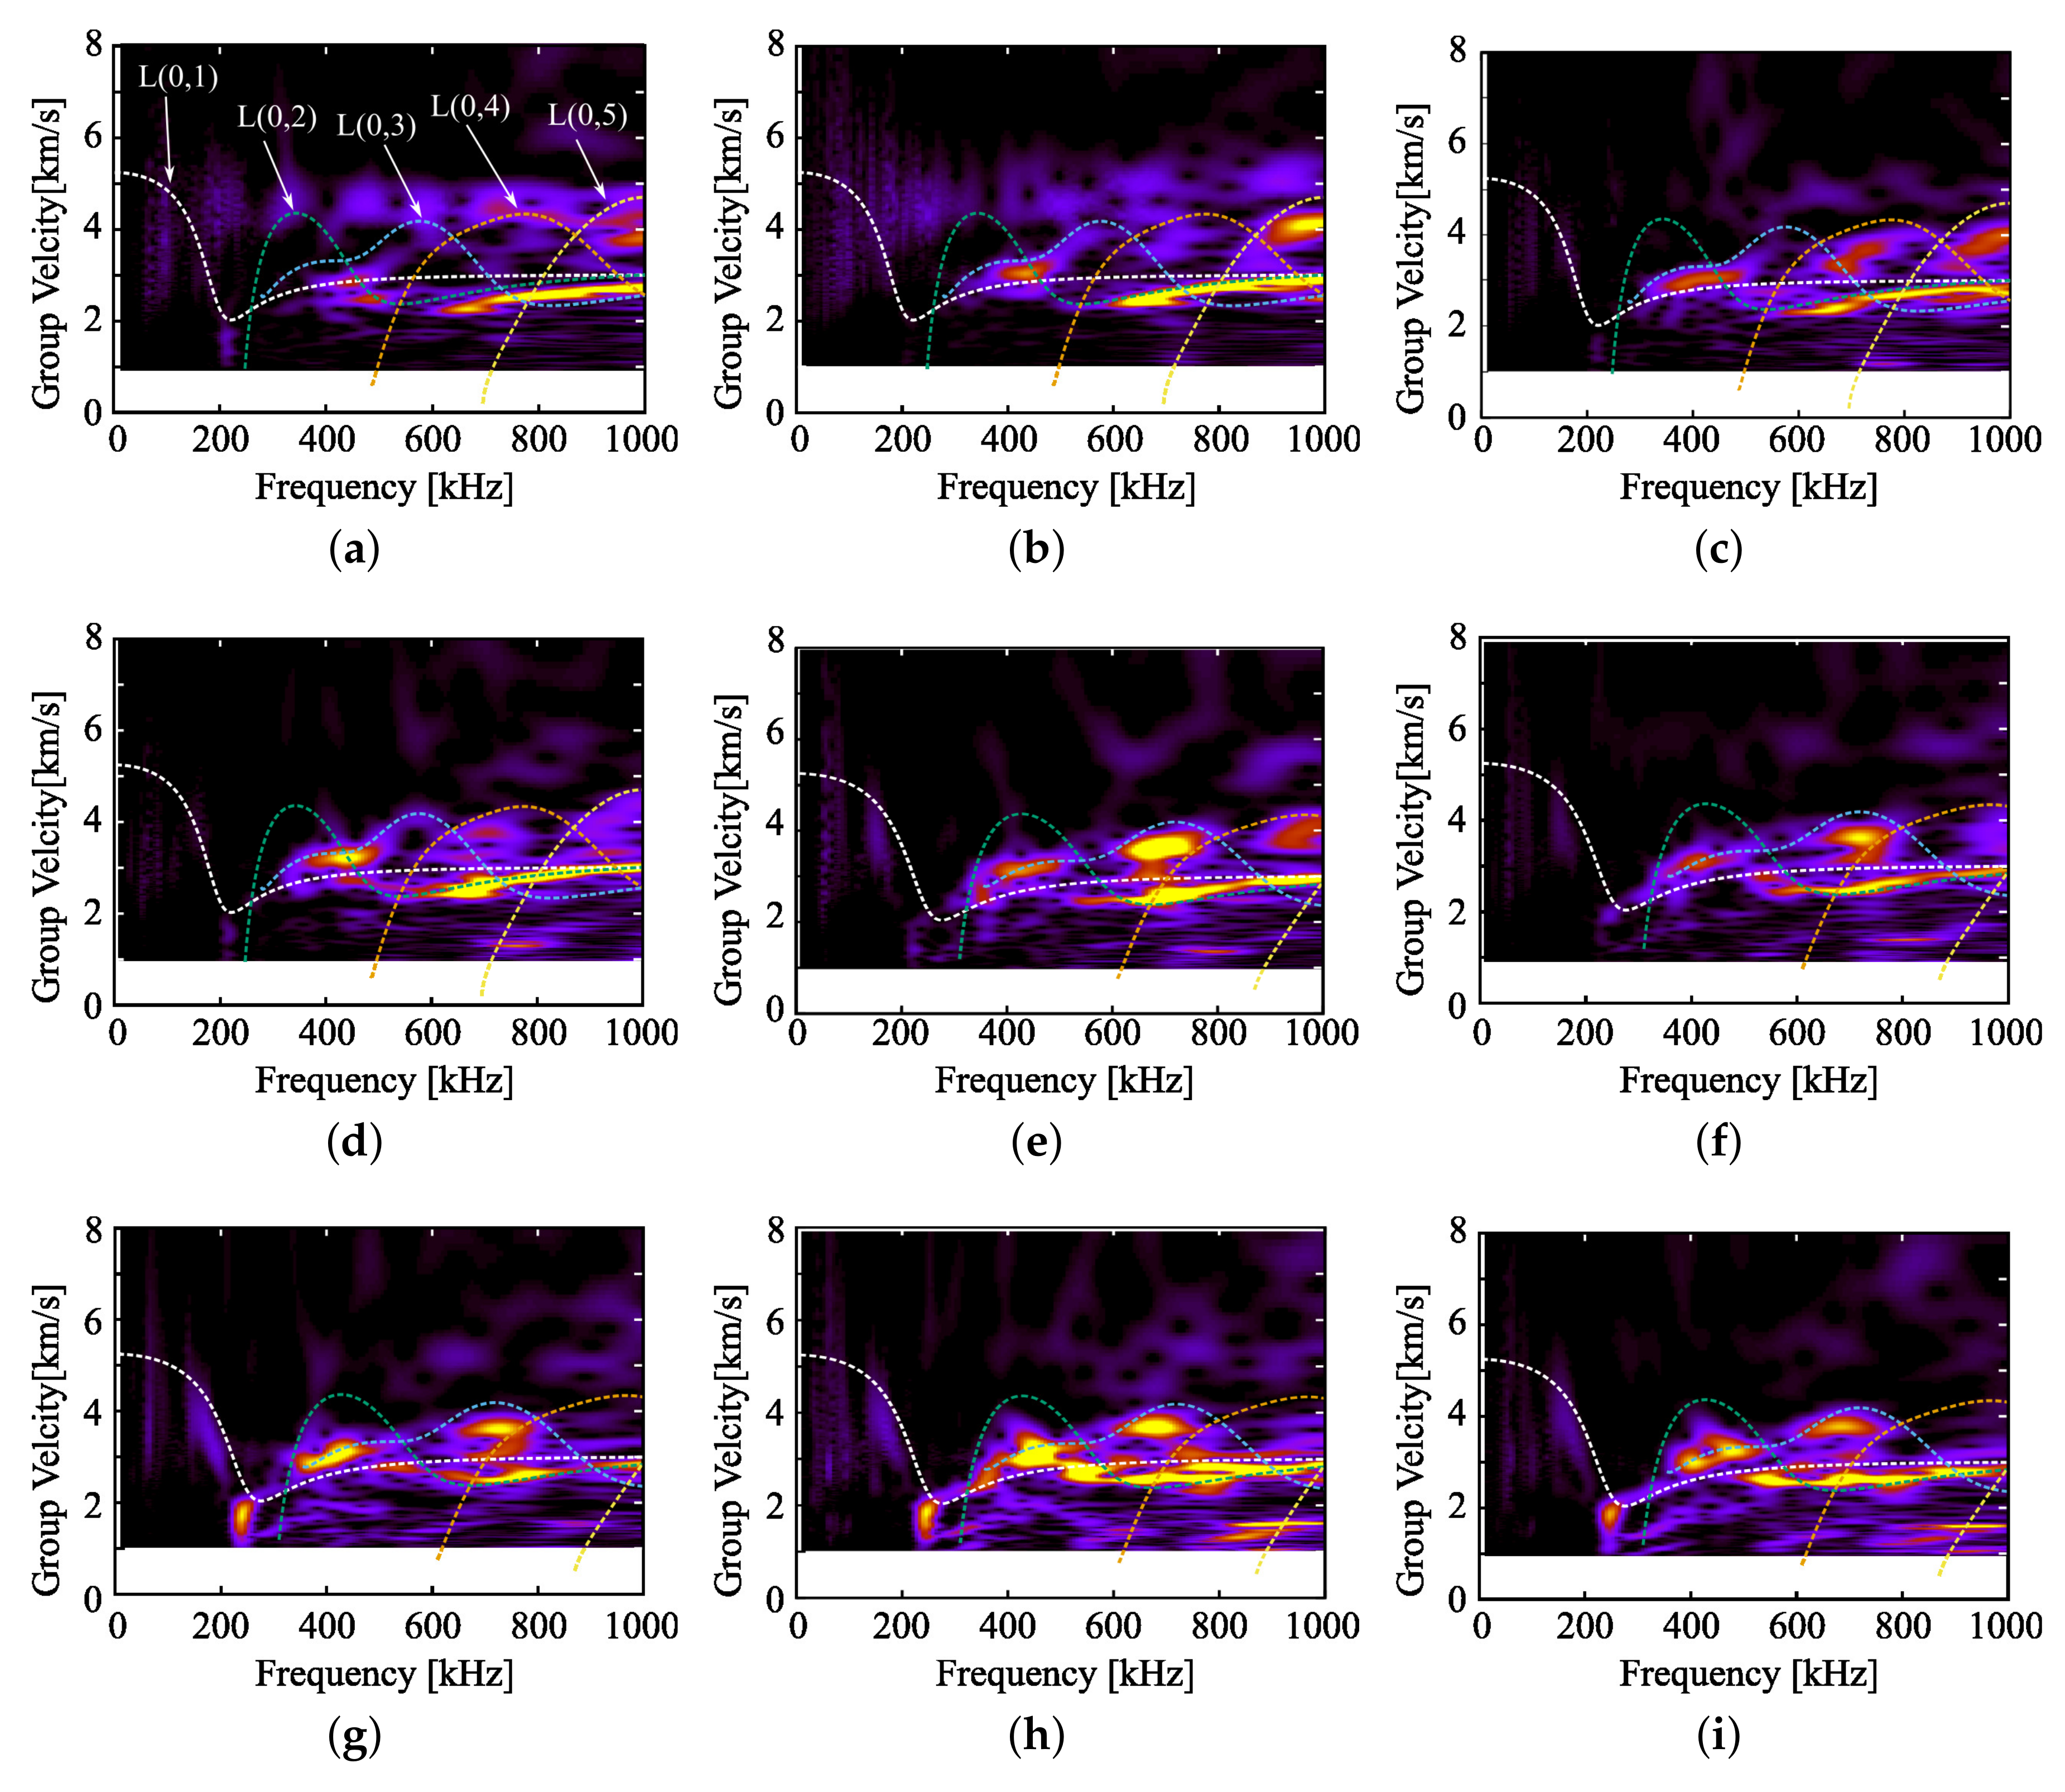
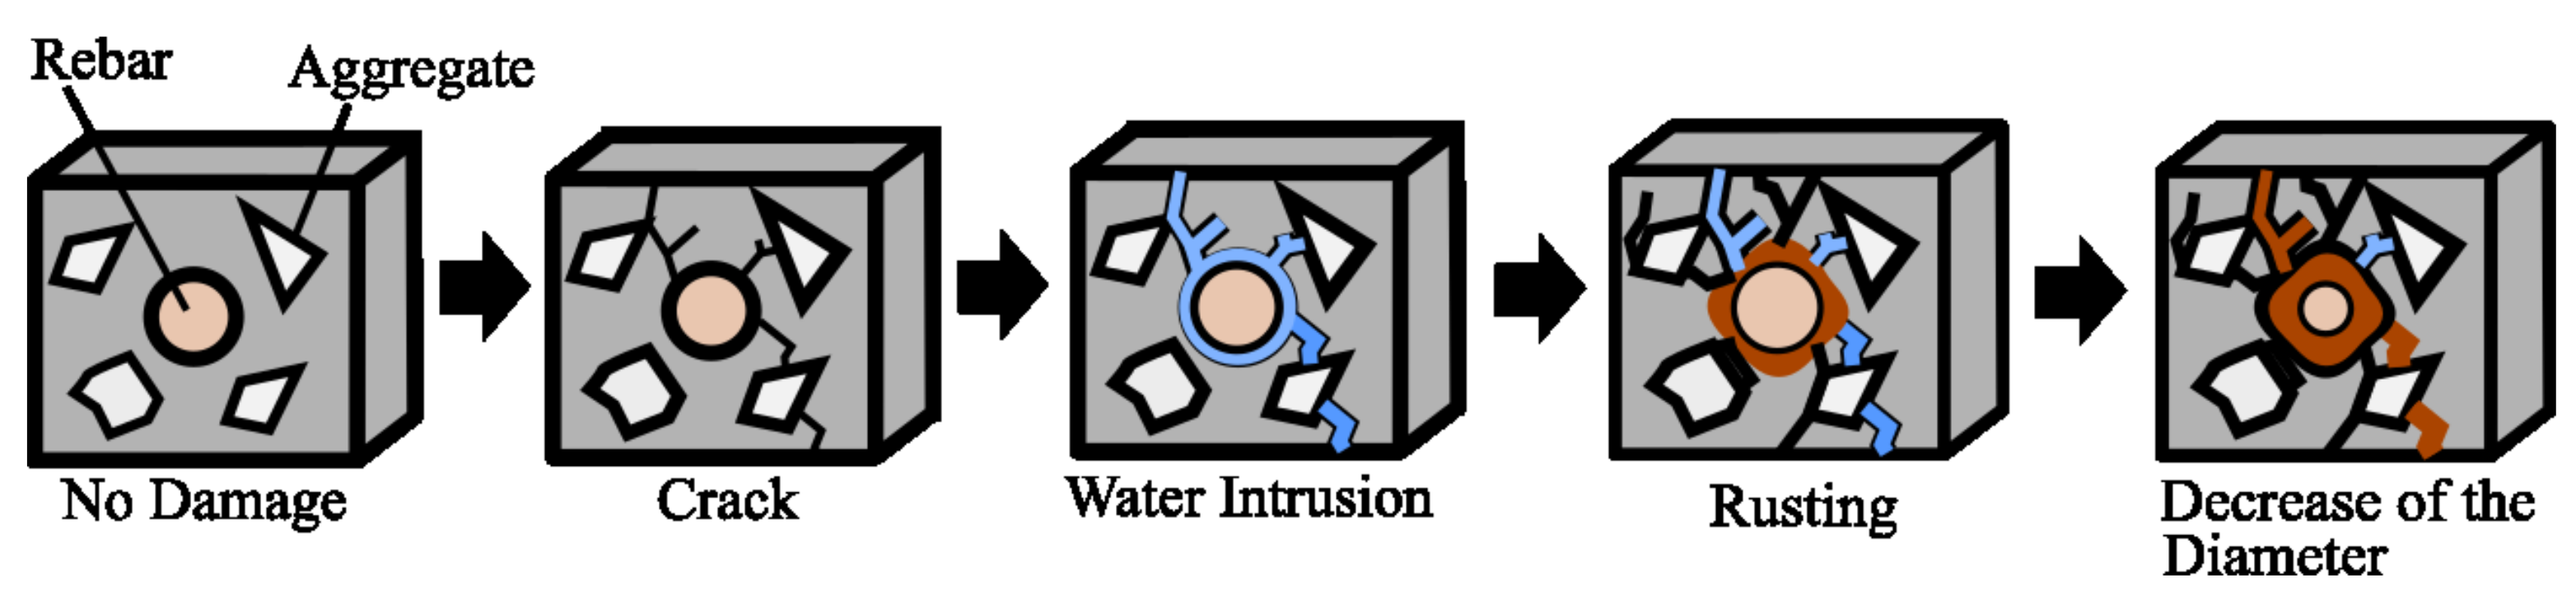
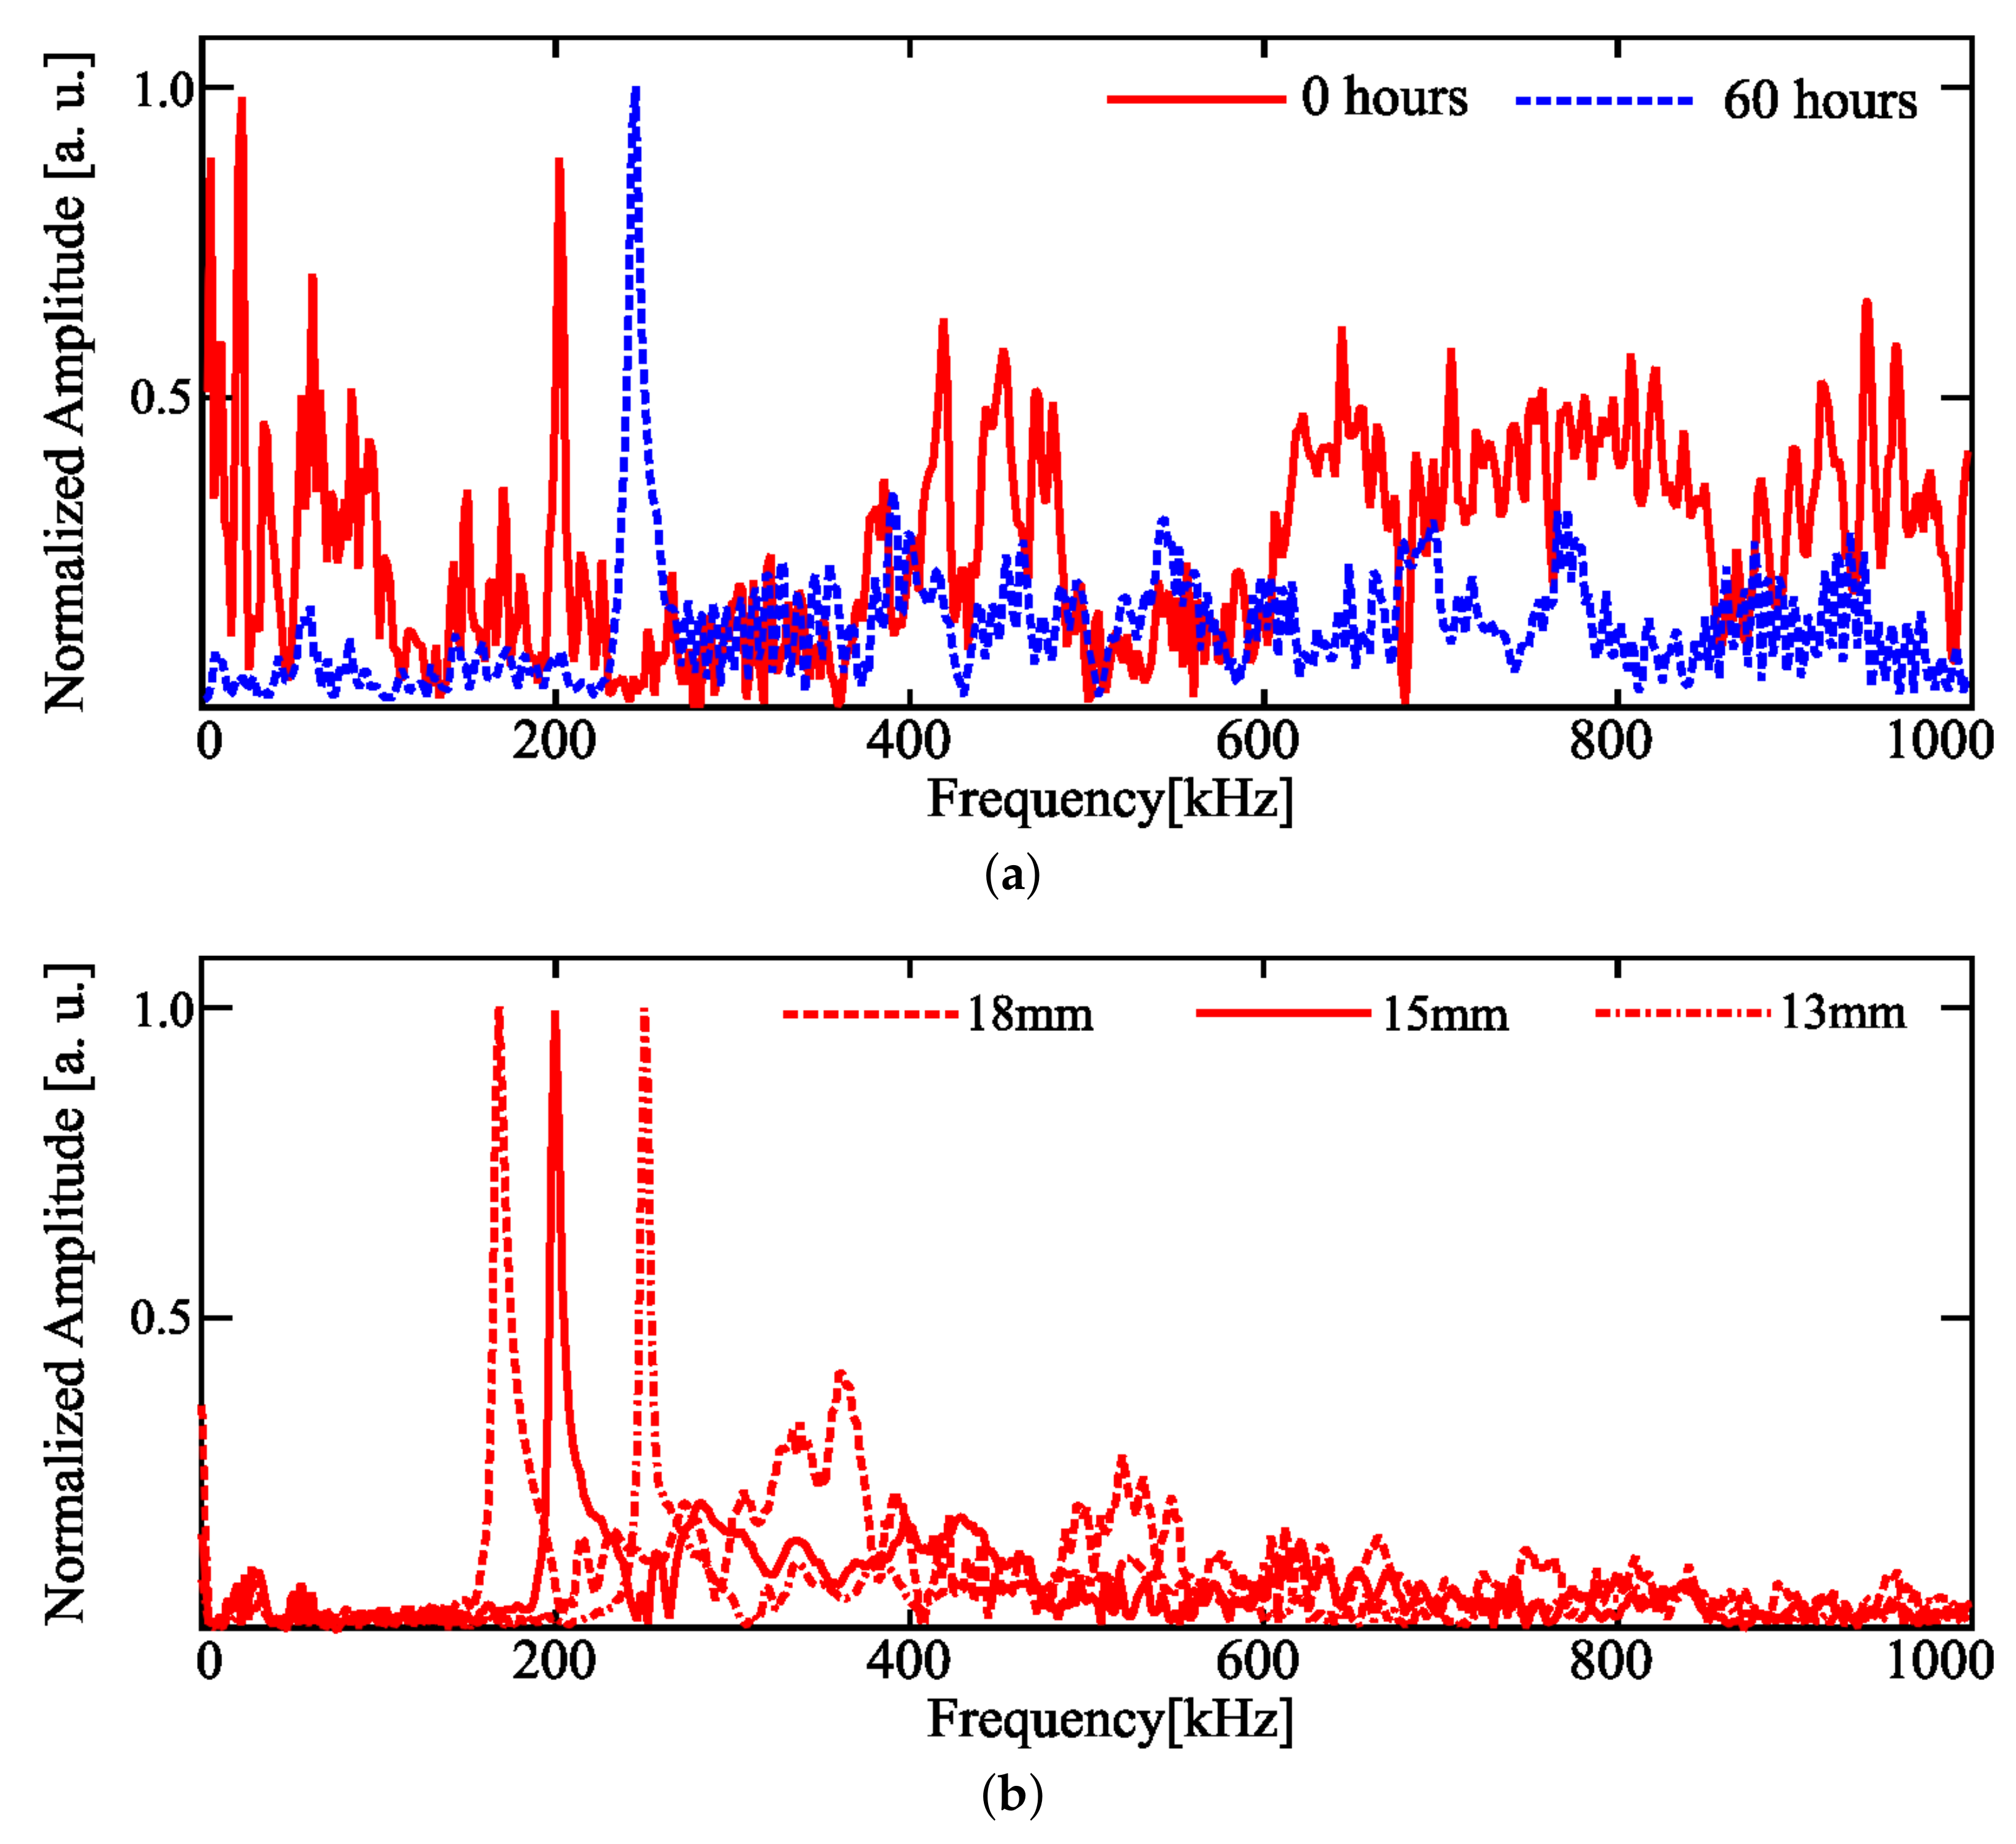
3.2. Waveform Change with Progress of the Accelerated Electrolytic Corrosion

Accelerated electrolytic corrosion was conducted on the intact specimen to investigate the correlation between the ultrasonic waveform and changing bonding strength. The current of the stabilized power supply was set to two amperes. The specimen was taken out from the water, and the ultrasonic signal was measured every 8 h. Figure 8a,b display the measured ultrasonic waveforms and their frequency spectrums, respectively. The WT and comparison to the group velocity dispersion curve are both shown in Figure 9. The rod radius, a, measured 7.5 mm for 0, 8, 16, and 24 h to calculate the group velocity dispersion curve; meanwhile, considering the effect of thinning of the rod diameter caused by the electrolytic corrosion, measured 6.0 mm for 32, 40, 48, 56, and 60 h. The bulk longitudinal wave velocity, C L , and bulk torsional wave velocity, C T , were 5889 m/s and 3148 m/s, respectively, while σ was 4.5 for the same reason as in the previous experiment. Figure 10 exhibits a cross-sectional view of the accelerated electrolytic corrosion specimen after 60 h.

4. Discussion

4.1. Changes in Waveform Due to the Presence of Bonding

Changes in the ultrasonic waveform due to the absence of bonding and its strength, regarding Figure 6, are discussed in this section. The apparent difference is that only the intact specimen had sharp peaks in the low-frequency region, while all specimens had a sharp peak around 200 kHz in common, which was especially dominant in the naked steel rod and heated specimens. The reason for such a behavior may be that the energy of the ultrasonic wave leaked into the surrounding mortar, or that mode conversion of the guided wave occurred, due to the strong bonding. The results in Figure 7 also support these explanations. While the wavelet power spectrum of the naked steel rod and heated specimen agreed well with the analytical group velocity dispersion curves, that of the intact specimen had almost no overlap with the dispersion curves. Additionally, it can be observed that the sharp peak around 200 kHz found common to all the specimens was not a symmetric longitudinal mode guided wave. The corresponding wavelet power spectrum is circled with a white dashed line in Figure 7. The sharp peaks around 200 kHz correspond to a tail-like wavepacket, indicated with black arrows in Figure 6a. The waveforms of the naked steel rod and heated specimen match well, as the thermal expansion and contraction of the rod weakened the bonding, and the behavior of the wave propagating in the rod was close to that in the naked steel rod.

4.2. Detectability of Corrosion in the Rebar

Based on Figure 8, the waveforms of the specimen beyond 48 h of electrolytic corrosion differed significantly from the other waveforms. In the time domain, a characteristic tail-like waveform appeared (black arrows in Figure 8a), and the sharp peak around 200 kHz was dominant in the frequency domain, as well as in the naked steel rod and the heated specimen. Concerning waveforms of the specimen with electrolytic corrosion of 40 h or less, sharp peaks were observed in the low-frequency region, the same as in the intact specimen of the previous experiment. The change in the ultrasonic waveforms can be attributed to the point at which the bonding was destroyed by electrolytic corrosion, which indicates that enough reinforced concrete had deteriorated for the dissolving rebar to be detected from the ultrasonic wave propagated on the rebar. The mode transition also changed with the progress of the corrosion. From the early stages of electrolytic corrosion ((b) in Figure 9), the L(0,2) mode appeared in the higher-frequency region. In the middle stage ((d) and after in Figure 9), 400 kHz and 700 kHz of the L(0, 3) mode appeared. The wavelet power spectrum corresponding to the tail-like wavepacket can be seen clearly in the late stage ((g) and after in Figure 9). The L(0,3) mode of 700 kHz shifted toward the lower-frequency region, in response to the time, after (d) in Figure 9. The consistency between the dispersion curves and WT of the signals was not adequate, compared to Figure 7, as the rod became uneven in shape due to the electrolytic corrosion.
Only the frequency spectrum curve of the electrolytic corrosion at 8 h was missing the sharp peak at around 200 kHz. We believe this phenomenon may be explained by temporary bonding strengthening, which is caused by the volume expansion due to the rust on the rod in the early stages of corrosion. Together with the mode transition seen in Figure 9, this missing peak suggests that our method can be applied to evaluate the degree of the corrosion, which needs further investigation.

4.3. Peak Shift with Corrosion Progress

Focusing on the sharp peak around 200 kHz over 48 h in Figure 8b, the peak position shifted to the higher-frequency region, compared to the sharp peak of the intact specimen. This result can be explained by assuming that the sharp peak around 200 kHz—in other words, the characteristic tail-like wavepacket in the time domain—depends on the diameter of the rod. Figure 11 is a comparison of the location of the sharp peak in the frequency domain. In Figure 11a, the enlarged frequency spectrum curves at 0 h and 60 h in Figure 8 can be observed, and Figure 11b displays the frequency spectrum curves of three naked steel rods with varying diameters. When the rod diameter decreased, from 15 mm to 13 mm, the peak shifted to a higher-frequency region, and when it increased from 15 mm to 18 mm, the peak shifts to the lower-frequency region. These findings suggest it is possible to evaluate the degree of corrosion by ultrasonic waves propagating on the rebar.

4.4. Summary of the Discussion and Future Works

Through the discussion of the experimental results, we can draw the following conclusions: First, the behavior of the ultrasonic wave propagating on the rod is influenced by the bonding strength. The sharp peak appears around 200 kHz, regardless of the bonding strength, and peaks in the lower-frequency region only appear when the bonding is strong, which can be used to detect decreases in bonding. Second, changes in the ultrasonic waveform accompanying the time of the electrolytic corrosion can be used to detect the degree of corrosion of the rebar. Third, the position of the sharp peak around 200 kHz depends on the rod diameter. The peak shift due to the change in the rod diameter can be used to evaluate the degree of deterioration.
Future work will include an investigation of the relationship between the bonding strength and flexural mode of the ultrasonic guided waves. We also aim to develop countermeasures against radioactive rays, which can disturb the ultrasonic signals. The authors hope that this work will contribute to the field of structural health monitoring technology for aging reinforced concrete structures in locations where access is difficult.

Author Contributions

Conceptualization, A.F. and A.N.; data curation, A.F., A.N., and Y.T.; methodology, A.F.; software, A.F.; formal analysis, A.F.; investigation, A.F., A.N., and Y.T.; writing–original draft preparation, A.F.; writing–review and editing, A.F. and A.N.; supervision, A.N.

Acknowledgments

We would like to express the most profound appreciation to Dr. Yoshinari Anoda, who is the director of the Tsuruga Comprehensive Research and Developing Center, for his constructive comments and warm encouragement, and we would like to appreciate colleagues of the Innovative technology developing group.

Conflicts of Interest

The authors declare no conflict of interest.

References

  1. Tokyo Electric Power Company. INSIDE Fukushima Daiichi. Available online: http://www.tepco.co.jp/insidefukushimadaiichi/ (accessed on 1 June 2019).
  2. Tokyo Electric Power Company. Photo Collection January 2018. Available online: https://photo.tepco.co.jp/en/date/2018-e/201801-e.html/ (accessed on 1 June 2019).
  3. Furusawa, A.; Nishimura, A.; Takenaka, Y.; Nakamura, K. An Approach for Remote Non-destructive Testing Method for Concrete Structure using Laser Generated Ultrasonic. In Proceedings of the 54th Annual meeting on Hot Laboratories and Remote Handling (HOTLAB 2017), Mito, Japan, 17–22 September 2017. [Google Scholar]
  4. Furusawa, A.; Nishimura, A.; Takenaka, Y.; Muramatsu, T. Potential for Remote Controllable Systematization of the Method of Testing Reinforced Concrete using Guided-wave on Rebar. In Proceedings of the International Topical Workshop on Fukushima Decommissioning Research (FDR2019), Fukushima, Japan, 24–26 May 2019. [Google Scholar]
  5. Na, W.B.; Kundu, T.; Ehsani, M. Ultrasonic Guided Waves for Steel Bar-Concrete Interface Testing. Mater. Eval. 2002, 60, 437–444. [Google Scholar]
  6. Na, W.B.; Kundu, T. A Combination of PZT and EMAT Transducers for Interface Inspection. J. Acoust. Soc. Am. 2002, 111, 2128–2139. [Google Scholar] [CrossRef] [PubMed]
  7. Na, W.B.; Kundu, T.; Ehsani, M. A Comparison of Steel/Concrete and Glass Fiber Reinforced Polymers/Concrete Interface Testing by Guided Waves. Mater. Eval. 2003, 61, 155–161. [Google Scholar]
  8. Na, W.B.; Kundu, T.; Ehsani, M. Lamb Waves for Detecting Delamination between Steel Bars and Concrete. Comput.-Aided Civ. Infrastruct. Eng. 2003, 18, 58–63. [Google Scholar] [CrossRef]
  9. Miller, T.H.; Kundu, T.; Huang, J.; Grill, J.Y. A new guided wave-based technique for corrosion monitoring in reinforced concrete. Struct. Health Monit. 2013, 12, 35–47. [Google Scholar] [CrossRef]
  10. Zima, B. Guided Wave Propagation in Detection of Partial Circumferential Debonding in Concrete Structures. Sensors 2019, 19, 2199. [Google Scholar] [CrossRef] [PubMed]
  11. Kurahashi, S.; Mikami, K.; Kitamura, T.; Hasegawa, N.; Okada, H.; Kondo, S.; Nishikino, M.; Kawauchi, T.; Shimada, Y. Demonstration of 25-Hz-inspection speed laser remote sensing for internal concrete defects. J. Appl. Remote Sens. 2018, 12, 015009. [Google Scholar] [CrossRef]
  12. Akamatsu, R.; Sugimoto, T.; Utagawa, N.; Katakura, K. Proposal of Non Contact Inspection Method for Concrete Structures Using High-Power Directional Sound Source and Scanning Laser Doppler Vibrometer. Jpn. J. Appl. Phys. 2013, 52, 07HC12. [Google Scholar] [CrossRef]
  13. Scruby, C.B.; Drain, L.E. Laser Ultrasonics Techniques and Applications; Taylor & Francis: New York, NY, USA, 1990; ISBN 978-18-4569-735-8. [Google Scholar]
  14. Ngugen, P.L.; Daido, H.; Yamada, T.; Nishimura, A.; Hasegawa, N.; Kawachi, T. Experimental characterization of concrete removal by high-power quasicontinuous wave fiber laser irradiation. J. Laser Appl. 2017, 29, 041501. [Google Scholar]
  15. Rose, J.L. Ultrasonic Waves in Solid Media; Cambridge University Press: Cambridge, UK, 1999; ISBN 978-05-2154-889-2. [Google Scholar]
  16. Rose, J.L. Ultrasonic Guided Waves in Solid Media; Cambridge University Press: Cambridge, UK, 2014; ISBN 978-11-0704-895-9. [Google Scholar]
  17. Rose, J.L. A baseline and vision of ultrasonic guided wave inspection potential. J. Press. Vessel Technol. 2002, 124, 273–282. [Google Scholar] [CrossRef]
  18. Mallat, S. A Wavelet Tour of Signal Processing, Third Edition: The Sparse Way; Academic Press: Orlando, FL, USA, 2008; ISBN 978-012-3743-70-1. [Google Scholar]
  19. Francesco, L.S.; McNamara, J. Wavelet Transform for Characterizing Longitudinal and Lateral Transient Vibrations of Railroad Tracks. Res. Nondestruct. Eval. 2004, 15, 87–98. [Google Scholar]
  20. Kishimoto, K.; Inoue, M.; Shibuya, T. Time Frequency Analysis of Dispersive Waves by Means of Wavelet Transform. J. Appl. Mech. 1995, 62, 841–846. [Google Scholar] [CrossRef]
  21. Waltisberg, D.; Raišutis, R. Group velocity estimation of Lamb waves based on the wavelet transform. Ultragarsas 2008, 63, 35–40. [Google Scholar]
Figure 1. Typical corrosion process of reinforced concrete.
Applsci 09 03544 g001
Figure 2. Concept of the corrosion detection method for the reinforced concrete structures at the Fukushima Daiichi Nuclear Power Plant (NPP) de-commissioning site.
Applsci 09 03544 g002
Figure 3. Schematic illustration of the experimental setup, procedure, and actual setup.
Applsci 09 03544 g003
Figure 4. Schematics and actual photos of the specimens used for the experiment.
Applsci 09 03544 g004
Figure 5. Dimensions of the specimens.
Applsci 09 03544 g005
Figure 6. Ultrasonic waveforms and frequency spectrums; (ac) represent the naked steel rod, heated specimen, and intact specimen, respectively.
Applsci 09 03544 g006
Figure 7. Comparison between wavelet transform of the ultrasonic signals and analytical group velocity dispersion curves of symmetric longitudinal mode guided wave; (ac) represent the naked steel rod, heated specimen, and intact specimen, respectively.
Applsci 09 03544 g007
Figure 8. Summary of (a) ultrasonic waveforms and (b) frequency spectrums for the accelerated electrolytic corroded specimen.
Applsci 09 03544 g008
Figure 9. Comparison between the wavelet transform of each ultrasonic signal in Figure 8a and group velocity dispersion curves; (ai) correspond to the results of 0, 8, 16, 24, 32, 40, 48, 56, and 60 h, respectively. The rod diameter a for calculating Equation 3 was 0.75 mm for (ad) and 0.60 mm for (ei).
Applsci 09 03544 g009
Figure 10. Cross-sectional view of the accelerated electrolytic corrosion specimen after 60 h.
Applsci 09 03544 g010
Figure 11. Comparison of the location of the sharp peak in the frequency domain; (a) is the enlarged frequency spectrum of 0 and 60 h from Figure 8 and (b) is the frequency spectrum of the naked steel rod with varying diameter.
Applsci 09 03544 g011
Table 1. Parameters of the pulsed-laser source.
Laser Spot DiameterPulse WidthWave LengthLaser PowerBeam Profile
5 mm10 nsec1064 nm14 mJ/pulseGaussian

