Article

Research on Performance Prediction Model of Impeller-Type Breather

College of Aerospace and Civil Engineering, Harbin Engineering University, Harbin 150001, China
*
Author to whom correspondence should be addressed.
Appl. Sci. 2019, 9(17), 3504; https://doi.org/10.3390/app9173504
Submission received: 9 July 2019 / Revised: 12 August 2019 / Accepted: 15 August 2019 / Published: 26 August 2019

Abstract

:

Featured Application

The equations established in this paper can be used to evaluate the separation and resistance performance of an impeller-type breather in an aeroengine lubrication system. The dimensional analysis method used in this paper can be extended to the performance evaluation of multi-parameter complex systems.

Abstract

To investigate the characteristics of separation and resistance of an impeller-type breather in an aeroengine lubrication system, orthogonal test design is used in calculation of the operating condition. Also, phase coupling of the RNG(Renormalization Group) k ε model and the DPM model (Discrete Phase Model) is used in calculating the selected operating condition. Through analysis of the results, combined with dimensional analysis, it shows the significance of various influencing factors and the optimal level. Based on this, a general formed dimensionless group equation is established for comprehensive separation efficiency, breather separation efficiency, and ventilation resistance. Also, through the least squares method, the performance prediction model of the breather is obtained considering five operating conditions and six structural parameters. The theoretical calculation of separation efficiency and ventilation resistance of an impeller-type breather can be performed. The results show that: the main factors affecting the separation efficiency are the rotating speed and the number of impeller blades; the main factors affecting the ventilation resistance are the ventilation rate and the diameter of the vent hole; the variation trends of the calculated values of the performance prediction model and the experimental values are consistent. The mean error of the comprehensive separation efficiency is 0.97% and the mean error of the ventilation resistance is 11.73%. The calculated values and the experimental values remain consistent, which proves that this performance prediction model can provide references to the assessment and the design of an impeller breather.

1. Introduction

When an aircraft engine lubrication system starts operating, part of the sealed air will enter the bearing chamber and mix with the lubricating oil forming an oil–gas mixture. Direct discharge of the oil–gas mixture from the bearing chamber will cause loss of lubricating oil. Since the amount of the lubricating oil is certain, the loss of the lubricating oil will affect the mechanical properties of the engine [1]. Therefore, installation of a breather in the air passage of the bearing chamber will separate the oil–gas mixture effectively.
Breathers come in various forms. Typical breathers include centrifugal breathers and impeller-type breathers; both types share the same operating principle. When the engine is operating, the oil carried by the gas enters the breather. The spinning rotors create a centrifugal force to the oil–gas mixture, thus forcing the oil droplets to the inner wall of the shell and flowing back to the transmission chamber under the dynamic pressure. The separated air is exhausted through the hole in the shaft due to the pressure difference [1]. The two-phase flow driven by the blades of the breather includes swirling and strong turbulence. The characteristics of the flow fields directly affect the performance of the breather; therefore, scholars have carried out relevant experiments and theoretical research on it.
In 2006, Zhou et al. [2] used the method of numerical simulation to study the two-phase flow field in the oil–gas separator. The trajectory of oil droplets in the turbulent flow field was simulated by the stochastic trajectory model. The results show that oil droplet impingement has a great influence on separation characteristics. In 2008, using the method of theoretical analysis, Lu [3] proposed a mathematical model for the optimal design of rotor structure parameters of a centrifugal breather, and obtained the effects of different rotor structure parameters on separation efficiency of centrifugal breathers. Also, in 2008, Willenborg et al. [4] conducted a systematic study of the performance of breathers equipped with metal foams and metal matrix and obtained the quantitative effects of the relevant parameters affecting the separation efficiency and pressure loss, such as a variation of airflow, oil flow, shaft speed, and droplet size. In 2010, Elsayed et al. [5] used a numerical simulation method to study the oil–gas two-phase flow field of a cyclone separator, obtained the distribution characteristics of vortices, velocity fields, and pressure fields in a cyclone separator, and provided reference suggestions for separator design and optimization. In 2010, Zhang et al. [6] carried out numerical research on the two-phase flow field of an impeller breather based on the Euler–Lagrange model. Disregarding the aggregation and fragmentation of oil droplets in the process of oil droplet movement, the calculated results are in good agreement with the experimental data, which shows that the Euler–Lagrange model can simulate the two-phase flow field of oil and gas in an impeller breather well. In 2011, Gruselle et al. [7] described the thickness of liquid film in the cavity of centrifugal oil/gas separation and pumping using the Bernoulli equation and the mass conservation equation. The influencing factors and variation of the gas containing rate at the oil outlet and the oil containing rate at the gas outlet were explained indirectly. The study also pointed out that the backpressure of the oil outlet and rotor speed have great influence on the oil/gas separation. In 2011, Liu et al. [8] used the method of coupling the RSM (Reynolds Stress Model) model with the DPM model to study the two-phase flow field inside the axial breather and analyzed the influence of turbulence fluctuation on the separation characteristics of each section of the axial breather. It was concluded that turbulent fluctuation can effectively improve the separation characteristics of the axial breather, and the most obvious role was in the ventilation duct. The radial turbulent intensity distribution in the ventilation duct can avoid splashes of oil droplets and greatly improve the separation efficiency. In 2012, Shi et al. [9] used the Euler–Lagrange equation to conduct numerical simulation of the flow field in the cavity of a certain type of aeroengine impeller breather, and obtained the influence of oil-gas ratio, rotational speed, and air flow on the minimum separation diameter, separation efficiency, and pressure drop. In 2013, Shao et al. [10] used the RSM model and the DPM model to simulate the two-phase flow field in a centrifugal breather. The effects of different rotational speeds and ventilation rates on oil droplet distribution and breather separation characteristics were analyzed. In 2014, Xu et al. [11] took the centrifugal breather as the research object and used numerical simulation to study the influence of the eccentric distance of the vent hole and the addendum circle radius on separation efficiency. It was concluded that the separation efficiency could be improved by increasing the addendum circle radius and the eccentric distance of the vent hole. In 2014, Ingle et al. [12] used the DPM model and the EWF (Eulerian Wall Film Model) model to predict the interaction between droplets and the wall and the atomization of liquid film. Molecular models including splash, peeling, and separation made the simulation of liquid film more accurate. The accuracy of the coupling method was verified by experiments. In 2015, Wang et al. [13] studied the influence of inlet velocity on the axial velocity, tangential velocity, pressure of the breather, and the size distribution of oil droplets at the outlet, through numerical simulation. In 2015, Juhyeong [14] and others used experimental methods to study the impact of low viscosity fluid on an aluminum surface. This low viscosity fluid is suitable for the automobile, aerospace, and other fields. An empirical model of the maximum spreading diameter of droplets was obtained. The accuracy of this model was 5%. In 2016, Han et al. [15] used the Euler–Lagrange equation to simulate the two-phase flow field of an ultra-high speed centrifugal breather. The results showed that the separation efficiency can be improved by optimizing the structure of the rotating hallow shaft at ultra-high speed. In 2016, Zhong et al. [16] used VOF (Volume of Fluid) and a liquid–solid wetting model to study the impact of droplets with different sizes on the dry wall. It was found that the properties of droplets at the micron level would have a stronger impact on the diffusion process of droplets after impact than droplets at the millimeter level, and the critical parameter of droplet splash at the micron level was K = 122. In 2017, Tianyu et al. [17] proposed a new model based on the experiment of droplet impact on the dry wall and droplet morphology dynamics. The model considered the wall conditions, summarized and analyzed various splash modes, and was verified under different conditions.
At present, the research methods of breather performance are mostly experiments and numerical simulation. Experiments are often limited by the amount of specimen processing, flow field control, and measurements. Numerical simulation is mainly to explore the influence of the working condition and main structural parameters on the performance of the breather. Many factors can affect the performance of the breather. When evaluating the significance of factors and the optimal level, a performance prediction model for a breather is established in consideration of multiple factors, which has practical significance for the engineering design and optimization of the breather. This paper verifies the accuracy of the numerical simulation method by comparison with the experimental data. The impeller breather is numerically studied by means of orthogonal experimental design. The significance and optimal level of different influencing factors are determined by range analysis. Based on the dimensional analysis, a dimensionless group equation in general form is established for comprehensive separation efficiency, breather separation efficiency, and ventilation resistance. Also, through the least squares method, the performance prediction model of the breather is obtained, which provides a reference for the design, evaluation, and optimization of the impeller breather.

2. Numerical Method

In the breather, there are strong swirling two-phase flows, in which the two phases are separated and there are physical phenomena, such as oil droplets hitting the wall surface. In this paper, the Euler–Lagrange equation was adopted to establish a two-way coupling model to show the two-phase flows. A liquid film model was used to describe oil droplet wall interaction. The splash, spreading, stick, rebound, and other phenomena of droplets were also considered.

2.1. Two-Phase Flow Calculation Method

In an aeroengine impeller-type breather, the internal flow is gas–liquid two-phase flow. The oil/gas ratio is approximately 1% [18]. The volume fraction of the oil droplets is much less than 10%, which is considered as dilute two-phase flow. Therefore, the Euler–Lagrange equation was adopted to simulate its internal flow field.

2.1.1. Governing Equations for Gas Phase

The gas phase governing equation was established based on the two-way coupling method, with consideration of the effect of droplet motion on airflow. The governing equation of gas phase per unit volume is as follows:
ρ t + · ( ρ u ) = S m ,
where ρ is the density of the gas; u is the velocity of the gas; Sm is the source term. In the oil and gas two-phase flow in the breather, the evaporation of oil droplets will cause the source term to change if operating in a high heat environment.
( ρ u ) t + · ( ρ u u ) = p + · τ + S u ,
where p is static pressure; τ is stress tensor; Su is the source term. The influence of oil droplets on airflow momentum includes the momentum carried by oil droplet evaporation and the momentum exchange caused by oil droplet movement.

2.1.2. Oil Droplet Motion Equation

The Euler–Lagrange method was used to calculate the trajectory of the oil droplets. According to Newton’s law, the motion equation is as follows:
d u p d t = F D ( u u p ) + g ( ρ p ρ ) ρ p + F a d d ,
where up is the velocity of droplets; FD is the frictional force known as Stokes’ drag; ρp is the density of the droplets; Fadd is additional force, including additional force generated by oil droplets in the rotating coordinate system, Saffman lift force, Magnus force, virtual mass force, pressure gradient force, etc.

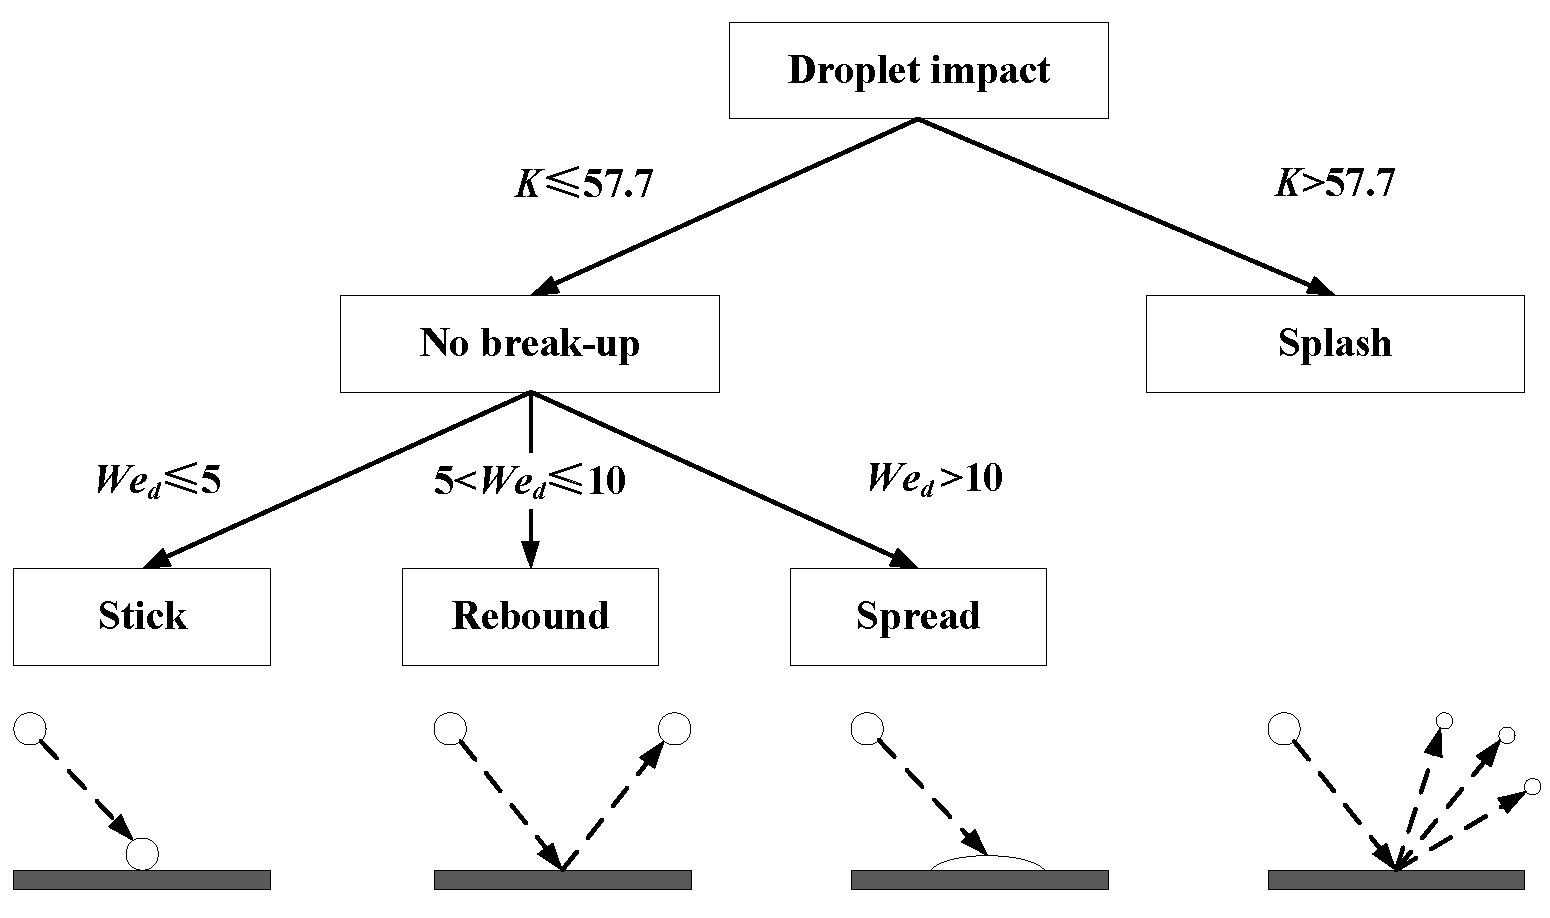
2.2. Wall Liquid Film Model

When droplets hit a solid surface, the droplets may splash, spread, stick, or rebound, depending on the impact energy and surface temperature. Scholars from all over the world have done a lot of experimental research and proposed some evaluation criterion. In this paper, the interaction model between oil droplets and the wall surface was based on the research of Farrall [18], as shown in Figure 1.
To determine the result of droplet–wall collision, splashing parameter K and the Weber number Wed have been used and the result is presented as follows:
K 2 = ρ p u r 2 d p σ p 1 min ( h 0 / d p , 1 ) + δ b l / d p ,
W e d = ρ p u p , n 2 d p σ p ,
where ur is the velocity of the oil droplets relative to the wall; dp is the diameter of the droplet; σp is the surface tension of the droplet; h0 is the initial thickness of the oil film; δbl is the thickness of the boundary layer; up,n is the normal component of the oil drop velocity.
When the splashing parameter K is greater than the critical value 57.7, the oil droplets will splash and produce new oil droplets in a smaller size. The parameters such as the diameter of the oil droplet will be determined by the cumulative probability distribution function fitted by the experiment. When the splashing parameter K is less than the critical value 57.7, oil droplets do not break and remain their original size. After collision with the wall, there are three main kinds of phenomenon, which include spread, stick, and rebound. When the Weber number is less than 5 and greater than 10, stick and spread of the oil droplets will happen, respectively. These two phenomena are considered as completely collected by the wall surface. However, when the Weber number is between 5 and 10, the oil droplets will rebound, that is, the oil droplets return to the flow inside the breather and are not collected by the wall surface.

3. Model Building and Model Validation
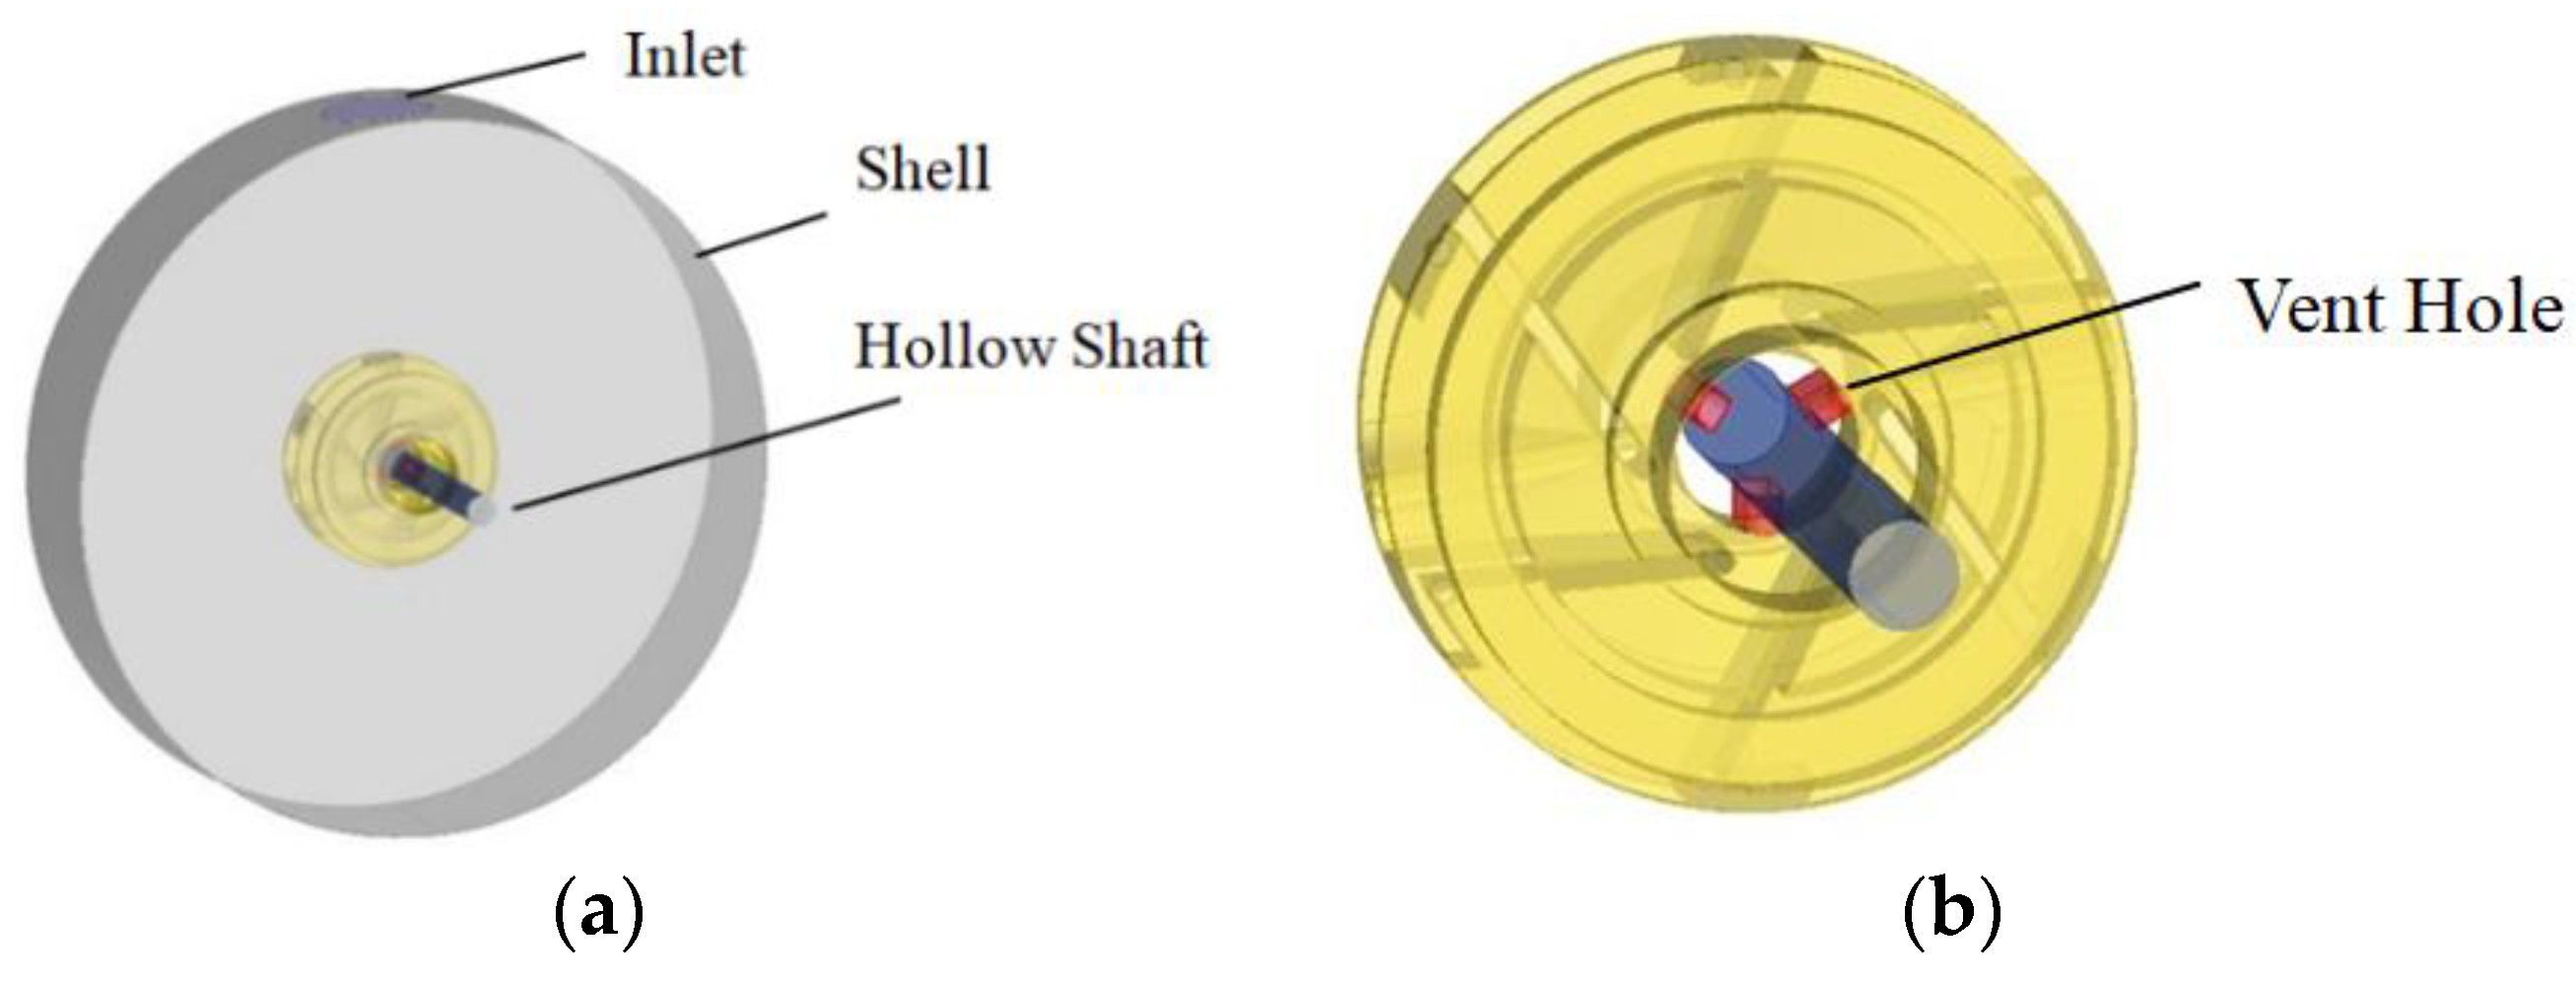
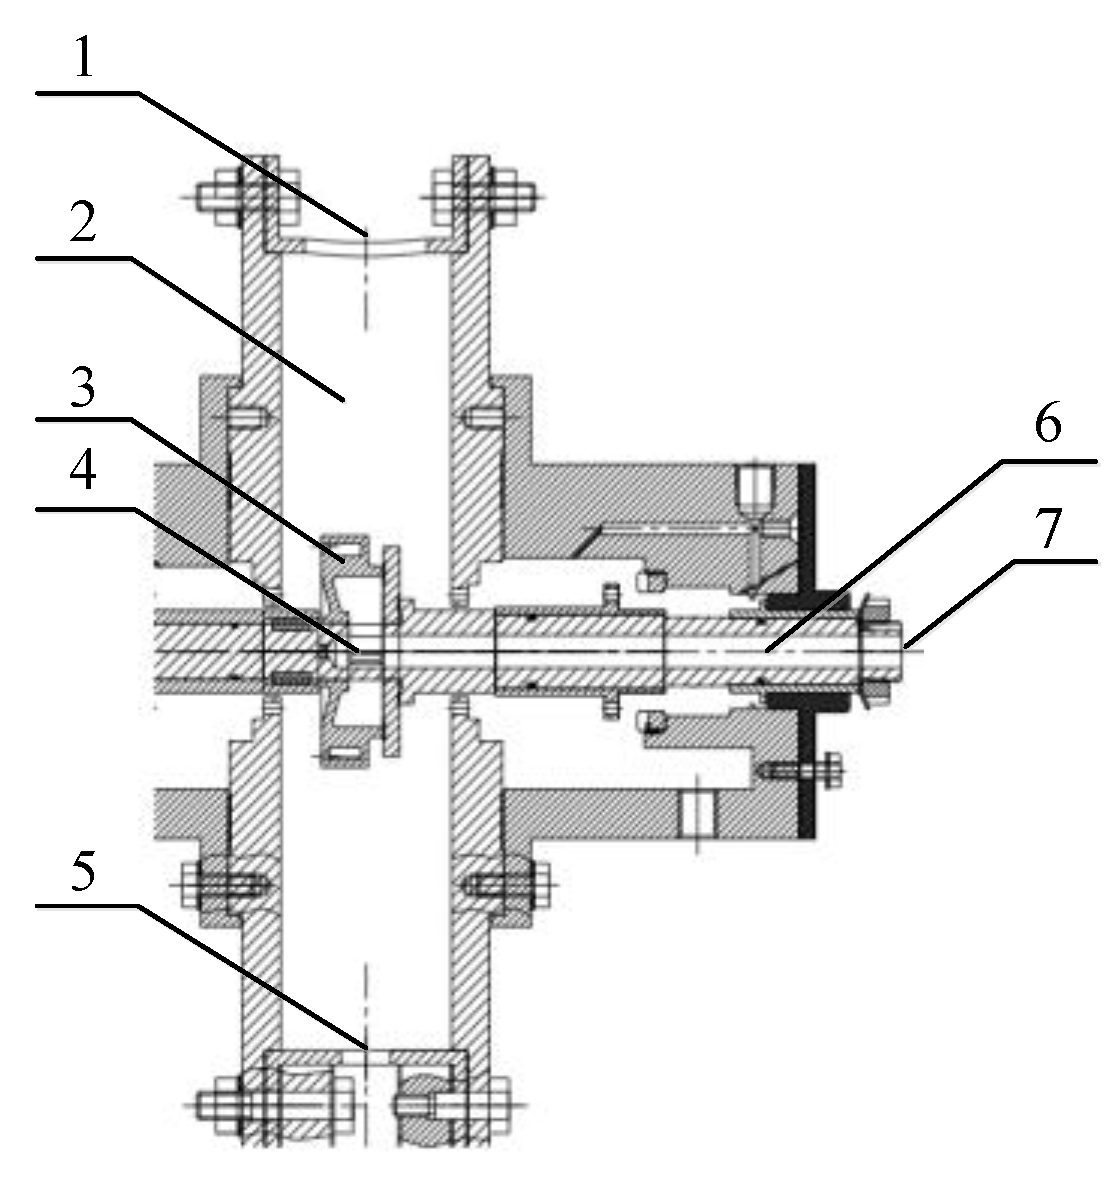
Impeller-type breathers are usually centrifugal impellers placed in an accessory casing or a bearing cavity and are usually mounted directly on a drive shaft. Compared with the centrifugal breather, it has no outer shell, so it needs to be placed in the experimental section for research. The structure of the experimental section is shown in Figure 2. The oil–gas mixture enters the inner chamber from the inlet and is separated by a rotating impeller breather. The separated lubricating oil is deposited at the bottom and collected. The separated gas is discharged from the hollow shaft.

3.1. Physical Model

In order to use the experimental results to verify the numerical simulation, the computational physical model was established on the basis of the experimental section of the impeller-type breather, as shown in Figure 2, through simplification, which is shown in Figure 3. In Figure 3, it shows the inlet, shell, impeller breather, and the hollow shaft on which three vents were distributed.

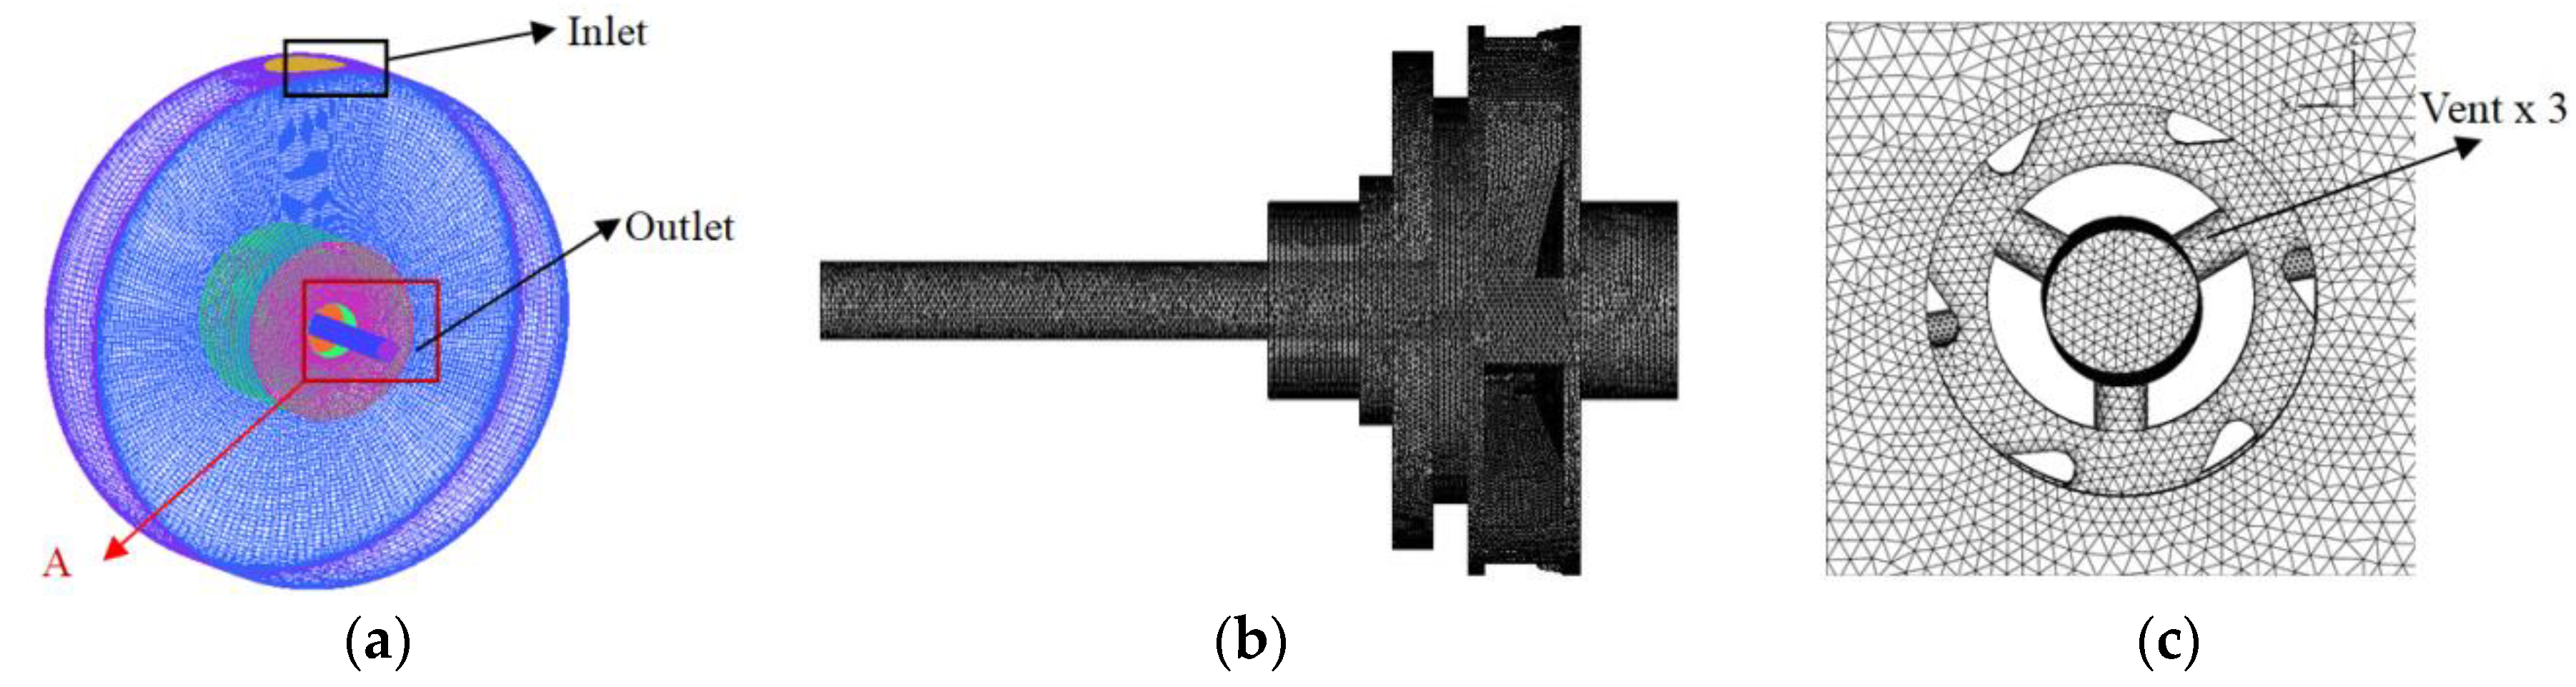
3.2. Grid Generation

Due to the large size difference of each part of the physical model, block processing of the whole computational domain was performed. A structural grid was applied to the shell and the hollow shaft. The blade passages are geometrically irregular; therefore, unstructured grids were used. Local encryption was carried out at the flow passage and vents, and the total number of grids was about 700,000. The grid generation is shown in Figure 4.

3.3. Model Validation

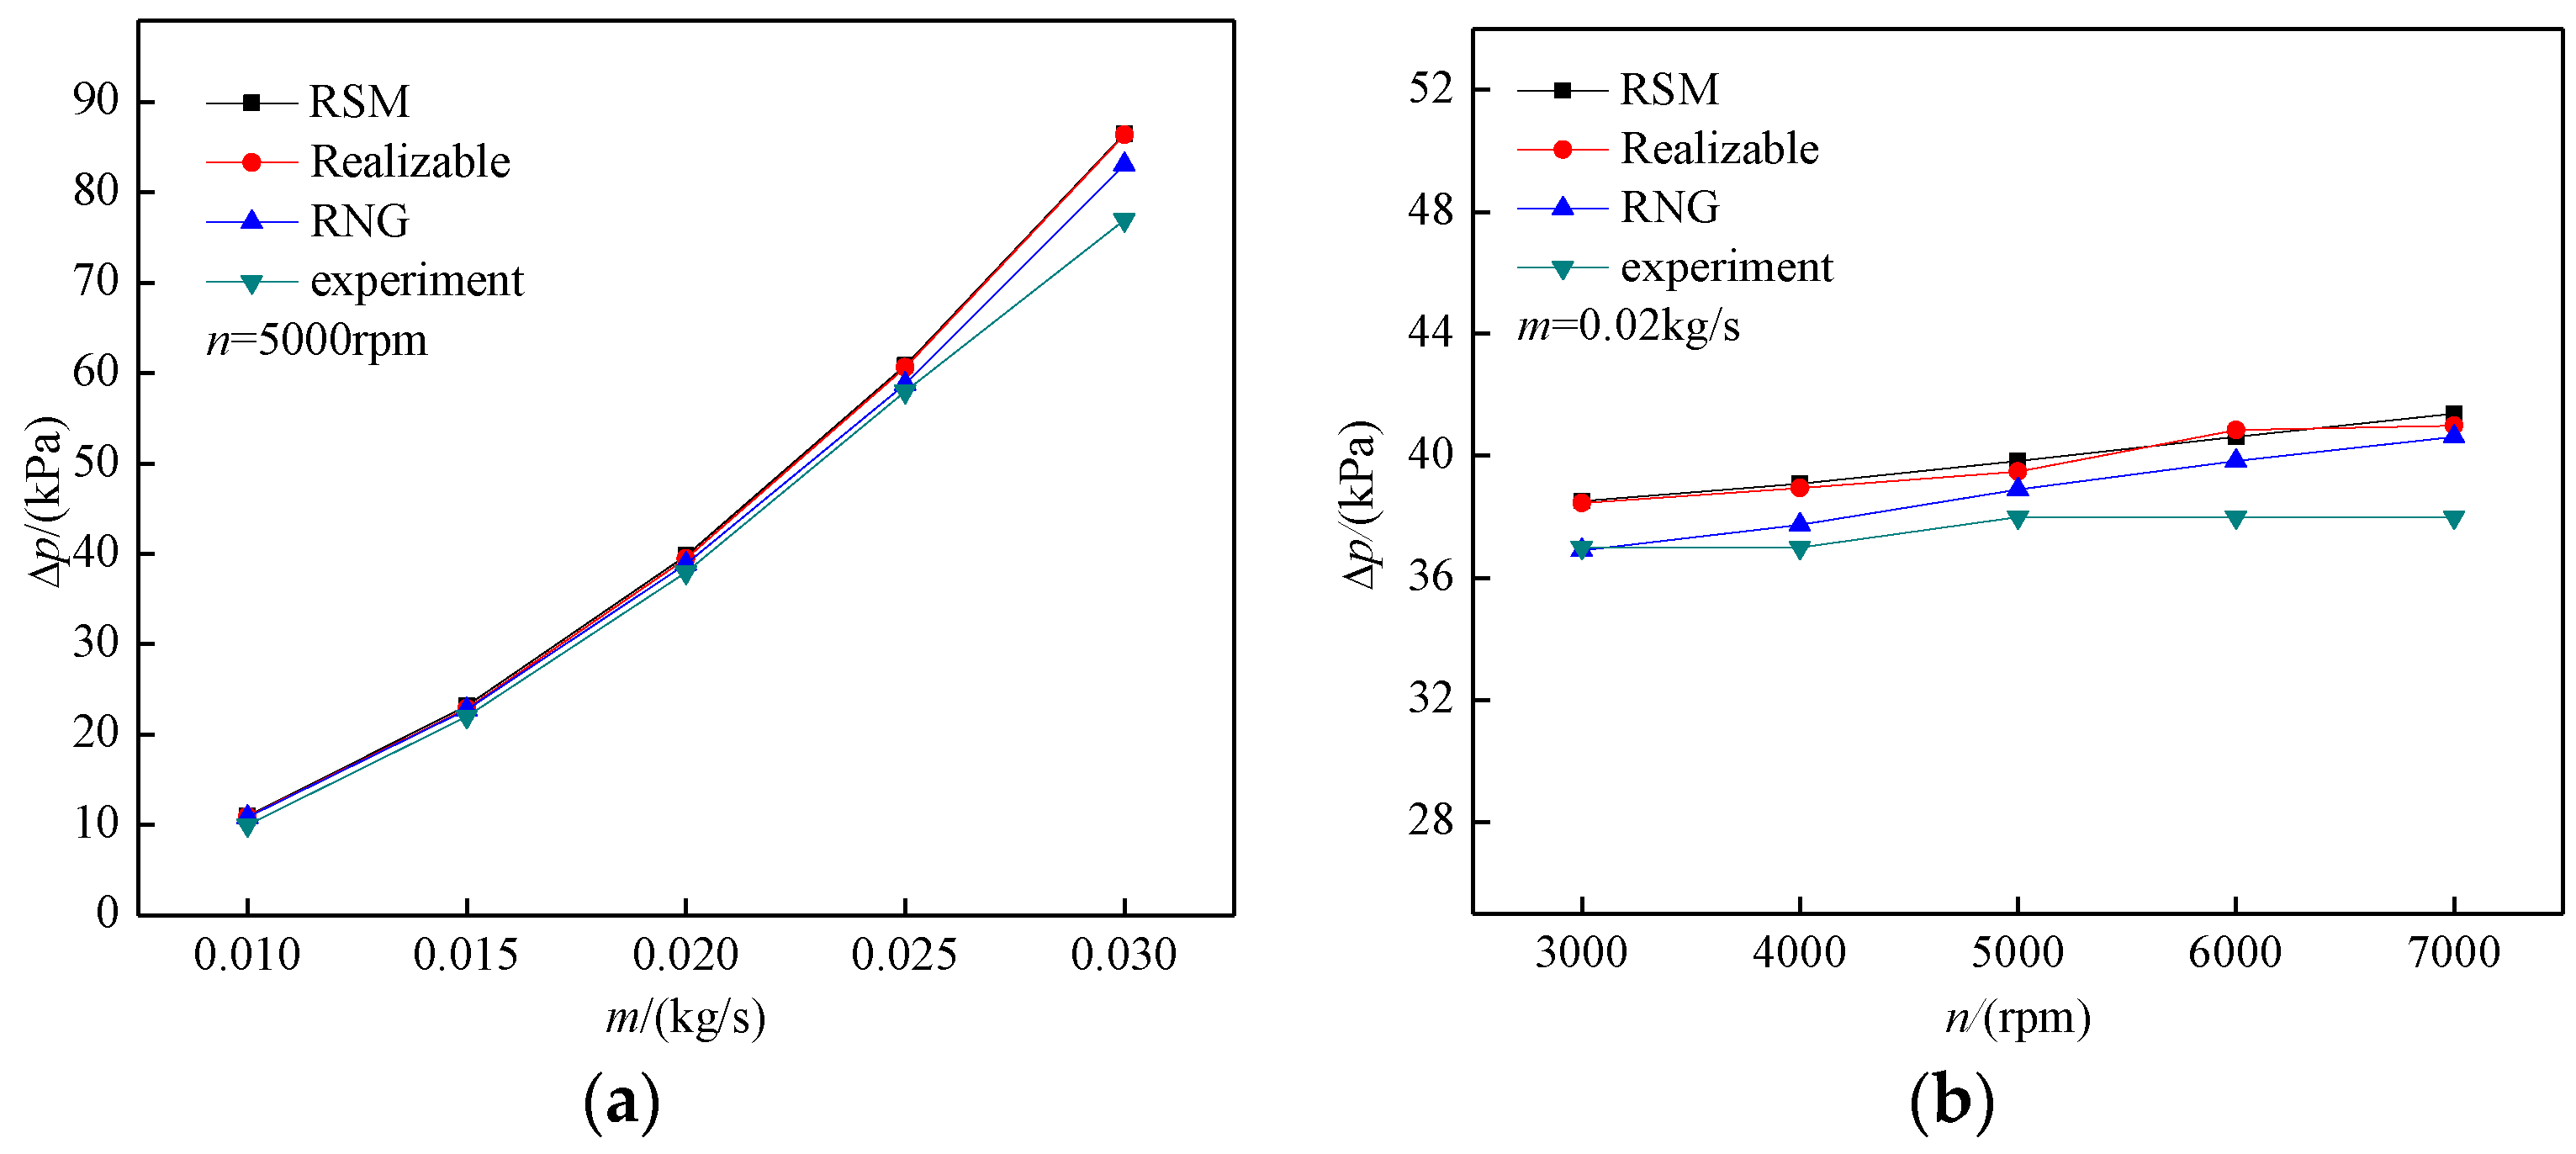
3.3.1. Single-Phase Model

The inside of the breather is a three-dimensional vortex flow with strong turbulence. The purpose of single-phase model validation is to find the most suitable turbulence model. In this paper, a single-phase numerical simulation was performed using the RSM model, the realizable k ε model, and the RNG k ε model. The turbulence model was finalized by comparing the calculated value with the experimental data.
As shown in Figure 5, the calculated values of ventilation resistance of the three turbulence models were consistent with the experimental data. The mean error of the RSM model, realizable k ε model, and RNG k ε model was 6.80%, 6.25%, and 4.01%, respectively. Since the mean error of RNG k ε model was the smallest, it will be used as the turbulence model in this paper.

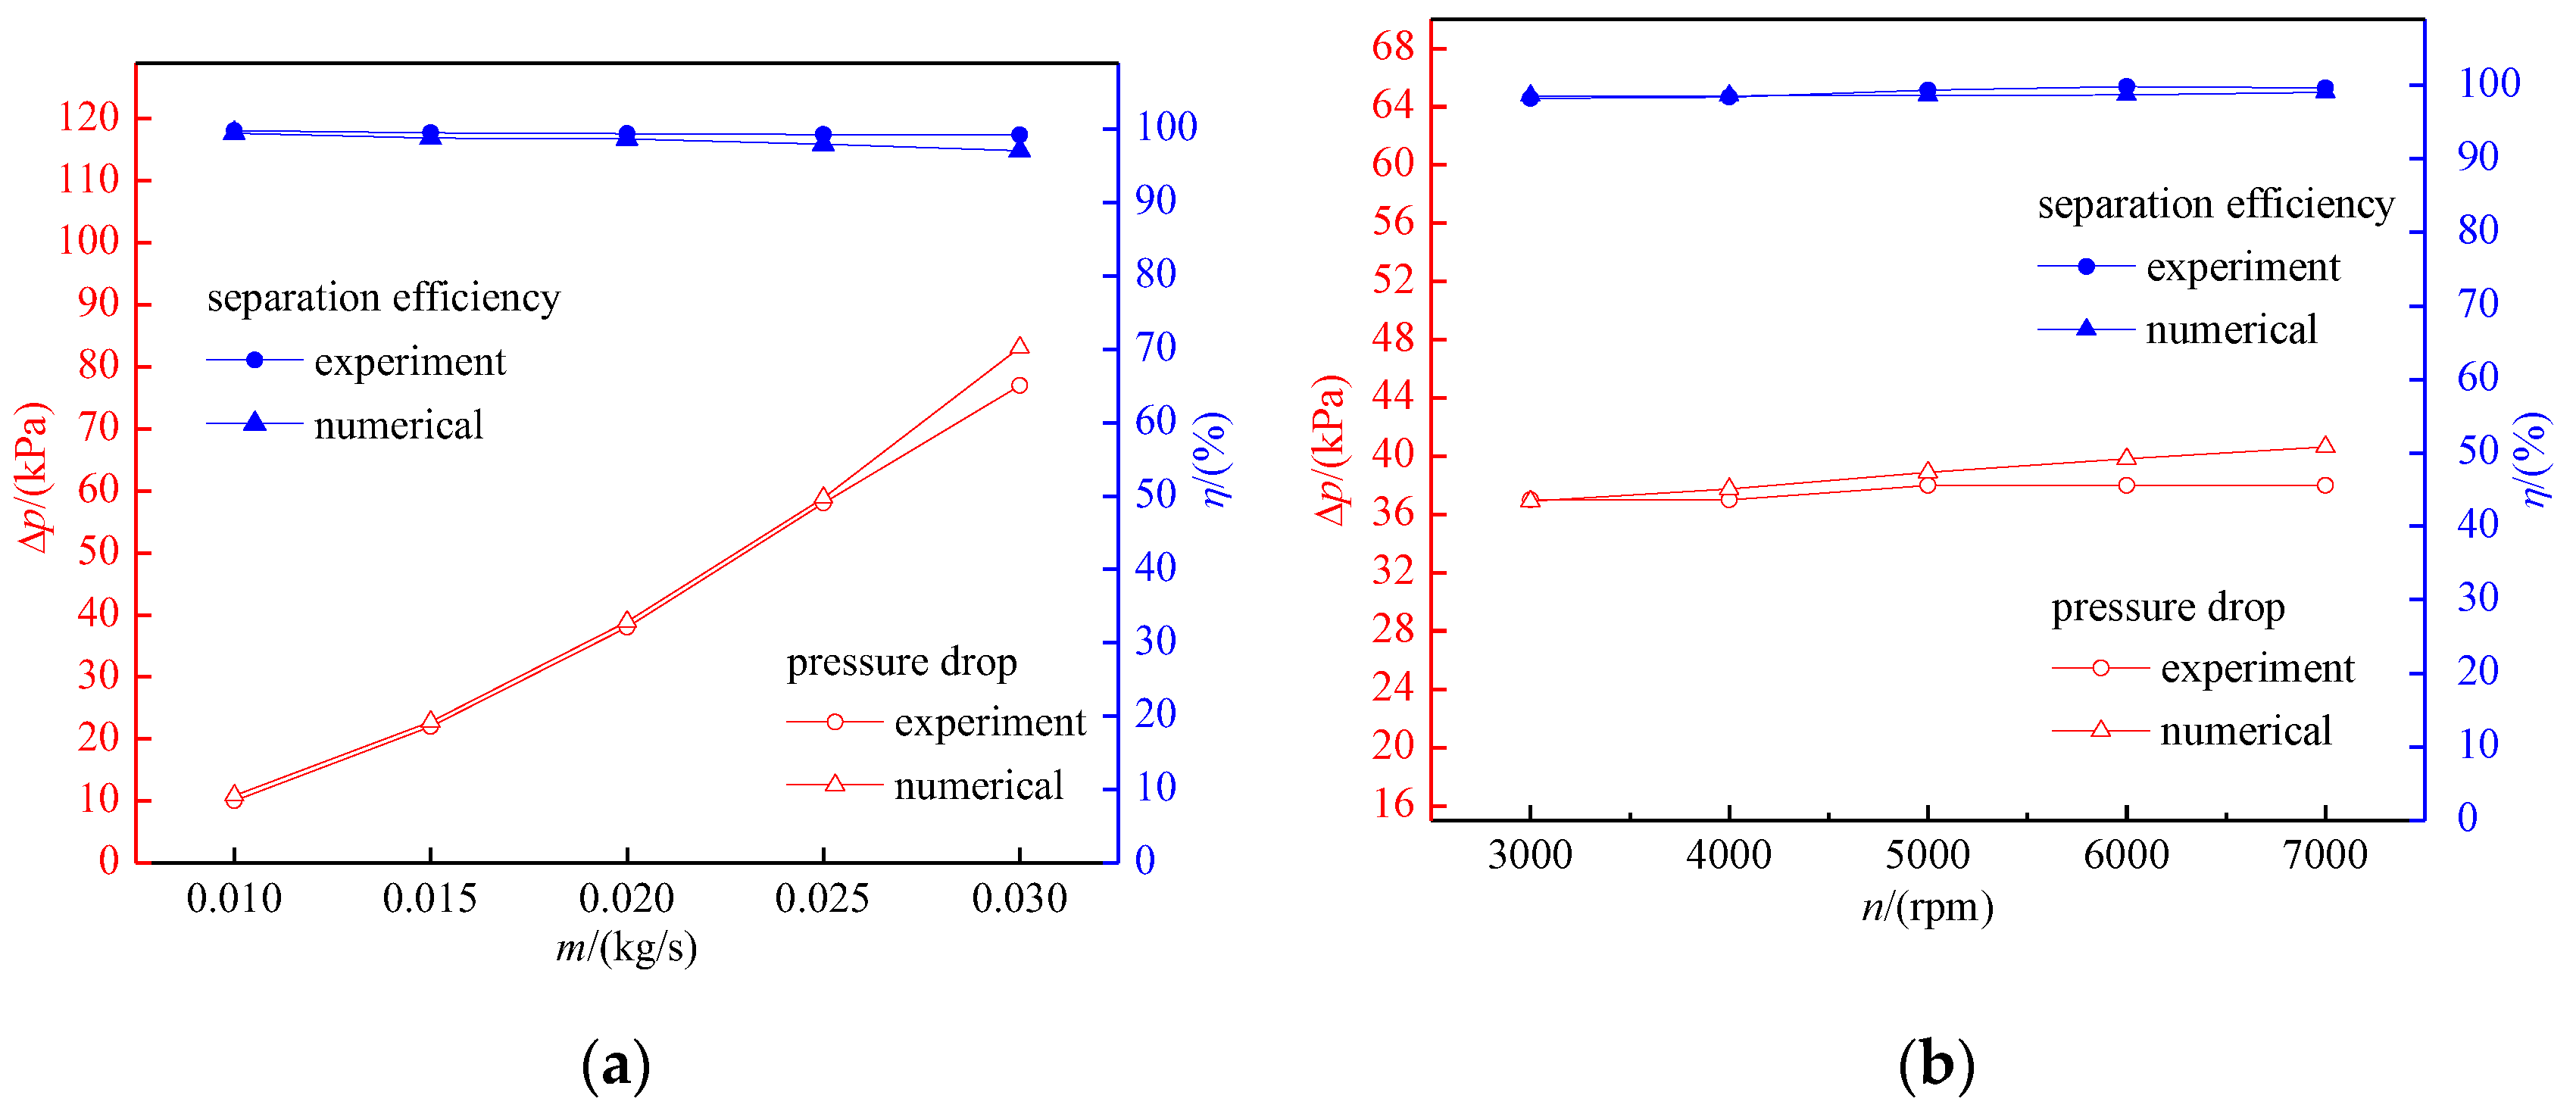
3.3.2. Two-Phase Model

In this paper, the Euler–Lagrange method was used to describe the two-phase flow, the RNG k ε model was used to solve the continuous phase, and the DPM model was used to solve the oil droplet phase. In order to verify the accuracy of the coupling calculation of the RNG k ε model and the DPM model, the calculated value was compared with the experimental value. The results are shown in Figure 6.
As it shows in Figure 6, the calculated values and the experiment values of the ventilation resistance and separation efficiency are identical. The mean error of ventilation resistance was 4.05%, and the maximum error was 8.60%. The mean error of separation efficiency was 0.82%, and the maximum error was 2.08%. The results indicate that the coupling of the RNG k ε model and the DPM model can be used for the calculation of breather performance.

4. Data Analysis

4.1. Orthogonal Calculation Method Design

In order to study the influence of operating condition and structure on the performance of the breather, five operating condition (A~E) parameters and six structural parameters (F~K) were selected for the research. For each parameter, five levels were selected, as shown in Table 1.
If the influence of all 11 parameters on the performance of the separator was studied in detail, the workload will be huge since there are 511 types of operating conditions to be considered. Therefore, with reference to the experimental design method, L50(511) orthogonal table was selected to optimize the 11 parameters on 5 levels, and 50 groups of calculation conditions were finally determined.

4.2. Significance of Factors and Optimal Method

The two-phase flow in the breather is complex and the performance can be affected by many factors. An orthogonal test can reduce the calculation workload effectively. At the same time, the significance of factors and the optimal levels can be obtained through the range analysis of the calculation results. By giving an estimation of fluctuant range and achievable index value, it provides a reference for the determination of the operating condition and structure optimization.

4.2.1. Characteristics of Separation

Separation efficiency of the breather is defined as the percentage of the mass of oil droplets separated from the breather in the mass of oil droplets entering the breather, which is an important index to evaluate the performance of the breather. Range analysis was made on the separation efficiency in the calculated results to determine the significance and optimal level of the various factors, as shown in Table 2.
As shown in Table 2, the rotating speed has the largest influence on separation efficiency among all operating conditions, followed by ventilation rate and average inlet particle size. The temperature and oil/gas ratio have little influence. Number of blades has the largest influence among all structural factors, followed by external diameter of the blades and thickness of the breather. Blade angle and diameter of vent hole have little influence.

4.2.2. Characteristics of Resistance

Ventilation resistance is defined as the pressure difference between the inlet and outlet of the breather; it indicates flow loss, which is another important index to evaluate the performance of the breather. The range analysis of the ventilation resistance in the calculation results was carried out to determine the significance and optimal level of the various influential factors. The results are shown in Table 3.
Among all operating condition factors, the ventilation rate has the largest influence on ventilation resistance, while other factors have a small influence. Among all structural factors, the diameter of the vents has the greatest influence, while the other factors have a small influence.

4.3. Performance Prediction Model

In this paper, the dimensional analysis method was used to establish the empirical formula of the ventilation performance calculation for an engineering application. The factors related to the breather performance were sorted into dimensionless numbers using the Buckingham π theorem, forming a dimensionless group equation in general form. By using the least squares method, the engineering formulas for the comprehensive separation efficiency, the ventilation efficiency, and the ventilation resistance were obtained.
As shown in Table 1, there are 11 main factors affecting the performance of the breather. Their units and dimensions are listed in Table 4. In order to show the state of the two-phase mixture, v, ρ, and μ have been added to Table 4. Considering the relationship between mixture velocity (v) and ventilation rate, v = q π ( d 1 / 2 ) 2 , where d1 is the inlet diameter, mixture velocity (v) can represent the effect of ventilation rate on the performance of breather. Mixture density (ρ) and dynamic viscosity (μ) is related to temperature, which can characterize the influence of temperature. Thus, a total of 12 influencing factors are shown in Table 4.
The comprehensive separation efficiency η, breather separation η0, and ventilation resistance Δ P are expressed in the functions of various influencing factors, as shown in Equations (6)–(8). The difference between the comprehensive separation efficiency and the breather separation efficiency are given in later section of this paper.
η = f ( d ¯ , n , ε , v , ρ , μ , α , r 1 , r 2 , β , h , d ) ,
η 0 = f ( d ¯ , n , ε , v , ρ , μ , α , r 1 , r 2 , β , h , d ) ,
Δ P = f ( d ¯ , n , ε , v , ρ , μ , α , r 1 , r 2 , β , h , d ) .
In Table 4, the 12 factors contained in Equations (6)–(8) can be expressed by 3 individual physical dimensions, such as M (mass), L (length), and T (time). ρ, v, and r1 are representing the basic dimensions. Dimensionless transformation is carried out using Buckingham’s π theorem. Dimensionless Equations (9)–(11) can be obtained.
η = f ( d ¯ r 1 , n v r 1 1 , ε , μ ρ v r 1 , α , r 2 r 1 , β , h r 1 , d r 1 ) ,
η 0 = f ( d ¯ r 1 , n v r 1 1 , ε , μ ρ v r 1 , α , r 2 r 1 , β , h r 1 , d r 1 ) ,
Δ P ρ v 2 = f ( d ¯ r 1 , n v r 1 1 , ε , μ ρ v r 1 , α , r 2 r 1 , β , h r 1 , d r 1 ) .
Equations (9)–(11) can be rewritten into general form of dimensionless group equation as follows:
η = a 0 ( d ¯ r 1 ) a 1 ( n v r 1 1 ) a 2 ε a 3 ( μ ρ v r 1 ) a 4 α a 5 ( r 2 r 1 ) a 6 β a 7 ( h r 1 ) a 8 ( d r 1 ) a 9 ,
η 0 = b 0 ( d ¯ r 1 ) b 1 ( n v r 1 1 ) b 2 ε b 3 ( μ ρ v r 1 ) b 4 α b 5 ( r 2 r 1 ) b 6 β b 7 ( h r 1 ) b 8 ( d r 1 ) b 9 ,
Δ P ρ v 2 = c 0 ( d ¯ r 1 ) c 1 ( n v r 1 1 ) c 2 ε c 3 ( μ ρ v r 1 ) c 4 α c 5 ( r 2 r 1 ) c 6 β c 7 ( h r 1 ) c 8 ( d r 1 ) c 9 .

4.4. Goodness of Fit Test

According to the 50 groups of calculation conditions determined by the orthogonal experiment design, the corresponding numerical calculation was completed. The calculation process was simplified, and the least squares method was used for fitting. Finally, each index in the dimensionless group equation was determined, and each prediction model is shown in Equations (15)–(17).
Comprehensive separation efficiency prediction model:
η = e 4.4221 ( d ¯ r 1 ) 0.0092 ( n v r 1 1 ) 0.0458 ε 0.0089 ( μ ρ v r 1 ) 0.0260 α 0.0252 ( r 2 r 1 ) 0.0267 β 0.0059   ( h r 1 ) 0.0582 ( d r 1 ) 0.0036 .
Breather separation efficiency prediction model:
η 0 = e 4.4338 ( d ¯ r 1 ) 0.0577 ( n v r 1 1 ) 0.1562 ε 0.0079 ( μ ρ v r 1 ) 0.0405 α 0.1604 ( r 2 r 1 ) 0.0505 β 0.0132 ( h r 1 ) 0.2209 ( d r 1 ) 0.2869 .
Ventilation resistance prediction model:
Δ P ρ v 2 = e 2.2685 ( d ¯ r 1 ) 0.0228 ( n v r 1 1 ) 0.0871 ε 0.0169 ( μ ρ v r 1 ) 0.0524 α 0.0257 ( r 2 r 1 ) 0.4739 β 0.0124 ( h r 1 ) 0.8326 ( d r 1 ) 2.1699 .
The prediction model validation mainly includes two aspects—one is to analyze the errors in the process of prediction model fitting, and secondly, the reliability of the equation and model parameter estimation is tested by mathematical statistics, including goodness of fit test, significance test of equation, etc. The mean absolute percentage error (MAPS) of the prediction model fitting for the comprehensive separation efficiency, breather separation efficiency, and ventilation resistance were 3.46%, 5.49%, and 9.99%, which indicate that the accuracy of the model was relatively high. The F values of the models were 149.83, 141.43, and 1566.96, which were larger than the corresponding value of F0.001 (9, 40), 4.02. The coefficients of determination (R2) were 0.6196, 0.6059, and 0.9445, indicating that the equation has a high significance and a good fitting degree.

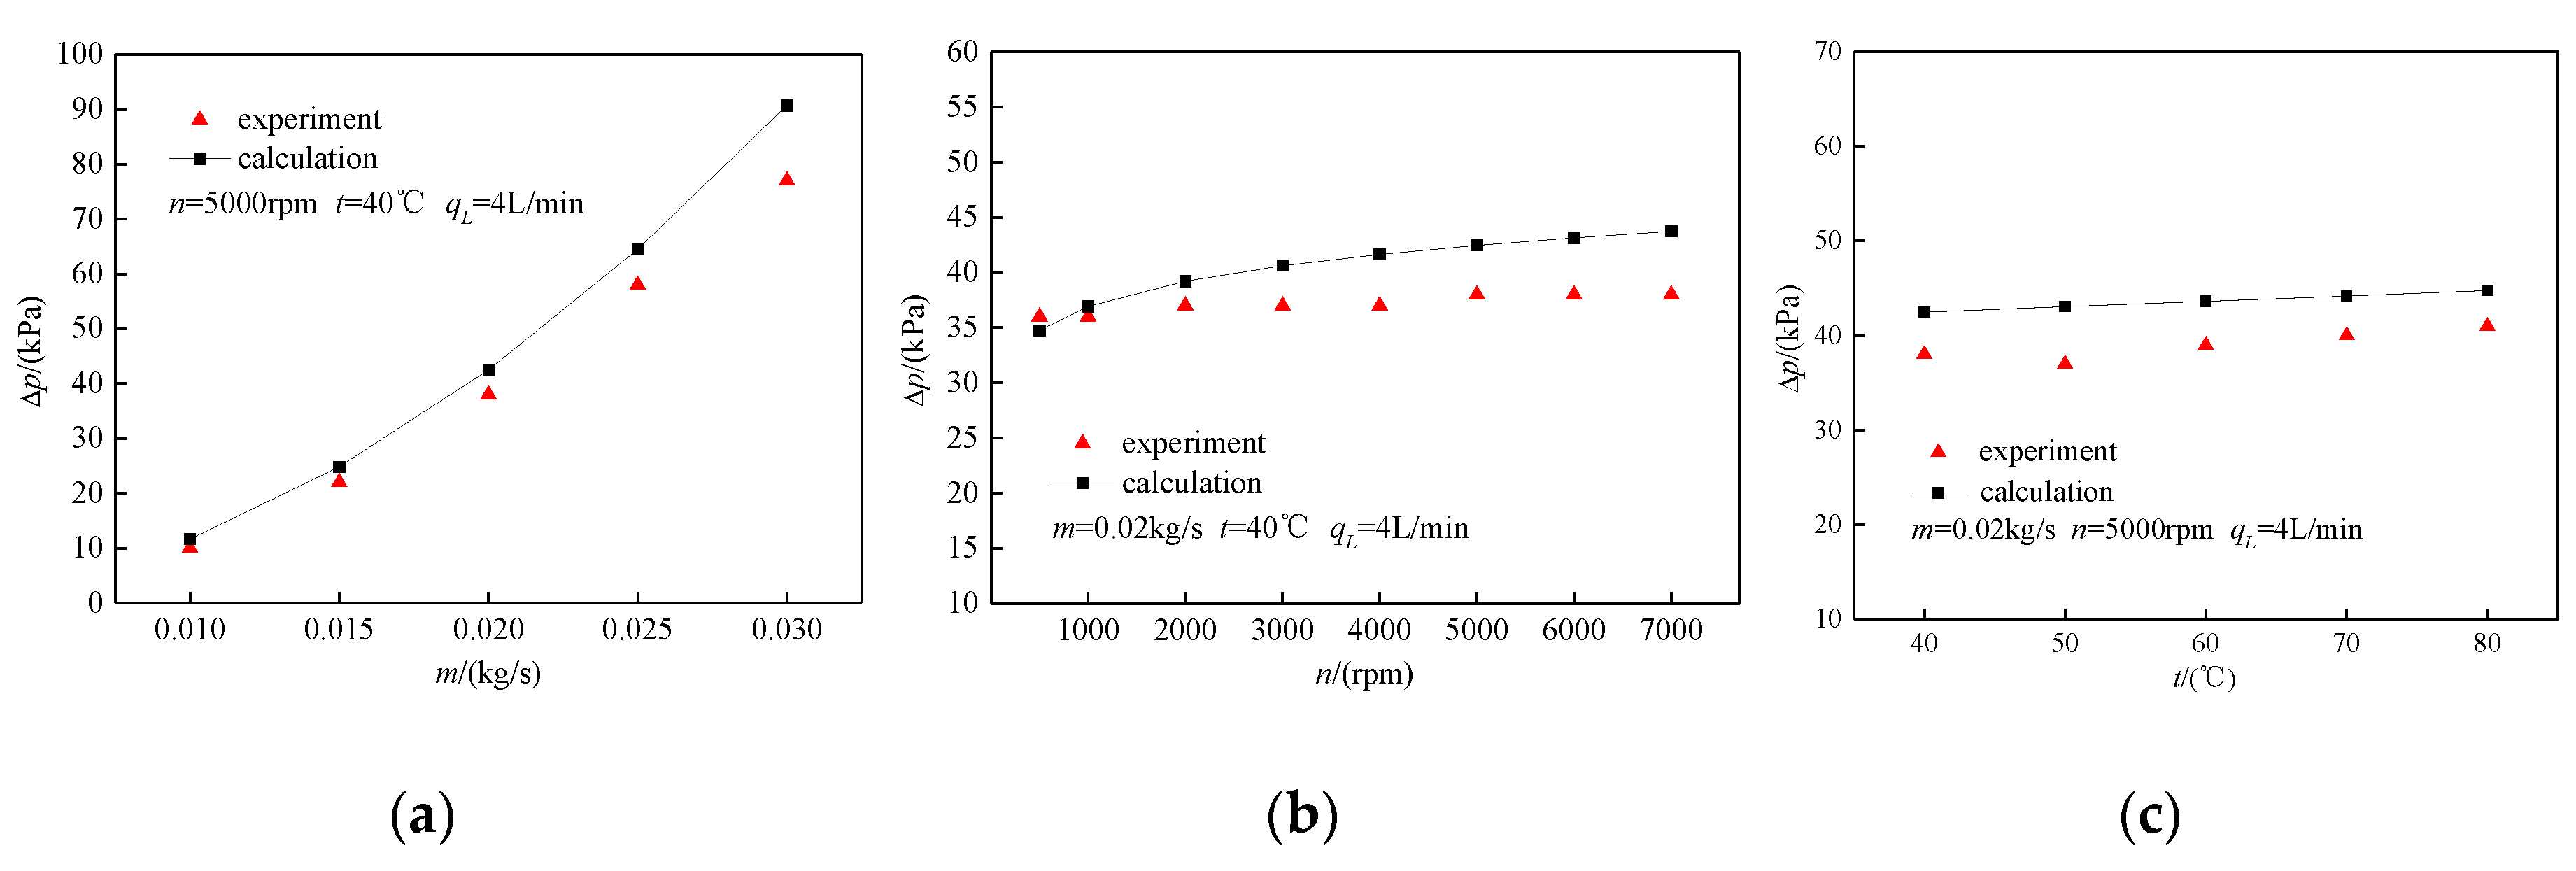
4.5. Prediction Model Verification

The research purpose of this paper was to offer a simple calculation model for engineering applications. The applicability of the model is subject to verification through experiment. In the experiment, the separator was placed in a shell, as shown in Figure 2. Therefore, the gas–liquid separation should be the joint action of the shell and the separator, and neither experimental nor engineering applications can separate the two. The comprehensive separation efficiency η reflects this function, so it is reasonable to evaluate the efficiency in engineering applications. Of course, the cavity where the breather is located in the engine must be different from the experimental cavity, which will cause errors. The numerical calculation can be carried out by extracting the breather separately. The design is more concerned about the influence of the breather’s structure on separation. Thus, the separation efficiency of the breather (η0) is given solely.
Equations (15) and (16) were used to calculate the separation efficiency under various operating conditions, and the results were compared with the experimental data, as shown in Figure 7. According to Figure 7, the calculated values and the experimental values of the comprehensive separation efficiency show a same variation trend. As the ventilation rate, rotating speed, and temperature changed, the mean error of the calculation was 0.48%, 1.72%, and 0.70%, respectively. Thus, the prediction model of comprehensive separation efficiency has a high accuracy. The separation efficiency η0 is obviously lower than the experimental value, and η0 decreases significantly with the increase of ventilation rate, which is obviously different from the experiment and η. The effect of rotating speed on η0 is significantly stronger than that of η.
Equation (17) was used to calculate the ventilation resistance under various operating conditions. The results were compared with the experimental values, as shown in Figure 8. The results show that the calculated value of ventilation resistance has the same variation trend as the experimental value under different operating conditions. When there were changes in ventilation rate, rotation speed, and temperature, the mean error was 13.93%, 9.37%, and 11.89%, respectively. Thus, the prediction model of ventilation resistance has high reliability, which can be implemented in theoretical calculations of ventilation resistance and to provide good reference for engineering design.

5. Conclusions

In this research, orthogonal test design was used in calculation of the operating condition. The RNG model and the DPM model were coupled to calculate the selected operating conditions. By analyzing the results, the significance of various influencing factors and the optimal levels were shown. Based on the dimensional analysis, a dimensionless group equation in general form was established by combining comprehensive separation efficiency, breather separation efficiency, and ventilation resistance. Also, through the least squares method, the performance prediction model of the breather was obtained considering five operating conditions and six structural parameters. Through the research in this paper, the following conclusions are drawn:
  • The significance of the influential factors affecting the separation of impeller-type breathers and their optimal levels were determined. Among all the operating conditions, rotating speed has the largest influence on separation efficiency, followed by ventilation rate and average inlet particle size. Temperature and oil/gas ratio have relatively little influence. The optimal levels were C5B1A5D1E2. Among all the structural factors, number of blades has the largest influence, followed by external diameter of the blades and thickness of the breather. Blade angle and diameter of vent hole have little influence. The optimal level shows as F5H1J1G4I4K2.
  • The significance of the factors affecting the resistance characteristics of the impeller-type breather and their optimal levels were determined. Among all operating condition factors, ventilation rate has the largest influence on ventilation resistance, while temperature, rotating speed, inlet particle average diameter, and gas/oil ratio have little influence. Their optimal levels were B1D2C1A1E3. Among all the structural factors, diameter of the vents has a greater influence, while the other factors, such as number of blades, blades angle, thickness, and the external diameters of the blades, all have a small influence. The optimal levels were K5F2I1J4H2G3.
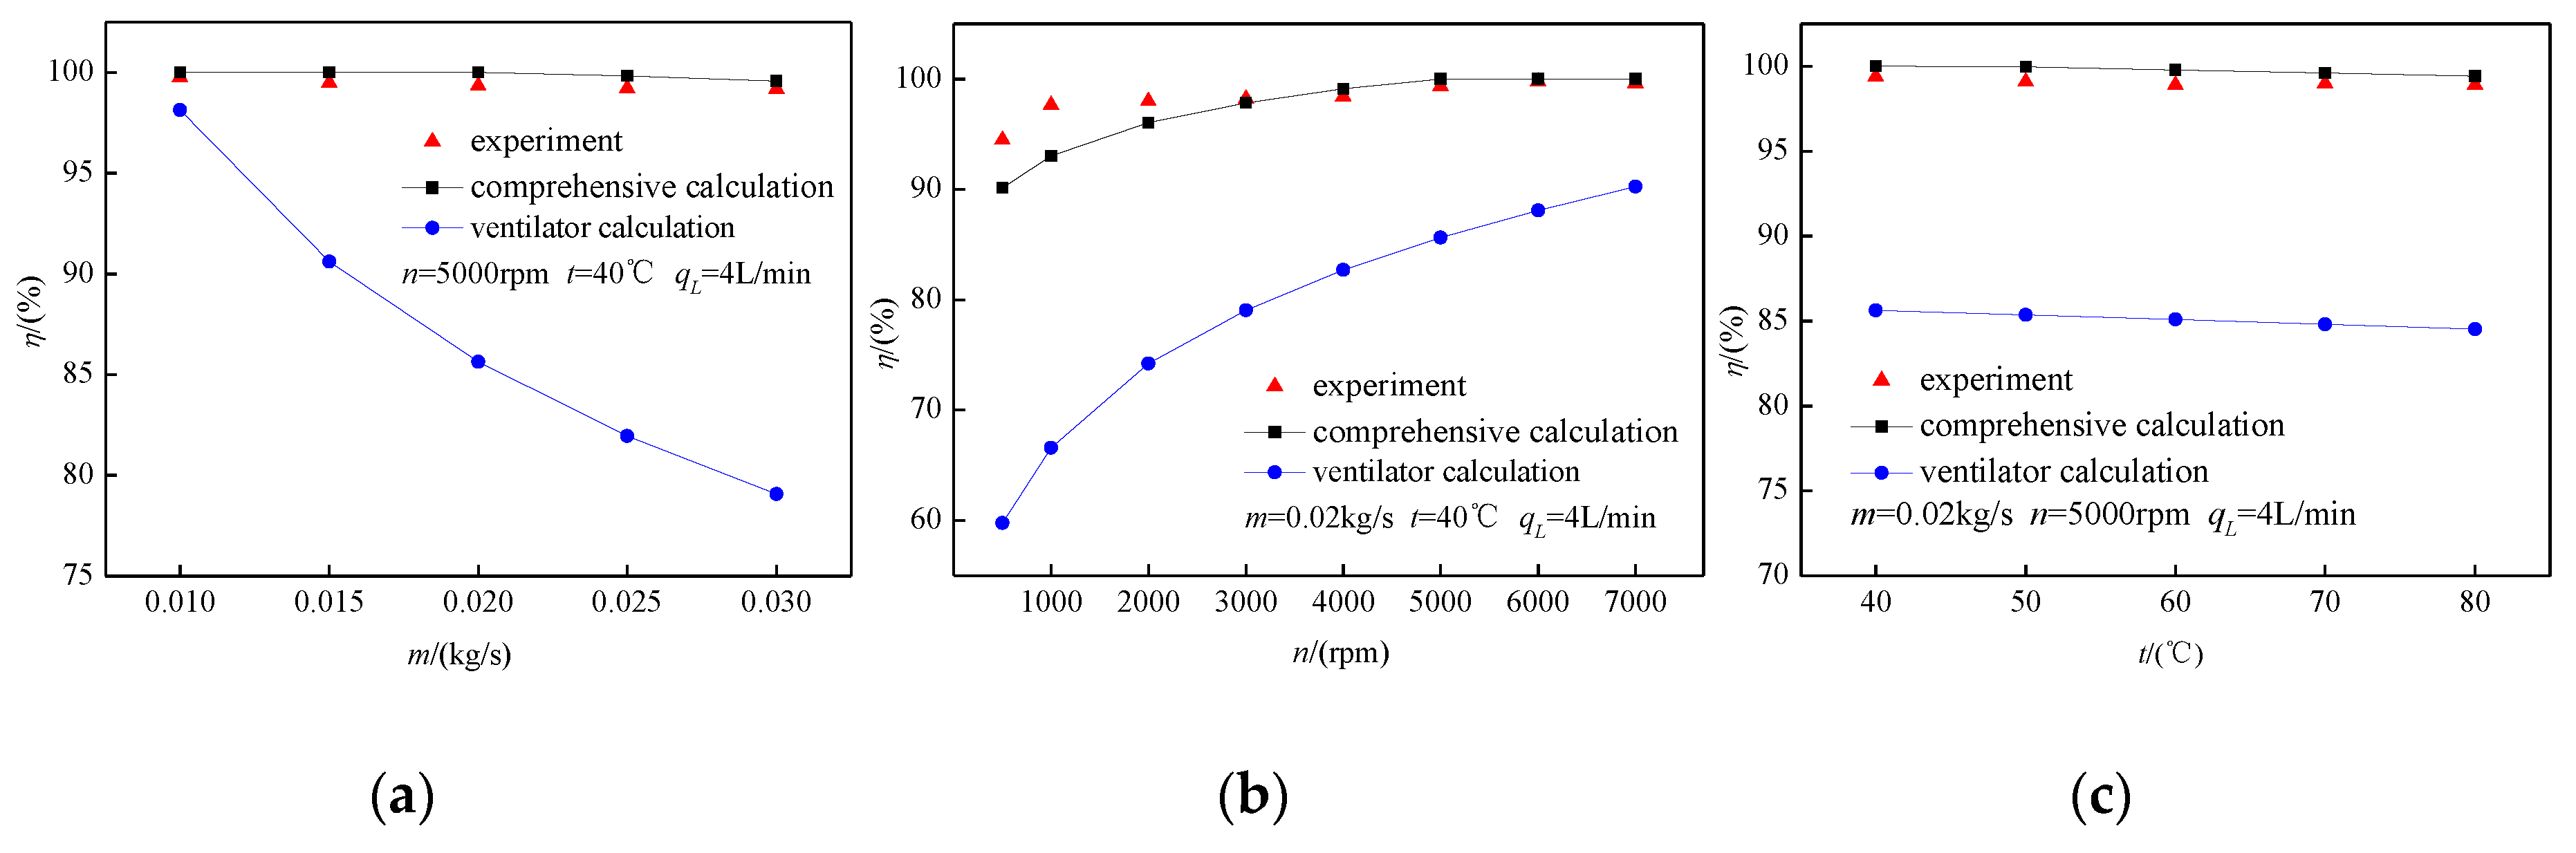
  • The performance prediction model of an impeller-type breather was established. The comprehensive separation efficiency has a mean error of 0.97%, while the ventilation resistance has a mean error of 11.73%. The calculation values and the experimental values share the same trend change, which indicate that the prediction model can be implemented in theoretical calculation of comprehensive separation efficiency, ventilation separation efficiency, and ventilation resistance, providing good references for evaluation and design of an impeller-type breather.

Author Contributions

Conceptualization, X.Z. and W.Z.; Data curation, L.Q.; Formal analysis, M.L.; Writing – original draft, X.Z.

Funding

This research received no external funding.

Conflicts of Interest

The authors declare no conflicts of interest.

References

  1. Lin, J.S.; Chang, C.J.; Yang, J.G. Aero Engine Design Manual; Navigate Industrical Press: Beijing, China, 2002. [Google Scholar]
  2. Zhou, H.; Xia, N. Numerical Simulation of Gas-Liquid Two-Phase Flow in Oil-Gas Separator. Chin. J. Comput. Mech. 2006, 23, 766–771. [Google Scholar]
  3. Lu, H.T. Evaluation Method for Centrifugal Breather Separation Capacity of Aero-Engine and Rotor Optimization Design. Mech. Des. Manuf. 2008, 10, 44–46. [Google Scholar]
  4. Willenborg, K.; Klingsporn, M.; Tebby, S.; Ratcliffe, T.; Gorse, P.; Dullenkopf, K.; Wittig, S. Experimental Analysis of Air/Oil Separator Performance. J. Eng. Gas Turbines Power 2008, 130, 062503. [Google Scholar] [CrossRef]
  5. Elsayed, K.; Lacor, C. Optimization of the cyclone separator geometry for minimum pressure drop using mathematical models and CFD simulations. Chem. Eng. Sci. 2010, 65, 6048–6058. [Google Scholar] [CrossRef]
  6. Zhang, N.; Liu, Z.X.; Lv, Y.G. Numerical Study on Impeller-type Breather of Aero-engine Lubricating Oil System. Sci. Technol. Eng. 2010, 15, 3645–3648, 3663. [Google Scholar]
  7. Gruselle, F.; Steimes, J.; Hendrick, P. Study of a two-phase flow pump and separator system. J. Eng. Gas Turbines Power 2011, 133, 062401. [Google Scholar] [CrossRef]
  8. Liu, L.B.; Xu, R.S.; Wang, J.J.; Li, J.C. The effect of turbulence on the oil-gas separation process of axial breather. J. Shenyang Aerosp. Univ. 2011, 28, 15–18. [Google Scholar]
  9. Shi, S.Q.; Liu, Z.X.; Hu, J.P. Aeroengine Centrifugal Breather Calculation. Aeronaut. Comput. Tech. 2012, 42, 68–71. [Google Scholar]
  10. Shao, C.H.; Xu, G.S. A numerical study on the influence of working conditions on the penetration rate of centrifugal breathers. J. Shenyang Aerosp. Univ. 2013, 30, 8–10. [Google Scholar]
  11. Xu, R.S.; Shao, C.H.; Niu, L. A numerical study on the influence of structural factors on the performance of centrifugal breathers. Aeroengine 2014, 40, 18–23. [Google Scholar]
  12. Ingle, R.; Yadav, R.; Punekar, H.; Cao, J. Modeling of particle wall interaction and film transport using Eulerian wall film model. In Proceedings of the ASME 2014 Gas Turbine India Conference, New Delhi, India, 15–17 December 2014; p. V001T03A006. [Google Scholar]
  13. Wang, L.Z.; Gao, X.; Feng, J.M.; Peng, X.Y. Research on the two-phase flow and separation mechanism in the oil-gas cyclone separator. In IOP Conference Series: Materials Science and Engineering; IOP Publishing: Bristol, UK, 2015; Volume 90, p. 012075. [Google Scholar]
  14. Juhyeong, S.; Jae, S.; Ho, Y.K.; Sam, S.Y. Empirical model for the maximum spreading diameter of low-viscosity droplets on a dry wall. Exp. Therm. Fluid Sci. 2015, 61, 121–129. [Google Scholar]
  15. Han, J.I.; Chen, C.H.; Xu, R.S. Performance simulation of ultra-high speed centrifugal breather. Aeroengine 2016, 31, 685–691. [Google Scholar]
  16. Zhong, Z.; Haifeng, L.; Fan, Z.; Mingfa, Y. Numerical study of spray micro-droplet impinging on dry/wet wall. Appl. Therm. Eng. 2016, 95, 1–9. [Google Scholar] [CrossRef]
  17. Tianyu, M.; Lei, F.; Hu, W.; Haifeng, L.; Mingfa, Y. A numerical study of spray/wall impingement based on droplet impact phenomenon. Int. J. Heat Mass Transf. 2017, 112, 401–412. [Google Scholar]
  18. Farrall, M.; Simmons, K.; Hibberd, S.; Gorse, P. A numerical model for oil film flow in an aeroengine bearing chamber and comparison to experimental data. J. Eng. Gas Turbines Power 2006, 128, 111–117. [Google Scholar] [CrossRef]
Figure 1. Interaction of droplets and the wall.
Applsci 09 03504 g001
Figure 2. Experimental section of an impeller-type breather. Consists of: 1 inlet; 2 inner chamber; 3 impeller breather; 4 vent hole; 5 oil outlet; 6 hollow shaft; 7 air outlet.
Applsci 09 03504 g002
Figure 3. Physical models. (a) Whole structure; (b) partial structure.
Applsci 09 03504 g003
Figure 4. Physical models. (a) Whole computing domain; (b) local encryption of vent and hollow shaft; (c) partial structure.
Applsci 09 03504 g004
Figure 5. Single-phase model validation. (a) Ventilation rate; (b) rotating speed.
Applsci 09 03504 g005
Figure 6. Two-phase model verification. (a) Ventilation rate; (b) rotating speed.
Applsci 09 03504 g006
Figure 7. Separation efficiency. (a) Ventilation rate; (b) rotating speed; (c) temperature.
Applsci 09 03504 g007
Figure 8. Ventilation resistance. (a) Ventilation rate; (b) rotating speed; (c) temperature.
Applsci 09 03504 g008
Table 1. Factors and levels.
OrderFactor NameFactor SymbolLevels
1Inlet Particle Diameter AverageA5
2Ventilation RateB5
3Rotating SpeedC5
4TemperatureD5
5Oil/Gas RatioE5
6Number of BladesF5
7External Diameter of BladesG5
8Internal Diameter of BladesH5
9Blade AngleI5
10Thickness of BreatherJ5
11Diameter of Vent HoleK5
Table 2. Range analysis of each influential factor on separation efficiency.
Average η/(%)Operating Condition FactorsStructural Factors
ABCDEFGHIJK
T195.3098.2592.2597.5695.7392.5795.2897.6195.4997.8396.22
T294.0997.2196.2496.4797.4796.0295.5096.7696.0096.4696.83
T394.6597.7397.8394.2996.2797.4396.9494.2996.0895.6796.75
T497.2195.7697.1196.0597.0797.0797.7695.5897.0294.6196.62
T599.4392.7298.2597.3095.1397.5896.2097.4396.6897.1095.67
Range R5.345.536.013.272.345.012.483.311.533.221.16
SignificanceC > B > A > D > EF > H > J > G > I > K
Optimal LevelC5B1A5D1E2F5H1J1G4I4K2
Table 3. Range analysis of each influential factor on ventilation resistance.
Average Δp/(kPa)Operating Condition FactorsStructural Factors
ABCDEFGHIJK
T149.8114.1249.5950.8650.7355.9354.0251.0448.8457.8988.33
T260.3429.6754.6650.0959.2249.5854.9050.9554.9256.8058.90
T353.5148.3460.4655.9448.8056.5351.7357.4459.4554.4145.96
T450.8674.7052.4361.6259.1760.6353.2357.5450.0851.2141.37
T559.33105.8355.5154.1454.7449.9956.7855.6959.3752.3638.10
Range R10.5391.7110.8711.5310.4311.055.056.5910.626.6850.23
SignificanceB > D > C > A > EK > F > I > J > H > G
Optimal LevelB1D2C1A1E3K5F2I1J4H2G3
Table 4. Influencing factors and dimensions.
NumberNameSymbolUnitDimension
1Average Inlet Particle Diameter d ¯ mL
2Rotating Speedn r / min T 1
3Gas–Oil Ratio ε --
4Mixture Velocity v m / s LT 1
5Mixture Density ρ kg / m 3 ML 3
6Mixture Dynamic Viscosity μ Pa s ML 1 T 1
7Number of Blades α --
8External Diameter of Bladesr1mL
9Internal Diameter of Bladesr2mL
10Blade Angle β --
11Thickness of BreatherhmL
12Diameter of Vent HolesdmL

