Abstract
Near-infrared spectroscopy (NIRS) including diffuse optical tomography is an imaging modality which makes use of diffuse light propagation in random media. When optical properties of a random medium are investigated from boundary measurements of reflected or transmitted light, iterative inversion schemes such as the Levenberg–Marquardt algorithm are known to fail when initial guesses are not close enough to the true value of the coefficient to be reconstructed. In this paper, we investigate how this weakness of iterative schemes is overcome using Markov chain Monte Carlo. Using time-resolved measurements performed against a polyurethane-based phantom, we present a case that the Levenberg–Marquardt algorithm fails to work but the proposed hybrid method works well. Then, with a toy model of diffuse optical tomography we illustrate that the Levenberg–Marquardt method fails when it is trapped by a local minimum but the hybrid method can escape from local minima by using the Metropolis–Hastings Markov chain Monte Carlo algorithm until it reaches the valley of the global minimum. The proposed hybrid scheme can be applied to different inverse problems in NIRS which are solved iteratively. We find that for both numerical and phantom experiments, optical properties such as the absorption and reduced scattering coefficients can be retrieved without being trapped by a local minimum when Monte Carlo simulation is run only about 100 steps before switching to an iterative method. The hybrid method is compared with simulated annealing. Although the Metropolis–Hastings MCMC arrives at the steady state at about 10,000 Monte Carlo steps, in the hybrid method the Monte Carlo simulation can be stopped way before the burn-in time.
1. Introduction
In near-infrared spectroscopy (NIRS), we estimate optical properties of biological tissue by solving inverse diffuse problems [1,2]. Such inverse problems are commonly solved by means of iterative methods. In the case of a homogeneous medium, absorption and reduced scattering coefficients of the medium can be obtained with iterative methods such as the Levenberg–Marquardt algorithm [3,4] from time-resolved measurements (for example, see the review article [5]). Neuroimaging for the human brain by NIRS through the neurovascular coupling has been developed and is called functional NIRS (fNIRS) [6,7,8,9]. Since the region of interest on the head can be small, it is possible to assume a simple geometry of the half space. Quantitative measurements of inter-regional differences in neuronal activity requires accurate estimates of optical properties.
In Ref. [10], the Nelder–Mead simplex method was used to retrieve optical parameters in layered tissue. Heterogeneity of optical properties can be obtained by diffuse optical tomography [1,11,12]. Iterative numerical schemes are used to minimize the cost function when solving these inverse problems. A gradient-based approach [13] was used to detect breast cancer [14]. The brain activity of a newborn infant was investigated [15] with diffuse optical tomography by TOAST (temporal optical absorption and scattering tomography) [16,17], in which iterative algorithms such as the nonlinear conjugate gradients, damped Gauss–Newton method, and Levenberg–Marquardt method are implemented. Diffuse optical tomography was performed on human lower legs and a forearm with the algebraic reconstruction algorithm in the framework of the modified generalized pulse spectrum technique [18]. See Refs. [19,20] for numerical techniques for diffuse optical tomography. For these iterative numerical schemes to work, it is important to choose a good initial guess for the initial value of the iteration.
Solving inverse problems by the Bayesian approach has been sought as an alternative way. In Ref. [21], a novel use of the Bayesian approach was considered to take modeling error into account. The Bayesian inversion with the Metropolis–Hastings Markov chain Monte Carlo was used in Refs. [22,23]. The Bayesian approach was used to determine optical parameters of the human head [24]. Although the Markov chain Monte Carlo (MCMC) approach is in principle able to escape from local minima, it is computationally time consuming. Hence, despite the above-mentioned efforts, the use of Monte Carlo for inverse problems in NIRS has been extremely limited.
In this paper, we shed light on Markov chain Monte Carlo once again by combining it with an iterative scheme, and investigate the use of it in NIRS. In particular, we test a hybrid numerical scheme of Markov chain Monte Carlo and an iterative method. In the proposed hybrid scheme, the Markov chain Monte Carlo algorithm is first used to provide an initial guess using jumps in the landscape of the cost function, and then an iterative method is used after the initial large fluctuation. Thus, the proposed method realizes a fast reconstruction while, in the beginning, obtained values at Monte Carlo steps jump around in the landscape of the cost function. The MCMC simulation is necessary only for the first 100 steps. Then the hybrid method starts to use an iterative scheme and reconstructs optical properties by searching the global minimum. The computation time of the iterative scheme is negligible compared with that of the Monte Carlo simulation. Since the Monte Carlo simulation can be stopped way before the burn-in time for the hybrid method, the proposed scheme is at least ten times faster than simulated annealing, which is implemented by the naive use of the Metropolis–Hastings Markov chain Monte Carlo.
2. Materials and Methods
2.1. Diffusion Theory
2.1.1. Diffuse Light in Three Dimensions
Let us suppose that a random medium occupies the three-dimensional half space. We assume that the random medium is characterized by the diffusion coefficient D and absorption coefficient . We have , where is the reduced scattering coefficient. Position in the half space (, , ) is denoted by , . Let t denote time. Let c be the speed of light in the medium. We assume an incident beam on the boundary at the origin in the x-y plane. The energy density u of light in the medium obeys the following diffusion equation.
with the boundary condition
and the initial condition . The right-hand side of the boundary condition is the incident laser beam which illuminates the medium at the origin with the temporal profile . In the phantom experiment described below, the incident light enters the phantom in the positive z direction. The extrapolation distance ℓ is a nonnegative constant. If we consider the diffuse surface reflection, we have [25]
where the internal reflection is given by [26]. Let us consider the corresponding surface Green’s function , which satisfies Equation (1) and the boundary condition
together with the initial condition . We obtain [27,28,29,30]
with for . The complementary error function is defined by . Let be a point in the x-y plane with . We obtain
This in Equation (6) is used for the calculation in Section 3.1.
2.1.2. Diffuse Light in Two Dimensions
For the later purpose of a numerical experiment, we here consider light propagation in two dimensions. Let us suppose that the two-dimensional half space of positive y is occupied with a random medium in the x-y plane. The energy density u of light at position in the medium due to the incident beam on the boundary (the x-axis) at () obeys the following diffusion equation.
with the boundary condition
and the initial condition . The incident laser beam on the right-hand side of the boundary condition was assumed to be a pulse at the position . We suppose that the diffusion coefficient D is a positive constant but varies in space.
Below we develop the Rytov approximation. Let us write as
where is a constant and the perturbation spatially varies. We note the relation,
where is the solution to the diffusion Equation (7) with the zeroth-order coefficient replaced by . We introduce the Green’s function , which satisfies
with the boundary condition at , and the initial condition at . The above relation (10) can be directly verified. By recursive substitution, we obtain u as
By neglecting higher-order terms assuming that is small, we arrive at the (first) Born approximation [31], in which u is given by
We note that the Green’s function is obtained as [27,28,29,30]
for , and otherwise . Moreover, we obtain
The above expression of is similar to the formula in Equation (6) but does not have a time integral because in this case we assumed the delta function for the incident beam.
To obtain the expression of the Rytov approximation, we introduce as [31]
By plugging the above expressions of into the Born approximation and neglecting terms of , we obtain
The (first) Rytov approximation is thus derived as
Let us define
Then we have
Therefore, Equation (18) can be rewritten as
This expression (21) is used to compute the forward data in Section 3.2.
2.2. Inverse Problems by an Iterative Scheme
We suppose that on the surface of a two- or three-dimensional random medium, for each source at or () exiting light is detected at or () and is measured at times (). Let be measured data whereas u is a solution to the diffusion equation. Let us suppose that u depends on a vector which contains unknown parameters. We wish to reconstruct . In Section 3.1, , and a is a scalar (a one-dimensional vector) in Section 3.2. For example, in the former case the solution u depends on since the calculated value of u depends on .
Let us introduce vectors and of dimension as
where we wrote and emphasizing that u depends on . We find optimal by minimizing . Here we particularly consider the Levenberg–Marquardt method [3,4], i.e., the reconstructed value is computed by the iteration given by
where is the Jacobian matrix, which contains derivatives of with respect to , and the parameter is nonnegative. By modifying the original algorithm according to Ref. [32], our algorithm of the Levenberg–Marquardt method, which we call Algorithm 1, is described below.
| Algorithm 1: Levenberg–Marquardt (LM) |
|
2.3. Inverse Problems by Markov Chain Monte Carlo
For simplicity in this section, we describe the Metropolis–Hastings Markov chain Monte Carlo algorithm (MH-MCMC) assuming a is the scalar appearing in Section 3.2. The extension of the derivation to the general case of vector is straightforward.
Suppose that the coefficient is unknown and depends on a parameter a. We will reconstruct a within the framework of the Bayesian inversion algorithm [33,34], i.e., we will find the probability distribution of a for measured data . Let be the prior probability density and be the likelihood density or the conditional probability density of for a. Then the joint probability density of is given by . According to the Bayes formula, the conditional probability density is given by
where is a function proportional to . Assuming Gaussian noise, we put
In this paper, we simply set , i.e., we can say and the interval is large enough so that all a’s appearing in the Markov chain fall into this interval. Here, is the indicator function defined as for and for . General uniform distributions can be used for if we use the prior-reversible proposal that satisfies (see below for the proposal distribution ) [35]. Another possible choice of is a Gaussian distribution, which turns out to be the Tikhonov regularization term in the cost function.
Using the Metropolis–Hastings algorithm, we can evaluate even when the normalization factor is not known and only the relation is available [33,34]. We can find using a sequence as
where is obtained from (Markov chain) as
For all , the transition kernel satisfies
Let us write as
where is the proposal distribution and
In the Metropolis–Hastings algorithm we set . With this choice of , the detailed balance is satisfied and . A common choice of is the normal distribution, i.e., with the mean a and the standard deviation . We note that in this case. We have
where and h is an arbitrary continuous bounded function.
Simulated annealing [36] is a type of the Metropolis–Hastings MCMC algorithm in which the temperature decreases during the simulation. The algorithm is summarized below as Algorithm 2. In this paper we consider two temperatures.
| Algorithm 2: Two-temperature simulated annealing (SA) |
|
Now we propose an MCMC-iterative hybrid method by combining Algorithms 1 with the Metropolis–Hastings Markov chain Monte Carlo. We first run the Markov chain Monte Carlo. Although the Metropolis–Hastings MCMC eventually gives the correct solution after about 10,000 steps when the chain reaches the steady state, we stop the Monte Carlo simulation way before the burn-in time. At the th Monte Carlo step after initial rapid changes ceases, we record the obtained reconstructed value and switch to Algorithm 1 with the initial value the recorded . It is important that is chosen after the initial rapid changes although can be a significant way from the burn-in time. Otherwise, the final reconstructed results are quite robust against the choice of . We refer to the following hybrid algorithm as Algorithm 3.
| Algorithm 3: Hybrid |
|
We close this subsection by the Gelman-Rubin convergence diagnostic, which uses the intra-chain variance and inter-chain variance [37,38]. We run different chains with different initial values. Let denote the kth value in the mth chain (, ). We discard the first steps before the initial rapid changes cease. Then we compute the following intra-chain average and variance.
Next we compute the inter-chain mean and variance.
Now we introduce
where . This is an unbiased estimator of the true variance. But W is also an unbiased estimate of the true variance if the chains converge. Therefore, we have if converged. Below, we will see that we can choose for which is not close to 1. In this paper, we set .
2.4. TRS Measurements of a Polyurethane-Based Phantom
In this section, we consider time-resolved measurements for a phantom. The solid phantom (biomimic optical phantom) is made of polyurethane to simulate biological tissues (INO, Quebec, QC, Canada). The absorption coefficient and reduced scattering coefficient are and at wavelength 800 nm. The refractive index of the phantom is . The measurements were performed by the TRS (time-resolved spectroscopy) instrument (TRS-80, Hamamatsu Photonics K.K., Hamamatsu, Japan). Two optical fibers from TRS-80 are attached on the top of the phantom with the separation (). The phantom is illuminated by near-infrared light of the wavelength through one optical fiber and the reflected light is detected by the other optical fiber. The time interval of the measured data is and we used the data from to (). Measured counts, i.e., the number of photons, are shown in Figure 1. The upper panel of Figure 1 shows the instrument response function (IRF), which is given as a property of the experimental device. The measured reflected light is shown in the lower panel of Figure 1. The function is the instrument response function divided by the maximum value of the measured reflected light. The peak of q is at . is the measured reflected light normalized by its maximum value. In the lower panel of Figure 1, and are marked by vertical dashed lines. The size of the phantom is large enough that we can assume the three-dimensional half space. Then the energy density of the detected light is computed by Equation (6). The parameter ℓ is obtained from Equation (3).
Figure 1.
Measured data from TRS-80. The instrument response function and measured reflected light are shown in the upper and lower panels, respectively. In the lower panel, the dashed lines show and ().
2.5. Numerical Phantom
To examine when the iterative scheme fails by being trapped by a local minimum and how the Markov chain Monte Carlo is capable of escaping from such local minima, a toy model is devised which is simple enough to explicitly understand the structure of the cost function but is complicated enough that the cost function has one local minimum and one global minimum.
We consider diffuse optical tomography in the two-dimensional space. In our toy model we suppose that the diffusion coefficient D is constant everywhere in the medium but there is absorption inhomogeneity and the absorption coefficient is unknown. Moreover, we assume that is given by
where are given positive constants. Here, is given by
where is a constant. Thus, a is the parameter to be reconstructed in our toy inverse problem. As is shown in Figure 2, the function has one peak at and the maximum value is , monotonically decays for , and as .
Figure 2.
The function in Equation (36) is plotted for , , and .
Now we describe how the forward data is computed. The unit of length and unit of time are taken to be and , respectively. On the x-axis, we place two sources () at , and three detectors () at , , . We set , , . Suppose that there is absorption inhomogeneity at depth 5. For , we put , , and
To distinguish, hereafter the true value of a is denoted by . We assume 3% Gaussian noise and give the measured data as
where . In this numerical experiment, and ().
3. Results
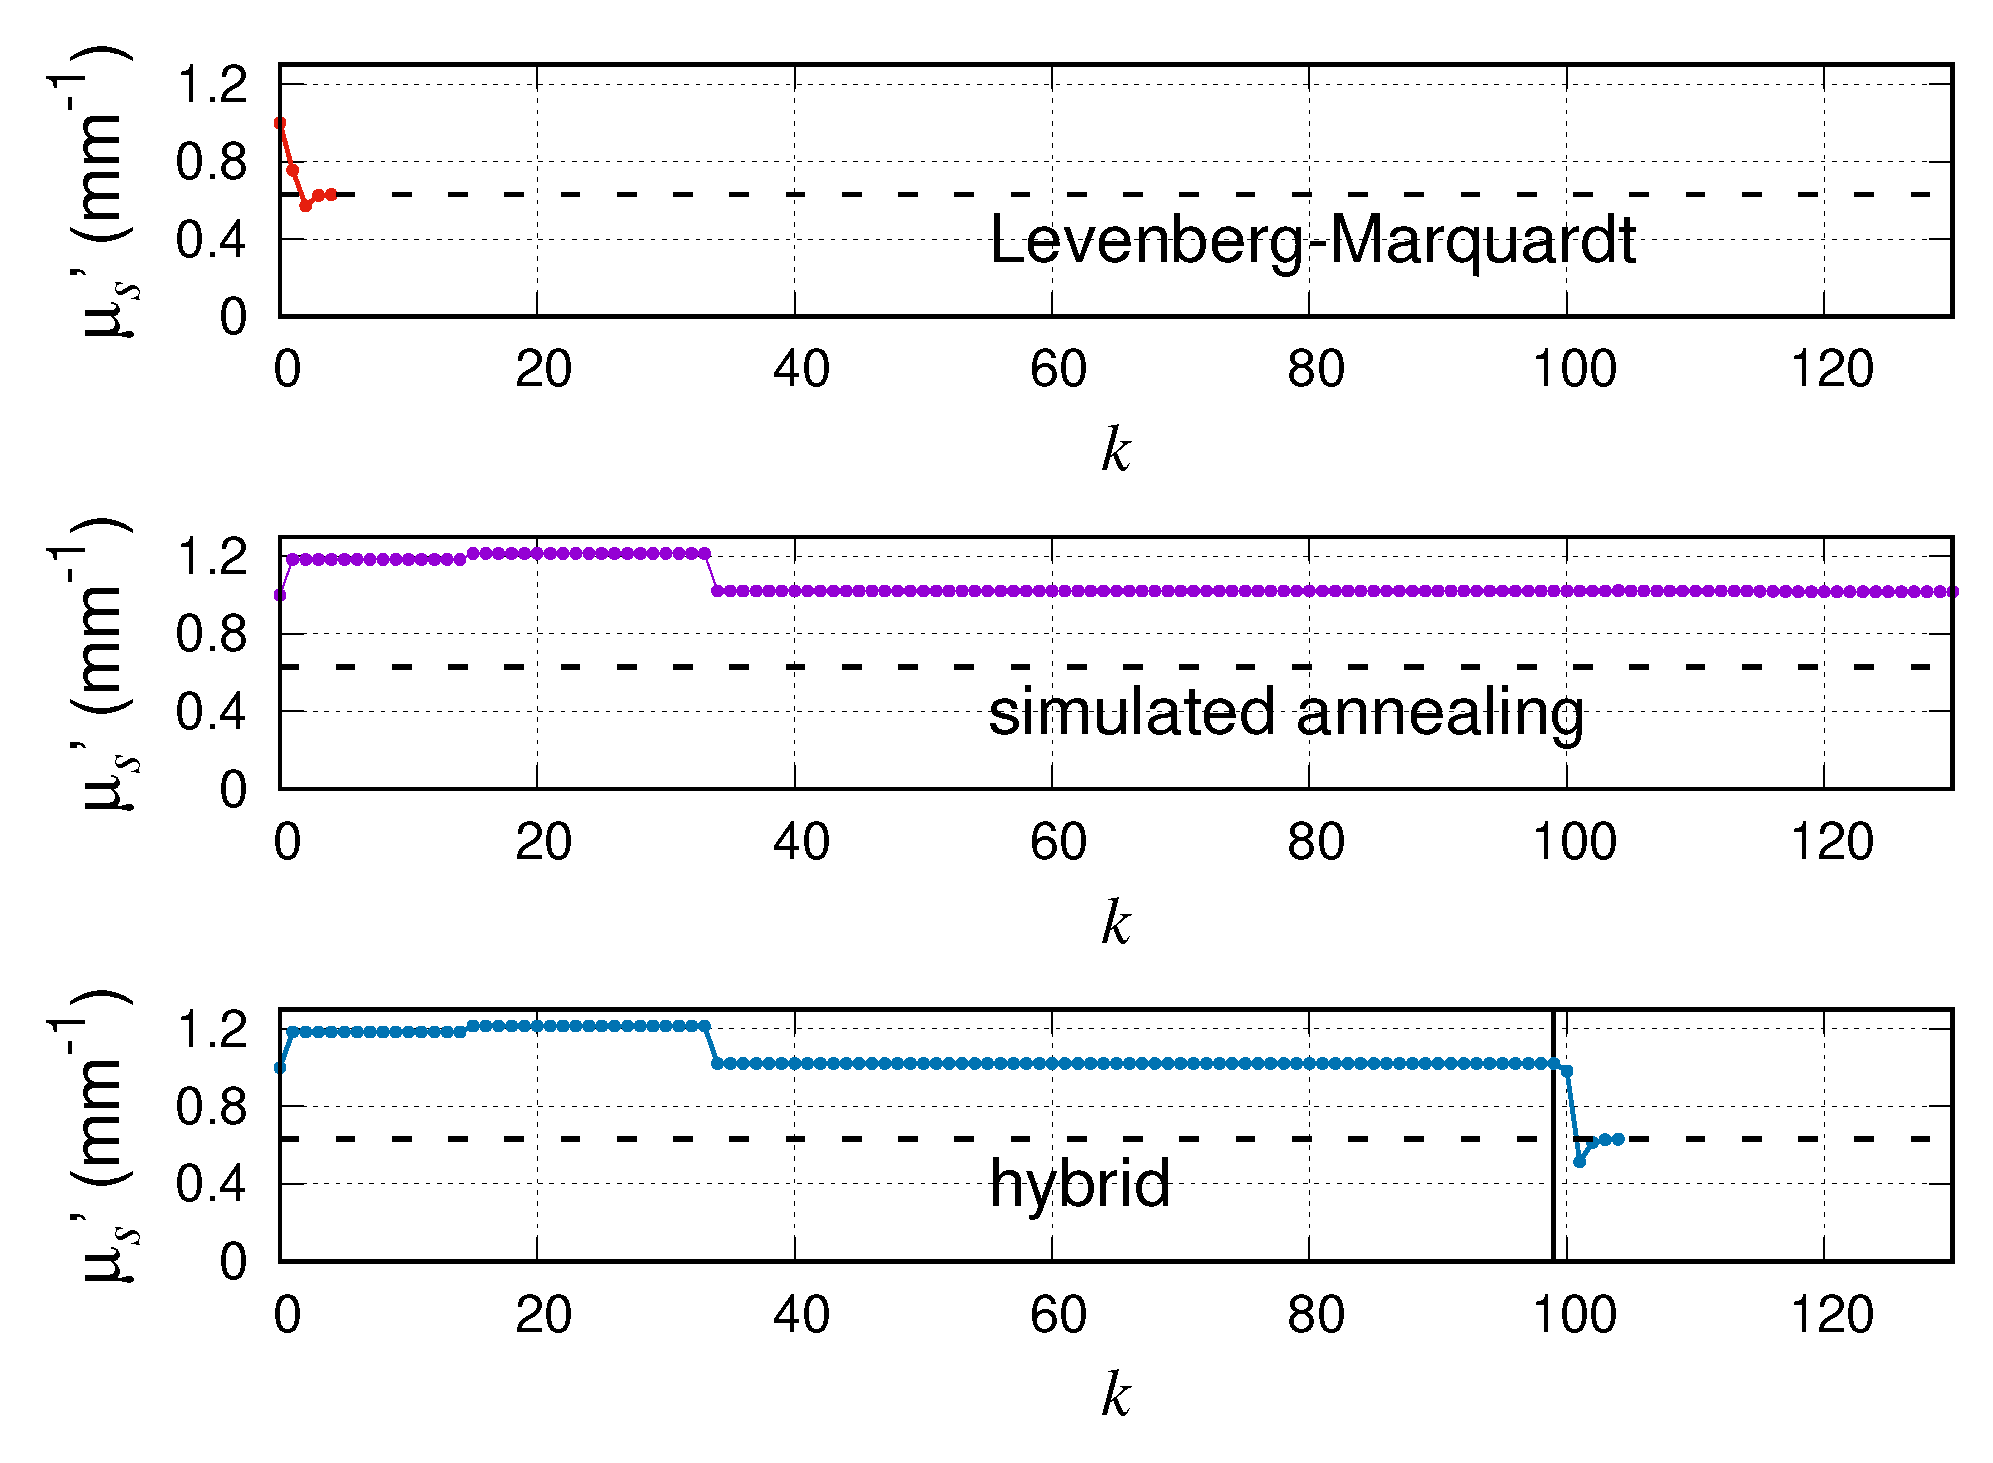
3.1. Determination of Optical Properties
Here we consider reconstructions from measured data in the phantom experiment. Let us first consider initial guesses below.
In this Case 1, the following are obtained both by Algorithm 1 (LM) and Algorithm 3 (hybrid).
The results for and are shown in Figure 3 and Figure 4, respectively. In Figure 3, reconstructed values of are plotted against the iteration number k. In the top panel of Figure 3, we see that Algorithm 1 (LM) quickly converges. In Algorithms 2 and 3, we set . As is seen in the middle panel of Figure 3, the convergence of Algorithm 2 (SA) is slow. The temperature is decreased from to at the th Monte Carlo step. Similarly, is changed from to . Algorithm 2 returns the correct values after many Monte Carlo steps; we have for , respectively, when and . Finally, in the bottom panel of Figure 3, we see that the iteration of Algorithm 3 (hybrid) immediately converges after we switch from the Metropolis–Hastings MCMC (, ) to Algorithm 1 (LM). No convergence of the Monte Carlo chain is required, and we found for and for (, ). A similar behavior is observed for the reconstruction of in Figure 4. In the top panel of Figure 4, we find that Algorithm 1 (LM) works best and converges after a few iterations, whereas Algorithm 2 (SA) in the middle panel of Figure 4 has slow convergence and reconstructed values around at are still away from in (42). By switching from MH-MCMC to Algorithm 1 (LM) using Algorithm 3 (hybrid), convergence is easily obtained as shown in the bottom panel of Figure 4.
Figure 3.
Case 1: Reconstructed by (top) Algorithm 1, (middle) Algorithm 2, and (bottom) Algorithm 3. The dashed lines show in Equation (42).
Figure 4.
Case 1: Reconstructed by (top) Algorithm 1, (middle) Algorithm 2, and (bottom) Algorithm 3. The dashed lines show in Equation (42).
Now we start the simulation by setting the following initial values.
In this Case 2, Algorithm 1 (LM) fails and returns and whereas Algorithm 3 (hybrid) still gives the correct values. The reconstructed values of and at each iteration are shown in Figure 5 and Figure 6, respectively. In Figure 5, the vertical axes of the left three panels are from 0 to whereas the vertical axes of the right three panels are from 0 to . In Figure 6, the vertical axes of the left three panels are from 0 to 2 while the vertical axes of the right three panels are from 0 to . In the top panels of Figure 5, we see that the reconstruction of is unsuccessful by Algorithm 1 (LM). Algorithm 2 (SA) approaches in Equation (42) but still deviates from that value in the middle panels of Figure 5. As shown in the bottom panels of Figure 5, Algorithm 3 (hybrid) converges in a few iterations after switching to Algorithm 1 (LM). In the top panels of Figure 6, Algorithm 1 (LM) fails to reconstruct . In the middle panels of Figure 6, reconstructed values by Algorithm 2 (SA) come close to in Equation (42) but suffer from slow convergence. In the bottom panels of Figure 6, we see that Algorithm 3 (hybrid) arrives at in Equation (42) without any problem.
Figure 5.
(Left) Case 2: Reconstructed by (top) Algorithm 1, (middle) Algorithm 2, and (bottom) Algorithm 3. The dashed lines show in Equation (42). (Right) Same as the left panel but the vertical axes are from 0 to .
Figure 6.
(Left) Case 2: Reconstructed by (top) Algorithm 1, (middle) Algorithm 2, and (bottom) Algorithm 3. The dashed lines show in Equation (42). (Right) Same as the left panel but the vertical axes are from 0 to .
The initial guesses for Case 1 are reasonably close to the values found in Equation (42). However, we started with initial guesses which are quite different from the above-mentioned values in Case 2. It is not surprising that Algorithm 1 (LM) does not work for Case 2, but Algorithm 3 (hybrid) can arrive at the correct values. The numerical calculations were performed on Matlab (i7-8700 CPU, 16 GB memory). In the hybrid method, the Metropolis–Hastings MCMC does not reach the steady state at about 100 steps but can be switched to the Levenberg–Marquardt method. For Figure 5 and Figure 6, the computation time was . The simulated annealing method returns the correct value after about 10,000 steps, but it takes . The computation for Algorithm 1 (LM) stopped in .
Below we summarize the reconstructed values on Table 1. Although Algorithm 2 (SA) and Algorithm 3 (hybrid) return the same results after a long time, the hybrid scheme is about ten times faster, and moreover there is no need for choosing the low temperature for the latter algorithm. For Algorithm 3, it is not necessary to wait until the burn-in time, but it is enough if the initial rapid change ceases. In Section 3.2, we illustrate that Algorithm 3 works once the Monte Carlo simulation escapes from a local minimum and the algorithm does not require that the calculation reaches the steady state.
Table 1.
Reconstructed values of are shown for Case 1 and Case 2. The units of are both . For Algorithm 2, values at 120th Monte Carlo step are shown.
3.2. Determination of Absorption Inhomogeneity
We perform a numerical experiment of diffuse optical tomography using the toy model. Let us consider when the iterative scheme fails. We see . For sufficiently small , we have , , , and . Therefore, if we start the iteration from , we obtain
Thus, the sequence approaches 0 and can never arrive at ().
Let us consider how the difference depends on a. We introduce
The following form is obtained using Equation (39). By neglecting noise, we have
where with
For a given , the function has one global minimum at , one local minimum at , and one local maximum at . Therefore, the above expression implies that Algorithm 1 (LM) fails when the initial value is negative and the correct value is reconstructed only for a positive initial guess. Indeed, the computation ends up with if we start the iteration from (see below) or , and the value is obtained when . Figure 7 shows for and .
Figure 7.
The function () is plotted when .
In Figure 8, we plot reconstructed values of a against iteration numbers. The initial value is set to . The reconstruction by Algorithm 1 (LM) is shown in the top panel of Figure 8. As we can predict from Figure 7, Algorithm 1 (LM) converges to the local minimum and can never arrive at the global minimum. Monte Carlo simulation can jump over the local maximum and approach the global minimum, but keeps fluctuating as shown in the middle panel of Figure 8. We initially set for Algorithms 2 and 3. In Algorithm 2, we set after the temperature decreases at the th Monte Carlo step. In the bottom panel of Figure 8, Algorithm 3 (hybrid) successfully arrives at the global minimum. Using Matlab, the computation time was while we needed for Algorithm 2 (SA) (1000 steps).
Figure 8.
Reconstructed () by (top) Algorithm 1 (LM), (middle) Algorithm 2 (SA), and (bottom) Algorithm 3 (hybrid) for the initial value .
After the initial time with large jumps, it is found that we can set in our simulation of the MCMC-iterative hybrid method. The correct value of is reconstructed by Algorithm 3 (hybrid) even when the simulation experiences a local minimum. Starting from , the calculation stops at (). We note that the reconstructed is not exactly due to noise.
When the initial guess lies in the valley of the local minimum (see Figure 7), the reconstructed a by Algorithm 3 (hybrid) moves to the valley of the global minimum with the help of Monte Carlo simulation as shown in Figure 8, while the reconstructed a by Algorithm 1 (LM) falls to the local minimum as the nature of Newton-type iterative methods. For Algorithm 3 (hybrid), we obtained . There is a possibility that negative reconstructed values are obtained by Algorithm 2 (SA) and Algorithm 3 (hybrid) for the first a few iterations if different pseudo-random numbers are used. These negative reconstructed values, however, will turn positive and the behavior of reconstructed a by Algorithm 2 (SA) and Algorithm 3 (hybrid) is always more or less similar to the middle and bottom panels of Figure 8. For the initial guesses of and , Algorithm 3 (hybrid) works without any problem and Algorithm 2 (SA) also returns a reasonable result after a sufficiently large number of iterations (results not shown).
4. Discussion
In this paper, we have proposed a hybrid numerical scheme which uses Markov chain Monte Carlo in the first step and then uses an iterative method in the second step. We switch from MH-MCMC to LM by observing proposed parameter values. For the typical jump length of parameters in MH-MCMC, was used in Section 3.1 and was chosen in Section 3.2. Although these values were set so that the MH-MCMC calculation was efficiently performed, other choices of are also possible. The proposed scheme is quite general and can be applied to different inverse problems in NIRS which are solved by iterative methods even when the forward problem must be solved fully numerically with finite difference method or finite element method. It is an interesting future study how the hybrid scheme can be extended to diffuse optical tomography, which has many unknowns.
More sophisticated algorithms than the Metropolis–Hastings Markov chain Monte Carlo used in this paper have been proposed to overcome slow convergence. The delayed rejection scheme reduces the net rejection rate [39]. In the adaptive Metropolis algorithm, parameters in the proposal distribution are adjusted during Monte Carlo steps [40]. The DRAM algorithm, which combines the above-mentioned two schemes, was also proposed [41]. Two-level MCMC algorithms [42,43] and a multi-level MCMC [23] have been investigated to improve the MCMC algorithm. Such Monte Carlo schemes might improve the first step of our hybrid method by finding the valley of the global minimum more easily.
Related to the Metropolis–Hastings Markov chain Monte Carlo algorithm, quantum annealing [44] has been developed in addition to simulated annealing. Aiming at escaping from local minima, brute-force search and genetic algorithm [45] are also well-known optimization algorithms. The introduction of these methods in NIRS may be found useful in the future.
For the clinical use of NIRS, it has been recognized from early days that finding absolute values of the absorption and scattering coefficients is important [2]. In Ref. [15], it is emphasized that the obtained absolute values highly depend on the starting values of the initial estimate for the study of the infant brain with their measurement system. By performing Markov chain Monte Carlo before using standard iterative schemes, we may automatically acquire good initial values. Such clinical application is a natural next step of our research.
Author Contributions
Conceptualization, M.M. and G.N.; methodology, Y.J. and M.M.; software, Y.J. and M.M.; formal analysis, Y.J.; investigation, Y.H.; data curation, Y.J. and Y.H.; writing—original draft preparation, M.M.
Funding
The first author (Y.J.) is supported by National Natural Science Foundation of China (No. 11971121). Y.H. and M.M. acknowledge support from Grant-in-Aid for Scientific Research (17H02081) of the Japan Society for the Promotion of Science. M.M. also acknowledges support from Grant-in-Aid for Scientific Research (17K05572) of the Japan Society for the Promotion of Science and from the JSPS A3 foresight program: Modeling and Computation of Applied Inverse Problems. G.N. was supported by Grant-in-Aid for Scientific Research (15K21766 and 15H05740) of the Japan Society for the Promotion of Science.
Acknowledgments
The authors appreciate Goro Nishimura for fruitful discussion on optical tomography and the use of his computer facilities at Hokkaido University. We thank Tatsunori Emi, Takeshi Iwasaki, and Tomoya Sugiyama for helping related experiments which stimulated the present work.
Conflicts of Interest
The authors declare no conflict of interest. The funders had no role in the design of the study; in the collection, analyses, or interpretation of data; in the writing of the manuscript, or in the decision to publish the results.
References
- Boas, D.A.; Brooks, D.H.; Miller, E.L.; DiMarzio, C.A.; Kilmer, M.; Gaudette, R.J.; Zhang, Q. Imaging the body with diffuse optical tomography. IEEE Signal Process. Mag. 2001, 18, 57–75. [Google Scholar] [CrossRef]
- Hoshi, Y. Towards the next generation of near-infrared spectroscopy. Phil. Trans. R. Soc. A 2011, 369, 4425–4439. [Google Scholar] [CrossRef] [PubMed]
- Levenberg, K. A method for the solution of certain non-linear problems in least squares. Q. Appl. Math. 1944, 2, 164–168. [Google Scholar] [CrossRef]
- Marquardt, D.W. An algorithm for least-squares estimation of nonlinear parameters. SIAM J. Appl. Math. 1963, 11, 431–441. [Google Scholar] [CrossRef]
- Lange, F.; Tachtsidis, I. Clinical brain monitoring with time domain NIRS: A review and future perspectives. Appl. Sci. 2019, 9, 1612. [Google Scholar] [CrossRef]
- Chance, B.; Zhuang, Z.; Unah, C.; Alter, C.; Lipton, L. Cognition-activated low frequency modulation of light absorption in human brain. Proc. Natl. Acad. Sci. USA 1993, 90, 3770–3774. [Google Scholar] [CrossRef]
- Hoshi, Y.; Tamura, M. Detection of dynamic changes in cerebral oxygenation coupled to neuronal function during mental work in man. Neurosci. Lett. 1993, 150, 5–8. [Google Scholar] [CrossRef]
- Kato, T.; Kamei, A.; Takashima, S.; Ozaki, T. Human visual cortical function during photic stimulate on monitoring by means of near-infrared spectroscopy. J. Cereb. Blood Flow Metab. 1993, 13, 516–520. [Google Scholar] [CrossRef]
- Villringer, A.; Plank, J.; Hock, C.; Schleikofer, L.; Dirnagl, U. Near-infrared spectroscopy (NIRS): A new tool to study hemodynamic changes during activation of brain function in human adults. Neurosci. Lett. 1993, 154, 101–104. [Google Scholar] [CrossRef]
- Laidevant, A.; da Silva, A.; Berger, M.; Dinten, J.-M. Effects of the surface boundary on the determination of the optical properties of a turbid medium withtime-resolved reflectance. Appl. Opt. 2006, 45, 4756–4764. [Google Scholar] [CrossRef]
- Gibson, A.P.; Hebden, J.C.; Arridge, S.R. Recent advances in diffuse optical imaging. Phys. Med. Biol. 2005, 50, R1–R43. [Google Scholar] [CrossRef]
- Arridge, S.R. Methods in diffuse optical imaging. Philos. Trans. R. Soc. A 2011, 369, 4558–4576. [Google Scholar] [CrossRef]
- Arridge, S.R.; Schweiger, M. A gradient-based optimization scheme for optical tomography. Opt. Express 1998, 2, 213–226. [Google Scholar] [CrossRef]
- Choe, R.; Corlu, A.; Lee, K.; Durduran, T.; Konecky, S.D.; Grosicka-Koptyra, M.; Arridge, S.R.; Czerniecki, B.J.; Fraker, D.L.; DeMichele, A.; et al. Diffuse optical tomography of breast cancer during neoadjuvant chemotherapy: A case study with comparison to MRI. Med. Phys. 2005, 32, 1128–1139. [Google Scholar] [CrossRef]
- Hebden, J.C.; Gibson, A.; Austin, T.; Yusof, R.M.; Everdell, N.; Delpy, D.T.; Arridge, S.R.; Meek, J.H.; Wyatt, J.S. Imaging changes in blood volume and oxygenation in the newborn infant brain using three-dimensional optical tomography. Phys. Med. Biol. 2004, 49, 1117–1130. [Google Scholar] [CrossRef]
- Arridge, S.R.; Schweiger, M. Image reconstruction in optical tomography. Philos. Trans. R. Soc. Lond. B 1997, 352, 717–726. [Google Scholar] [CrossRef]
- Schweiger, M.; Arridge, S. The toast++ software suite for forward and inverse modeling in optical tomography. J. Biomed. Opt. 2014, 19, 040801. [Google Scholar] [CrossRef]
- Zhao, H.; Gao, F.; Tanikawa, Y.; Homma, K.; Yamada, Y. Time-resolved diffuse optical tomographic imaging for the provision of both anatomical and functional information about biological tissue. Appl. Opt. 2005, 44, 1905–1916. [Google Scholar] [CrossRef]
- Arridge, S.R. Optical tomography in medical imaging. Inverse Probl. 1999, 15, R41–R93. [Google Scholar] [CrossRef]
- Arridge, S.R.; Schotland, J.C. Optical tomography: Forward and inverse problems. Inverse Probl. 2009, 25, 123010. [Google Scholar] [CrossRef]
- Arridge, S.R.; Kaipio, J.P.; Kolehmainen, V.; Schweiger, M.; Somersalo, E.; Tarvainen, T.; Vauhkonen, M. Approximation errors and model reduction with an application in optical diffusion tomography. Inverse Probl. 2006, 22, 175–195. [Google Scholar] [CrossRef]
- Bal, G.; Langmore, I.; Marzouk, Y. Bayesian inverse problems with monte carlo forward models. Inverse Probl. Imaging 2013, 7, 81–105. [Google Scholar]
- Langmore, I.; Davis, A.B.; Bal, G. Multipixel retrieval of structural and optical parameters in a 2-d scene with a path-recycling monte carlo forward model and a new bayesian inference engine. IEEE Trans. Geosci. Remote Sens. 2013, 51, 2903–2919. [Google Scholar] [CrossRef]
- Bamett, A.H.; Culver, J.P.; Sorensen, A.G.; Dale, A.; Boas, D.A. Robust inference of baseline optical properties of the human head with three-dimensional segmentation from magnetic resonance imaging. Appl. Opt. 2003, 2003 42, 3095–3108. [Google Scholar]
- Groenhuis, R.A.J.; Ferwerda, H.A.; Ten Bosch, J.J. Scattering and absorption of turbid materials determined from reflection measurements. 1: Theory. Appl. Opt. 1983, 22, 2456–2462. [Google Scholar] [CrossRef]
- Egan, W.G.; Hilgeman, T.W. Optical Properties of Inhomogeneous Materials; Academic Press: New York, NY, USA, 1979. [Google Scholar]
- Carslaw, H.S.; Jaeger, J.C. Conduction of Heat in Solids; Oxford University Press: London, UK, 1959. [Google Scholar]
- Yosida, K.; Ito, S. Functional Analysis and Differential Equations; Iwanami: Tokyo, Japan, 1976. (In Japanese) [Google Scholar]
- Hielscher, A.H.; Jacques, S.L.; Wang, L.; Tittel, F.K. The influence of boundary conditions on the accuracy of diffusion theory in time-resolved reflectance spectroscopy of biological tissues. Phys. Med. Biol. 1995, 40, 1957–1975. [Google Scholar] [CrossRef]
- Machida, M.; Nakamura, G. Born series for the photon diffusion equation perturbing the Robin boundary condition. arXiv 2017, arXiv:1706.04500. [Google Scholar]
- Ishimaru, A. Wave Propagation and Scattering in Random Media; Academic Press: New York, NY, USA, 1978. [Google Scholar]
- Fletcher, R. A Modified Marquardt Subroutine for Nonlinear Least Squares (Report AERE-R 6799); The Atomic Energy Research Establishment: Harwell, UK, 1971. [Google Scholar]
- Kaipio, J.; Somersalo, E. Statistical and Computational Inverse Problems; Springer: New York, NY, USA, 2005. [Google Scholar]
- Nakamura, G.; Potthast, R. Inverse Modeling; IOP Publishing: Bristol, UK, 2015. [Google Scholar]
- Iglesias, M.A.; Lin, K.; Stuart, A.M. Well-posed bayesian geometric inverse problems arising in subsurface flow. Inverse Probl. 2014, 30, 114001. [Google Scholar] [CrossRef]
- Kirkpatrick, S.; Gelatt, C.D., Jr.; Vecchi, M.P. Optimization by simulated annealing. Science 1983, 220, 671–680. [Google Scholar] [CrossRef]
- Gelman, A.; Rubin, D.B. Inference from iterative simulation using multiple sequences. Stat. Sci. 1992, 1992 7, 457–472. [Google Scholar] [CrossRef]
- Martinez, W.L.; Martinez, A.R. Computational Statistics Handbook with MATLAB; Chapman and Hall/CRC: London, UK, 2015. [Google Scholar]
- Tierney, L. Markov chains for exploring posterior distributions. Ann. Stat. 1994, 22, 1701–1762. [Google Scholar] [CrossRef]
- Haario, H.; Saksman, E.; Tamminen, J. An adaptive metropolis algorithm. Bernoulli 2001, 7, 223–242. [Google Scholar] [CrossRef]
- Haario, H.; Laine, M.; Mira, A.; Saksman, E. Dram: Efficient adaptive mcmc. Stat. Comput. 2006, 16, 339–354. [Google Scholar] [CrossRef]
- Christen, J.A.; Fox, C. Markov chain monte carlo using an approximation. J. Comput. Graph. Stat. 2005, 14, 795–810. [Google Scholar] [CrossRef]
- Efendiev, Y.; Hou, T.; Luo, W. Preconditioning markov chain monte carlo simulations using coarse-scale models. SIAM J. Sci. Comput. 2006, 28, 776–803. [Google Scholar] [CrossRef]
- Kadowaki, T.; Nishimori, H. Quantum annealing in the transverse ising model. Phys. Rev. E 1998, 58, 5355–5363. [Google Scholar] [CrossRef]
- Holland, J.H. Adaptation in Natural and Artificial Systems: An Introductory Analysis with Applications to Biology, Control and Artificial Intelligence; University of Michigan Press: Ann Arbor, MI, USA, 1975. [Google Scholar]
© 2019 by the authors. Licensee MDPI, Basel, Switzerland. This article is an open access article distributed under the terms and conditions of the Creative Commons Attribution (CC BY) license (http://creativecommons.org/licenses/by/4.0/).