Article

Well-Distributed Feature Extraction for Image Registration Using Histogram Matching

by
Muhammad Tariq Mahmood
1 and
Ik Hyun Lee
2,*
1
School of Computer Science and Engineering, Korea University of Technology and Education, 1600 Chungjeolno, Byeogchunmyun, Cheonan 31253, Korea
2
Department of Mechatronics, Korea Polytechnic University, 237 Sangidaehak-ro, Siheung-si, Gyeonggi-do 15073, Korea
*
Author to whom correspondence should be addressed.
Appl. Sci. 2019, 9(17), 3487; https://doi.org/10.3390/app9173487
Submission received: 15 July 2019 / Revised: 7 August 2019 / Accepted: 20 August 2019 / Published: 23 August 2019
(This article belongs to the Section Earth Sciences)

Abstract

:
Image registration is a spatial alignment of corresponding images of the same scene acquired from different views, sensors, and time intervals. Especially, satellite image registration is a challenging task due to the high resolution of images. In addition, demands for high resolution satellite imagery are increased for more detailed and precise information in land planning, urban planning, and Earth observation. Commonly, feature-based methods are applied for image registration. In these methods, first control or key points are detected using feature detector such as scale-invariant feature transform (SIFT). The numbers and the distribution of these control points are important for the remaining steps of registration. These methods provide reasonable performance; however, they suffer from high computational cost and irregular distribution of control points. To overcome these limitations, we propose an area-based registration method using histogram matching and zero mean normalized cross-correlation (ZNCC). In multi-spectral satellite images, first, different spectral responses are adjusted by using histogram matching. Then, ZNCC is utilized to extract well-distributed control points. In addition, fast Fourier transform (FFT) and block-wise processing are applied to reduce the computational cost. The proposed method is evaluated through various input datasets. The results demonstrate its efficacy and accuracy in image registration.

1. Introduction

Demands for high resolution satellite imagery are increasing day by day for more detailed and precise information in land planning, urban planning, and Earth observation. In these applications, satellite image registration is an important pre-processing step. It is a spatial alignment of the same scene acquired from different views and sensors (panchromatic and multi-spectral images), and time intervals. In particular, satellite image registration is a challenging task due to the very-high-resolution (VHR). High-resolution images may occupy over a hundred megabytes with several spectral bands or gigapixels with hyper-spectral bands. Therefore, processing these images with large sizes is difficult due to the limited resources and memory [1,2,3].
In the literature, various methods and techniques have been proposed for satellite image registration [1,4,5,6,7]. In general, the registration methods can be divided into two main groups: area-based and feature-based methods. Area-based methods compare the pixel intensities of the overlapping regions in images by using a similarity measure such as square sum of difference (SSD), mutual information (MI) and/or normalized cross-correlation (NCC) [1,8]. In these methods, similarity measure plays an important role and the accuracy of the method depends on the selection of an appropriate similarity measure. Usually, these methods provide well-distributed control points; however, these methods suffer from high computational time due to huge numbers of multiplications and divisions. On the other hand, feature-based methods are based on features (points, lines, intersections, etc.) instead of pixel intensities, from the corresponding regions of one or more images [4]. The accuracy of feature-based methods mainly depends on two factors: detected numbers of key-points and the distribution of these key-points over the image. Particularly, a well-distributed set of key-points provide higher accuracy as compared to a set of too clustered points [9,10]. These method are fast; however, their accuracy depends on the correct matches of features.
In feature-based satellite image registration, scale-invariant feature transform (SIFT) [11,12] based methods are widely used [13,14]. A study of performance of local descriptors has revealed that the SIFT provides the best performance [15]. Similar to the other methods, SIFT based methods also suffer from high computational cost and uneven distribution of control points. To reduce the complexity, few attempts have been made by reducing the feature space or minimizing the computations for estimating kernels. Ke and Sukthankar [16] suggested the use of principal component analysis (PCA) to reduce the size of the feature space. Bay et al. [17] suggested another approach, namely speeded up robust features (SURF), which allows fast computation via integral images for extracting control points. These approaches are able to reduce the processing time by compromising on accuracy as these approaches provide less accurate results as compared to the original SIFT based methods [15,18].
The number of control points for the reference and the sensed images also affects the registration accuracy. In different studies [5,19], the effect of numbers of control points has been analyzed in terms of the registration accuracy. These studies conclude that a larger number of control points with well-balanced and even distribution provides better registration accuracy. In the case of SIFT based methods, SIFT usually detects larger control points, however, their distribution quality is not enough for accurate registration. Especially, extracted points near the edges are too clustered and in low contrast and smooth areas are too scattered. To overcome this problem, control points from feature-based and area based methods are combined [1,20]. However, these methods suffer from non-linear similarity among the multi-spectral responses. Therefore, these approaches are not well-suited for high resolution multi-spectral satellite image registration.
To overcome these limitations with feature-based and area-based methods, we propose a registration method using histogram matching and zero mean normalized cross-correlation (ZNCC). In area-based methods, usually one control point is extracted by comparing two patches from the reference and the sensed images. We suggest multi-template matching to extract a larger numbers of control points. In multi-spectral satellite images, first, different spectral responses are adjusted by using histogram matching. Then, ZNCC is utilized to extract well-distributed control points. In addition, fast Fourier transform (FFT) and block-wise processing are applied to reduce the computational cost. The proposed method is evaluated through various input images. The results demonstrate its efficacy and accuracy in image registration. In the remainder of this paper, Section 2 discusses the datasets used in the experiments, and the proposed method is explained in Section 3. Then, Section 4 presents the experimental results and comparative analysis. Finally, Section 5 concludes this study.

2. Datasets

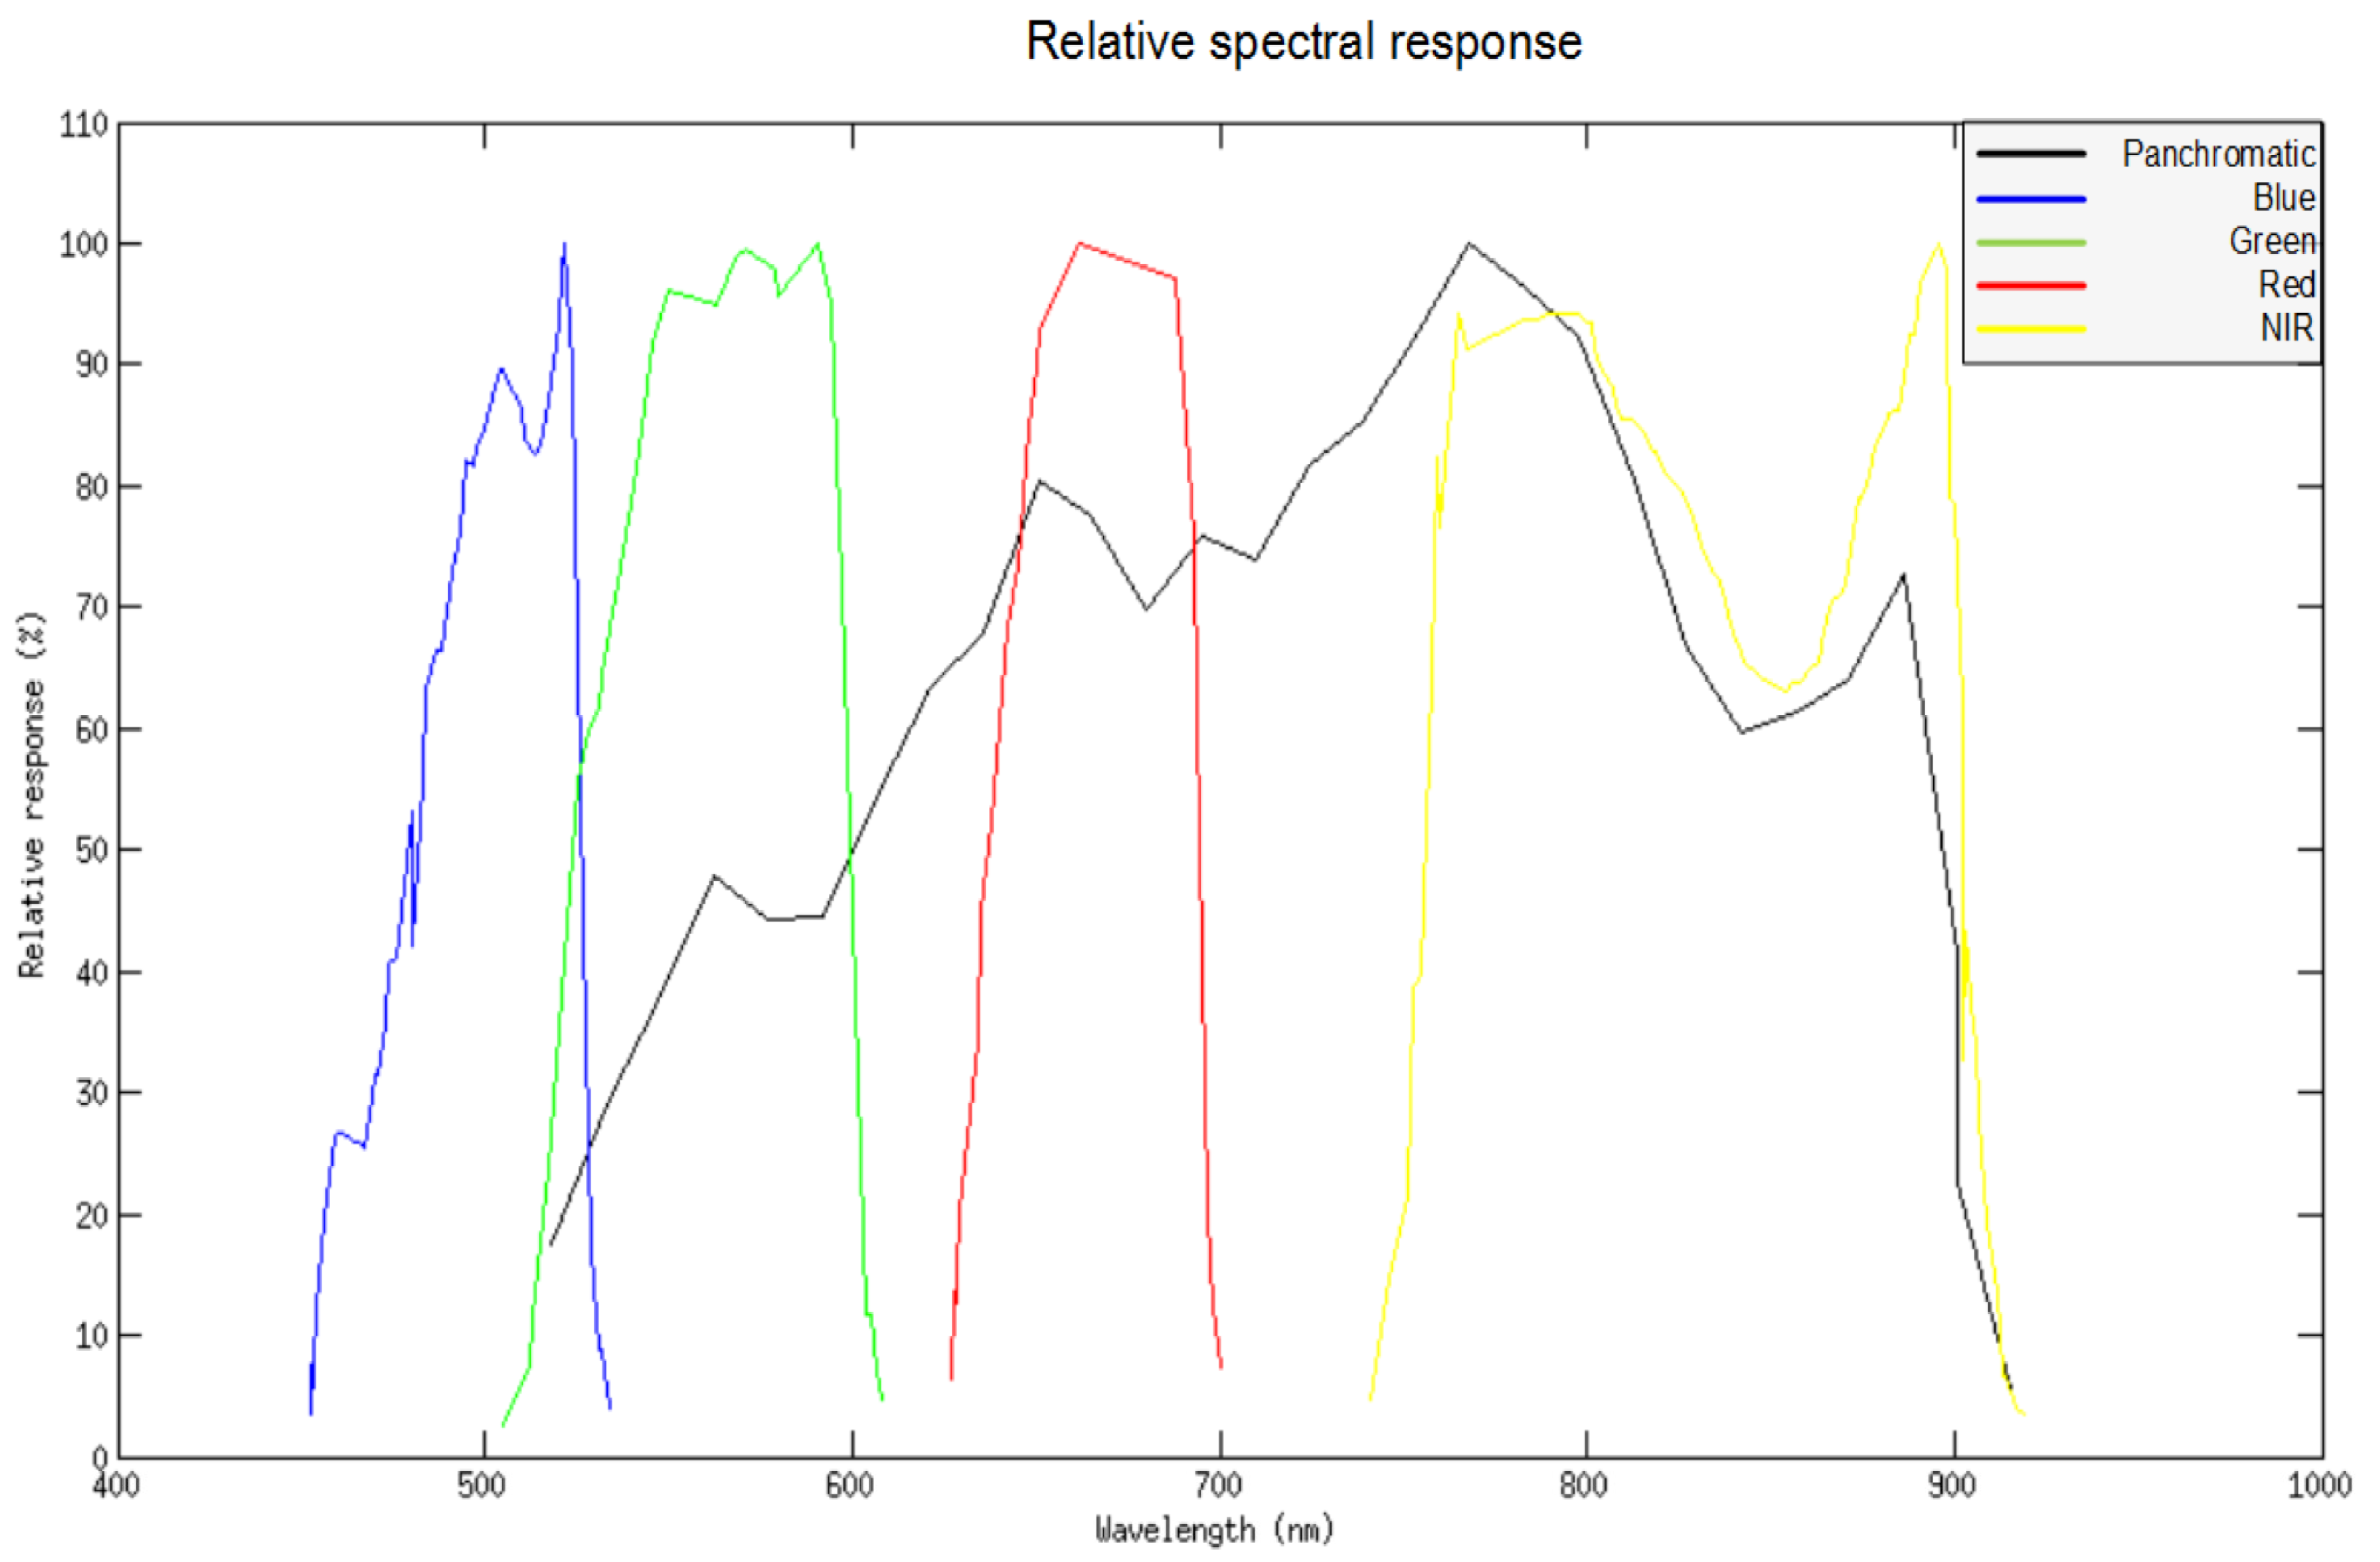
In this work, four different datasets of multi-spectral satellite images are used for experiments and comparative analysis. A multi-spectral satellite image consists of a panchromatic and several spectral bands images. In each dataset, the size of panchromatic image is 15000 × 16000 , while multi-spectral images are of size 4000 × 4000 . The multi-spectral images contain four bands: blue, green, red, and NIR. The spatial resolution of the panchromatic image is 1 m and the multispectral image is 4 m. Geometric distortion is included in all images. The sample images are shown in Figure 1. The responses in terms of wavelengths for panchromatic and spectral band images are shown in Figure 2. The shortest band is the visible band, ranging from 0.4 μ m to 0.7 μ m , called red-green-blue (RGB) region. The infrared band with wavelength from 0.7 μ m to 10 μ m is classified as near infrared (NIR).

3. Method

In the proposed method, we combine the properties of both feature-based and area-based methods. The area-based methods use image similarity between overlapped areas between the reference and the sensed images. Template matching is one of the area-based method. Usually, one template matched image provides one control point between the template and the target images. To increase the numbers of control points, we use multi-template matching approach. The main steps in the proposed method are shown in Figure 3. First, the input images (the reference and the sensed images) undergo a thorough contrast adjustment process based on global and local histograms matching. In the next step, area based features are extracted by using zero mean normalized cross correlation (ZNCC) and fast Fourier transform (FFT). Once sufficient and well-distributed control points are extracted and matched, the remaining steps for registration such as transformation estimation and re-sampling are done. The detailed description of each step is given in subsequent sections.

3.1. Contrast Adjustment Using Histogram Matching

Let R ( x , y ) be the panchromatic image (reference image) and Z ( x , y ) be the multi-spectral (sensed) image. Due to the different spectral responses in Figure 2 for different band images, the image contrast varies. The proposed method falls into the area-based methods where image similarity between reference and sensed images is compared. Therefore, it is important to adjust the contrast between different images. In the proposed method, we use the global and the local histogram matching for contrast adjustment.
In global Histogram Matching, histogram of panchromatic image R ( x , y ) is specified by the histogram of the multi-spectral image Z ( x , y ) . Let p r ( r ) and p z ( z ) be the histograms of panchromatic image R ( x , y ) and multi-spectral image Z ( x , y ) , respectively, and r denote the intensities of an image with range [ 0 , L 1 ] . The intensity level s in panchromatic image R ( x , y ) can be expressed as
T ( r ) = ( L 1 ) 0 r p r ( w ) d w , 0 r L 1 .
The transformation function H ( z ) is obtained by using the specified histogram p z ( z ) as
H ( z ) = ( L 1 ) 0 z p z ( w ) d w = s .
By equating Equations (1) and (2), i.e., setting H ( z ) = T ( r ) , the inverse transformation for z is obtained as follows:
z = H 1 ( s ) = H 1 T ( r ) .
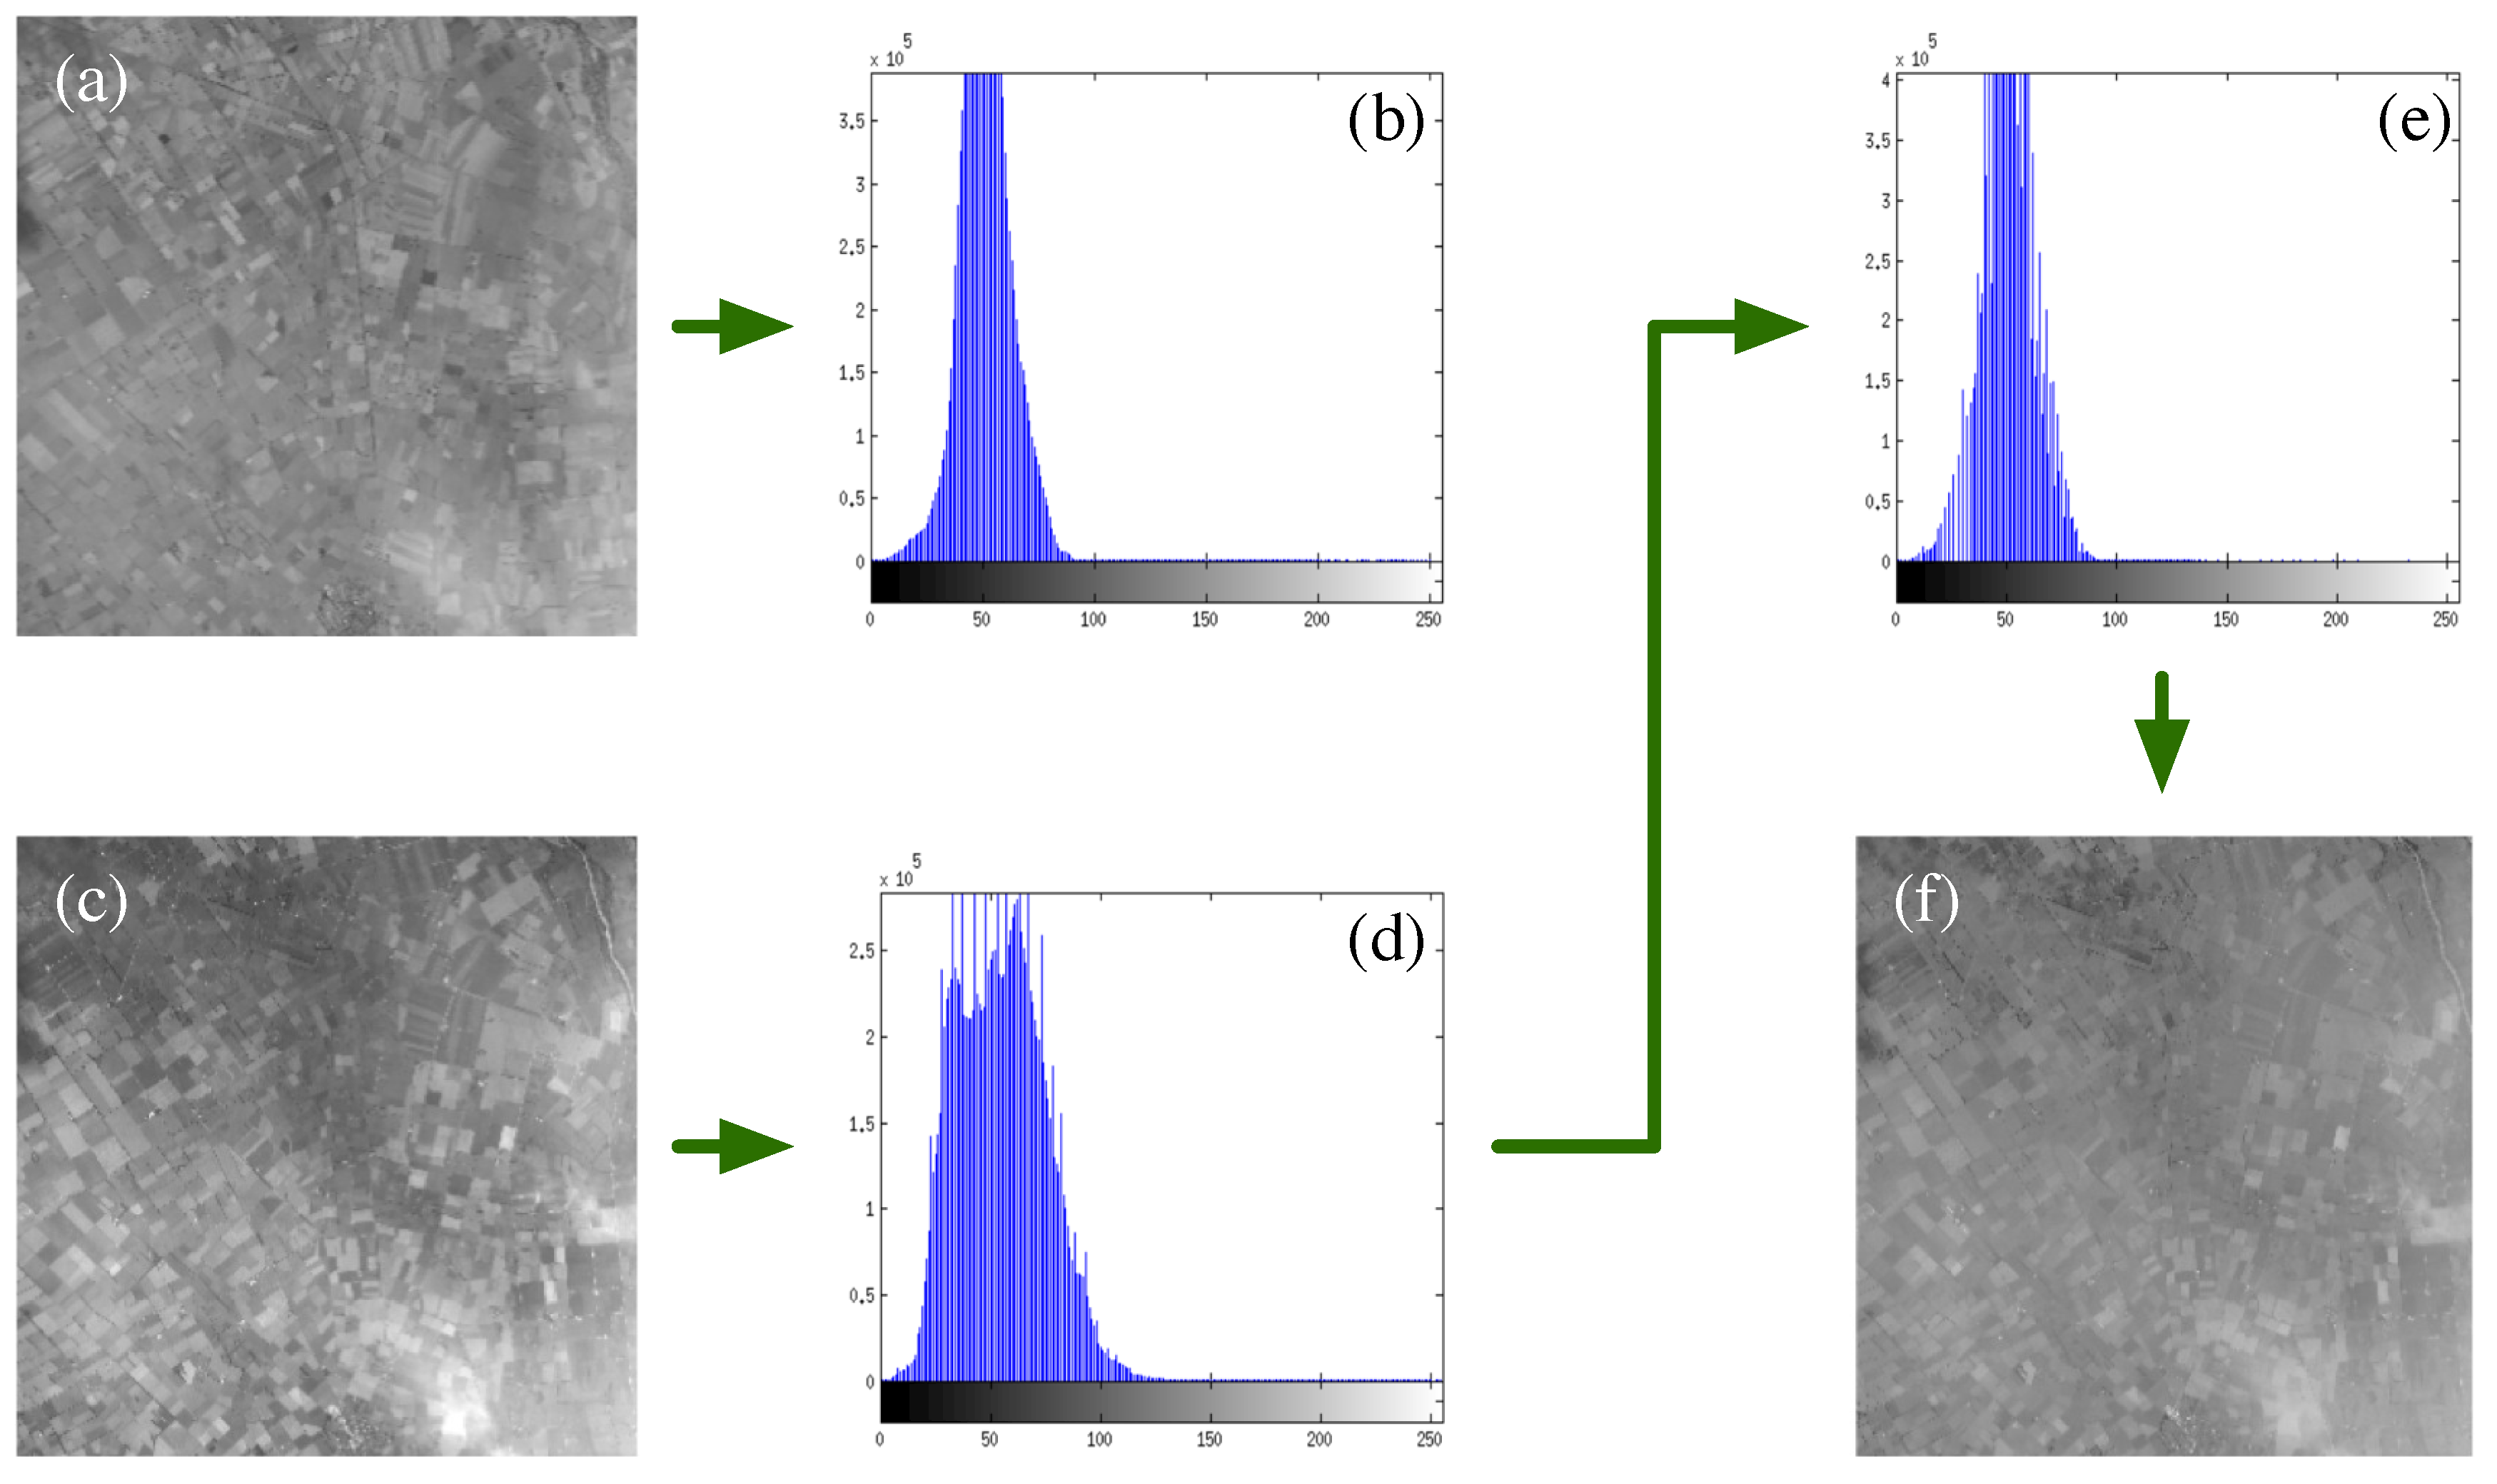
Thus, z is obtained from s, which is a mapping process from s to z. Figure 4 represents the global histogram matching process. We can observe that, after applying histogram specification, the reference and sensed images have similar histograms. The global histogram matching adjusts the pixel intensities of the reference and the sensed images coarsely. To adjust the fine image details, the local histogram matching is applied, In local histogram matching, first reference and sensed images R ( x , y ) and Z ( x , y ) are divided into image blocks of sizes M × N . The blocks can be represented as
R i j ( x , y ) = ( i , j ) | i x M 2 j y N 2 Z i j ( x , y ) = ( i , j ) | i x M 2 j y N 2
where i and j are the indices for the pixels inside a block, while M and N determine the block dimensions. The kth blocks in the sets of blocks for the reference and the sensed images, respectively, in the lexicographical order, can be represented as follows:
R 1 x , y , , R k x , y , , R K x , y Z 1 x , y , , Z k x , y , , Z K x , y
where X and Y is the size of input image sizes and K is the total numbers of blocks
K = X M × Y N
Once input images are divided into blocks, then block-wise histogram matching is performed. The histogram of each block in the sensed is specified by the histogram of the corresponding block in the reference image.
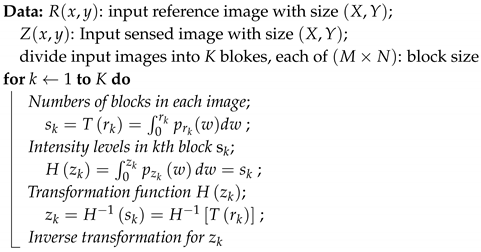
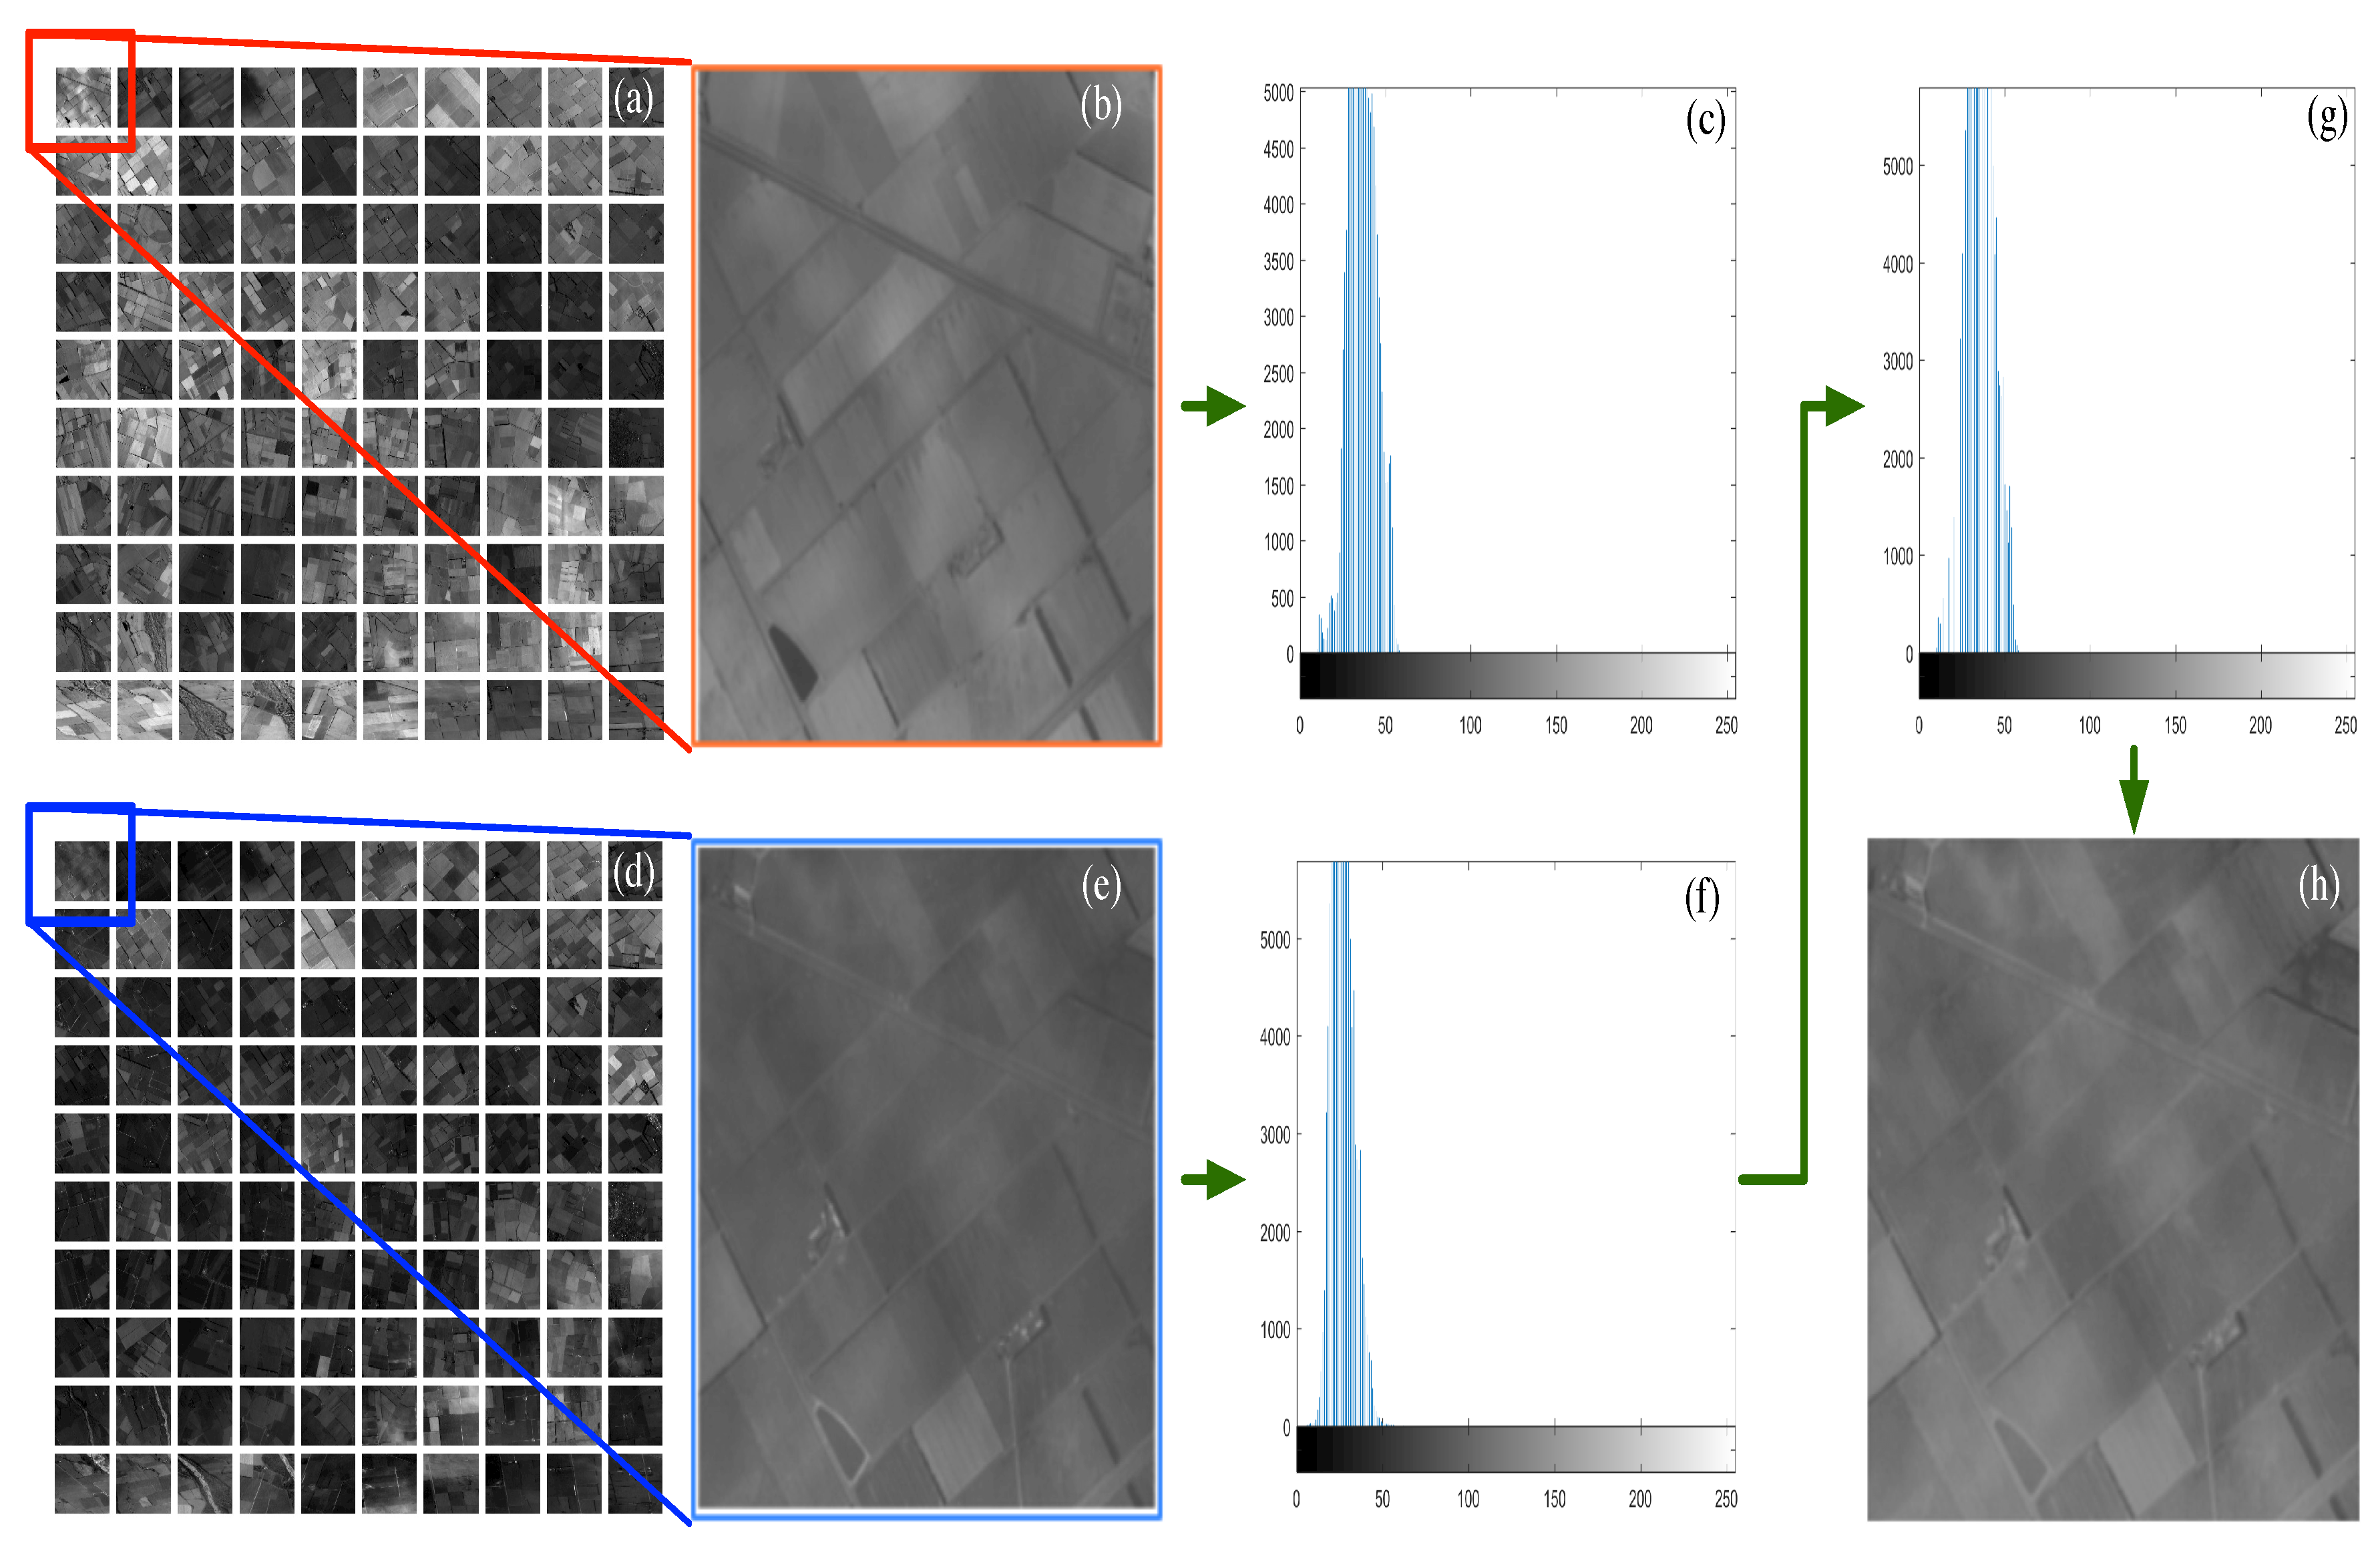
Algorithm 1 shows the flow of local histogram matching. The procedure is same as done in the case of global histogram matching; however, here, histograms of blocks (Figure 5a,d: the block-wise reference and sensed image) are matched instead of histograms of entire images (Figure 4a,c).
Algorithm 1: Local histogram matching.
Applsci 09 03487 i001

3.2. Feature Extraction

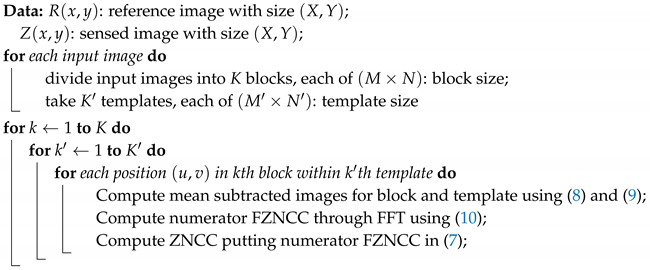
In the proposed method, a hybrid approach for feature extraction is suggested that utilizes the concepts from both feature-based and area-based methods. We use mean normalized cross-correlation (ZNCC) [21] measure to find the well-distributed control points. ZNCC is a robust measure against brightness variations due to the effect of the subtraction of the local mean. Basically, an input image is divided into blocks and a template for each block is matched through ZNCC measure. The ZNCC measures are considered as features. We can get a larger numbers of features for each block with even and better distribution by matching multiple templates for one block. In this way, we can overcome the problem with feature-based and area-based methods. Feature-based methods may provide larger numbers of control points; however, these control points may not be well-distributed. They may be dense on edges and sparse in smooth and low contrast areas. On the other hand, the performance of area-based methods is degraded due to the similar spectral ranges. The steps for feature extraction are illustrated in Algorithm 2 and its graphical representation is shown in Figure 6.
Algorithm 2: Feature extraction.
Applsci 09 03487 i002
The features are extracted from both input images, i.e., the reference image R ( x , y ) and the sensed image Z ( x , y ) , using Algorithm 2. Let an input image R ( x , y ) be divided into K blocks each of size M × N . For each kth block, K template images ( K smaller blocks), each of size M × N from the kth block of R ( x , y ) image, are obtained. In other words, each block is divided into K = M M × N N smaller blocks (templates). Let R k k be the k th template in the lexicographical order; then, the template is moved over the block and the similarity is computed for each location. The template is shifted u discrete steps in the x direction and v discrete steps in the y direction. For each block and at each position ( u , v ) inside the block, the ZNCC measure is computed as,
Z N C C k u , v = x , y R k ( x , y ) R ¯ k R k k ( x u , y v ) R ¯ k k x , y R k ( x , y ) R ¯ k 2 R k k ( x u , y v ) R ¯ k k 2 ,
where R ¯ k is the mean of the overlapped with template in the kth block R k ( x , y ) , R ¯ k k is the mean of the k th template. Higher value of the ZNCC measure indicates better match. The main drawback of ZNCC is their high computational cost. To overcome high computational complexity, the computation of ZNCC is accelerated by using fast Fourier transform (FFT). The ZNCC of two images using FFT is much faster than computing their spatial correlation. The mean subtracted images of the template T e m and target image T a r can be written as,
T e m k k ( x , y ) = R k k ( x , y ) R ¯ k k .
T a r k ( x u , y v ) = R k k ( x u , y v ) R ¯ k k .
The numerator of Equation (7) can be written as
Z N C C k k u , v n u m = u , v T e m k k ( x , y ) T a r i j k ( x u , y v ) .
The numerator of Equation (7) in FFT can be written as
F Z N C C k k u , v n u m = F 1 F T e m k k ( x , y ) F * T a r k ( x u , y v ,
where F is the Fourier transform (FT) and F * is its complex conjugate.
To compute the spatial correlation with image size X × X and template size N × M , M 2 ( X M + 1 ) 2 additions and M 2 ( X M + 1 ) 2 multiplications are required, approximately, whereas the complexity of the FFT-based FZNCC measure consists of 3 M 2 l o g 2 M real multiplications and 3 M 2 l o g 2 M real additions [21,22]. If X is much lager than M, then the complexity of spatial correlation approaches O ( X 2 M 2 ) , while transform-based method has complexity O ( M 2 l o g 2 M ) . Thus, the FZNCC is more efficient than ZNCC. As the the ZNCC provides integers values for control points, a further step is required to find sub-pixel accuracy. We assume that the template size image M × N contains odd numbers For example, if the template image has size 20 × 20 , the position of the candidate control point will be ( 10 , 10 ) , which is the center point of the image size. However, if the template image has size 25 × 25 , the position of the candidate control points will be ( 12.5 , 12.5 ) , which are floating point numbers.

3.3. Feature Matching, Transformation, and Re-Sampling

After extracting features with good distribution, the next steps in image registration are finding correspondence between features from the reference and the sensed images, transforming the model and re-sampling. In our method, we use Euclidian distance to match the features. To find the transformation model, the B-Spline based method proposed by Rueckert et al. [23] is used. B-splines are locally controlled, less dependent on image texture and more robust to noise. Finally, the transformed image is re-sampled. The size of neighborhood and the choice of interpolation method may affect the resultant image. Among the various methods, we apply bi-cubic interpolation [24] by using 4 × 4 neighborhood pixels. The bi-cubic interpolation is computationally more expensive; however, it provides better results than nearest neighbor and bi-linear based interpolation methods.

4. Results

The performance of the proposed method was measured qualitatively and quantitatively.

4.1. Quantitative Analysis

The numbers of correct corresponding control points affect the accuracy of the image registration. In our experiments, the numbers of correct control points were measured through the control point ratio (CPR). It is calculated by using the ratio between the initial numbers of control points and the number of refined control points.
CPR = numbers of refined CPs number of initial CPs .
The CPR measure provides values in the range [0, 1], and higher values indicate better distributions of the features. The second quantitative measure, root mean square error (RMSE), was used to evaluate the accuracy of the proposed method. RMSE is defined as
R M S E = 1 n i = 1 n C i - C ^ i 2 ,
where C i are control points in the reference image, while C ^ i are the estimated control points at the transformation model. The smaller value indicates better accuracy.
Table 1 shows the number of initial CPs, corresponding CPs and refined CPs for different feature-based and area-based methods. The refined CPs were obtained using random sample consensus (RANSAC) [2]. In the table, it is clear that feature-based methods (SIFT and SURF) extracted more features than area-based methods (SSD, NCC, and FZNCC). However, feature-based methods provided fewer refined CPs than the area-based methods. It means that the features extracted through the feature based methods are not well-distributed. It can also be observed that the proposed method (FZNCC) provided the most refined control points among the area-based methods. Thus, the proposed method is more effective and is likely to provide better accuracy.
Table 2 shows the comparison of the CPR measure of the previous methods and the proposed FZNCC method. Conventional feature-based methods (SIFT and SURF) provided the lowest CPR values in the comparison. On the contrary, area-based methods (SSD, NCC, and FZNCC) provided better distributions. The proposed method had certain advantages in getting additional control points with better distribution. Consequently, better image registration accuracy was achieved.
Table 3 shows the RMSE values computed for different methods for accuracy comparison. It is clear that conventional area-based methods extracted more refined CPs than feature-based methods. However, the RMSE values for SSD and NCC are higher than SIFT and SURF. It indicates that SSD and NCC provided less accurate results than SIFT and SURF. However, the proposed method provided the best RMSE values among all area-based and feature-based methods.

4.2. Qualitative Analysis

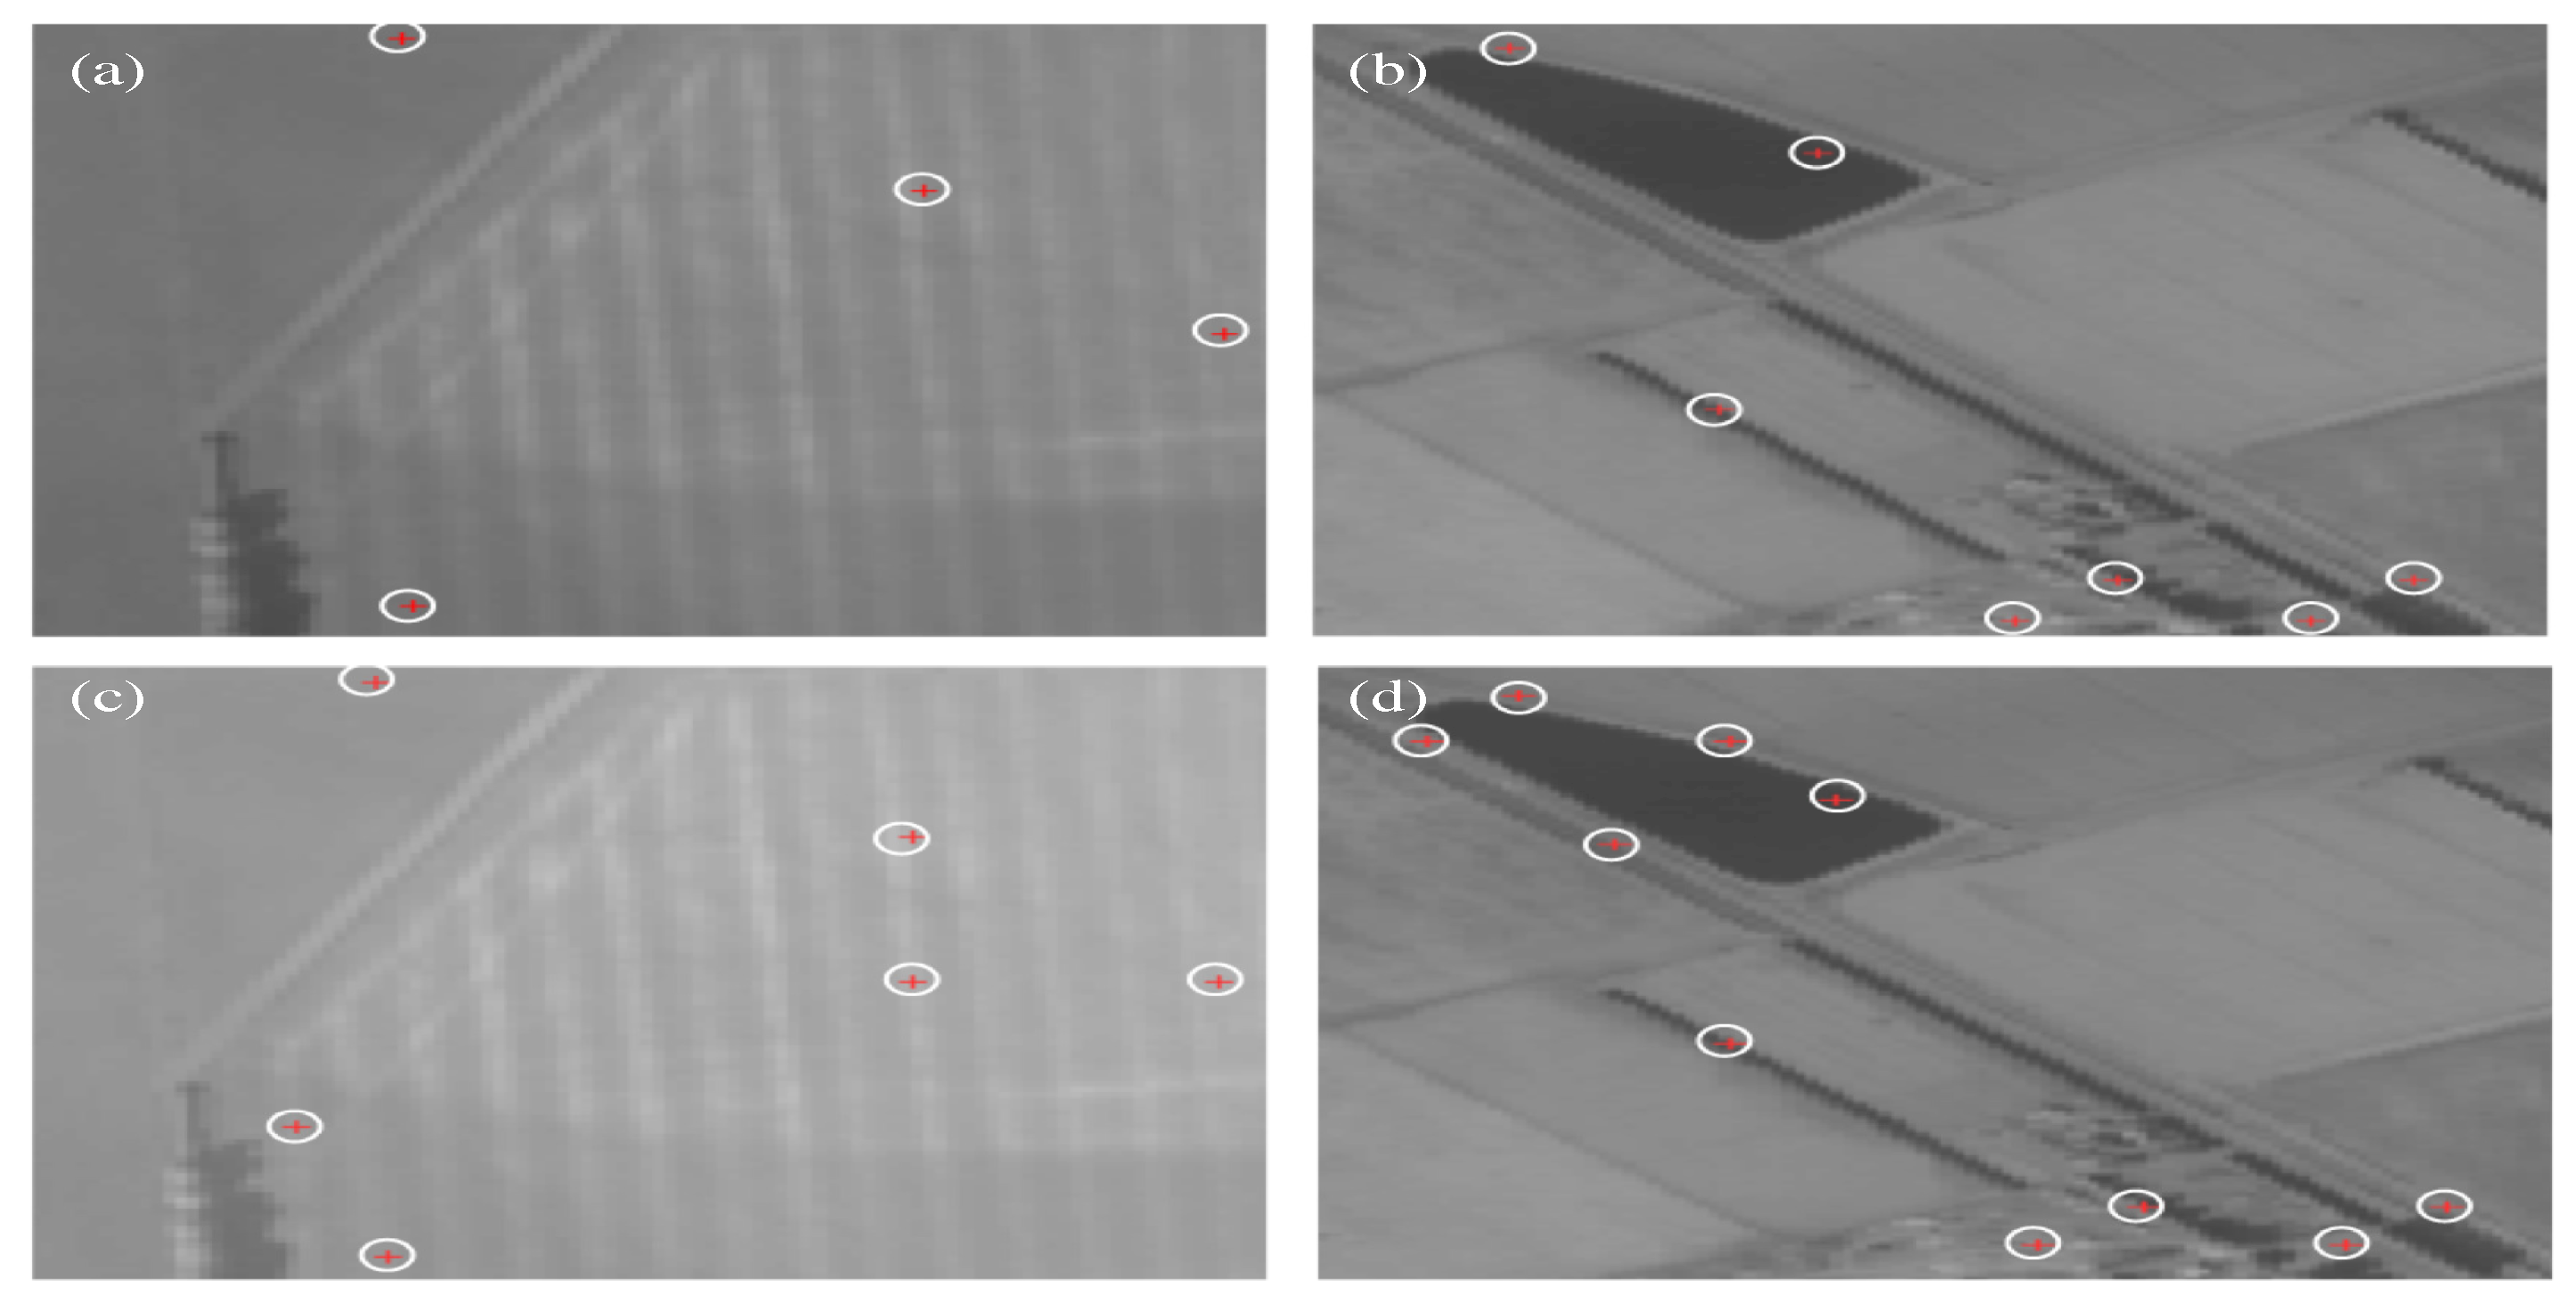
Figure 7 shows the effect of using histogram matching before template matching on the numbers of control points (CPs). It can be observed that the use of histogram matching increased the number of CPs. The control points shown in the second row are well-distributed as compared to the CPs shown in the first row. Thus, the proposed histogram based method provided more distinctive CPs as compared to the non-histogram based methods.
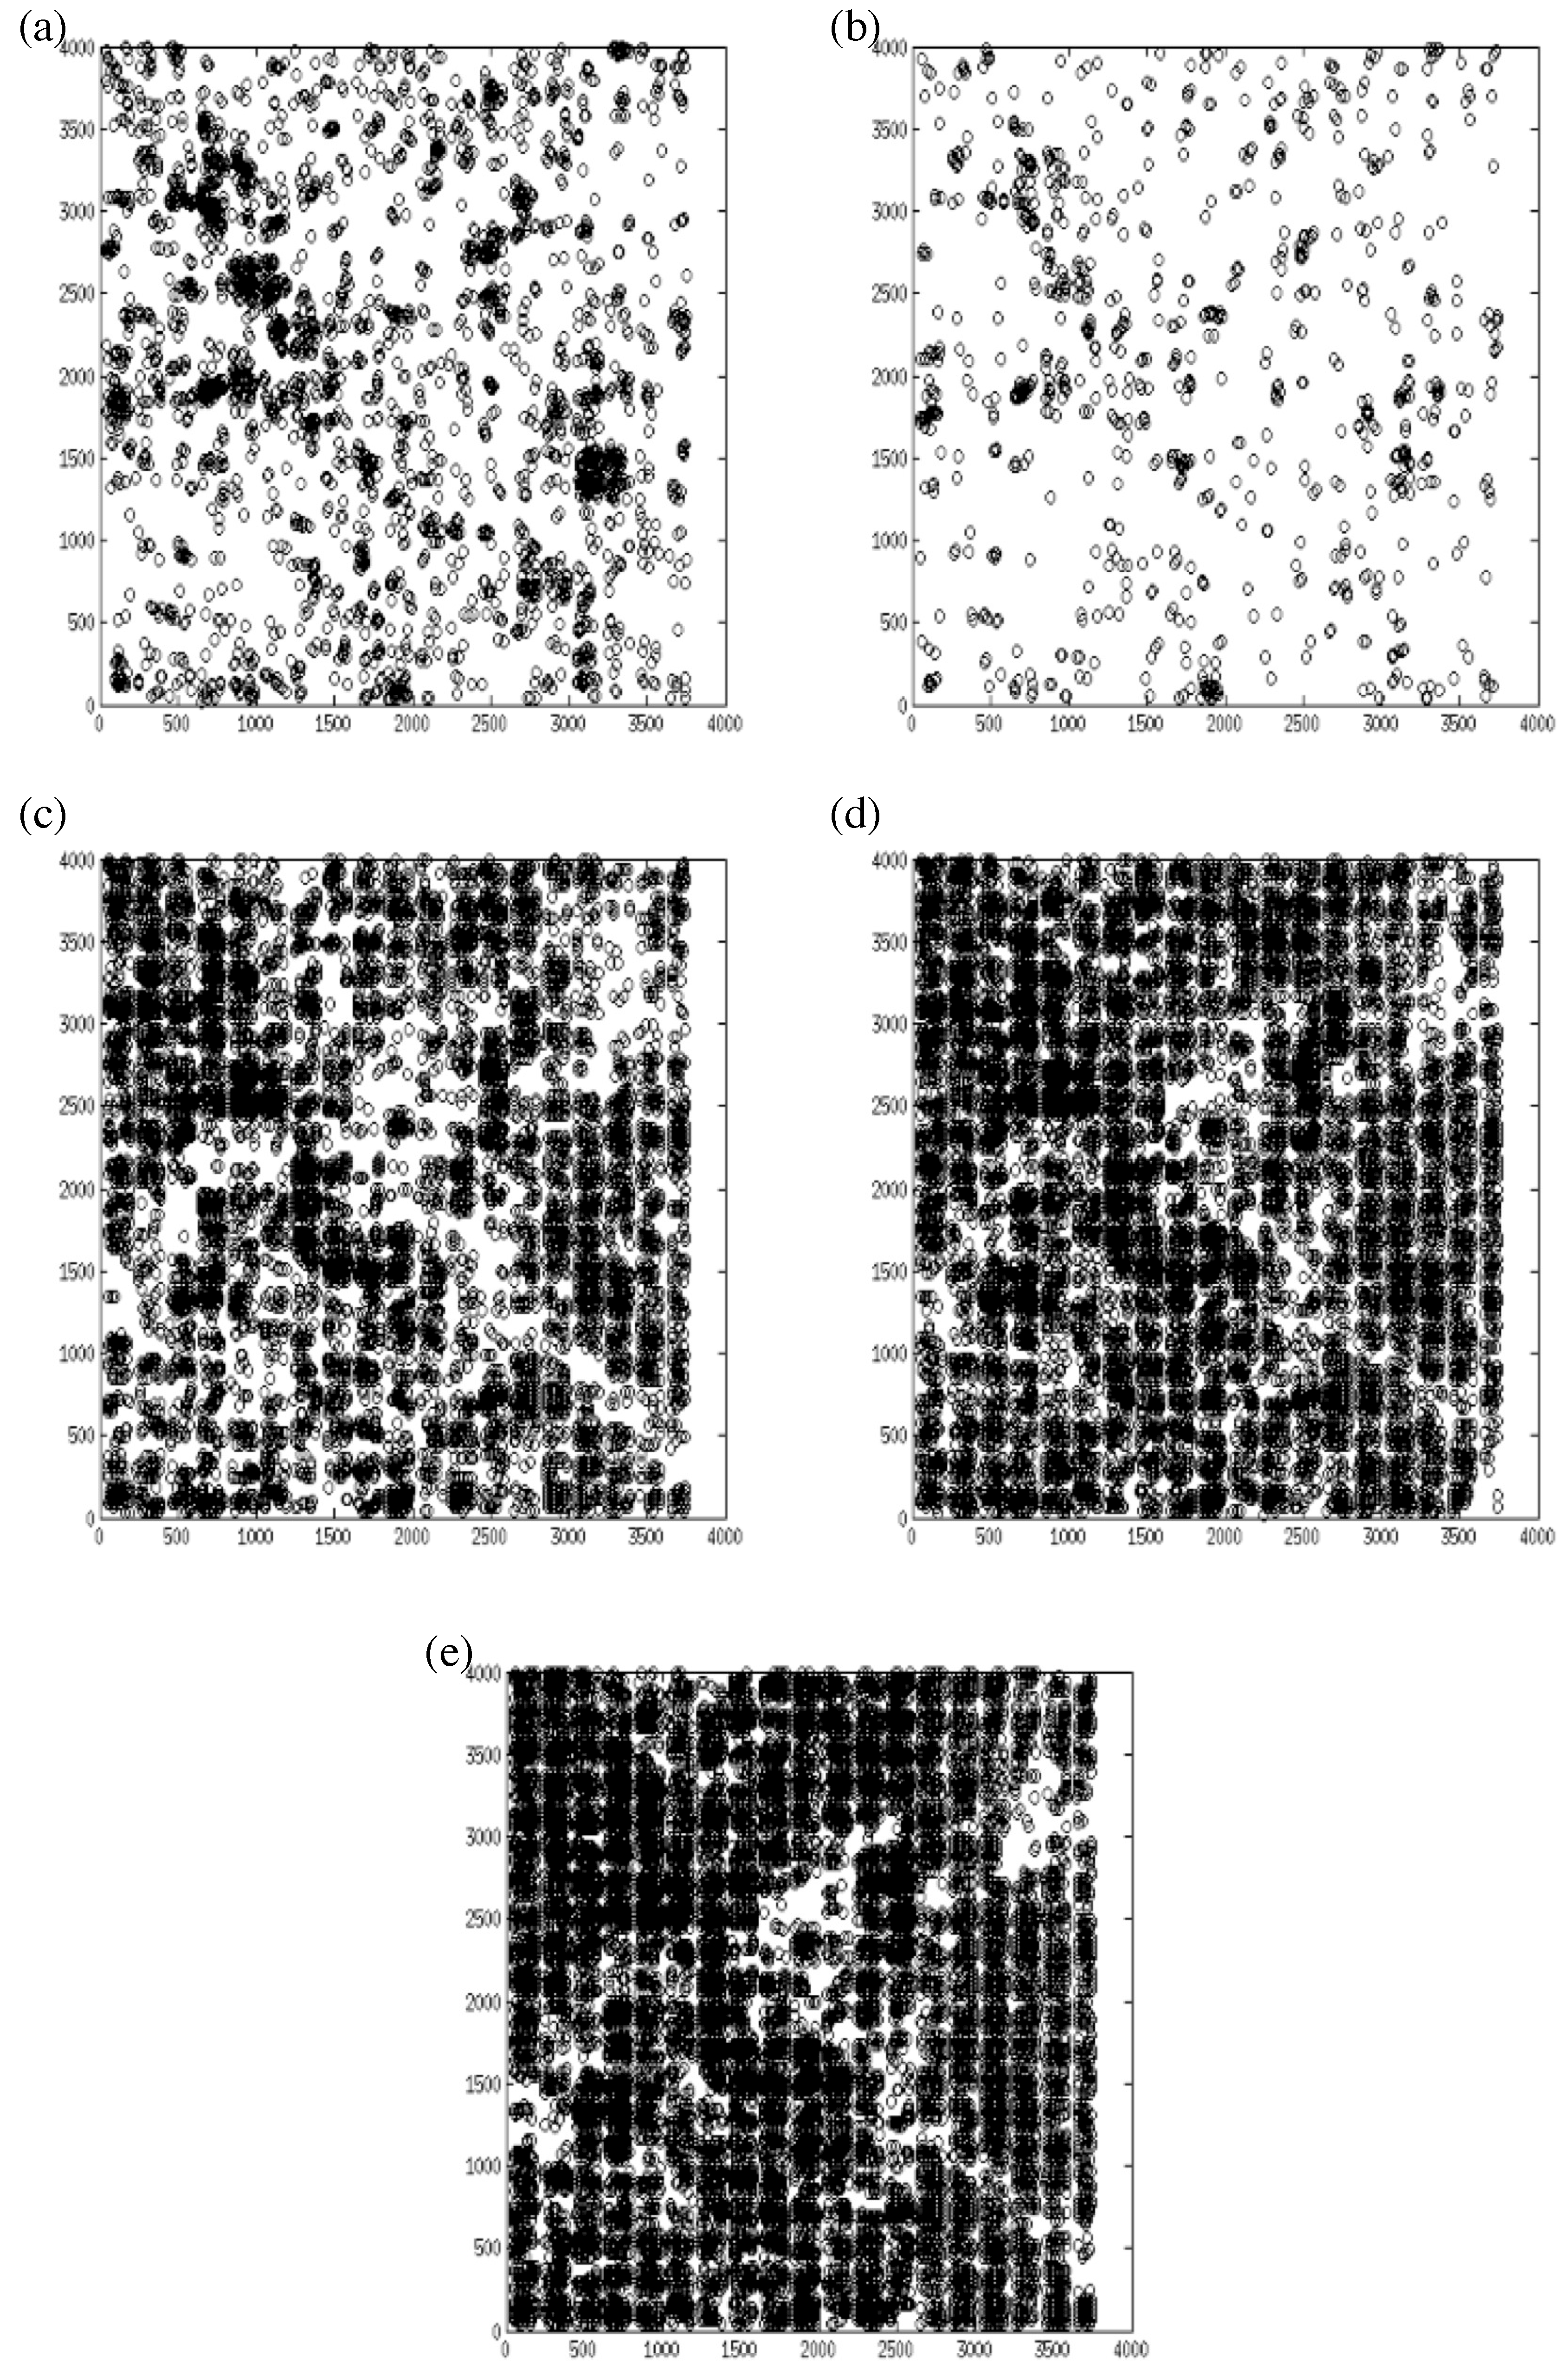
The CPs distribution quality [10,25] is an important factor for registration accuracy. Figure 8 highlights the distribution of correct CPs for different feature-based and area-based methods for Dataset 3. For a clear visualization, we used 1 / 10 of sampled CPs. In the figure, extracted and refined CPs using feature-based methods SIFT and SURF are limited and not well-distributed in low contrast area, whereas area based methods SSD, NCC and FZNCC provided more CPs with better distribution. Among the area-based methods, it is clear in Figure 8e that the proposed method provided more distinctive and well-distributed control points. It shows the superiority of the proposed method over the others in terms of number of CPs with their better distribution.
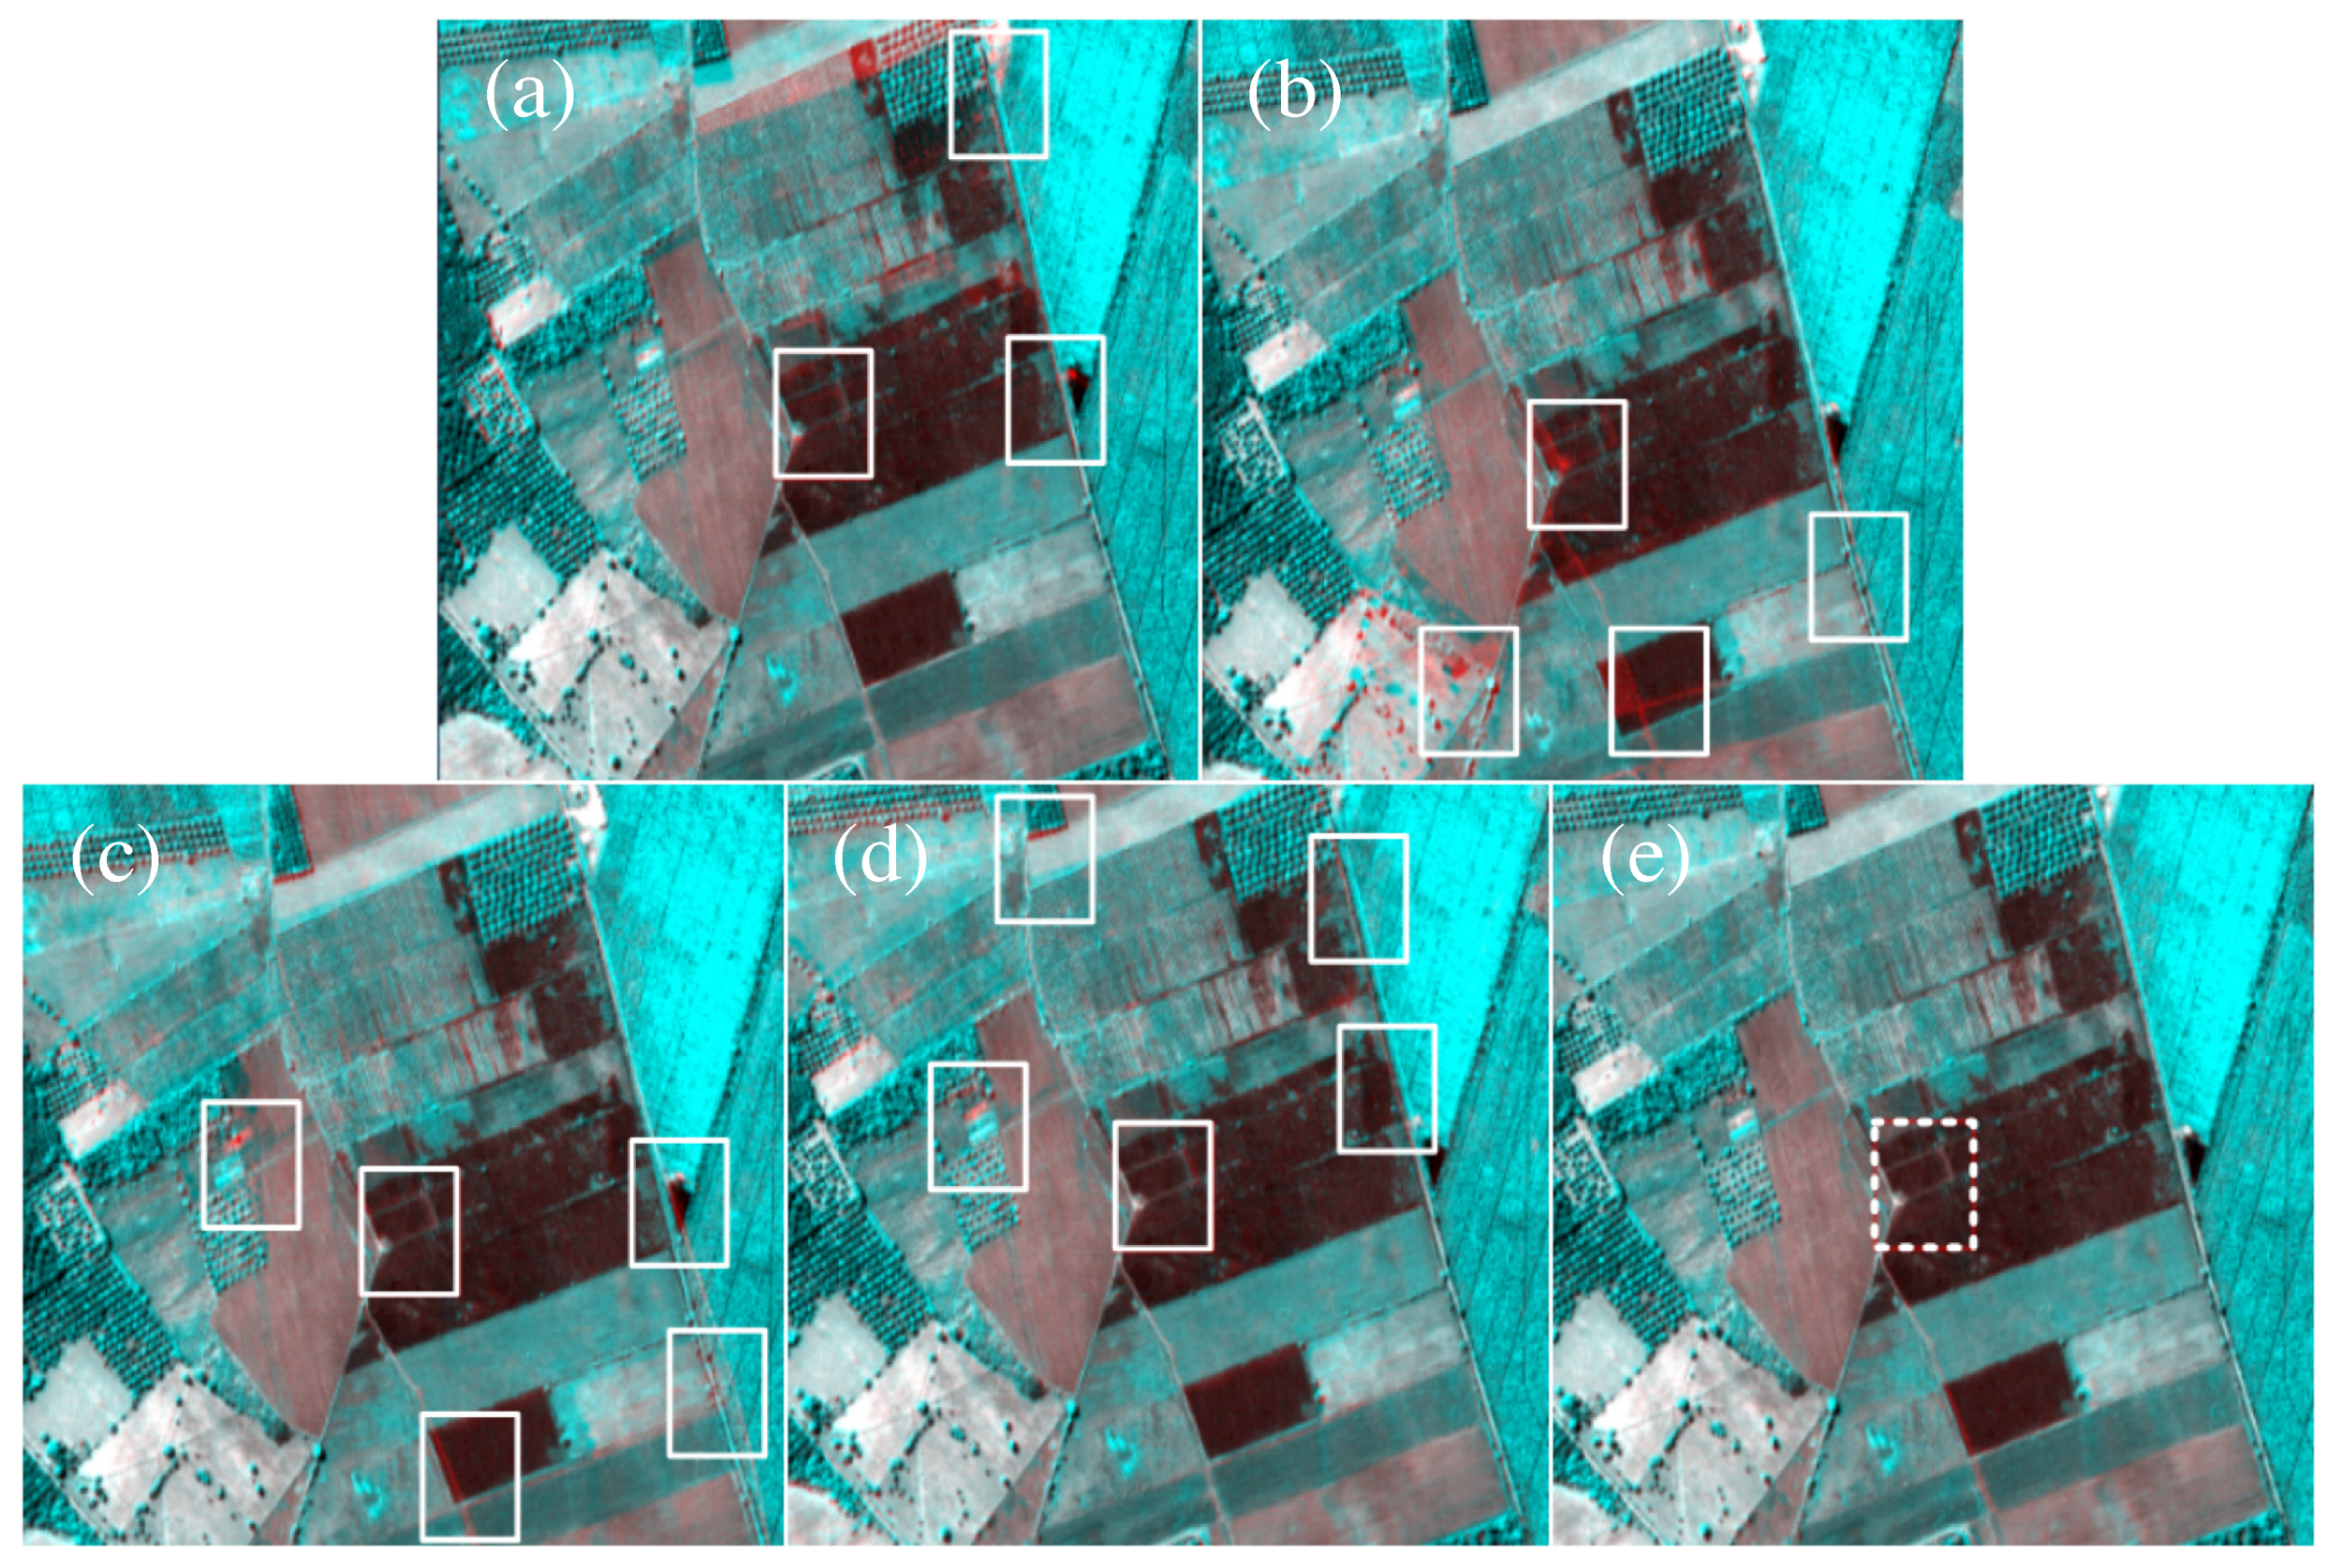
Figure 9 shows the resultant images obtained through the feature-based methods (SIFT in Figure 9a and SURF in Figure 9b) and area-based methods (SSD in Figure 9c, NCC in Figure 9d and FZNCC in Figure 9e) for Dataset 3. The figure is composed of pseudo color: red, sensed image; green, reference image; and blue, reference image. If the sensed image is not registered accurately, the red color appears. The white boxes represent the local registration error. In the figure, it can be observed that the registration errors (red colored areas) are visible in the resultant images obtained from the conventional methods SIFT, SURF, SSD and NCC, whereas the proposed method can be clearly distinguished visually, and provided better RGB images compared to the conventional methods. Similarly, Figure 10 shows the resultant images obtained through the feature-based methods (SIFT in Figure 10a and SURF in Figure 10b) and area-based methods (SSD in Figure 10c, NCC in Figure 10d and FZNCC in Figure 10e) for the checkerboard images using Dataset 4. Due to the large image size of satellite images, we show a portion of the area (Figure 10a red box) for better comparison. It can be observed in Figure 10b,e that the conventional methods provided disconnected results, whereas the proposed method provided accurate registration results. It shows the superiority of the proposed method over the conventional methods in terms of registration accuracy.

5. Conclusions

In this paper, we propose a registration method that utilizes the area-based feature extraction approach. Histogram matching is applied to get accurate control points. The proposed method could obtain better results, indicated through the following.
  • Accuracy: The lower RMSE value indicates more accurate results. The proposed method provided lower RMSE values than other conventional methods, thus the proposed method provided more accurate registration results.
  • Control point ratio (CPR): The experimental results show that the feature-based methods (SIFT and SURF) provided smaller CPR values than area-based methods (SSD and NCC). Among the area-based methods, the proposed FZNCC method provided the highest CPR value.
The conventional area-based methods are computationally expensive and less accurate, preventing their wide use in applications. The proposed method, FZNCC, is more efficient and provides accurate result.

Author Contributions

M.T.M. designed the experiments and analyzed the data. I.H.L. conceived and developed the overall algorithm.

Funding

This work was supported by Basic Science Research Program (2017R1D1A1B03033526 and 2016R1D1A1B03933860) and Priority Research Centers Program (NRF-2017R1A6A1A03015562) through the National Research Foundation of Korea (NRF) funded by the Ministry of Education.

Conflicts of Interest

The authors declare no conflict of interest.

References

  1. Wong, A.; Orchard, J. Efficient FFT-accelerated approach to invariant optical–LIDAR registration. Geosci. Remote Sens. IEEE Trans. 2008, 46, 3917–3925. [Google Scholar] [CrossRef]
  2. Lee, I.; Seo, D.C.; Choi, T.S. Entropy-Based Block Processing for Satellite Image Registration. Entropy 2012, 14, 2397–2407. [Google Scholar] [CrossRef] [Green Version]
  3. Huo, S.; Pan, C.; Huo, L.; Zhou, Z. Multilevel SIFT matching for large-size VHR image registration. IEEE Geosci. Remote Sens. Lett. 2012, 9, 171–175. [Google Scholar] [CrossRef]
  4. Zitova, B.; Flusser, J. Image registration methods: A survey. Image Vis. Comput. 2003, 21, 977–1000. [Google Scholar] [CrossRef]
  5. Hong, G.; Zhang, Y. Wavelet-based image registration technique for high-resolution remote sensing images. Comput. Geosci. 2008, 34, 1708–1720. [Google Scholar] [CrossRef]
  6. Le Moigne, J.; Netanyahu, N.S.; Eastman, R.D. Image Registration for Remote Sensing; Cambride University Press: Cambride, UK, 2011. [Google Scholar]
  7. Goshtasby, A.A. Image Registration: Principles, Tools and Methods; Springer Science & Business Media: Berlin, Germany, 2012. [Google Scholar]
  8. Sedaghat, A.; Mokhtarzade, M.; Ebadi, H. Uniform Robust Scale-Invariant Feature Matching for Optical Remote Sensing Images. Geosci. Remote Sens. IEEE Trans. 2011, 49, 4516–4527. [Google Scholar] [CrossRef]
  9. Song, R.; Szymanski, J. Well-distributed SIFT features. Electron. Lett. 2009, 45, 308–310. [Google Scholar] [CrossRef]
  10. Lee, I.H.; Choi, T.S. Accurate Registration Using Adaptive Block Processing for Multispectral Images. Circuits Syst. Video Technol. IEEE Trans. 2013, 23, 1491–1501. [Google Scholar] [CrossRef]
  11. Lowe, D. Object recognition from local scale-invariant features. Computer Vision, 1999. In Proceedings of the Seventh IEEE International Conference on IEEE, Kerkyra, Greece, 20–27 September 1999; Volume 2, pp. 1150–1157. [Google Scholar]
  12. Lowe, D. Distinctive image features from scale-invariant keypoints. Int. J. Comput. Vis. 2004, 60, 91–110. [Google Scholar] [CrossRef]
  13. Yi, Z.; Zhiguo, C.; Yang, X. Multi-spectral remote image registration based on SIFT. Electron. Lett. 2008, 44, 107–108. [Google Scholar] [CrossRef]
  14. Song, Z.; Li, S.; George, T. Remote sensing image registration approach based on a retrofitted SIFT algorithm and Lissajous-curve trajectories. Opt. Express 2010, 18, 513–522. [Google Scholar] [CrossRef] [PubMed]
  15. Mikolajczyk, K.; Schmid, C. A performance evaluation of local descriptors. IEEE Trans. Pattern Anal. Mach. Intell. 2005, 27, 1615–1630. [Google Scholar] [CrossRef] [PubMed]
  16. Ke, Y.; Sukthankar, R. PCA-SIFT: A more distinctive representation for local image descriptors. CVPR 2004, 4, 506–513. [Google Scholar]
  17. Bay, H.; Tuytelaars, T.; Van Gool, L. Surf: Speeded up robust features. In Computer Vision–ECCV 2006; Springer: Berlin/Heidelberg, Germany, 2006; pp. 404–417. [Google Scholar]
  18. Juan, L.; Gwun, O. A comparison of sift, pca-sift and surf. Int. J. Image Process. (IJIP) 2010, 3, 143. [Google Scholar]
  19. Chen, H.; Arora, M.; Varshney, P. Mutual information-based image registration for remote sensing data. Int. J. Remote Sens. 2003, 24, 3701–3706. [Google Scholar] [CrossRef]
  20. Ma, J.; Chan, J.; Canters, F. Fully automatic subpixel image registration of multiangle CHRIS/Proba data. Geosci. Remote Sens. IEEE Trans. 2010, 48, 2829–2839. [Google Scholar]
  21. Lewis, J. Fast template matching. Vis. Interface 1995, 95, 120–123. [Google Scholar]
  22. Goshtasby, A.; Gage, S.; Bartholic, J. A two-stage cross correlation approach to template matching. IEEE Trans. Pattern Anal. Mach. Intell. 1984, 374–378. [Google Scholar] [CrossRef]
  23. Rueckert, D.; Sonoda, L.; Hayes, C.; Hill, D.; Leach, M.; Hawkes, D. Nonrigid registration using free-form deformations: Application to breast MR images. Med. Imaging IEEE Trans. 1999, 18, 712–721. [Google Scholar] [CrossRef]
  24. Keys, R. Cubic convolution interpolation for digital image processing. IEEE Trans. Acoust. Speech Signal Process. 1981, 29, 1153–1160. [Google Scholar] [CrossRef]
  25. Qing, Z.; Wu, B.; Xu, Z.X. Seed point selection method for triangle constrained image matching propagation. Geosci. Remote Sens. Lett. IEEE 2006, 3, 207–211. [Google Scholar]
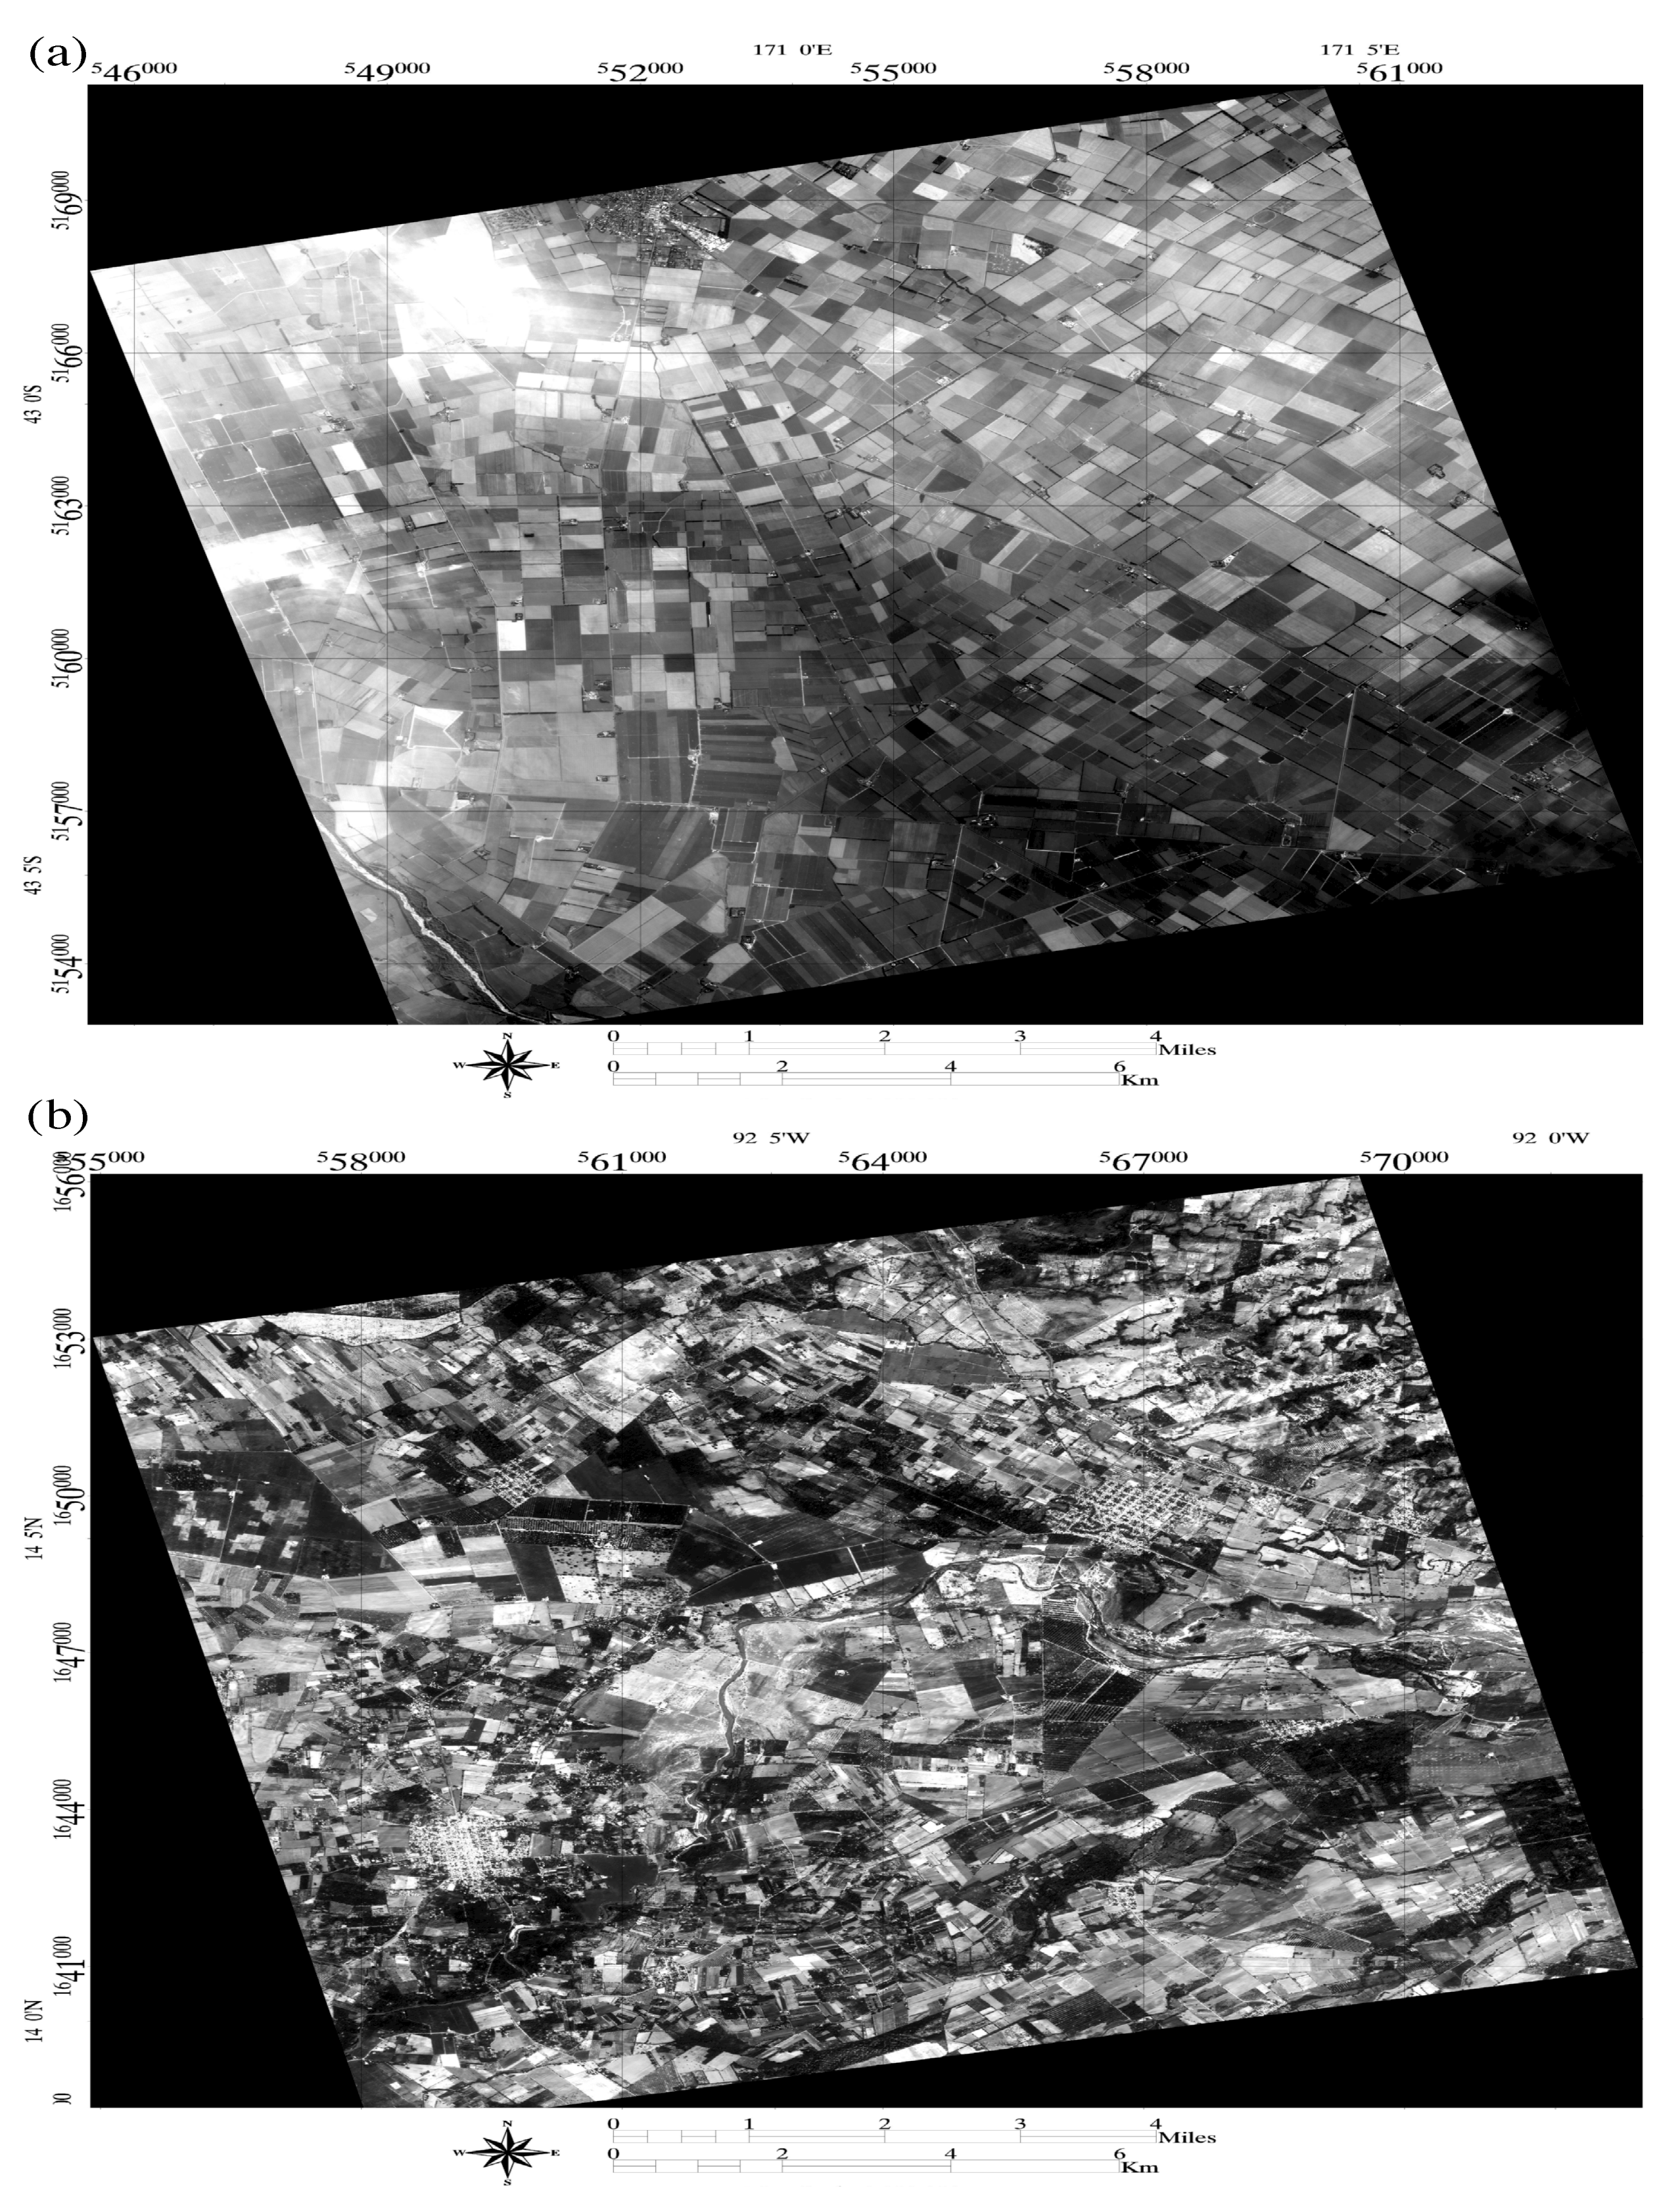
Figure 1. Study area of reference images: (a) set 1; (b) set 2.
Applsci 09 03487 g001
Figure 2. Relative spectral response: panchromatic images (0.50–0.90 μ m ), blue band (0.45–0.52 μ m ), green band (0.52–0.60 μ m ), red band (0.63–0.69 μ m ), and NIR band (0.76–0.90 μ m ).
Applsci 09 03487 g002
Figure 3. Flow chart of the proposed registration steps: the red box indicates image adjustment, while the blue box indicates feature extraction.
Applsci 09 03487 g003
Figure 4. Global histogram matching: (a) reference image; (b) histogram of (a); (c) sensed image; (d) histogram of (c); (e) global histogram matching; and (f) histogram matched image.
Applsci 09 03487 g004
Figure 5. Local histogram matching: (a) reference image; (b) one image block; (c) histogram of (b); (d) sensed image; (e) one image block; (f) histogram of (e); (g) local histogram matching; and (h) histogram matched image.
Applsci 09 03487 g005
Figure 6. Graphical representation of Algorithm 2: (a) reference image; (b) sensed image; (c) template image; and (d) target image.
Applsci 09 03487 g006
Figure 7. Comparison of CPs: (a,b) non-histogram matched image; (c,d) the proposed histogram matched image.
Applsci 09 03487 g007
Figure 8. Control points distribution images of Sample 3 using: (a) SIFT; (b) SURF; (c) SSD; (d) NCC; and (e) FZNCC.
Applsci 09 03487 g008
Figure 9. Samples of pseudo RGB images of Dataset 3: (a) SIFT; (b) SURF; (c) SSD; (d) NCC; and (e) FZNCC. The white box indicates inaccurately registered area.
Applsci 09 03487 g009
Figure 10. Checkerboard images of Dataset 4: (a) sample image; (b) SIFT; (c) SURF; (d) SSD; (e) NCC; and (f) FZNCC. The white box indicates inaccurately registered area.
Applsci 09 03487 g010
Table 1. Extracted CPs comparison.
CPsDataSIFTSURFSSDNCCFZNCC
Initial CPs (Reference image)Set 1616,24448,01024,32024,32024,320
Initial CPs (Sensed image)383,28528,52824,32024,32024,320
Corresponding CPs6970503824,32024,32024,320
Refined CPs25581052357064498235
Initial CPs (Reference image)Set 267,90230,89724,32024,32024,320
Initial CPs (Sensed image)66,74049,25324,32024,32024,320
Corresponding CPs10,815398424,32024,32024,320
Refined CPs646519396767788310,269
Initial CPs (Reference image)Set 3157,49237,71424,32024,32024,320
Initial CPs (Sensed image)148,84943,15524,32024,32024,320
Corresponding CPs9878330424,32024,32024,320
Refined CPs49131106892711,62215,807
Table 2. CPR comparison.
ImageDataSIFTSURFSSDNCCFZNCC
Reference imageSet 10.00420.02190.14680.26520.3386
Sensed image0.00670.03690.14680.26520.3386
Reference imageSet 20.09520.06280.27820.32410.4222
Sensed image0.09690.03940.27820.32410.4222
Reference imageSet 30.03120.02930.36710.47790.6500
Sensed image0.03300.02560.36710.47790.6500
Table 3. Accuracy comparison in terms of RMSE.
DataSIFTSURFSSDNCCFZNCC
Set 12.16063.51173.52182.86281.7490
Set 21.35091.84552.52001.97551.0249
Set 31.21262.13841.63491.37080.8797