Article

Real-Time Monitoring of Indoor Air Quality with Internet of Things-Based E-Nose

Department of Electronic, Turgutlu Vocational School, Manisa Celal Bayar University, 45400 Manisa, Turkey
*
Author to whom correspondence should be addressed.
Appl. Sci. 2019, 9(16), 3435; https://doi.org/10.3390/app9163435
Submission received: 22 June 2019 / Revised: 6 August 2019 / Accepted: 15 August 2019 / Published: 20 August 2019
(This article belongs to the Special Issue Indoor Air Quality)

Abstract

:
Today, air pollution is the biggest environmental health problem in the world. Air pollution leads to adverse effects on human health, climate and ecosystems. Air is contaminated by toxic gases released by industry, vehicle emissions and the increased concentration of harmful gases and particulate matter in the atmosphere. Air pollution can cause many serious health problems such as respiratory, cardiovascular and skin diseases in humans. Nowadays, where air pollution has become the largest environmental health risk, the interest in monitoring air quality is increasing. Recently, mobile technologies, especially the Internet of Things, data and machine learning technologies have a positive impact on the way we manage our health. With the production of IoT-based portable air quality measuring devices and their widespread use, people can monitor the air quality in their living areas instantly. In this study, e-nose, a real-time mobile air quality monitoring system with various air parameters such as CO2, CO, PM10, NO2 temperature and humidity, is proposed. The proposed e-nose is produced with an open source, low cost, easy installation and do-it-yourself approach. The air quality data measured by the GP2Y1010AU, MH-Z14, MICS-4514 and DHT22 sensor array can be monitored via the 32-bit ESP32 Wi-Fi controller and the mobile interface developed by the Blynk IoT platform, and the received data are recorded in a cloud server. Following evaluation of results obtained from the indoor measurements, it was shown that a decrease of indoor air quality was influenced by the number of people in the house and natural emissions due to activities such as sleeping, cleaning and cooking. However, it is observed that even daily manual natural ventilation has a significant improving effect on air quality.

1. Introduction

In recent years, air pollution has been a major environmental problem and a global concern that has exceeded recommended national limits. Air pollution has negative effects on human health and ecosystems, as well as affecting the world’s climate [1]. Air pollution can be classified as internal or external air pollution, depending on where the activities take place [2]. Outdoor air pollution occurs in an open environment, covering the entire atmosphere. Fossil fuels used to meet the energy needs of factories, industries and vehicles are the main activities contributing to agricultural and mining outdoor air pollution. The external air pollutants are mainly composed of nitrogen oxides (NOx), nitrogen dioxide (NO2), sulfur dioxide (SO2), ozone (O3), carbon monoxide (CO), hydrocarbons and particulate matter (PM) of different particle sizes. Indoor air pollution, found in offices, hospitals, schools, libraries, entertainment areas, gymnasiums, public transport vehicles, etc., is classified as the pollution of the air of indoor areas [3]. Major indoor air pollutants include NOx, SO2, O3, CO, carbon dioxide (CO2), volatile and semi-volatile organic compounds VOCs, PM, radon and microorganisms. The air quality index includes an internationally adopted parameter for assessing air quality.
Ground-level ozone reflects five pollution standards including PM, carbonic oxide, SO2 and NO2 [4]. Indoor air quality (IAQ) is very important for many people who spend most of their lives in closed spaces, such as the elderly, disabled, infants and patients [5]. Indoor air pollution occurs due to household activities and products used in these activities. Home cleaning products and paint materials emit toxic chemicals into the air and cause air pollution. Exposure to air pollution, especially indoor air pollution, is one of the largest environmental health risk factors and is directly related to millions of premature deaths worldwide each year [6]. Air pollution comes second on the list of deaths caused by non-contagious health reasons [7].
In the United States, indoor and outdoor air quality is regulated by the Environmental Protection Agency (EPA). The EPA has shown that indoor pollutant levels may be up to 100 times higher than the level of external pollutants and poor air quality is one of the five most important environmental risks threatening public health [8]. PM, a complex mixture of solid and liquid particles of organic and inorganic substances suspended in the air, is considered the most common pollutant. Air pollution from PM (PM2.5 and PM10) poses a significant health threat to people living in cities. The health-damaging PM, which can penetrate deep into the lungs, contributes to the risk of developing cardiovascular diseases as well as lung cancer [9]. In addition to health problems affecting the low IAQ nervous system, its effects are associated with other long-term diseases [10]. Simple interventions, such as natural ventilation provided by homeowners, have significant positive effects on IAQ. However, consideration of the household’s thermal comfort and climate conditions in natural ventilation is crucial [11]. Furthermore, power losses due to manually regulated natural ventilation should be considered [12]. Therefore, indoor real-time monitoring of IAQ is very important to detect unhealthy conditions [13].
Today, cities face interesting challenges and problems to meet socio-economic development and quality of life goals, and the concept of “smart cities” responds to these challenges. The smart city is directly related to a strategy to reduce the problems caused by rapid urbanization [14]. The IoT is a network where physical objects are linked to each other or to larger systems. This network collects large amounts of data from different devices we use in our daily life and converts it into utilizable information [15]. The rapidly emerging IoT concept supports many different areas and applications including health, education, agriculture, industry and environmental monitoring. Real-time environmental monitoring and analysis is an important area of research for IoT [16]. IoT provides remarkable features to smart cities which improve environmental quality control, innovative real-life solutions and services. The smart home is an indispensable element of smart cities. In the future, smart homes will be fully managed through smartphone applications and will include IoT wearable devices [17] that are supported by microsensors. To date, several have been conducted in the literature with the aim of establishing real-time monitoring solutions for air quality analysis.
Numerous IoT-based air quality monitoring systems using micro-sensors for data collection have been proposed, including open source technologies for data processing and transmission [18]. According to an IAQ analysis [19], it has been reported that indoor PM2.5 pollution mainly comes from outdoor sources. In another study, three typical activities such as a having fireplace in the house, cooking with kitchen appliances and toasting were investigated, and indoor pollutant levels such as PM2.5, PM10 and VOC were found to be above the limit values [20]. Monitoring of the PM concentration for 63 participants between the ages of 18–65 years in the Perth metropolitan area indicates that the PM concentration increases the number of heartbeats by 4–6 beats per minute (bpm) and has a significant effect on systolic blood pressure (SBP) [21]. An IoT-based IAQ measurement system was created using the WEMOS D1 mini microcontroller and the PMS5003 PM sensor. This system allows the household individual to intervene for ambient assisted living (AAL) [22].
In this study, a low-cost, portable, IoT-based and real-time monitoring system that can measure ambient air quality with a range of sensors is proposed. For the proposed system, an Android interface has been designed primarily by the Blynk platform. Then, with the embedded architecture ESP32 module, the controller unit of the system is created. Using this IoT controller with an internal Wi-Fi module, all measured air quality data are displayed in the mobile app and these data are stored on a cloud server. The mobile interface provides users with numerical and graphical data on contaminating gas concentrations, temperature and humidity. The proposed e-nose measurement system sends a notification to the users via the mobile application if any gas concentration levels reach health-threatening values. In this way, households can take measures to reduce gas concentrations when necessary. The data can be viewed graphically through the mobile interface which allows users to observe the effects of activities such as sleep, cleaning and cooking on the gas concentration. In addition, the IoT-based e-nose air quality measurement system has a low-cost (about $100), easy-to-install and open-source feature produced by a DIY approach.

2. Related Work

Due to the fast advancement in IoT and sensor techniques, interest in air quality measurements continues to grow. In [23] an environmental monitoring system was propose that included the sensors Raspberry Pi and MICS-4514, which enabled the assessment both indoors and outdoors at a university campus of multiple environmental parameters such as temperature, humidity, light, noise level, CO, NO2. A proposed system for detecting environmental contamination [24] used various environmental detectors to identify temperature, humidity, ambient light, gas sensors and PM. All data measured by the system using the sensors STM32f4xx and Sharp GP2Y1010 for PM detection, and TGS5342 for CO, are stored in the internal storage and on an Internet server over the Wi-Fi network. Using the ATmega328AVR controller, DHT22 temperature sensor, Sharp GP2Y1010AU0F dust sensor and UVM-30A UV sensors, an Integrated Environmental Monitoring System (IEMS) [25] was proposed to detect the microenvironment. In another study [26], the Nano Environmental Monitoring System (nEMoS) was proposed using an IoT-based indoor environmental quality (IEQ) assessment system created using an Arduino Uno module and low-cost sensors such as DHT22. To determine the quality of packaged products, an IoT-based measuring system was intended, including low-cost pressure, temperature, humidity, gas sensors (BME680, DHT22 and MQ5), Arduino and XBee wireless module [27]. In the study, in which iAQ, an air quality surveillance system based on IoT architecture, was proposed for AAL [28], the wireless sensor nodes (WSN), Gateway and Android user interface provided environmental data such as temperature, humidity and CO2 to users through the mobile application. In the IoT-based system [29] developed for real-time IAQ surveillance, multiple gases such as CO2, NO2, ethanol, methane and propane were detected using ESP8266 as the controller and sensors MICS-6814 and MICS-6814 as the detection unit. This system, based on open source technology, has a mobile phone application that transmits real-time notifications to users. The solution is based on the IoT concept and is entirely wireless in a study that presented an IAQ surveillance solution that can measure temperature, humidity, PM10, CO2 and light intensity in real-time [30]. The Arduino UNO emitter utilizes the ESP8266 controller and the “ThingSpeak” open-source IoT platform to record wireless data to enable wireless Internet access. In this study, a real-time surveillance system based on IoT architecture for PM surveillance was presented [31]. The iDust system was created using open source technologies and low-cost sensors. System measurement data, consisting of a WEMOS D1 Wi-Fi controller and PMS 5003 dust sensor, are transferred to users via an IoT-based implementation.

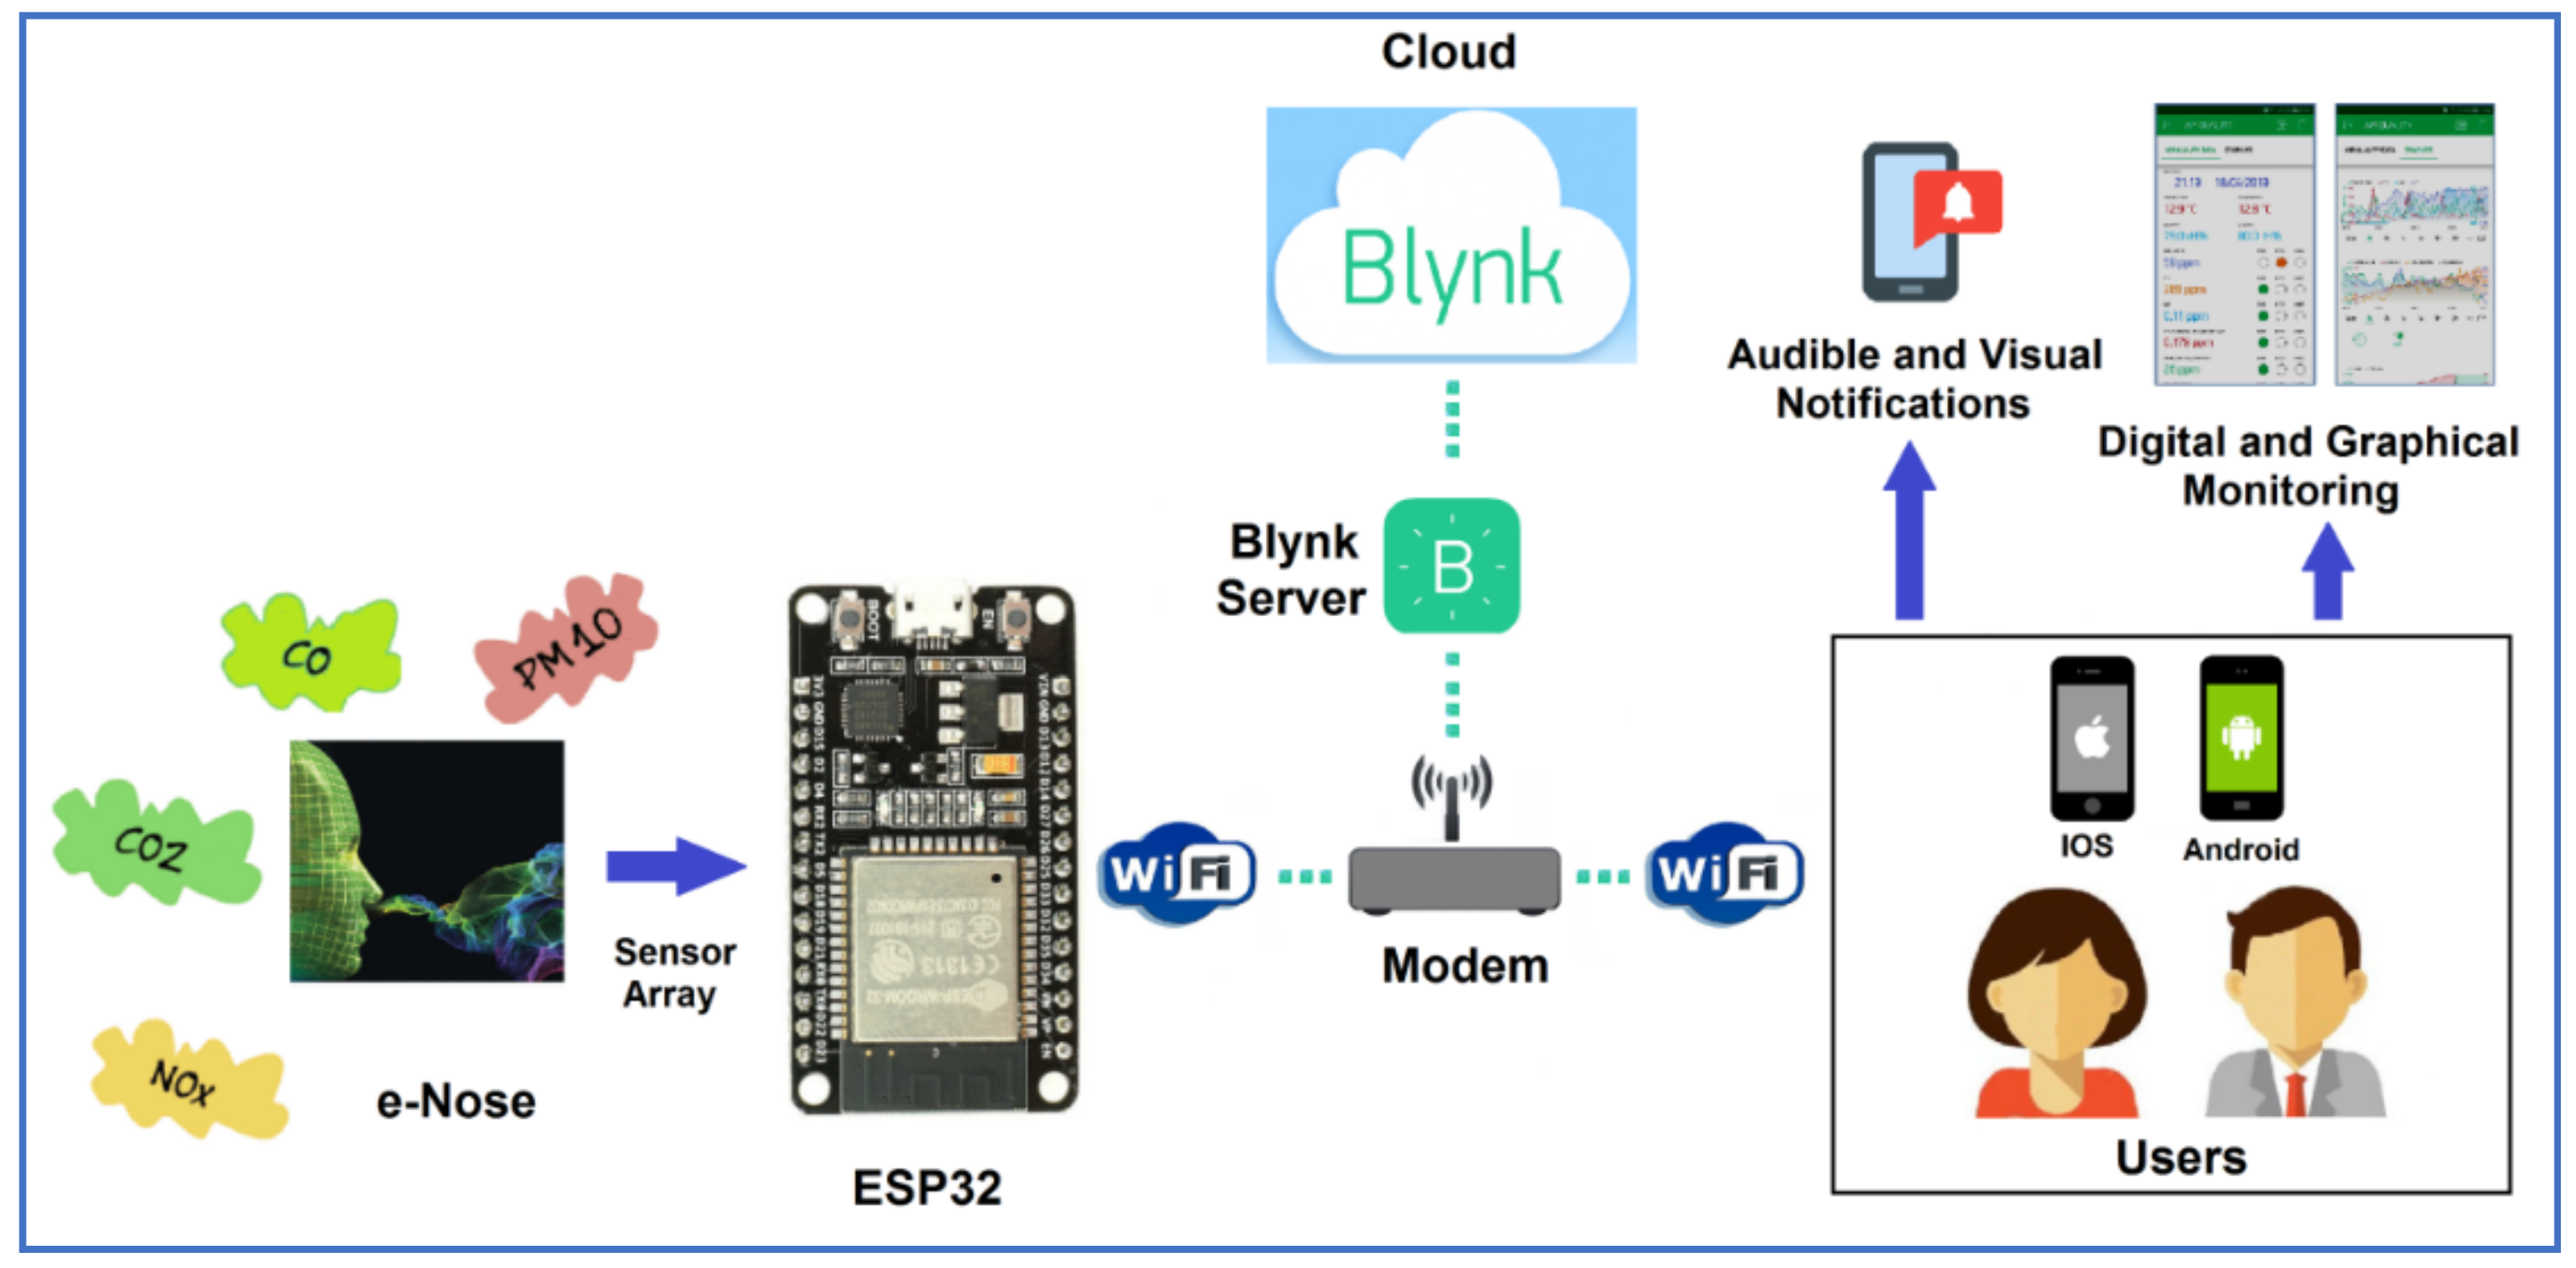
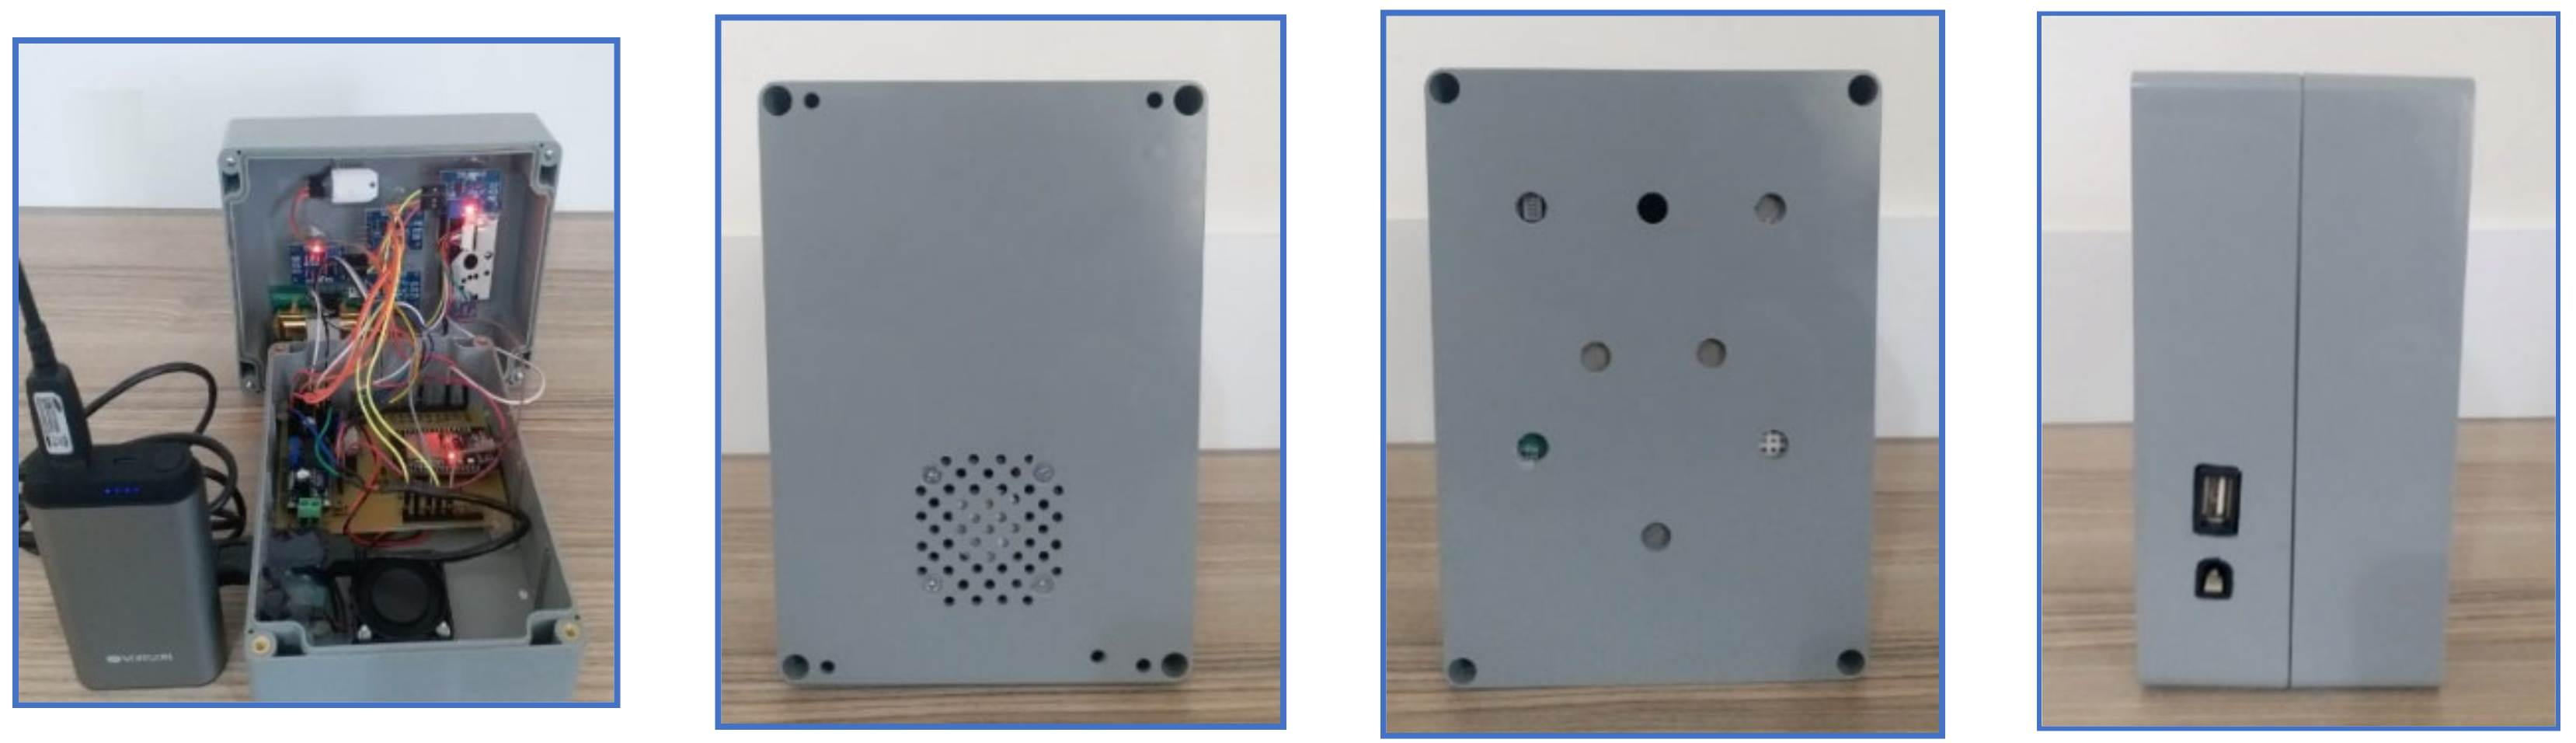
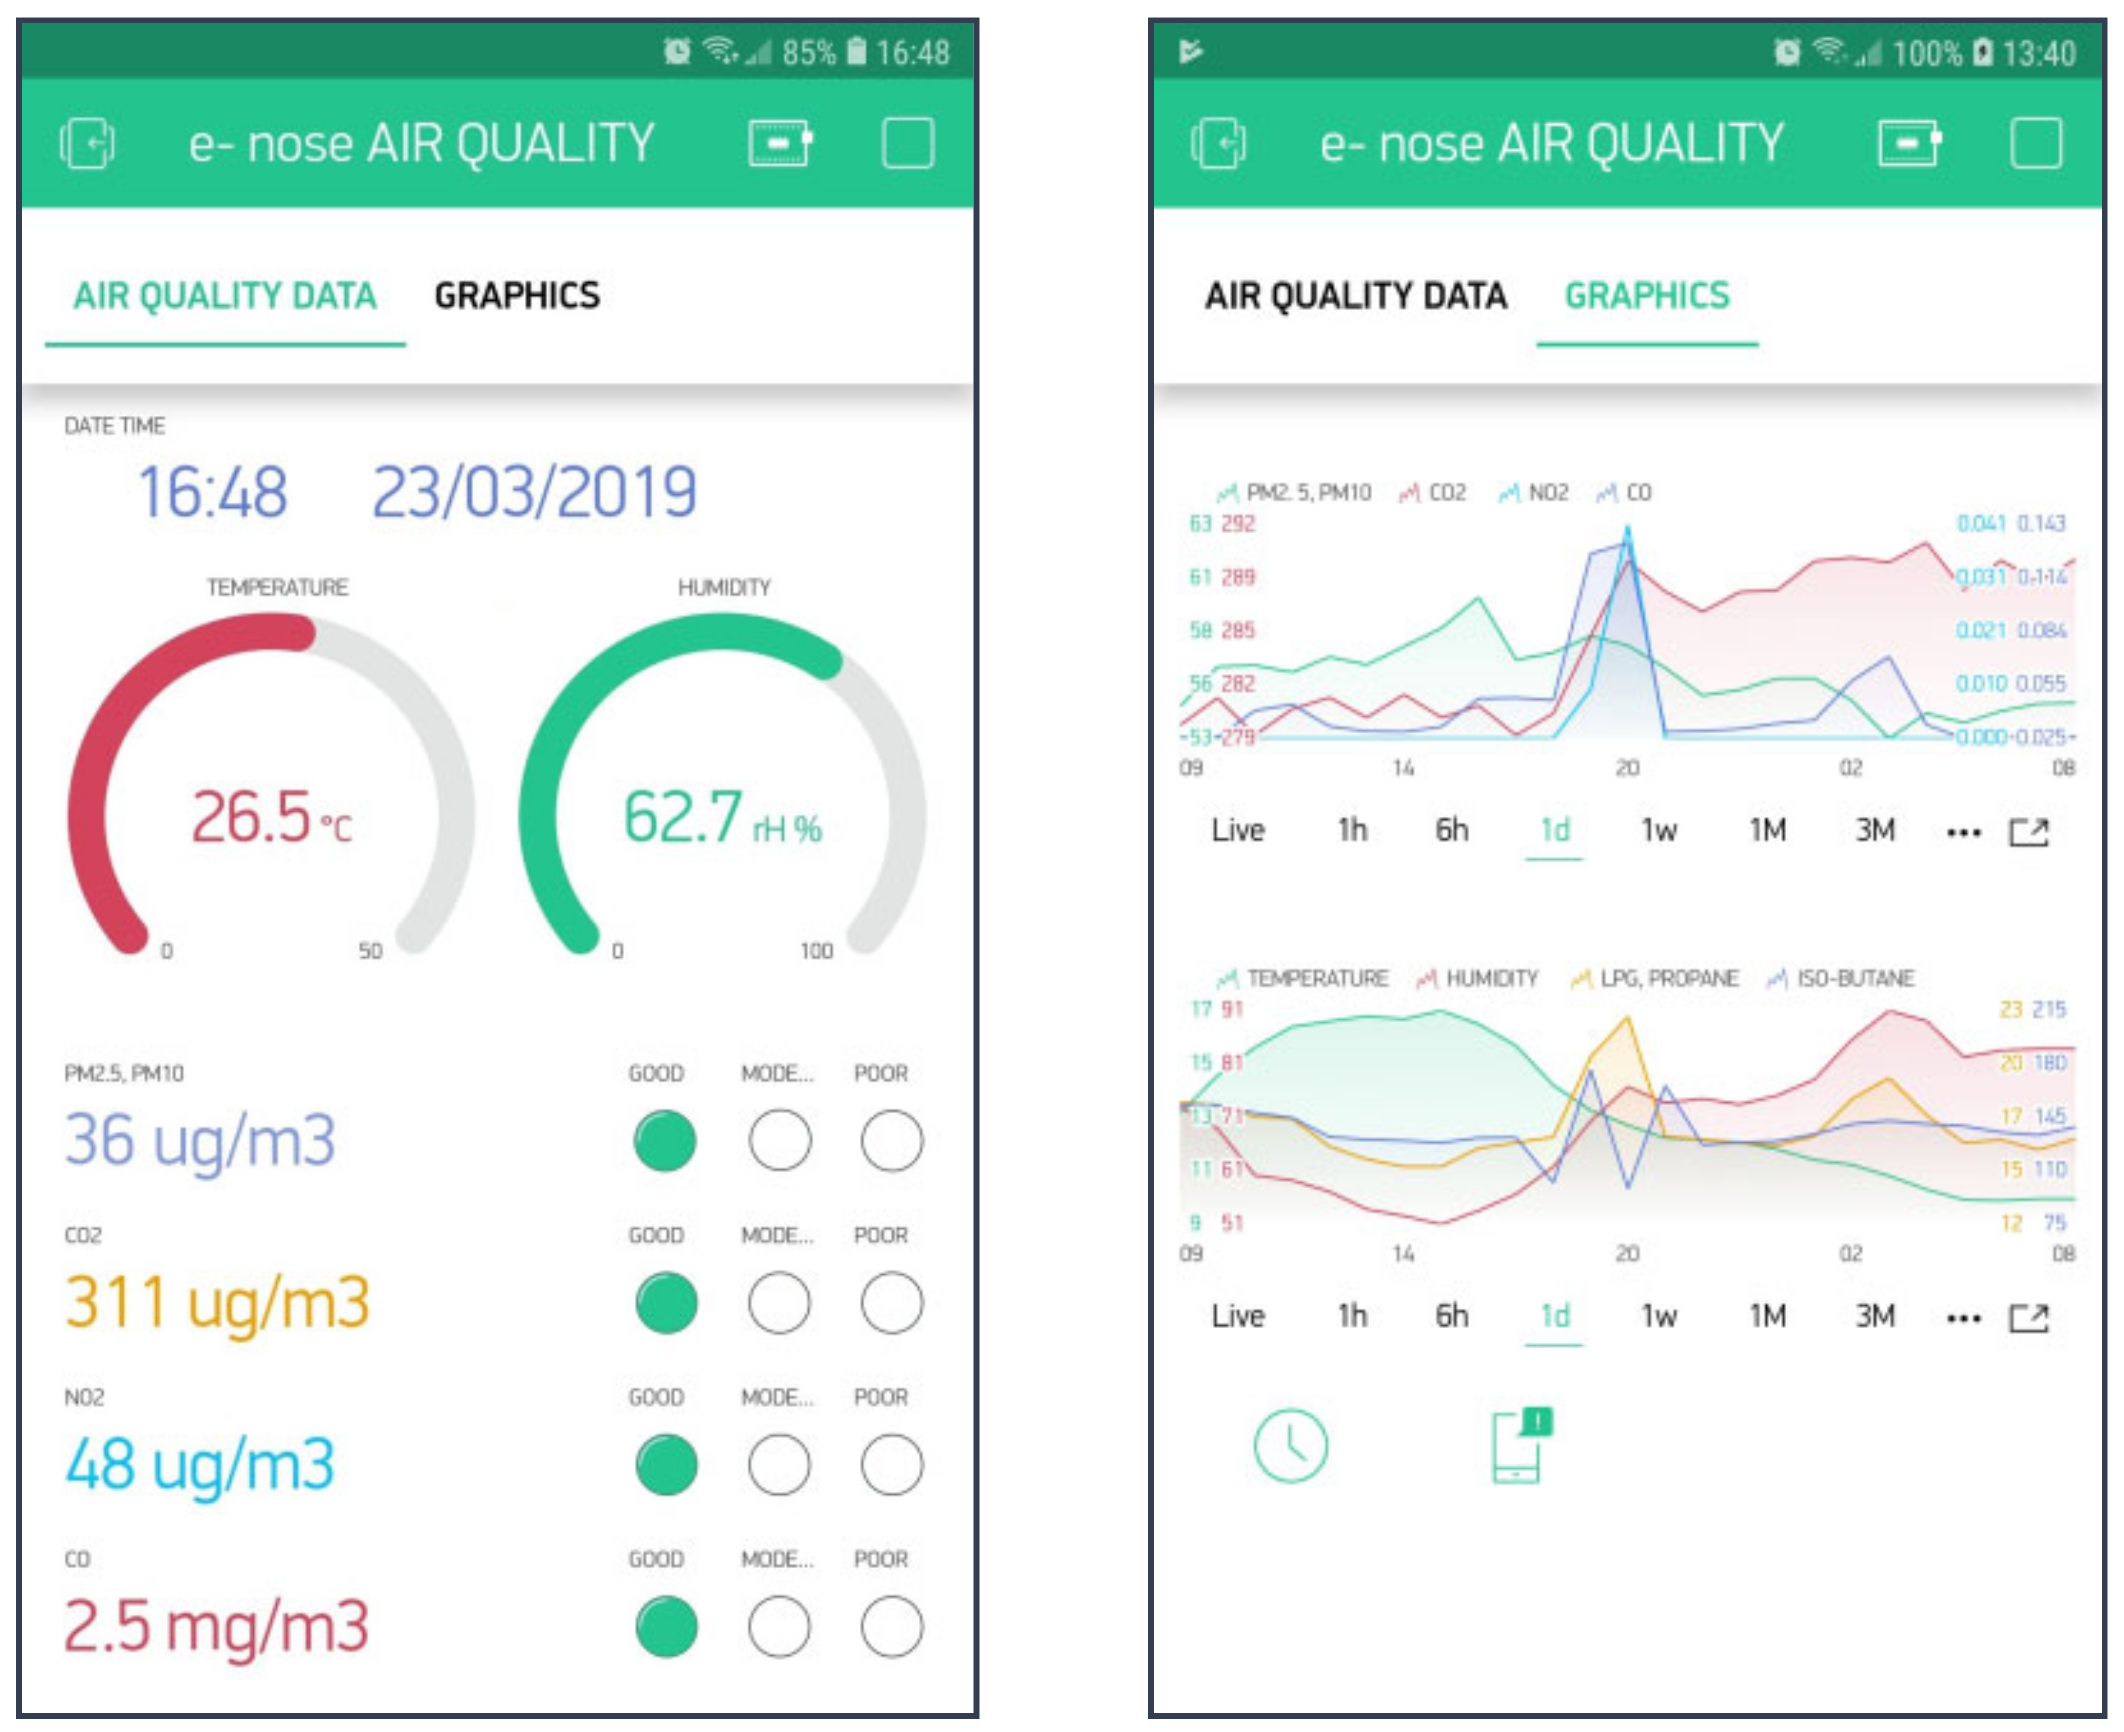
3. Materials and Methods

Low air quality poses a significant health threat for individuals who spend most of their time indoors. Some pollutants such as tobacco smoke, CO, NO2, formaldehyde, asbestos fibres, microorganisms and allergens are known to be closely related to health problems. Temperature and humidity monitoring are part of everyday life, but in the vast majority of buildings, real-time air quality monitoring is not performed. In this study, air quality measurement system with an IoT-based e-nose has been proposed for real-time, low-cost and easy-to-install air quality monitoring. With the proposed e-nose system the ambient temperature and humidity values are measured in real-time in addition to the polluting gases such as CO2, CO, PM10 and NO2. Information on the presence of these monitored gases in excessive quantities is transmitted to users via the mobile application as a notification. This is a completely wireless solution developed using the ESP32 module, which integrates the IEEE 802.11 b/g/n network protocol into the IoT architecture.
The architecture of the proposed e-nose system is given in Figure 1. A real-time air quality monitoring system provides information about the concentration of pollutants in the environment. It provides precise and detailed information about the air quality of the living environment and helps to plan interventions that lead to improved air quality. The e-nose air quality monitoring system in Figure 1 consists of two parts: The first part is the detection and communication unit consisting of an ESP32 microcontroller-based sensor array with built-in Wi-Fi; and the second is the Android/iOS-based mobile user interface.
The ESP32 module with a built-in Wi-Fi module is used in the e-nose system created for monitoring air quality. The low-cost and high-performance 32-bit controller is frequently preferred in IoT applications. An ESP32 has a dual-core structure and has many internal modules such as Wi-Fi, Bluetooth, RF, IR, CAN, Ethernet module, temperature sensor, hall effect sensor and touch sensor needed for smart home applications. In the ESP32 module structure, the Harvard Tensilica Xtensa LX6 32-bit Dual Core features a processor capable of operating at up to 240 MHz. The detection unit includes the sensors GP2Y1010AU, MH-Z14, MICS-4514 and DHT22, which measure air quality parameters such as CO2, CO, PM10, NO2, temperature and humidity.
The GP2Y1010AU is a dust sensor with an analogue output system. An infrared light-emitting diode (IRED) and a phototransistor are arranged across from each other. The IR beams reflected from dust entering the air chamber of the sensor is detected by the phototransistor and generates a corresponding voltage [32].
The MH-Z14A CO2 sensor module uses the non-dispersive infrared (NDIR) principle. It measures between 0–5000 ppm, 5 ppm resolution with an accuracy of ±50 ppm. The sensor module sends the CO2 concentration in three different output modes: Serial output (RS-232), analogue output and pulse width modulation (PWM) [33].
The MICS-4514 is mainly used for measuring emissions from automobile exhausts but is also used for measuring concentrations of gases such as NO2, CO and hydrocarbons. The sensor has a built-in heating element and a micro-sensing diaphragm on the upper side. The MICS-4514 includes two sensor chips with independent heaters and delicate layers. One sensor chip detects oxidizing gases (OX) and the other sensor detects reducing gases (RED) [34].
The DHT22 consists of two parts: A thermistor temperature sensor and a capacitive humidity sensor. The DHT22 is an advanced sensor unit that provides a calibrated digital signal output. It is equipped with an 8-bit microcontroller and has a short response time. It has a relative error of ±0.5 °C in temperature measurement and ±2% rH in humidity measurement [35]. The electronic features of the sensors used in the IoT-based e-nose system are given in Table 1.
The images of the IoT-based e-nose system used in air quality measurements and formed from different sensors are displayed in Figure 2. The sensors used in the system are mounted in a 17 × 12 × 8 cm size sealed box per the measurement specifications. In addition to the sensors used for measurement, the box includes a printed circuit board, a fan for airflow to the dust sensor, and a power supply for the energy of the system.
The measurement system can work with a 12 V DC adapter, and additionally has a mobile use feature when paired with a power bank that can be connected to the 5 V DC USB port. This feature provides a great advantage for short-term measurements. When supplied from a 5 V power supply, the measuring device draws a current of 160 mA. With a 5000 mAh power bank, it has a measuring time of approximately 30 h. Using a wireless internet connection, it provides the opportunity to measure air quality from many common living areas such as parks, gardens, highways, industrial areas, sports fields, public transportation, cafes, restaurants, schools, hospitals.
The climate parameters and gas concentrations are a median of 12 measurements taken at 5 s intervals. This minimizes the effect of erroneous measurements brought about by faulty sensors. Users are notified by exceeding the designated gas concentration and climate parameter thresholds. Five-minute averages are calculated and delivered to users as notifications, preventing false warnings that may mislead users. In this e-nose system which measures air quality, no memory element is used for data recording. The received data are recorded directly to the Blynk cloud server via the mobile interface. The data are sent to the registered e-mail address of the user when requested. The status of the internet connection is checked before each data transmission. When not connected, data packets that cannot be temporarily transmitted are stored to ensure data integrity, and then, when the internet connection is re-established, these packets are sent to the cloud server using past time tags. In this way, data loss can be prevented by providing continuity in the data flow.
The front panel images of the developed Android-based mobile user interface are given in Figure 3. Control over mobile devices in IoT applications has become very common. There are many free options available for Android and iOS devices. Blynk is one of these applications and it is an IoT platform developed for iOS and Android applications that enables management of different controllers such as Raspberry Pi, ESP8266, ESP32, chipKIT, Intel, LeMarker, Onion Omega, SparkFun and STM32. Using the Blynk cloud server service, digital data such as temperature, humidity, current, voltage measurements and control systems are stored and can be easily accessed at any time. The Blynk graphical components (widgets) allow real-time clock and calendar (RTCC) features to be used.
Table 2 shows the cost table of the IoT-based e-nose measurement system. The total cost of the software and hardware components required to install the system is approximately $100. Compared to most commercially accessible non-IoT-based home air quality meters, this cost is very economical and convenient.

4. Results and Discussion

For air quality analysis with IoT-based e-nose, data were collected in a residence for 4 days at one-minute intervals. The housing area where air quality measurements were taken is 150 m2. The room in which the measurements were made is 25 m2 and the measurements were taken from a height of 1.5 m. The five-person house is heated by a central heating system. Although there were changes in the number of inhabitants during the day, there were always at least two people in the household. There was no air cleaning system in the house and the ventilation of the environment was done by manually opening the windows.
The doors in the household were not closed during the measurement and thus the air was homogeneous throughout the house. Ventilation was carried out once a day for a duration of one hour. Ventilation started at 11:30 on the first day and at 07:30 on the other days.
Figure 4 displays 4-day measurement graphs showing the relationships between humidity–CO2, CO–CO2, CO2–NO2, CO–NO2, PM10–CO and PM10–NO2.
Figure 5 displays PM10, CO2, CO and NO2 measurements over 4 days. When the graph is examined, it shows that the indoor PM10, CO, NO2 and CO2 PM and gas concentrations vary depending on the number of household inhabitants and individual activities. It is seen that natural ventilation in the morning hours caused a decrease in CO, NO2 and CO2 gas concentrations. In addition, an increase in PM10 is observed in the morning as a result of increased activity in the household. These increased rates at the PM10 level are 27.1%, 32.2%, 14.4% and 12.5%, respectively.
Figure 6 displays the daily changes of temperature, humidity, PM10, CO, CO2 and NO2 values. One-day time, period 1 (00:00–07:30), period 2 (07:30–16:30) and period 3 (16:30–00:00) are divided into three parts; period 1 sleeping of household inhabitants, period 2 during which the daily activities (cooking, cleaning, etc.) of the individuals in the household are performed, and the period 3 of eating and resting of the household inhabitants. The PM10 value seen in Figure 6a is in the order of 28.18 µg m−3, 29.93 µg m−3 and 28.40 µg m−3 for periods 1-3, respectively. It can be seen that PM10 has the lowest value in period 1 when the household is asleep. The CO2 values in the periods are as follows: period 1, 565 µg m−3; period 2, 317 µg m−3; and period 3 has a mean value of 297 µg m−3. The value of CO2 reaches the highest value in period 1 when the household inhabitants are asleep.
When Figure 6b is examined, it is seen that NO2 concentration has average values of 53.15 µg m−3 for period 1, 41.59 µg m−3 for period 2 and 42.22 µg m−3 for period 3. It is seen that the NO2 concentration value reached the highest value in the period 1, similar to CO2. The CO concentration has an average of 5.48 mg m−3 in the period 1, 1.38 mg m−3 in the period 2 and 1.09 mg m−3 in the period 3. The CO value, and also CO2 and NO2 values, are observed to be highest in the period 1 while the household is asleep. Also, natural ventilation by opening the windows in the morning results in a significant reduction of CO, CO2 and NO2 concentrations.
As a result of natural ventilation, the indoor concentration of CO is seen to fall from 6.51 mg m−3 to 0.4 mg m−3, NO2 concentration from 54.7 µg m−3 to 38.6 µg m−3 and CO2 concentration from 608 µg m−3 to 282 µg m−3.
As a result of one hour of natural ventilation, the increased gas concentrations in the closed and unventilated environment resulted in a significant decrease of 93.8% in CO, 29.4% in NO2 and 53.6% in CO2.
Figure 7 shows the minimum, maximum and average values of daily gas concentrations. When the values given in Figure 7 are examined, it is seen that the largest variance is observed in the CO concentration. The CO values increased by nine times on day 1 and 16 times on day 3. Similarly, CO2 concentration increased by 1.36 times on day 2. NO2, with a lower change, increased by half on day 4 and PM10 concentration increased by half on day 2.
The daily average concentration values of indoor CO gas are as follows: 3.21, 2.75, 2.65 and 3.40 mg m−3, daily concentrations of NO2, 47.9, 49.2, 45.6 and 42.8 µg m−3, CO2, with mean values of 500, 426, 394 and 424 µg m−3 and PM10 30.2, 31.1, 28.8 and 30.1 µg m−3.
The correlation relationships between air quality dates have been estimated by the Konstanz Information Miner (KNIME) “Linear Correlation” algorithms. Figure 8 shows the linear correlation workflow of KNIME.
Table 3, Table 4 and Table 5 demonstrate the period 3 linear correlation matrices on 22.03.2019. Table 3 demonstrates the period 1 linear correlation matrix. There was a positive correlation between CO–CO2, NO2–humidity and NO2–temperature at values of 0.943, 0.871, 0.755, respectively, during the period when the household was asleep. In addition, there were 0.979, 0.911 positive and 0.941 negative correlations between time–CO, time–CO2 and time–NO2, respectively. There was a strong negative correlation between climate parameters and values of CO and CO2 and a strong positive correlation between climate parameters and values of NO2. On the other hand, the correlation between PM10 and gas concentrations and climate parameters were minuscule. The findings indicate that in period 1 there was an elevated positive and negative correlation between gas concentrations and climatic parameters, which represents sleep hours.
Table 4 demonstrates the period 2 linear correlation matrix. There was a positive correlation between CO–CO2. CO–NO2 and NO2–CO2 at values of 0.966, 0.881, 0.861, respectively, and a negative correlation of 0.915 for temperature–humidity during this period, in which households are undertaking domestic activities (cooking, cleaning, washing, etc.). There were strong negative correlations between time, CO, CO2, humidity and NO2 at −0.844, −0.752, −0.735 and −0.669 during this period. In addition, this period’s correlations between PM10 value and gas levels and climate parameters were very low.
The linear correlation matrix provided in Table 5 belongs to period 3, in which families carry out activities such as eating and resting. There was a positive correlation between CO–NO2 and CO–CO2 at 0.833, 0.671, respectively, during this period. Furthermore, there was also a positive correlation between time–CO, time–NO2, time–CO2 and time–PM10 at 0.968, 0.846, 0.622 and 0.407, respectively.
We can conclude that the cost of the proposed e-nose measurement system is very low compared to commercial products sold on the market. Moreover, the majority of domestic air quality meters available for commercial use measure only a restricted amount of air quality and climate parameters. In this system, CO, CO2, NO2, PM10, and six parameters of temperature and humidity can be evaluated. Another significant advantage is that our measuring system is IoT-based and provides users with real-time data transfer through its mobile interface. The major drawback of the proposed e-nose system is that no comparison and calibration is conducted with any conventional measuring system. The measuring precision of the system is equivalent to the measuring precision indicated by manufacturers. To rectify this, in our future studies the measuring system will be calibrated first, then the sensor node created and longer-term readings made. Thus, the change in IAQ through individual activities will be disclosed more obviously.

5. Conclusions

Although many people spend most of their lives indoors, they have very limited information about the air quality in their environment. IAQ, which plays an especially important role in the health of children and the elderly, should be measured and necessary ventilation measures should be taken. In recent years, individual air quality measuring devices have been produced owing to the developing information communication technologies, Wi-Fi based microcontrollers and low-cost sensors.
In this study, an IoT-based personalized air quality measurement and monitoring system was proposed by using air quality sensors and DIY approach. The developed e-nose measurement system made data measurements at one-minute intervals and recorded these data to the cloud server. The measurement data can be monitored instantaneously via the Blynk mobile interface, and if the limit values are exceeded, the application sends a notification to the user to take the necessary measures.
According to the four-day measurement results, the following inferences have been obtained:
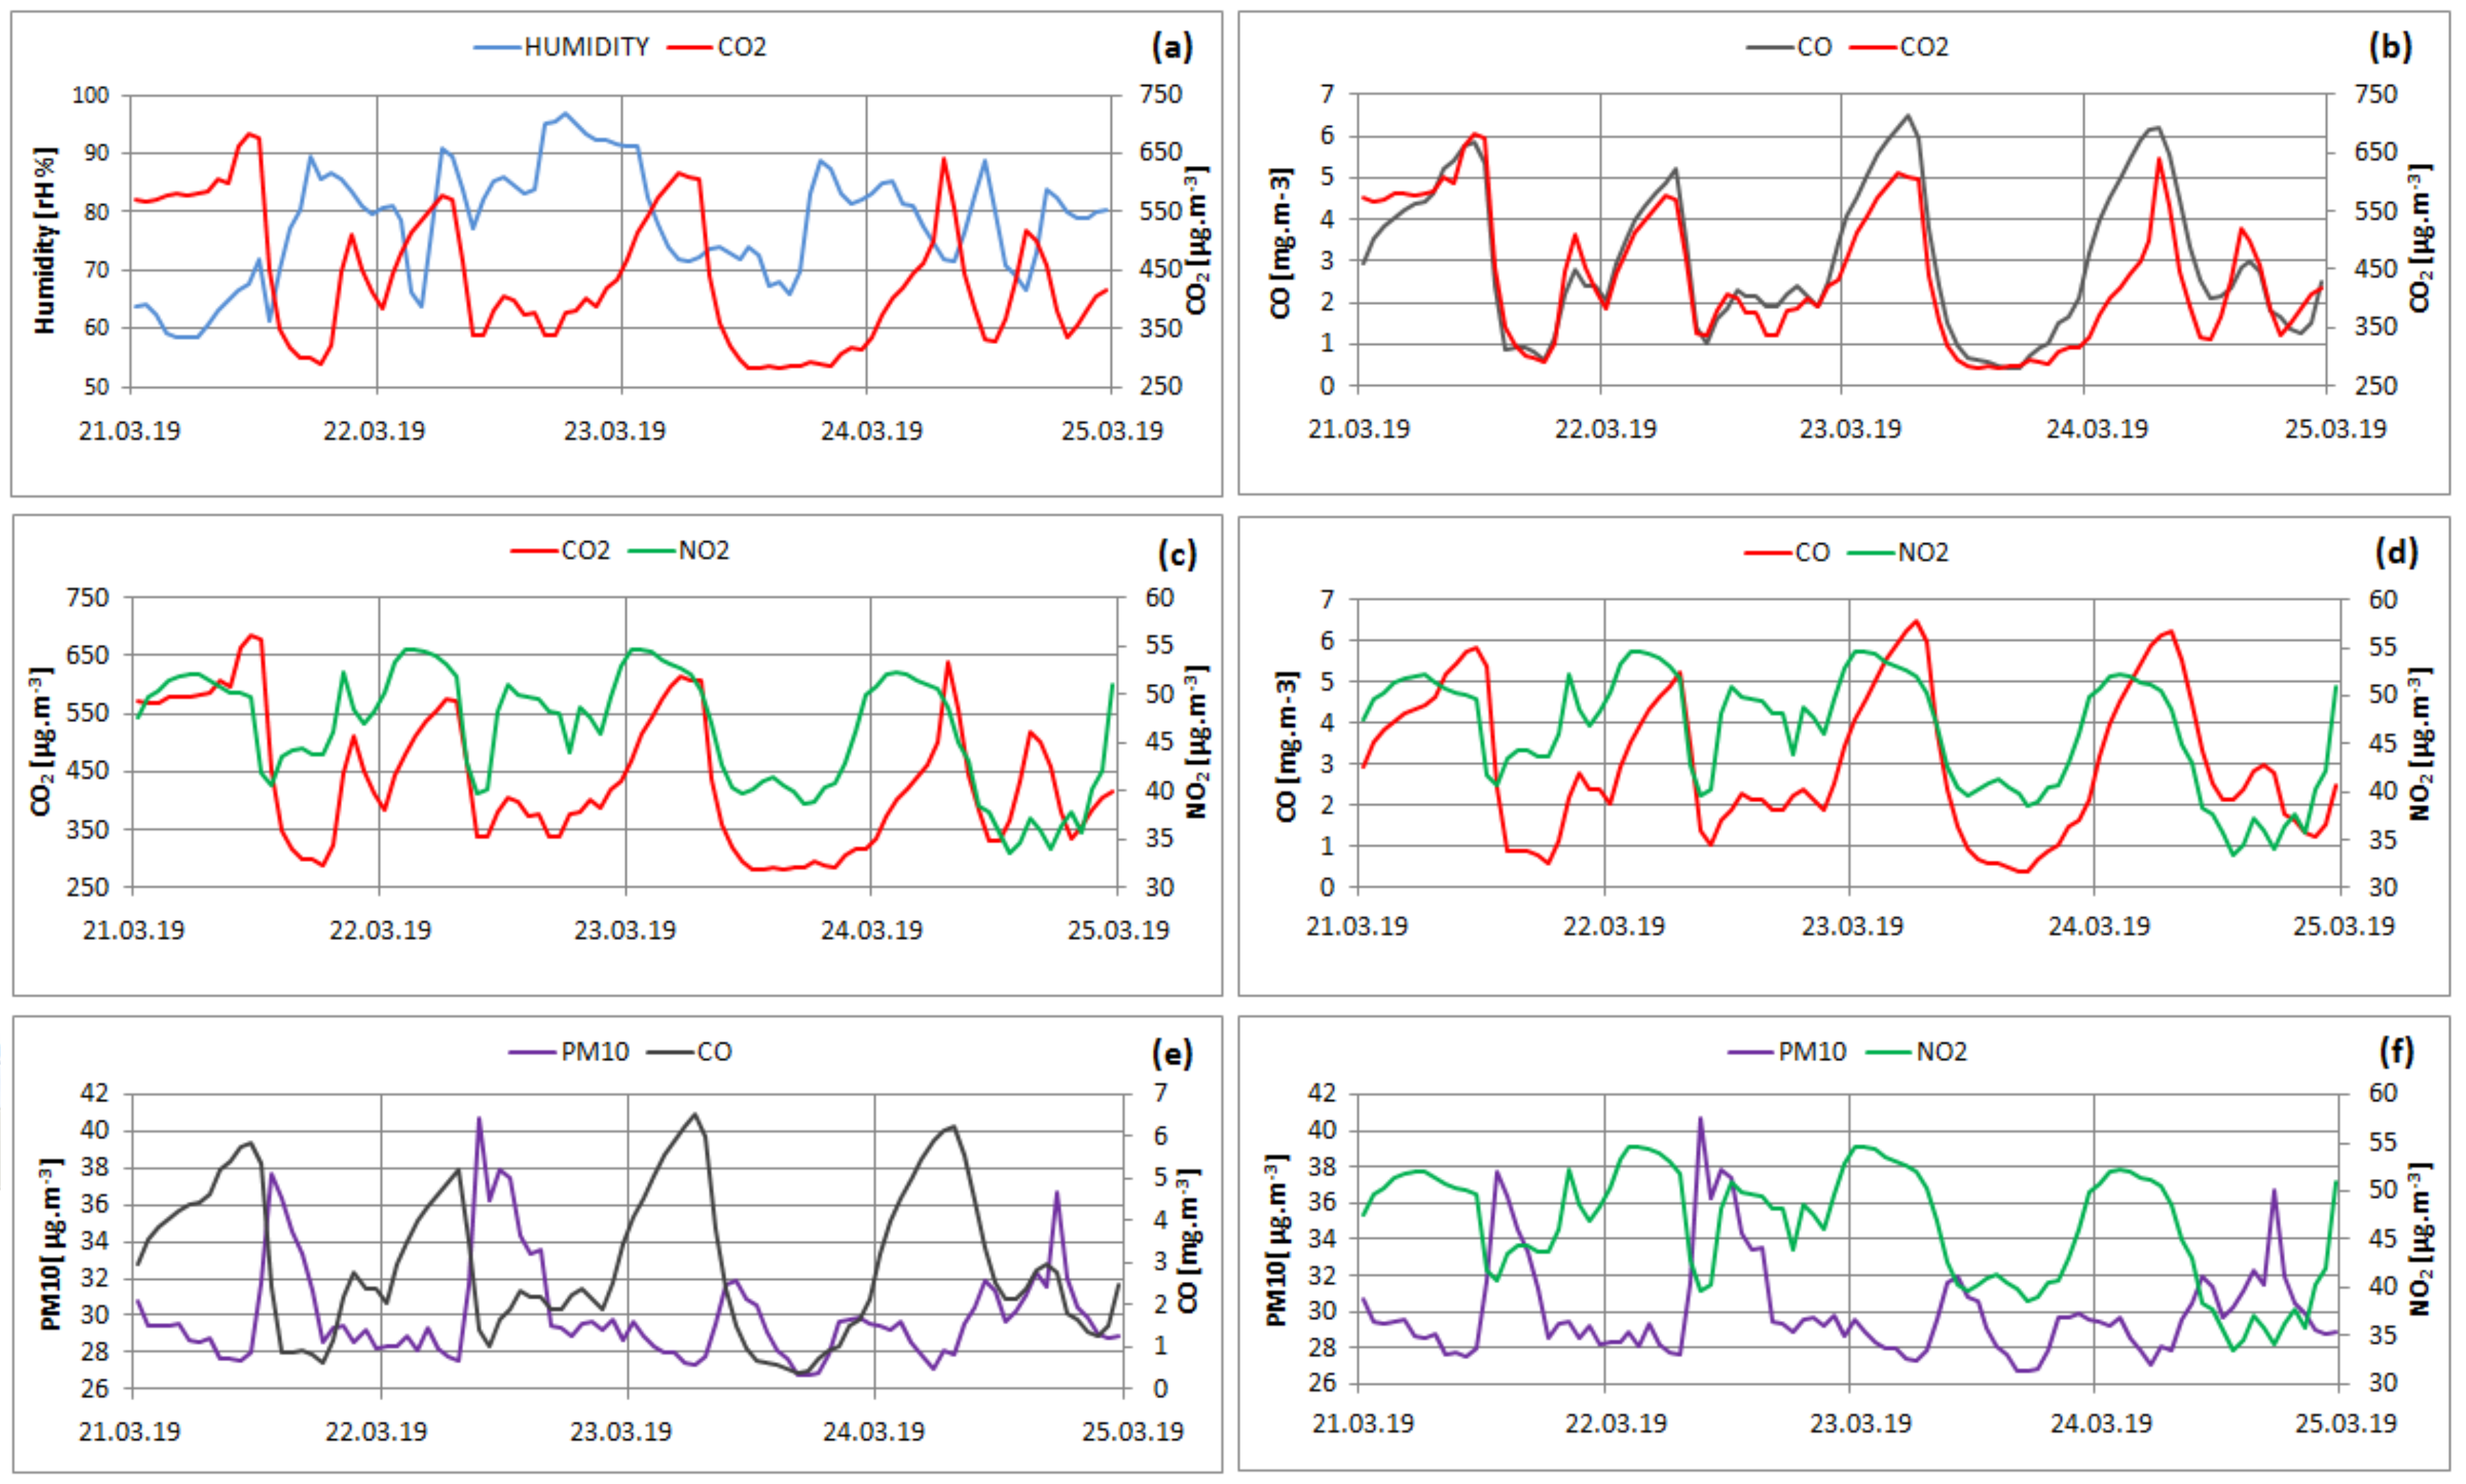
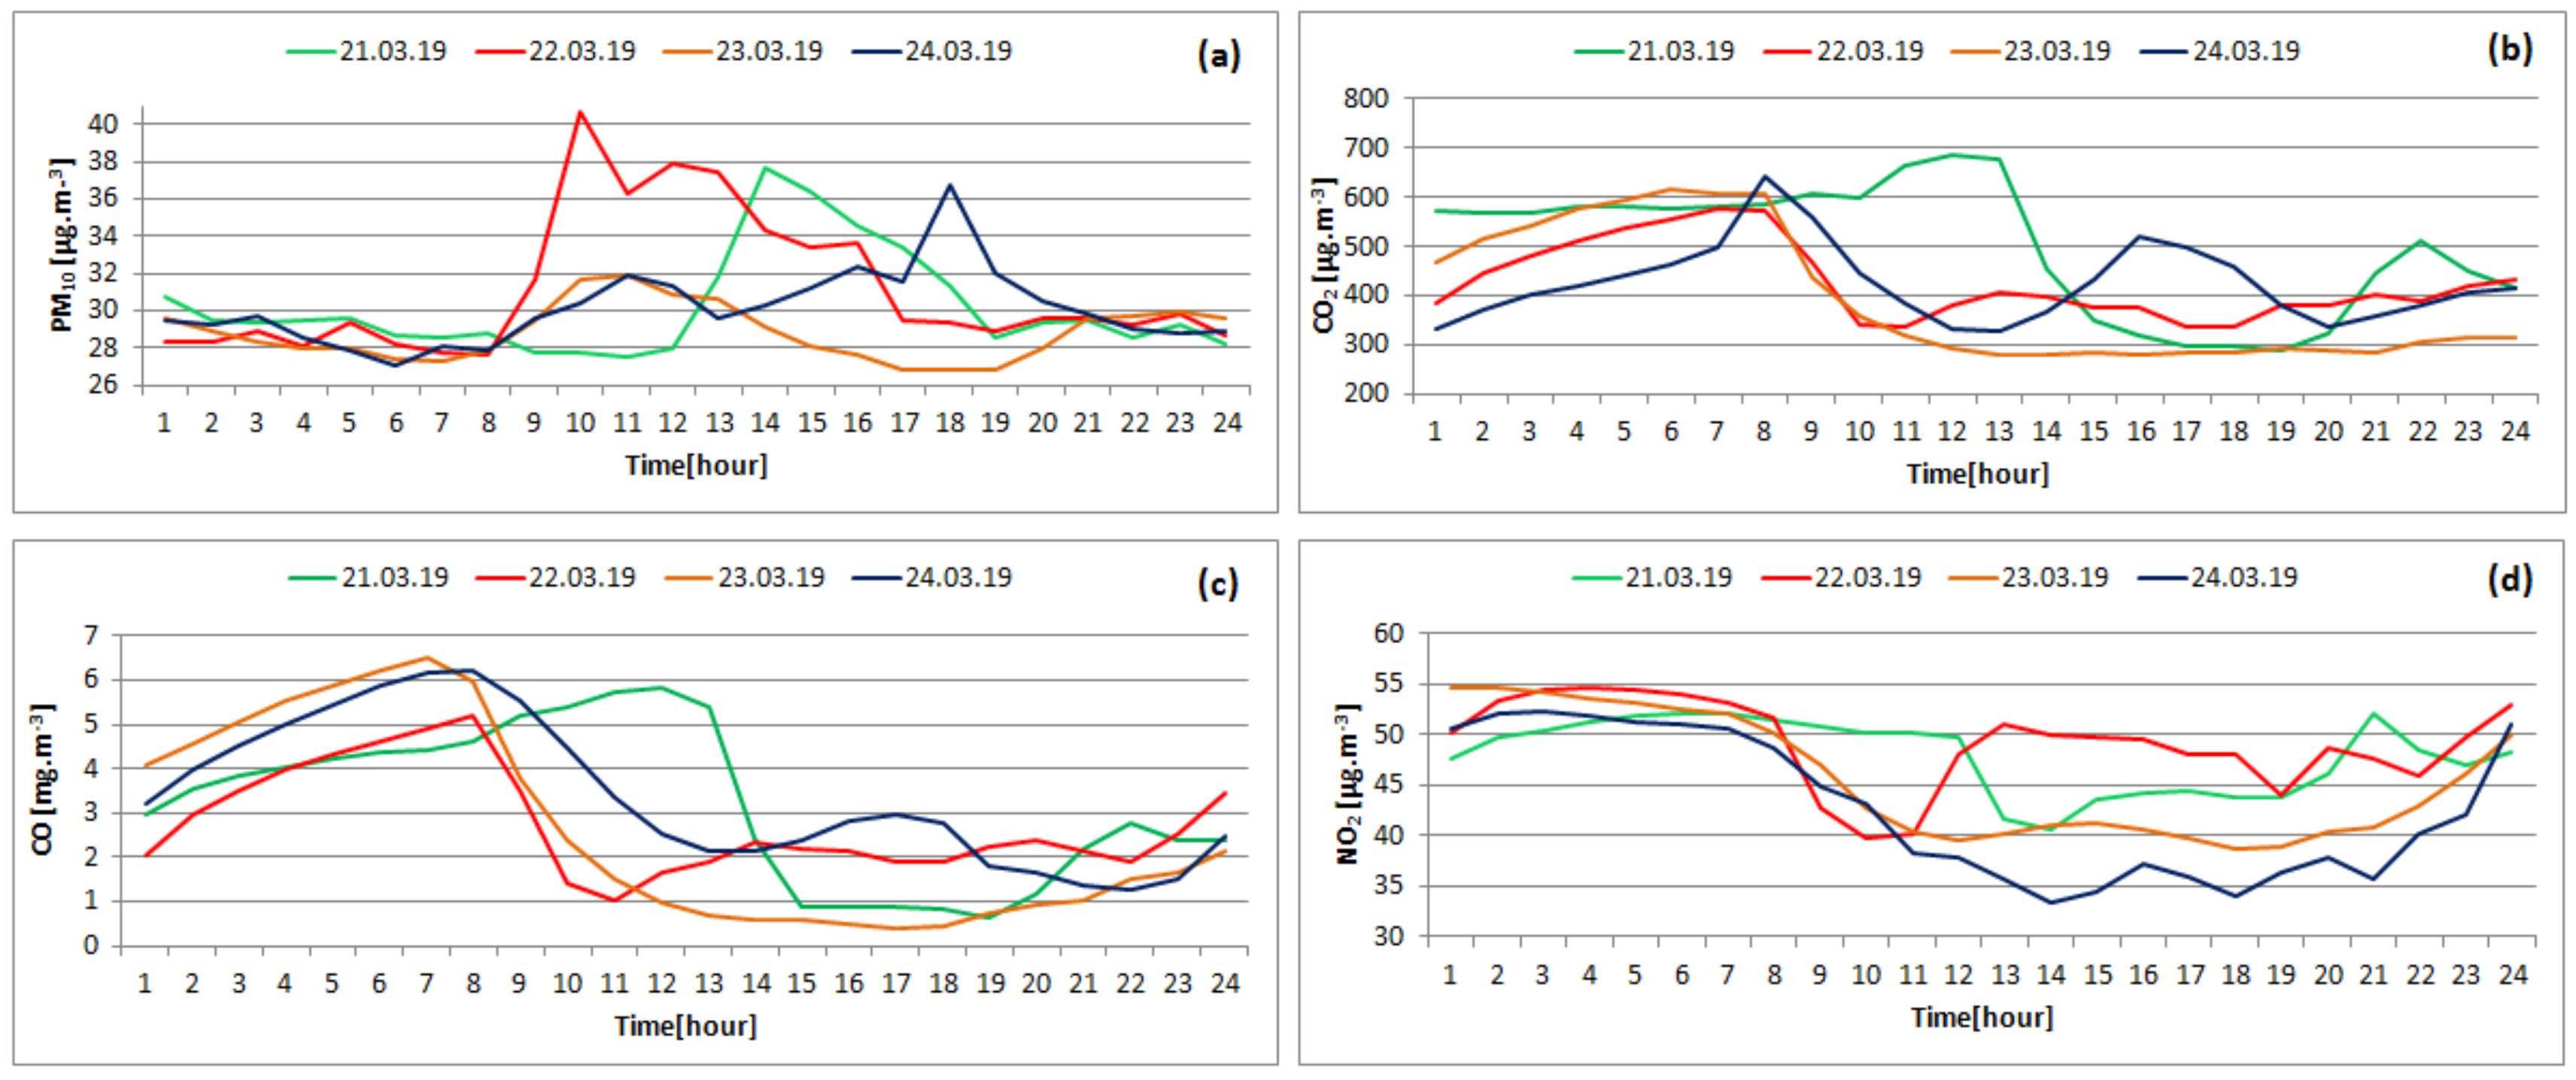
  • IAQ is directly related to the number of people in the household and the activities carried out in the household.
  • Activities such as cooking, sleeping, cleaning have a significant effect on CO, NO2 and CO2 gas concentrations.
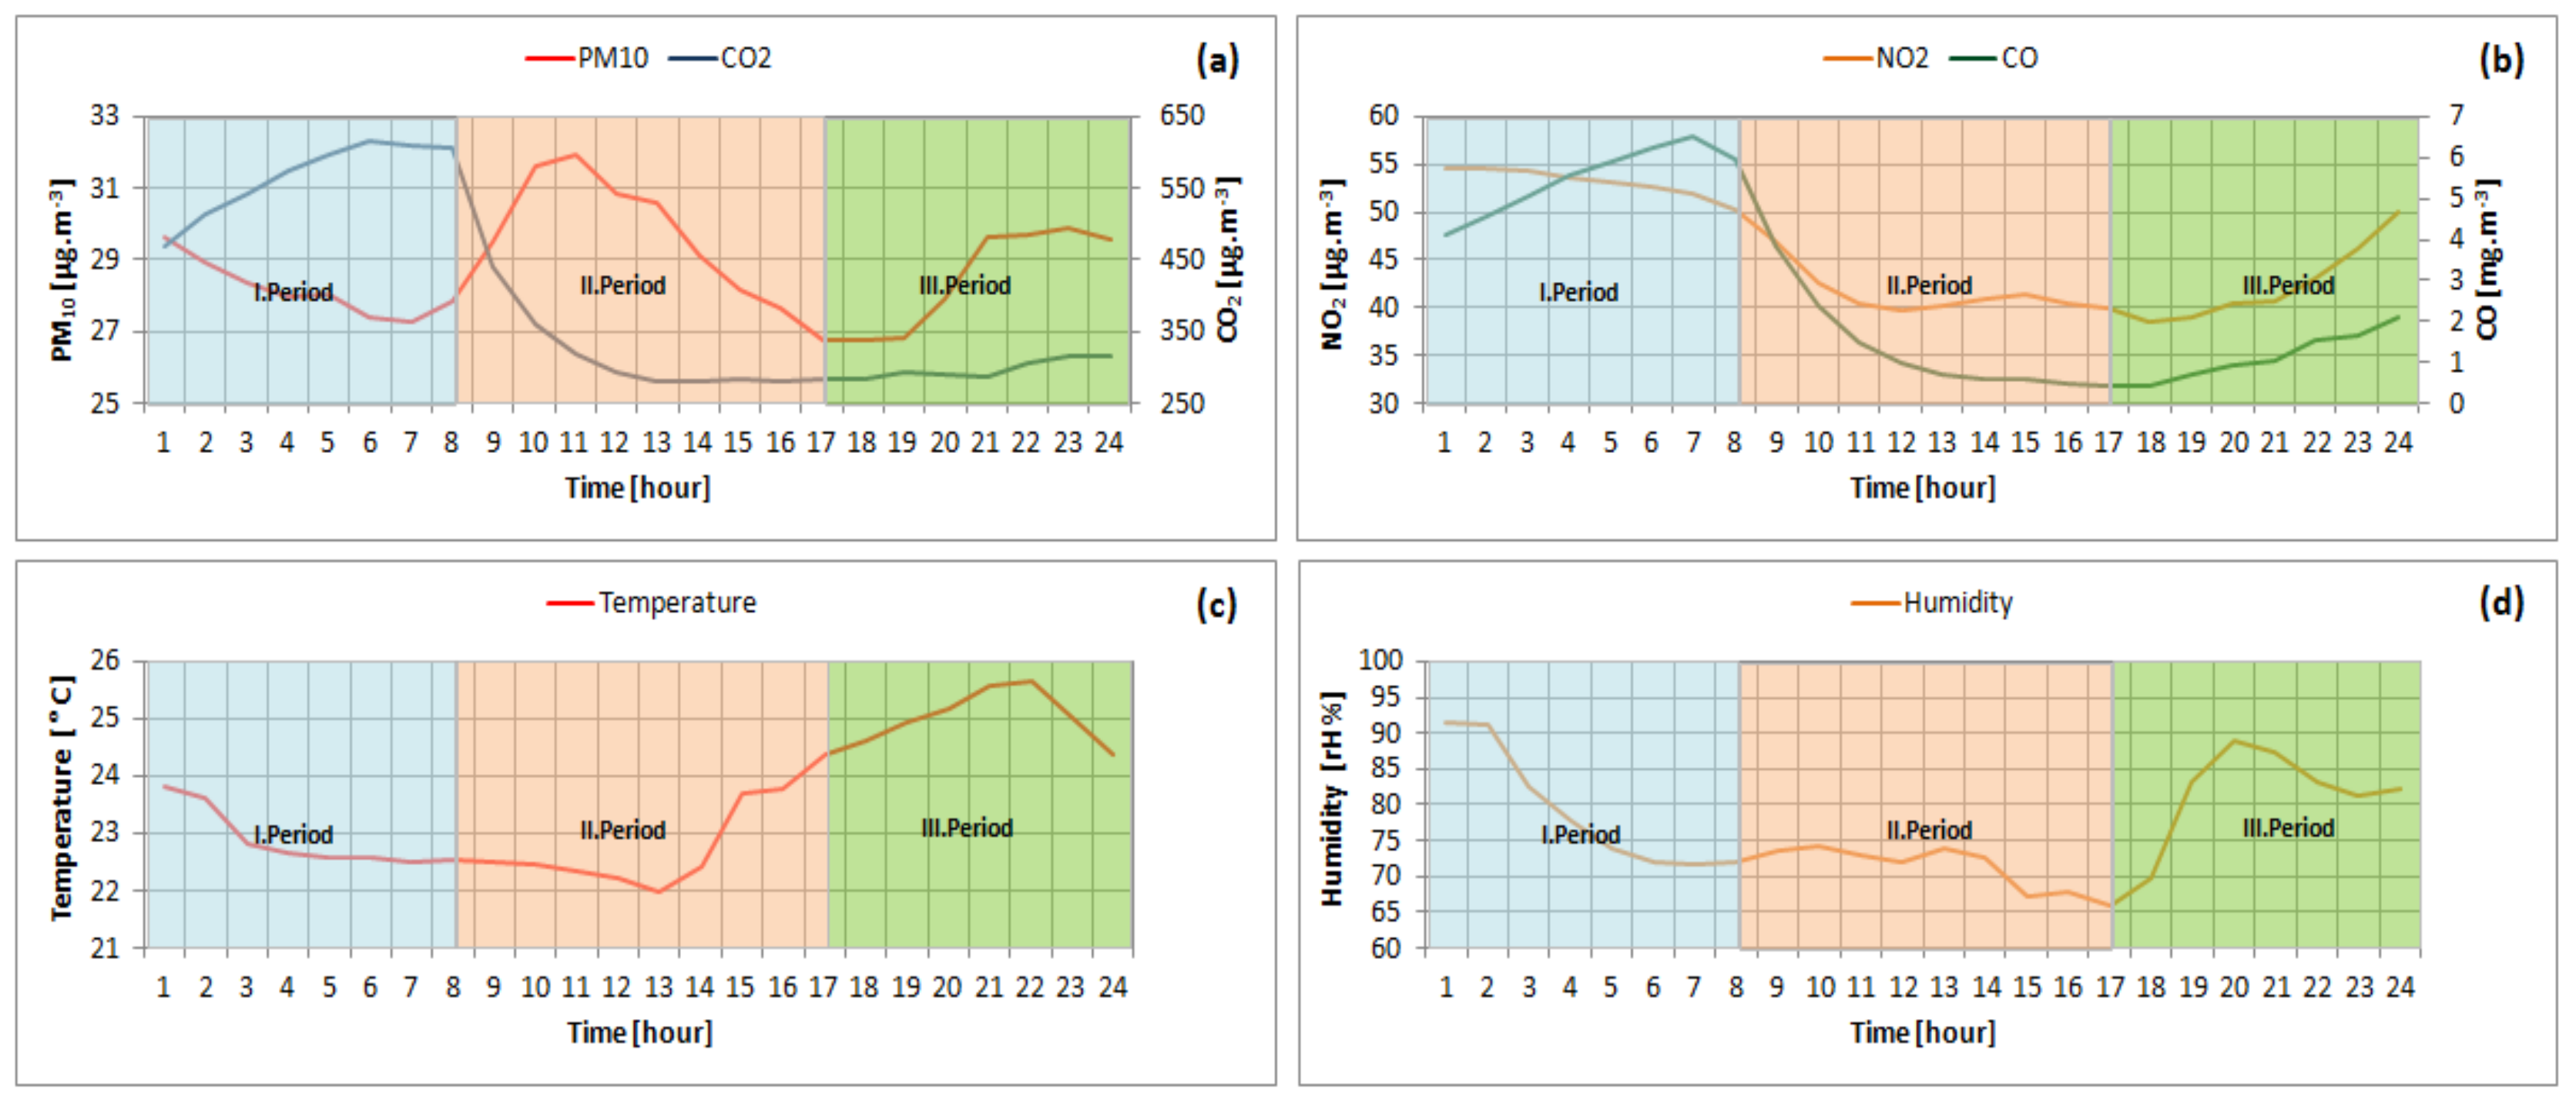
  • CO, NO2, CO2 gas concentration values of the house reach the highest level during the sleep period (period 1). During this period, PM10 concentration has the lowest value.
  • PM10 concentration reaches the highest level in period 2, when daily routine tasks such as cleaning and house arrangement are carried out.
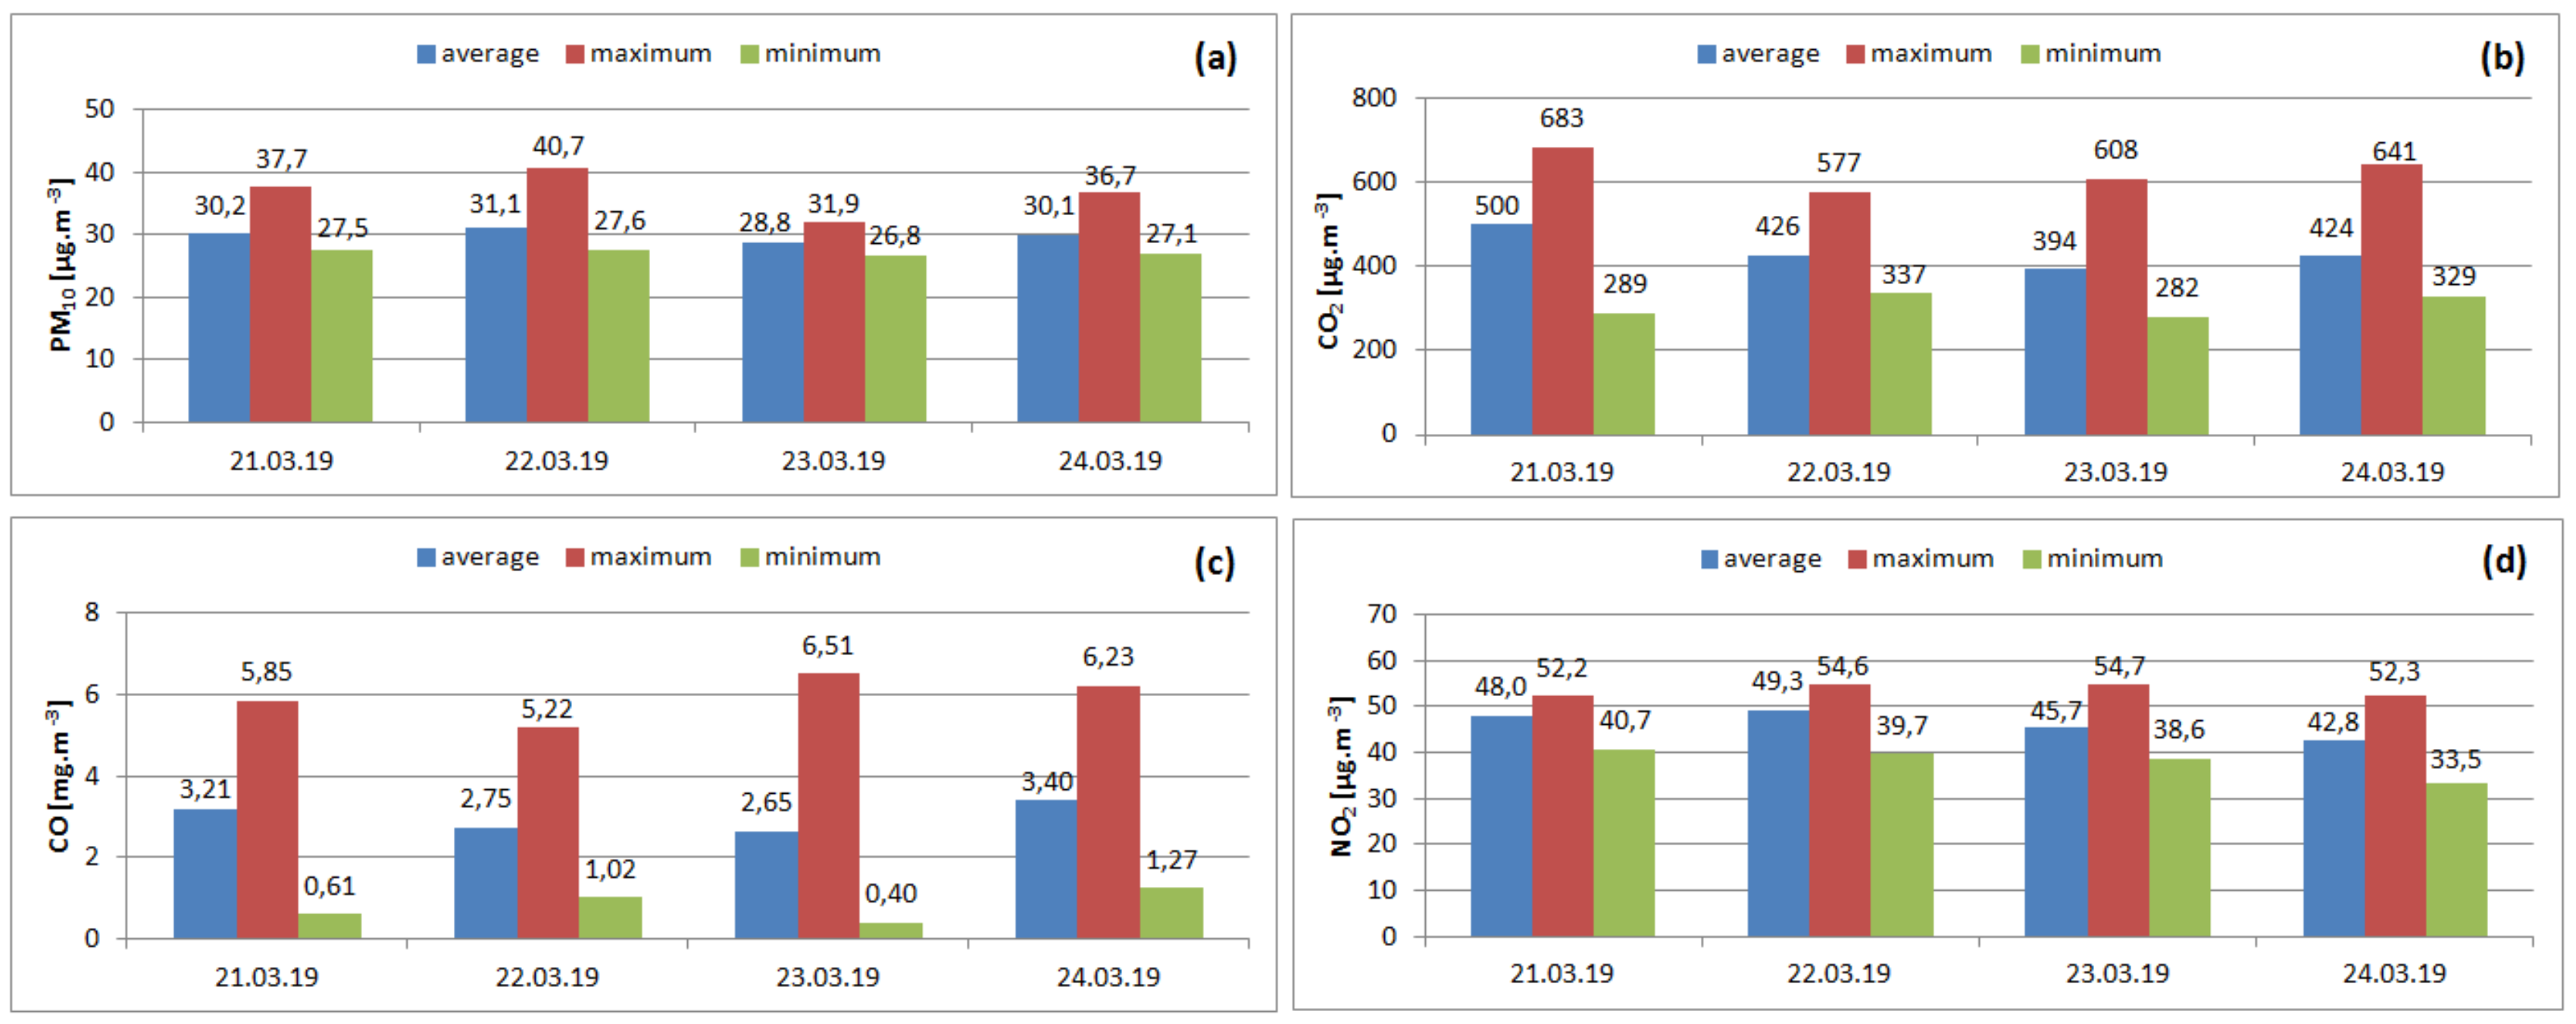
  • When the daily maximum and minimum values were taken into consideration, there was a 16-fold daily maximum change on day 3 in CO concentration, with minimum values of 0.4 mg m−3 and maximum 6.51 mg m−3.
  • The largest change in PM10 concentration was achieved with a minimum of 27.6 µg m−3 and a maximum of 40.7 µg m m−3 on day 2, resulting in a 47% change.
  • Although CO and CO had the lowest concentration in period 3, NO2 had the lowest concentration in period 2.
  • A rapid decrease in CO, NO2, CO2 gas concentrations was observed from the moment of natural ventilation, while a concurrent increase in PM10 was observed.
  • In period 1, the highest positive correlations occurred between time–CO and CO–CO2; the lowest negative correlations occurred between CO–humidity and time–humidity.
  • In period 2, the largest positive correlations occurred between CO–CO2 and CO–NO2, whereas the smallest negative correlations occurred between temp–humidity and time–CO.
  • The highest positive correlations between time–CO, time–NO2 and CO–NO2 occurred in period 3. There was no negative correlation between the weather parameters and gas concentrations during this period.
IAQ has been observed to change depending on the daily activities of the inhabitants. Low air quality is undoubtedly an important parameter that directly affects our health. Even simple measures such as opening only windows to reduce the concentration of harmful gases in the environment can significantly improve IAQ. The numerical data obtained show that the e-nose system is a feature that can contribute to a healthier living environment. In future studies, it is planned to model the effects of individual activities on IAQ by using the e-nose air quality measurement system used in this study.

Author Contributions

Conceptualization, M.T. and H.G.; methodology, H.G.; software, M.T.; validation, M.T.; formal analysis, M.T.; investigation, M.T. and H.G.; visualization, M.T. and H.G.; resources, H.G.; data curation, M.T.; writing—original draft preparation, M.T.; review and editing, H.G.

Funding

This research received no external funding.

Conflicts of Interest

The authors declare no conflict of interest.

References

  1. Sharma, A.; Mitra, A.; Sharma, S.; Roy, S. Estimation of Air Quality Index from Seasonal Trends Using Deep Neural Network. In Proceedings of the International Conference on Artificial Neural Networks, Island of Rhodes, Greece, 5–7 October 2018; pp. 511–521. [Google Scholar]
  2. Leung, D.Y. Outdoor-indoor air pollution in urban environment: Challenges and opportunity. Front. Environ. Sci. 2015, 2, 69. [Google Scholar] [CrossRef]
  3. De Gennaro, G.; Dambruoso, P.R.; Loiotile, A.D.; Di Gilio, A.; Giungato, P.; Tutino, M.; Porcelli, F. Indoor air quality in schools. Environ. Chem. Lett. 2014, 12, 467–482. [Google Scholar] [CrossRef]
  4. Chen, M.; Yang, J.; Hu, L.; Hossain, M.S.; Muhammad, G. Urban healthcare big data system based on crowd sourced and cloud-based air quality indicators. IEEE Commun. Mag. 2018, 56, 14–20. [Google Scholar] [CrossRef]
  5. Marques, G. Ambient Assisted Living and Internet of Things. In Harnessing the Internet of Everything (IoE) for Accelerated Innovation Opportunities; IGI Global: Hershey, PA, USA, 2019; pp. 100–115. [Google Scholar] [Green Version]
  6. Wei, W.; Ramalho, O.; Mandin, C. Indoor air quality requirements in green building certifications. Build. Environ. 2015, 92, 10–19. [Google Scholar] [CrossRef]
  7. Neira, M.; Prüss-Ustün, A.; Mudu, P. Reduce air pollution to beat NCDs: From recognition to action. Lancet 2018, 392, 1178–1179. [Google Scholar] [CrossRef]
  8. Seguel, J.M.; Merrill, R.; Seguel, D.; Campagna, A.C. Indoor air quality. Am. J. Lifestyle Med. 2017, 11, 284–295. [Google Scholar] [CrossRef] [PubMed]
  9. Kampa, M.; Castanas, E. Human health effects of air pollution. Environ. Pollut. 2008, 151, 362–367. [Google Scholar] [CrossRef]
  10. Annesi-Maesano, I.; Baiz, N.; Banerjee, S.; Rudnai, P.; Rive, S.; Sinphonie Group. Indoor air quality and sources in schools and related health effects. J. Toxicol. Environ. Health Part B 2013, 16, 491–550. [Google Scholar] [CrossRef]
  11. Tong, Z.; Chen, Y.; Malkawi, A.; Liu, Z.; Freeman, R.B. Energy saving potential of natural ventilation in China: The impact of ambient air pollution. Appl. Energy 2016, 179, 660–668. [Google Scholar] [CrossRef] [Green Version]
  12. Chen, Y.; Tong, Z.; Wu, W.; Samuelson, H.; Malkawi, A.; Norford, L. Achieving natural ventilation potential in practice: Control schemes and levels of automation. Appl. Energy 2019, 235, 1141–1152. [Google Scholar] [CrossRef]
  13. Jones, A.P. Indoor air quality and health. Atmos. Environ. 1999, 33, 4535–4564. [Google Scholar] [CrossRef]
  14. Gökozan, H.; Taştan, M.; Sarı, A. Smart Cities and Management Strategies; 2017 Socio-Economic Strategies; Lambert Academic Publishing: Riga, Latvia, 2017; pp. 115–123. ISBN 978-3-330-06982-4. [Google Scholar]
  15. Gubbi, J.; Buyya, R.; Marusic, S.; Palaniswami, M. Internet of Things (IoT): A vision, architectural elements, and future directions. Future Gener. Comput. Syst. 2013, 29, 1645–1660. [Google Scholar] [CrossRef] [Green Version]
  16. Rathore, P.; Rao, A.S.; Rajasegarar, S.; Vanz, E.; Gubbi, J.; Palaniswami, M. Real-time urban microclimate analysis using internet of things. IEEE Internet Things J. 2018, 5, 500–511. [Google Scholar] [CrossRef]
  17. Taştan, M. IoT Based Wearable Smart Health Monitoring System. Celal Bayar Univ. J. Sci. 2018, 14, 343–350. [Google Scholar] [CrossRef] [Green Version]
  18. Pitarma, R.; Marques, G.; Caetano, F. Monitoring indoor air quality to improve occupational health. In New Advances in Information Systems and Technologies; Springer: Cham, Switzerland, 2016; pp. 13–21. [Google Scholar]
  19. Yang, Y.; Liu, L.; Xu, C.; Li, N.; Liu, Z.; Wang, Q.; Xu, D. Source apportionment and influencing factor analysis of residential indoor PM2. 5 in Beijing. Int. J. Environ. Res. Public Health 2018, 15, 686. [Google Scholar] [CrossRef] [PubMed]
  20. Canha, N.; Lage, J.; Galinha, C.; Coentro, S.; Alves, C.; Almeida, S. Impact of Biomass Home Heating, Cooking Styles, and Bread Toasting on the Indoor Air Quality at Portuguese Dwellings: A Case Study. Atmosphere 2018, 9, 214. [Google Scholar] [CrossRef]
  21. Rumchev, K.; Soares, M.; Zhao, Y.; Reid, C.; Huxley, R. The association between indoor air quality and adult blood pressure levels in a high-income setting. Int. J. Environ. Res. Public Health 2018, 15, 2026. [Google Scholar] [CrossRef]
  22. Wang, S.; Bolling, K.; Mao, W.; Reichstadt, J.; Jeste, D.; Kim, H.C.; Nebeker, C. Technology to Support Aging in Place: Older Adults’ Perspectives. Healthc. Multidiscip. Digit. Publ. Inst. 2019, 7, 60. [Google Scholar] [CrossRef]
  23. Alvarez-Campana, M.; López, G.; Vázquez, E.; Villagrá, V.; Berrocal, J. Smart CEI moncloa: An iot-based platform for people flow and environmental monitoring on a Smart University Campus. Sensors 2017, 17, 2856. [Google Scholar] [CrossRef]
  24. Cho, H. An Air Quality and Event Detection System with Life Logging for Monitoring Household Environments. In Smart Sensors at the IoT Frontier; Springer: Cham, Switzerland, 2017; pp. 251–270. [Google Scholar]
  25. Wong, M.; Yip, T.; Mok, E. Development of a personal integrated environmental monitoring system. Sensors 2014, 14, 22065–22081. [Google Scholar] [CrossRef]
  26. Salamone, F.; Danza, L.; Meroni, I.; Pollastro, M. A Low-Cost Environmental Monitoring System: How to Prevent Systematic Errors in the Design Phase through the Combined Use of Additive Manufacturing and Thermographic Techniques. Sensors 2017, 17, 828. [Google Scholar] [CrossRef] [PubMed]
  27. Popa, A.; Hnatiuc, M.; Paun, M.; Geman, O.; Hemanth, D.J.; Dorcea, D.; Ghita, S. An Intelligent IoT-Based Food Quality Monitoring Approach Using Low-Cost Sensors. Symmetry 2019, 11, 374. [Google Scholar] [CrossRef]
  28. Marques, G.; Pitarma, R. An indoor monitoring system for ambient assisted living based on internet of things architecture. Int. J. Environ. Res. Public Health 2016, 13, 1152. [Google Scholar] [CrossRef] [PubMed]
  29. Marques, G.; Pitarma, R. A cost-effective air quality supervision solution for enhanced living environments through the internet of things. Electronics 2019, 8, 170. [Google Scholar] [CrossRef]
  30. Marques, G.; Pitarma, R. Monitoring health factors in indoor living environments using internet of things. In Proceedings of the World Conference on Information Systems and Technologies, Madeira, Portugal, 11–13 April 2017; pp. 785–794. [Google Scholar]
  31. Marques, G.; Roque Ferreira, C.; Pitarma, R. A system based on the Internet of Things for real-time particle monitoring in buildings. Int. J. Environ. Res. Public Health 2018, 15, 821. [Google Scholar] [CrossRef] [PubMed]
  32. GP2Y1010AU0F: Compact Optical Dust Sensor. Available online: http://www.socle-tech.com/doc/IC%20Channel%20Product/sharp%20products.pdf (accessed on 11 June 2019).
  33. Zhengzhou Winsen Electronics Technology CO. Ltd. MH-Z14 CO2 Module Datasheet. 2013. Available online: http://www.futurlec.com/Datasheet/Sensor/MH-Z14.pdf (accessed on 17 June 2019).
  34. MICS-4514 Datasheet. Available online: http://files.manylabs.org/datasheets/MICS-4514.pdf (accessed on 11 June 2019).
  35. Aosong Electronics CO. Ltd. DHT22 Temperature and Humidity Sensor Datasheet. Available online: https://www.sparkfun.com/datasheets/Sensors/Temperature/DHT22.pdf (accessed on 13 June 2019).
  36. Hong, C.S.; Ghani, A.S.A.; Khairuddin, I.M. Development of an Electronic Kit for detecting asthma in Human Respiratory System. In Proceedings of the IOP Conference Series: Materials Science and Engineering, Yogyakarta, Indonesia, 7–8 December 2017; IOP Publishing: Bristol, UK, 2018; Volume 319, p. 012040. [Google Scholar]
  37. Bimaridi, A.; Putra, K.D.; Djunaedy, E.; Kirom, M.R. Assasment of Outside Air Supply for Split AC system–Part A: Affordable Instrument. Procedia Eng. 2017, 170, 248–254. [Google Scholar] [CrossRef]
  38. Suárez, J.I.; Arroyo, P.; Lozano, J.; Herrero, J.L.; Padilla, M. Bluetooth gas sensing module combined with smartphones for air quality monitoring. Chemosphere 2018, 205, 618–626. [Google Scholar] [CrossRef]
  39. McKercher, G.R.; Vanos, J.K. Low-cost mobile air pollution monitoring in urban environments: A pilot study in Lubbock, Texas. Environ. Technol. 2018, 39, 1505–1514. [Google Scholar] [CrossRef]
  40. Nguyen, T.N.T.; Ha, D.V.; Do, T.N.N.; Nguyen, V.H.; Ngo, X.T.; Phan, V.H.; Bui, Q.H. Air pollution monitoring network using low-cost sensors, a case study in Hanoi, Vietnam. In Proceedings of the IOP Conference Series: Earth and Environmental Science, Pan Pacific Hanoi, Vietnam, 23–24 January 2019; IOP Publishing: Bristol, UK, 2019; Volume 266, p. 012017. [Google Scholar]
  41. Liu, H.Y.; Schneider, P.; Haugen, R.; Vogt, M. Performance assessment of a low-cost PM2.5 sensor for a near four-month period in Oslo, Norway. Atmosphere 2019, 10, 41. [Google Scholar] [CrossRef]
  42. Budde, M.; El Masri, R.; Riedel, T.; Beigl, M. Enabling low-cost particulate matter measurement for participatory sensing scenarios. In Proceedings of the 12th International Conference on Mobile and Ubiquitous Multimedia, Lulea, Sweden, 2–5 December 2013; p. 19. [Google Scholar]
  43. Carminati, M.; Ferrari, G.; Sampietro, M. Emerging miniaturized technologies for airborne particulate matter pervasive monitoring. Measurement 2017, 101, 250–256. [Google Scholar] [CrossRef]
  44. Muangprathub, J.; Boonnam, N.; Kajornkasirat, S.; Lekbangpong, N.; Wanichsombat, A.; Nillaor, P. IoT and agriculture data analysis for smart farm. Comput. Electron. Agric. 2019, 156, 467–474. [Google Scholar] [CrossRef]
  45. Xie, J.; Gao, P.; Wang, W.; Xu, X.; Hu, G. Design of Wireless Sensor Network Bidirectional Nodes for Intelligent Monitoring System of Micro-irrigation in Litchi Orchards. IFAC-PapersOnLine 2018, 51, 449–454. [Google Scholar]
  46. Wijaya, D.R.; Sarno, R.; Zulaika, E.; Sabila, S.I. Development of mobile electronic nose for beef quality monitoring. Procedia Comput. Sci. 2017, 124, 728–735. [Google Scholar] [CrossRef]
Figure 1. The proposed e-nose system architecture.
Applsci 09 03435 g001
Figure 2. Images of the IoT-based e-nose system.
Applsci 09 03435 g002
Figure 3. Mobile user interface developed for the e-nose system.
Applsci 09 03435 g003
Figure 4. Relationship between gases during four-day measurement, (a) Humidity- CO2, (b) CO-CO2, (c) CO2- NO2, (d) CO-NO2, (e) PM10-CO, (f) CO-NO2.
Applsci 09 03435 g004
Figure 5. Daily changes of PM and gases, (a) PM10, (b) CO2, (c) CO, (d) NO2.
Applsci 09 03435 g005
Figure 6. Hourly changes of climate parameters and gases values of day 3, (a) PM10 - CO2, (b) NO2-CO, (c) temperature, (d) humidity.
Applsci 09 03435 g006
Figure 7. Minimum, maximum and average values of daily gas concentrations and PM, (a) PM10, (b) CO2, (c) CO, (d) NO2
Applsci 09 03435 g007
Figure 8. Workflow of Linear Correlation in KNIME application.
Applsci 09 03435 g008
Table 1. Electronic features of the sensors in the IoT-based e-nose measuring system.
IDEquipment NameTypesElectronic Features
1CO2 gas sensorMH-Z14
[36,37]
Detection range 0–10000 ppm; operating voltage: 4–6 V; accuracy: ± 50 ppm ±5%; resolution: 5 ppm; output Voltage: 0.4–2 V; operating temperature: 0–50 °C
2NO2, CO gas sensorMICS-4514
[38,39,40]
Detection range 1–1000 ppm (CO); 0.05–5 ppm (NO2); operating voltage: 4.9–5.1 V; operating temperature: −35–85 °C; heating current: 58 mA
3Dust sensorGP2Y1010AU
[41,42,43]
Operating voltage: 5 V; output voltage: 0.9 (no dust)–3.4 V; operating current: max 20 mA; operating temperature: −10 to 65 °C, accuracy ±15%
4Temperature and Humidity sensorDHT22
[44,45,46]
Temperature range: −40 °C to 80 °C; humidity range: 0% to 100%; operating voltage: 3.5–5.5 V; operating current: 60 uA; output: serial; resolution: 0.1 °C and ±1 rH%; accuracy: ±0.5 °C and ±1 rH%; resolution: Temperature and humidity are 16-bit.
Table 2. Cost table for IoT-based e-nose measurement system.
ComponentCost ($)
ESP-32 Controller5
GP2Y1010AU Sensor5
MH-Z14 Sensor25
MICS-4514 Sensor20
DHT22 Sensor3
5V Fan3
5V Power Sup.2
PCB3
Plastic Box5
Cable, Socket5
Power Supply/Bank 15
Arduino IDEfree
Blynk IoT Platform5
Total Cost100 $
Table 3. Linear correlation matrix for period 1.
TimeCONO2CO2TempHumidityPM10 1
Time10.979−0.941 0.911−0.866−0.944−0.251
CO 1−0.919 0.943−0.907−0.969−0.254
NO2 1−0.841 0.755 0.871 0.245 0
CO2 1−0.886−0.918−0.213
Temp. 1 0.941 0.248
Humidity 1 0.258
PM10 1 −1
Table 4. Linear correlation matrix for period 2.
TimeCONO2CO2TempHumidityPM10 1
Time1−0.844−0.669−0.752 0.640−0.735−0.242
CO 1 0.881 0.966−0.266 0.415 0.014
NO2 1 0.861−0.098 0.254−0.092 0
CO2 1−0.186 0.314−0.020
Temp. 1−0.915−0.327
Humidity 1 0.317
PM10 1 −1
Table 5. Linear correlation matrix for period 3.
TimeCONO2CO2TempHumidityPM10 1
Time10.9680.8460.6220.2340.3040.407
CO 10.8330.6710.2130.2960.379
NO2 10.4740.2130.3280.347 0
CO2 10.0510.0010.192
Temp. 10.6290.230
Humidity 10.169
PM10 1 −1

