Article

Calibration of Design Buckling Curves for Lateral-Torsional Buckling of Cantilever Beams Made of Glass—Experimental and Numerical Investigations

Department of Structural Engineering and Material Sciences, Unit of Steel Construction and Mixed Building Technology, University of Innsbruck, Technikerstraße 13, 6020 Innsbruck, Austria
*
Author to whom correspondence should be addressed.
Appl. Sci. 2019, 9(16), 3432; https://doi.org/10.3390/app9163432
Submission received: 30 July 2019 / Revised: 16 August 2019 / Accepted: 16 August 2019 / Published: 20 August 2019
(This article belongs to the Section Civil Engineering)

Abstract

:
Using glass as a primary load-carrying element is becoming more and more popular in architecture. Probably the most used application is the single-span girder, but another important system is the cantilever beam, which is widely used, e.g., as a canopy in front of an entrance. Research on the lateral-torsional buckling behavior of glass beams has been typically performed on single-span girders. As a consequence, the design buckling curves provided in literature are usually too conservative for the widely used case of a cantilever beam, which is also related to the loading situation. Therefore, experimental and numerical investigations have been performed for this special case. Based on the obtained results, design buckling curves have been developed and resulted in being more economical than the curves already given in the literature. Among others, information on the shape and size of the real imperfections, a testing device for cantilever beams, and experimentally and numerically obtained load-deflection curves are additional outcomes of the investigations presented here.

1. Introduction

Due to its unique properties, glass has been used in buildings as a so-called “secondary structural glass component”, which means that it is used, for example, in windows or partition walls. In this case, the loads act normally on the glass elements, and the principal stresses result from pure bending. However, nowadays, glass is also used as a “primary structural component”, which means that glass elements are part of the global structure and the loads act in the glass plane. In such cases, the glass elements are typically used as beams or columns. Due to their high slenderness, stability issues must be taken into account.
Different investigations were made on the stability behavior of glass elements, like in [1,2,3,4,5] for the buckling of columns under normal force or in [6,7,8,9,10,11,12,13,14,15] for lateral-torsional buckling (LTB) of beams under bending. The investigations were carried out experimentally as well as analytically and numerically. Single glass panels were taken into account as well as laminated glass beams, with and without lateral supports. Additional information on using glass as a shear-element can be found, for example, in [16].
Especially in the case of lateral–torsional buckling problems, all the investigations mentioned above were made on single-span girders. However, a frequent application of glass beams in bending is the cantilever beam, e.g., as a canopy in front of an entrance. Unfortunately, there is little information available on this kind of usage, see [17,18].
By designing glass components, the selection of an appropriate glass type to ensure the safety requirements is an essential step. For “secondary structural glass components”, the requirements, depending on their usage, are already regulated in standards and will not be discussed any further (see [19]). For “primary structural glass components”, higher requirements are usually placed on the safety level. Important aspects here are the glass strength, the robustness against local damage or local impacts, and the redundancy of the structure. These aspects will be further discussed (also compare [19]).
In buildings, float-glass is the mainly used glass type for “secondary structural glass components”. By thermal treatment, float-glass can be further processed to fully tempered glass (FT) or heat strengthened glass (HS). Due to the thermal-induced stresses (compressive stresses at the surfaces), the thermally treated glass types can carry higher loads, which is a great advantage, especially for use as a “primary structural glass component”. Besides, thermally treated glass types are more resistant to local impacts, e.g., due to hail or vandalism. In contrast to float-glass, however, thermally treated glass is more expensive.
Single glass panels can be further assembled to “laminated safety glass” by connecting them with an interlayer (typically PVB-foil). If one of the glass panels breaks, the shards will stick to the foil. This reduces the risk of injury, and the intact glass panels can take over the load of the broken panel. This effect achieves a certain (local) redundancy of the glass component. The outer glass panels can also be regarded as protective layers of the inner panels. Due to the brittle nature of the material, the use of a single glass panel for “primary structural glass components” is not recommended. It should also be noted that the redundancy should not be limited to the glass component alone. Instead, the (global) redundancy of the whole construction should always be considered, which means, if a glass component fails, a safe load transfer via alternative load paths should be possible.
As mentioned above, the focus of the presented investigations is on the load-carrying behavior of cantilever beams made of glass, taking stability issues into account. Based on the previous explanations, the research goals and methods are defined as follows:
Research goals: Due to the widespread application of “primary structural glass components” used as cantilever beams, separate investigations on the lateral-torsional buckling behavior were carried out and presented in this paper. These investigations can be seen as a complement to the already performed work on this topic. The main goal of the presented research was to develop more economical design buckling curves for cantilever beams used as a canopy, taking into account their typical loading situations. Information for numerical simulations, like the shape and size of the imperfections, are additional outcomes.
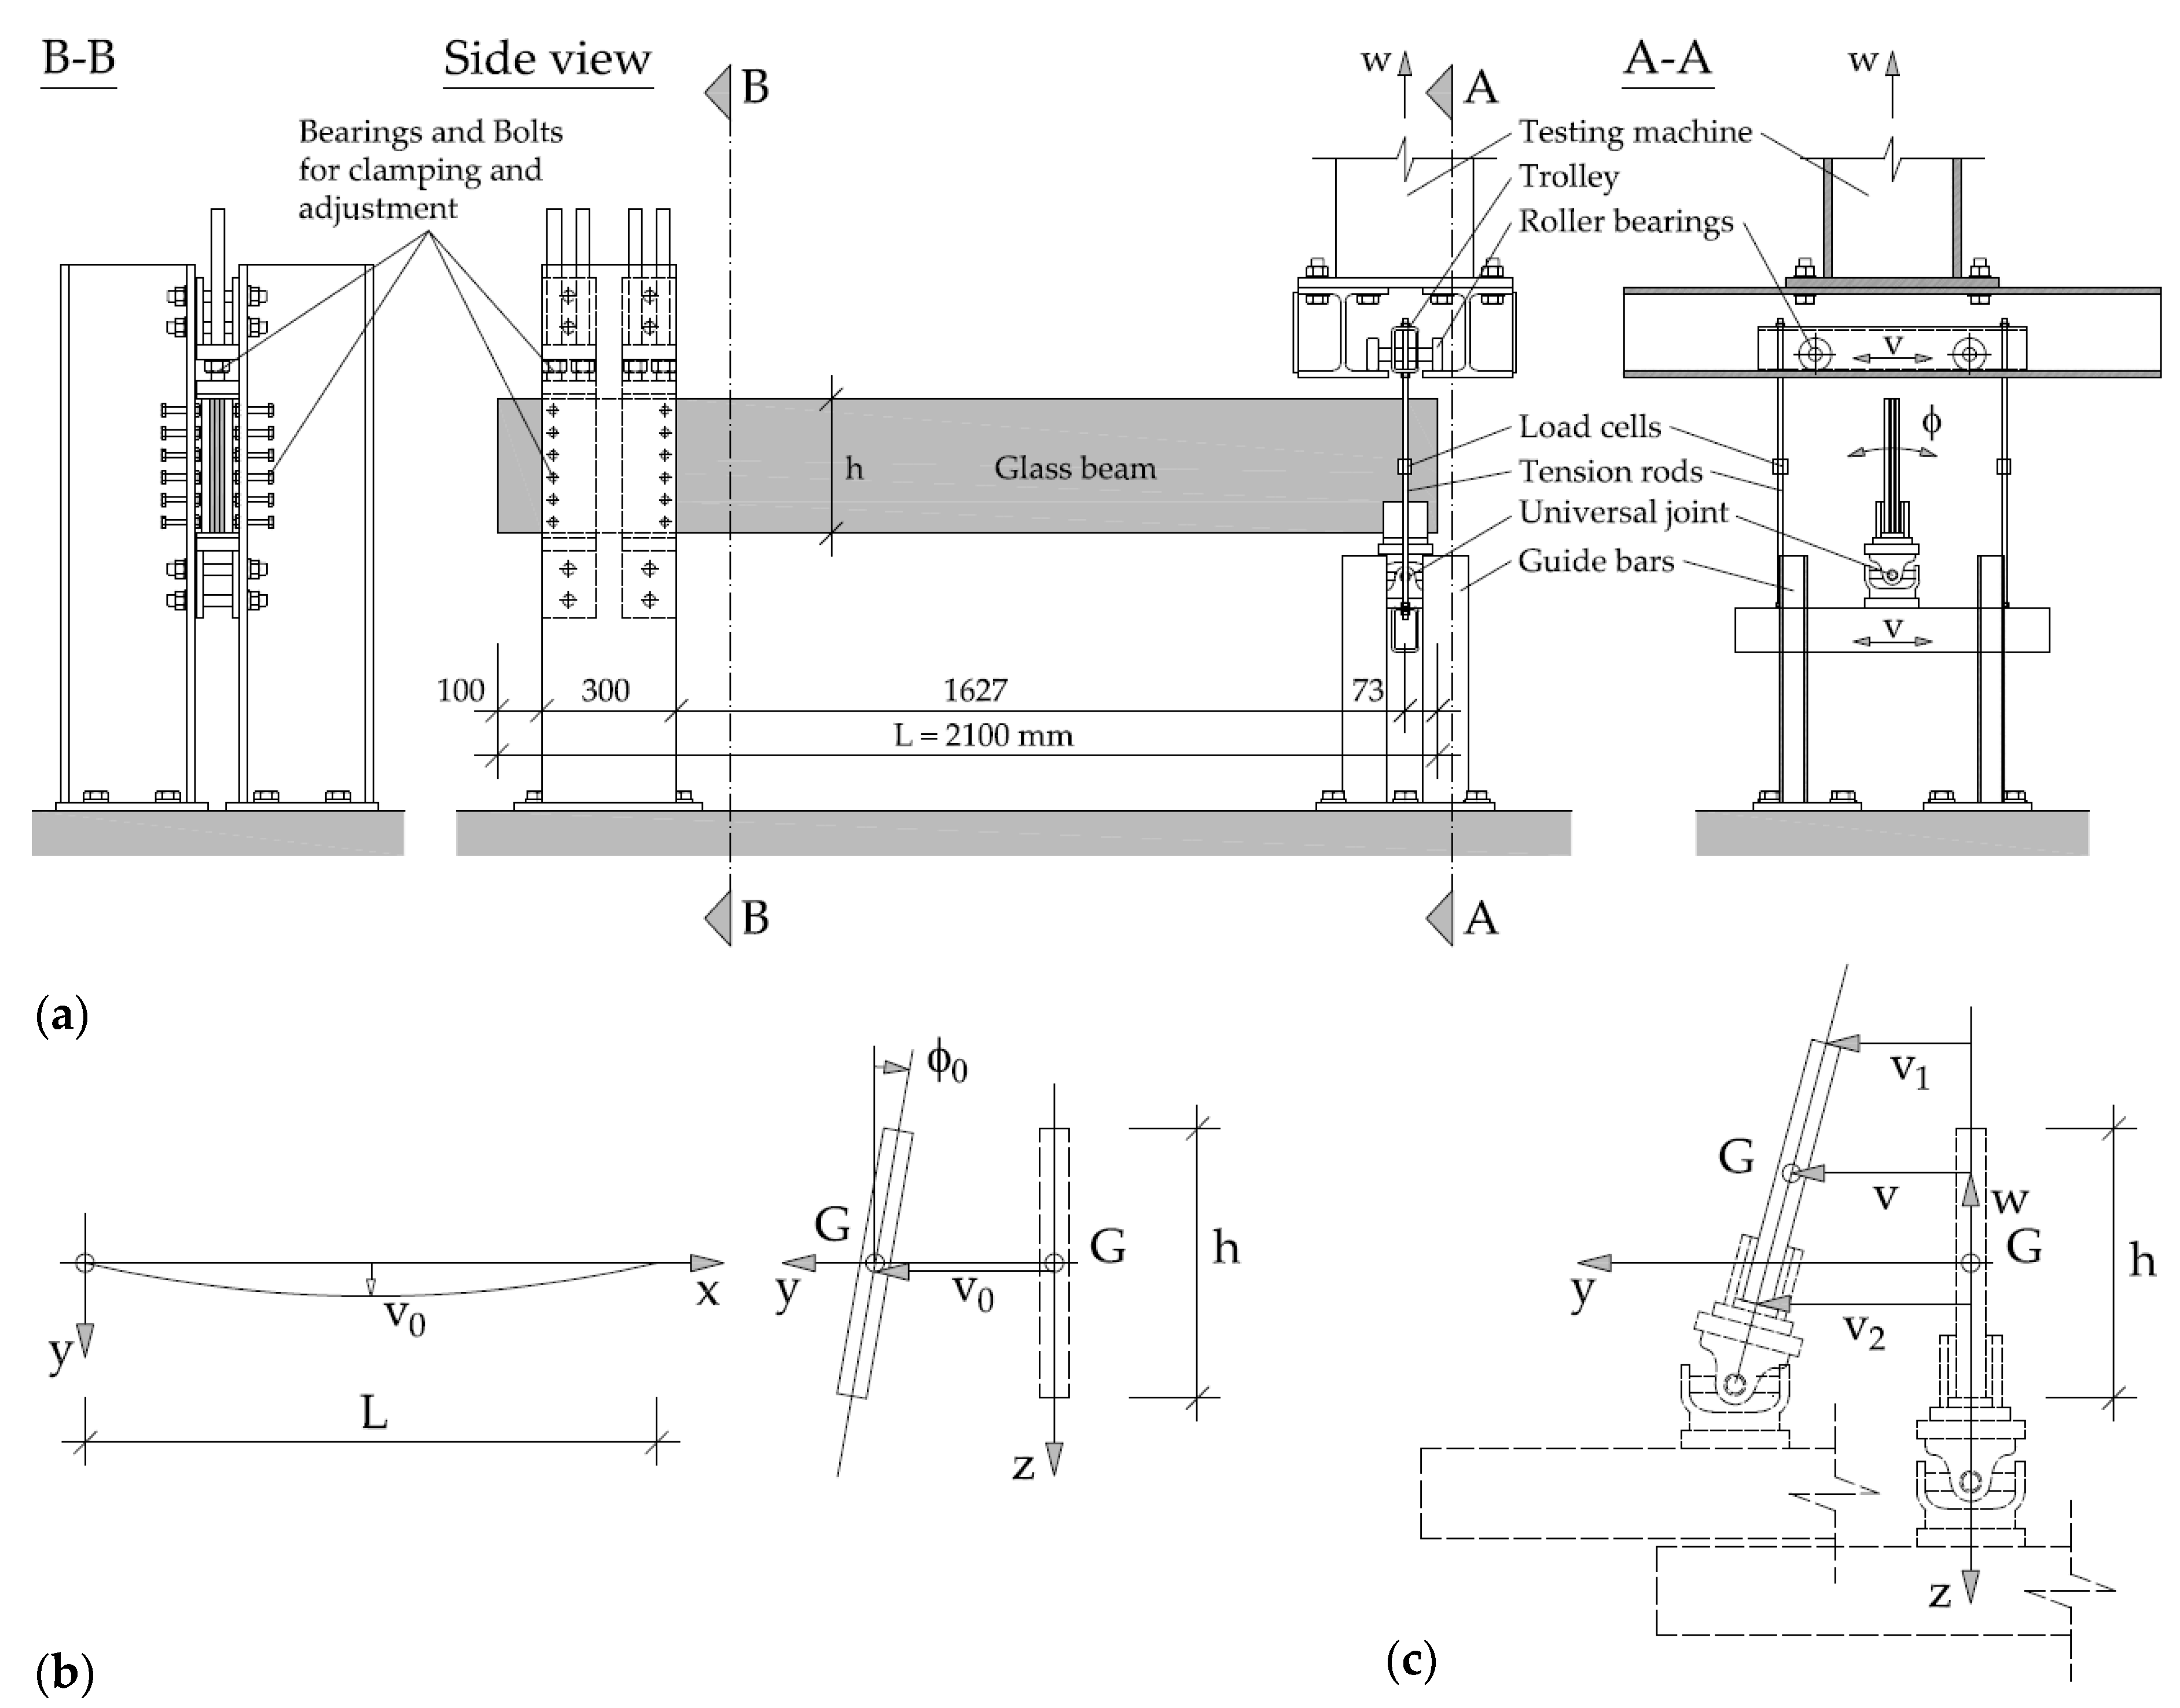
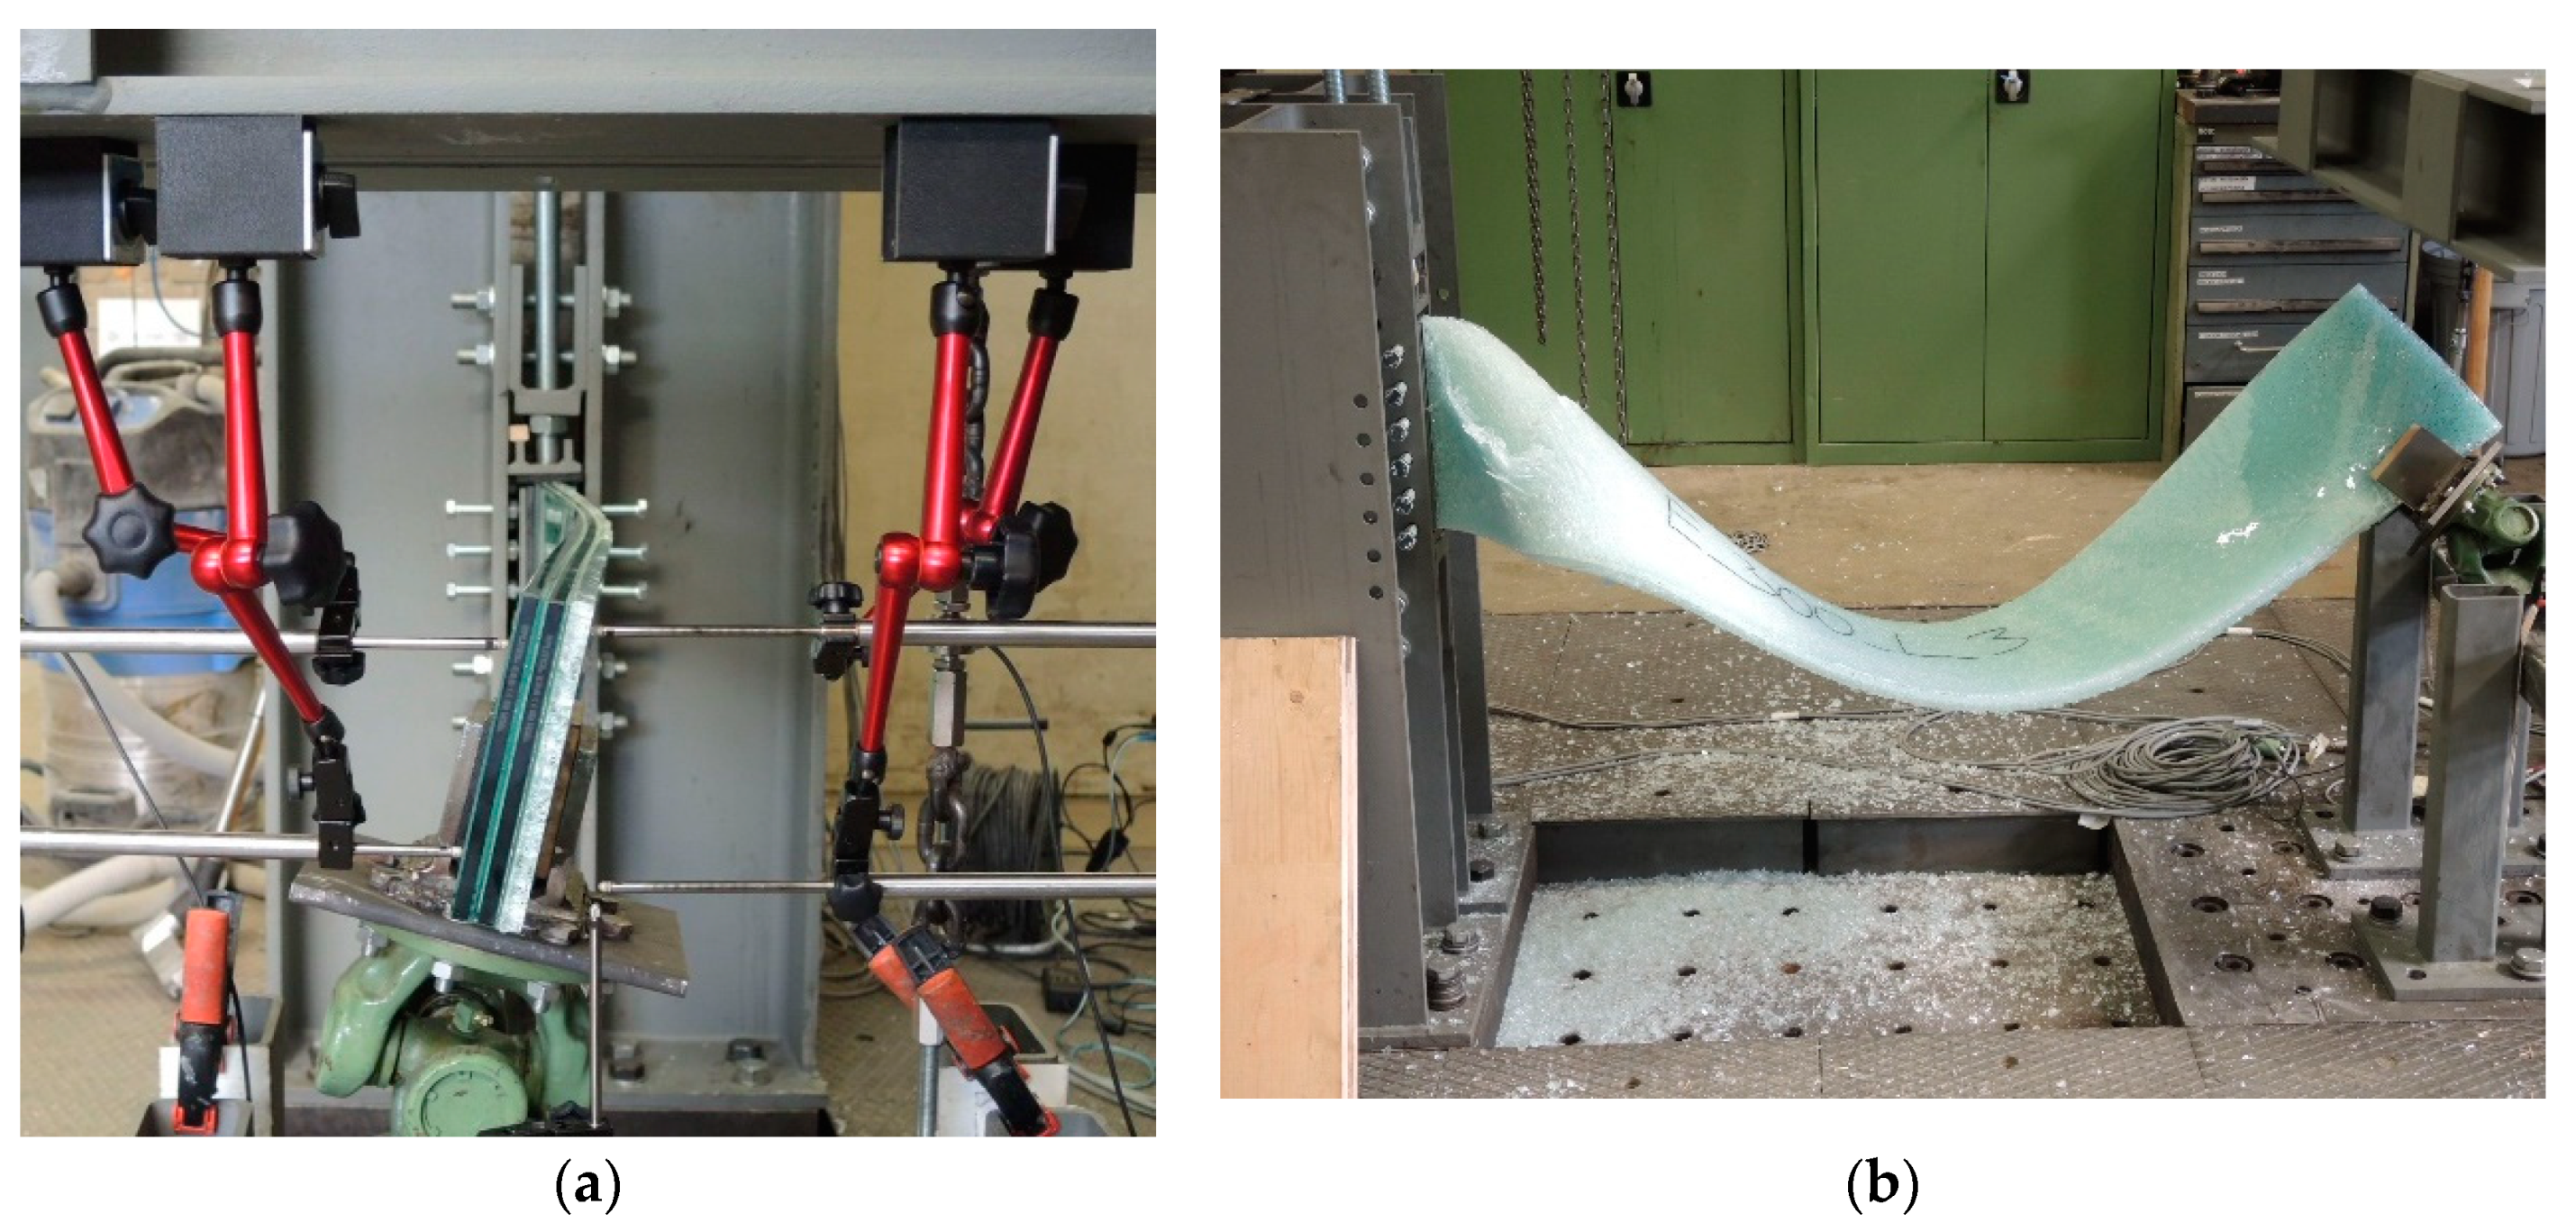
Research strategy: In order to reach the defined goals, experiments on glass beams were carried out first. For this purpose, an adequate testing device was developed, and the real imperfections were measured. In a second step, the experiments were recalculated with a FE-software by implementing the measured imperfections and the real boundary conditions. Afterward, a parameter study on a wide range of cantilever beams was performed with the obtained FE-model. In order to avoid too large deformations, an additional serviceability criterion was considered. Special attention was also given to the boundary conditions to avoid stress concentrations, and therefore, to obtain the most realistic stresses. Based on the numerically obtained results, design buckling curves were developed. Because of the glass strength, the robustness against local impacts, and the redundancy when a single glass panel fails, only laminated safety glass consisting of thermally treated glass was used.

2. Methods and Materials

2.1. Test Specimens

A total of 18 laminated glass beams were used for the experimental investigations. The glass beams had a length ( L ) of 2100 mm and two different heights ( h ) of 150 and 300 mm. The beams were made of FT-glass and HS-glass. All test specimens consisted of three glass panels with a thickness of 10 mm each and two interior layers made of PVB-foil with a thickness of 1.52 mm each (nominal thickness t nom = 33.04   mm ). Table 1 gives an overview of the used test specimens.

2.2. Experimental Investigations

Realizing a testing device for lateral–torsional buckling problems can be very challenging. This becomes clear also when coming across different test setups in literature [4,10,11]. The mentioned test setups were always developed for tests on single-span glass beams with load introduction at mid-span.
For the present investigations, a testing device for cantilever beams was developed. For this reason, the glass beams were clamped at one side with bolts to lock all degrees of freedom. In order to avoid stress concentrations, POM-C layers were used as an interlayer between the glass and the steel construction. The load introduction at the free end of the beam was the most demanding task. Due to the necessary degrees of freedom, a universal joint was used between the glass beam and the load introduction. The universal joint was fixed on a bar, which was connected with tension rods on a trolley. The trolley was equipped with roller bearings. The testing device is shown in Figure 1a.
After installing the glass beams, the imperfections were measured for each test specimen with a measuring device of the company FARO [20]. The displacements were measured over the whole beam length L of each glass beam at the top and the bottom edge. In doing so, the amplitude of the lateral imperfection v 0 (with respect to the length L and the gravity-center G ) and the rotational imperfection ϕ 0 could be determined. As expected, the shape of the lateral imperfections corresponds in all cases in good approximation to a half sinus wave (see Figure 1b). The rotational imperfections consist of two parts; a (local) twist of the glass beam itself and an unavoidable (global) rotation due to the installation and the bearing arrangements. The measured rotational imperfections were clearly smaller than the measured lateral imperfections. Nevertheless, minor rotational imperfections can influence the load-displacement path. Because of this, and for simplification, only the maximum rotation of each glass beam was evaluated. The thickness of each test specimen was measured additionally. All obtained values are summarized in Table 2.
The tests were performed “displacement driven”, which means that the testing machine moves upwards with a constant velocity. The resulting forces were measured with load cells. The lateral displacements were measured with inductive displacement sensors at the free end of the glass beam (see Figure 1c). Figure 2 shows exemplary the testing device and the test of a FT glass panel. The load-deflection curves of all test specimens are shown in Figures 6 and 7. The ultimate loads and the loading durations are summarized in Tables 5 and 6.

2.3. Numerical Investigations

The experimentally obtained load-deflection curves were recalculated with the Finite-Element Method (FEM) by using the software Ansys [21]. To get the most realistic results, geometrically nonlinear simulations were performed, including the measured imperfections from Table 2 (GNIA). First, the perfect geometry was generated and meshed. Then, the imperfections were created by moving the nodes of the mesh. This was done by using the programming capabilities of the used software. In doing so, a stress-free but imperfect mesh was created. The whole system was discretized with volume elements SOLID 185, using enhanced strain and mixed u-P formulations. This also corresponds to the recommendations in the ANSYS Helpfile [21] for such problems.
In order to realize the most realistic stresses, all boundary conditions, including the real POM-C layers, were taken into account. The steel parts at the support are much stiffer than the POM-C layers and could be assumed as rigid. Therefore, and to reduce the size of the FE-mesh, these parts were not modeled. Instead, the corresponding degrees of freedom of the POM-C layers (corresponding displacements v and w) were fixed. For numerical reasons, some vertexes of the POM-C layers were also fixed in the x-direction, but this does not influence the results.
Each contact between the POM-C layers and the glass beam were realized with a frictionless contact behavior. This approach seemed to be sufficient because the glass beam was supported in all directions by POM-C layers, so no relevant relative displacements between the glass and the POM-C layers could occur. Therefore, also the influence of friction between the glass and the POM-C layers seemed to be negligibly low. Due to the clamping at the support and the precisely fitting POM-C layers, no gaps occurred in the experiments; therefore, the contacts were also modeled without any gaps.
The real loading situation was considered with a simplified geometry, which means that the real joint was modeled as an ideal universal joint between the two steel plates. The FE-model, including the mesh and the boundary conditions, can be seen from Figure 3. In order to guarantee mesh-free results, studies on different mesh sizes, as well as different time size settings and also comparative calculations with another element type (SOLID 186), were performed (details can be found in [22]).
A linear-elastic material behavior was assumed for all parts. The used material parameters (elastic-modulus E and Poisson’s ratio ν ) are given in Table 3. A special problem was the considerations of the creep behavior of the PVB-interlayer. There can be found different databases in the literature on the value of the shear modulus (a summary is given in [23]). Most of the values were obtained from small test specimens. The values given in [11] were determined from larger test specimens, which seems to provide the most realistic results. Therefore, this database was used for the recalculations. Figure 4 (taken from [11]) shows the creep behavior of PVB-foils over time.
Depending on the real loading duration from Tables 5 and 6, the shear modulus was calculated for each test. The shear modulus has a strong influence on the structural behavior of the system. Due to the large relative deviations of the shear-modulus (see Figure 4), all calculations were carried out with two different values. Firstly, the minimum shear modulus G min from the formula for the lower limit given in Figure 4 was used. The calculated values are all in a range of G min = 0.32 0.35   MPa , due to the similar loading durations. The formula for the upper limit given in Figure 4 seemed to be very high (maybe outliers). Therefore, an approximated mean value of G mean = 0.70   MPa was used for further comparisons. As the loading durations are quite similar, this value was used for all systems. The Poisson’s ratio of the PVB-foil was considered with ν = 0.49 . Similar to the testing procedure, the calculations were also performed “displacement driven”. Figure 5 shows exemplarily the lateral displacements and the maximum principal stresses of a system. As expected, there are no singularities at the stresses in the area of the supports.

3. Results

3.1. Estimation of the Actual Glass-Strength

For comparison, four test specimens were tested with blocked degrees of freedom, i.e., no lateral displacements or rotations occurred. The maximum load determined in this way could be used to recalculate the actual glass strength with the following simple equations for a cantilever beam:
M exp = F exp · L W = t · h 2 / 6 }   f exp = M exp W
Values obtained in this way are evidently an estimation of the actual strength, and the values are only valid for the tested specimens. Nevertheless, these values gave a better insight into the real glass strength of the other test specimens. The experimental loads and the recalculated glass strengths according to Equation (1) are given in Table 4. The experimental loads were very close together; therefore, only one value for FT and HS-glass each could be used. Compared with the characteristic strengths f k , according to ÖNORM B 3716-1 [24] ( f k , FT = 120   MPa and f k , HS = 70   MPa ), the actual strength for FT-glass is approximately 41% and for HS-glass approximately 36% higher.

3.2. Experimental and Numerical Obtained Loads

The experimentally and numerically obtained load-deflection curves for h = 150   mm and h = 300   mm are shown in Figure 6 and Figure 7, respectively. In most cases, a good match can be observed. Some tests behave stiffer than the simulation, something probably due to the stiffer foil.
The differences between test and simulation for specimen HS_300_3 result from a relatively large offset of one of the glass panes. Due to the offset, the load acted eccentric and the load-deflection curve, as well as the whole system, behaved less stiff. Test specimen HS_300_3 was the only one with a larger offset of the glass panes. To avoid such problems, a bearing arrangement with mortar-interlayer represents a good alternative.
Irregularities are present in some of the load-displacement curves, which are due to the unavoidable friction, for example between the trolley and the rail. Nevertheless, all curves show a clear tendency. After the breakage of all glass panes, none of the glass beams showed any residual capacity (see Figure 2b).
For comparison, the experimental and numerical obtained ultimate loads are summarized in Table 5 (for FT) and Table 6 (for HS). In addition, Figure 8 shows a comparison of these values. It can be seen that with a conservative assumption of the imperfections and the shear-modulus, the ultimate load can be well approximated. The range of the ultimate loads from conservative to non-conservative assumptions is small; hence, the conservative obtained values are still economical.
Based on the obtained results, a lateral imperfection v ( x ) according to Equation (2) with an amplitude of v 0 = L / 400 and an unfavorable rotational imperfection of ϕ 0 = 0.01   rad has been used in the following parameter study. The value of v 0 = L / 400 was also obtained by other authors (see [8]) and could be confirmed here (see Table 2).
v ( x ) = π · v 0 · [ 1 cos ( π · x 2 · L ) ]

4. Parameter Study and Design Buckling Curves

Design buckling curves are a widely used and user-friendly method for considering the stability behavior of components. For other construction materials, such curves are already integrated into the different parts of the Eurocode (e.g., EN 1993-1-1 for LTB of steel girders). Using design buckling curves also for structural glass components was already proposed by other authors in earlier investigations. A summary can be found among others in [8].
Following this approach, design buckling curves have been calibrated for the here investigated case of cantilever beams, which can be seen as an extension of the previously performed work on this topic. Therefore, the definitions used in the literature and Eurocode 3 were used as well:
λ ¯ LT = W y · f k M cr ;   Φ = 1 2 · [ 1 + α · ( λ ¯ LT λ ¯ 0 ) + λ ¯ L T 2 ] ;   χ L T = 1 Φ + Φ 2 λ ¯ L T 2 1.0 M b , R d = χ L T · W y · f d ;   M y , E d M b , R d 1.0
For laminated safety glass, the critical moment M c r depends strongly on the shear modulus but can be calculated easily by using a FE-software and by performing a linear-buckling analysis (LBA). For practical use, the formulas based on a sandwich-theory appear to be more comfortable and faster. Such equations can be found among others in [19]. In doing so, the time-dependent behavior of the PVB-foil can be taken into account by using the corresponding shear-modulus G > 0 , which results in a higher stiffness of the cross-section (and therefore lower slenderness) and a higher load-carrying capacity than in the case of a long-term behavior with G 0 .
The here presented design buckling curves have been determined based on a parameter study by calibrating the imperfection factor α and the threshold value λ ¯ 0 . The parameters used for the parameter study are defined in Table 7. All parameters were combined, and a total number of 512 calculations were carried out. The parameters used cover a broad range of systems (relative slenderness λ ¯ L T from 0.4 to 2.8). Values not included in the used parameter range seemed to be unrealistic for practical usage.
The following criteria were defined to determine the ultimate load:
  • The maximum principal stress reaches the characteristic strength f k ,
  • the lateral deflection or the vertical deflection reaches a value of L / 50 ,
  • the rotation reaches a value of 0.3   rad .
The defined values were used to guarantee the serviceability for beams with large deformations. The used values are similar to those used in steel constructions for lateral-torsional buckling problems, see [25,26]. In most cases, the maximum principal stress was reached first. The geometric criteria were achieved in some cases only (especially for FT-glass with higher slenderness). In general, the influence of the geometric criteria was low; therefore, the results derived from excluding the geometric criteria will not be further disclosed.
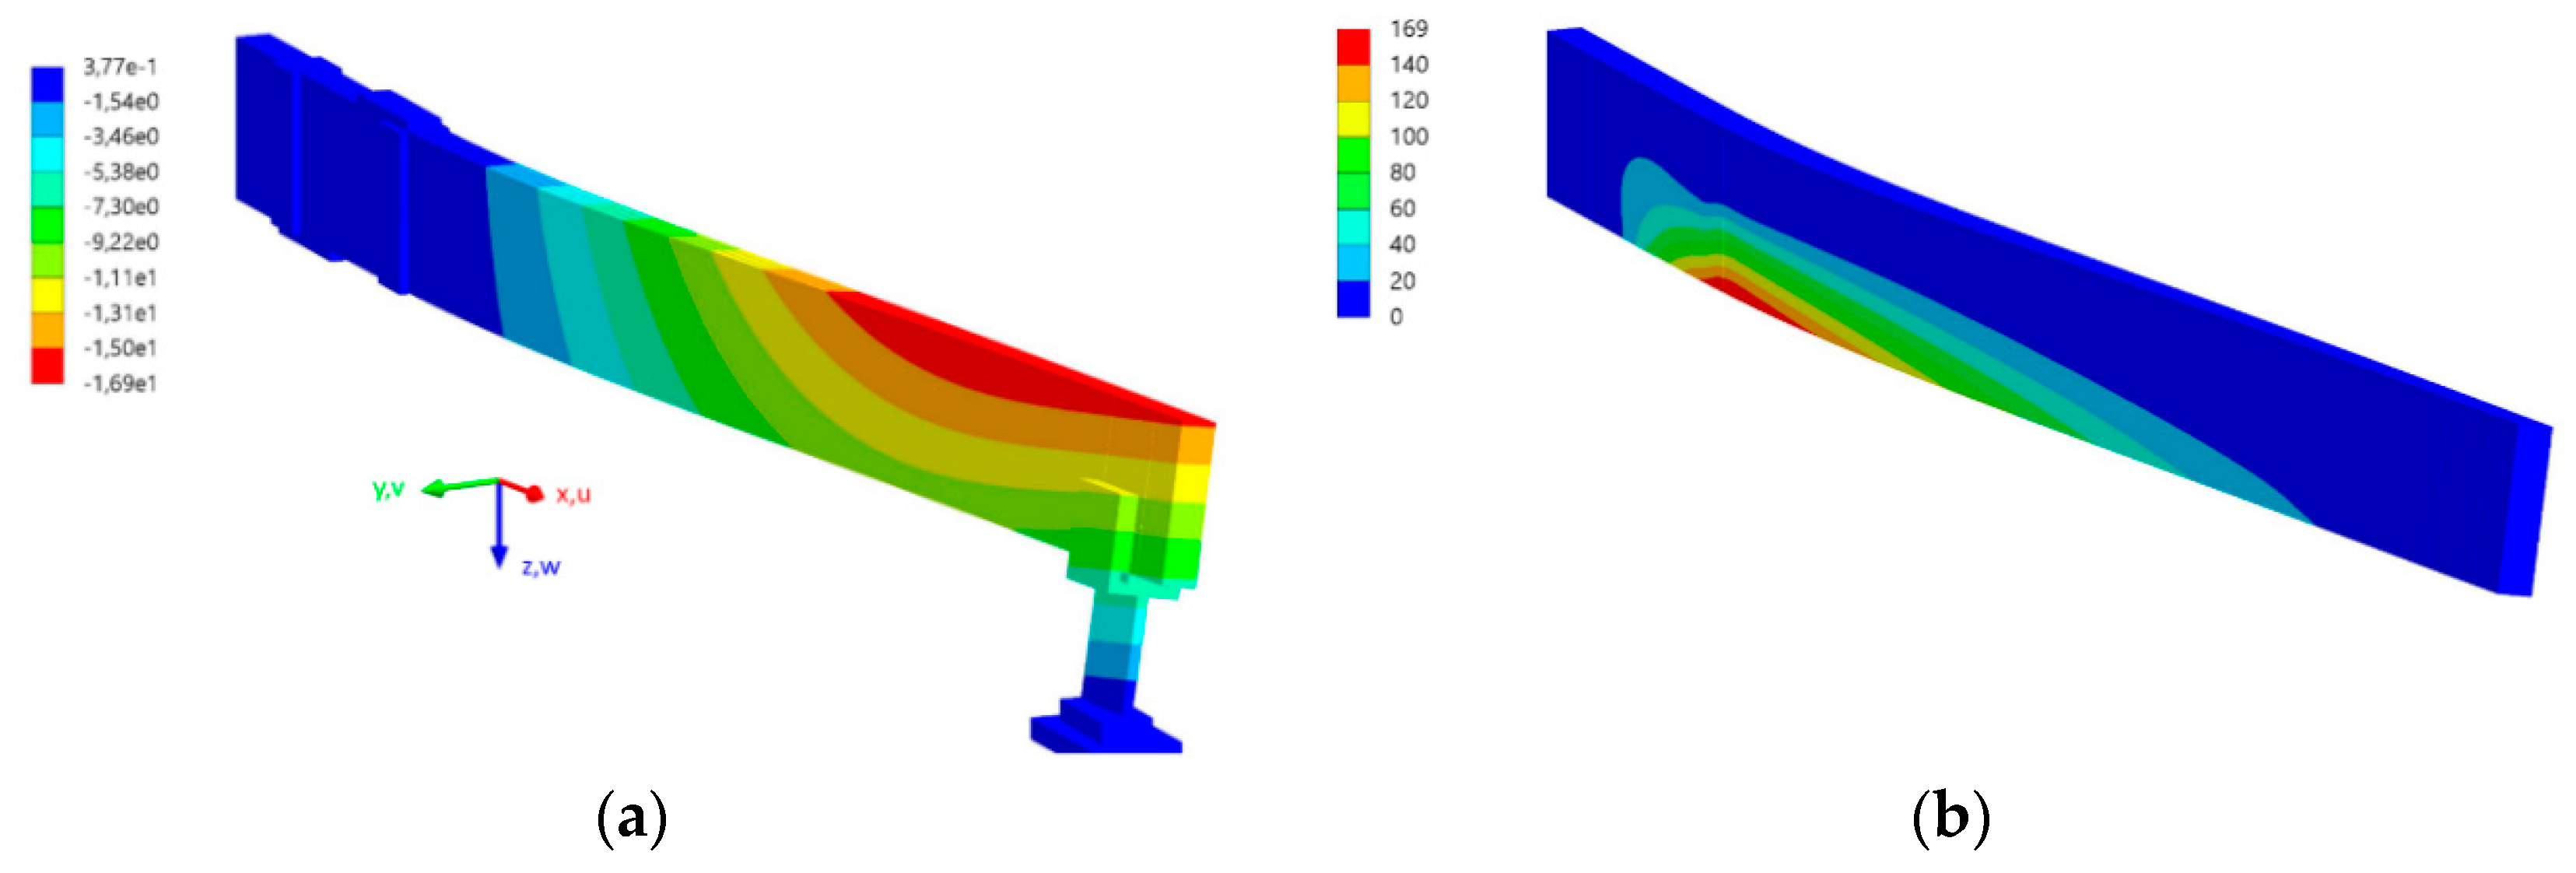
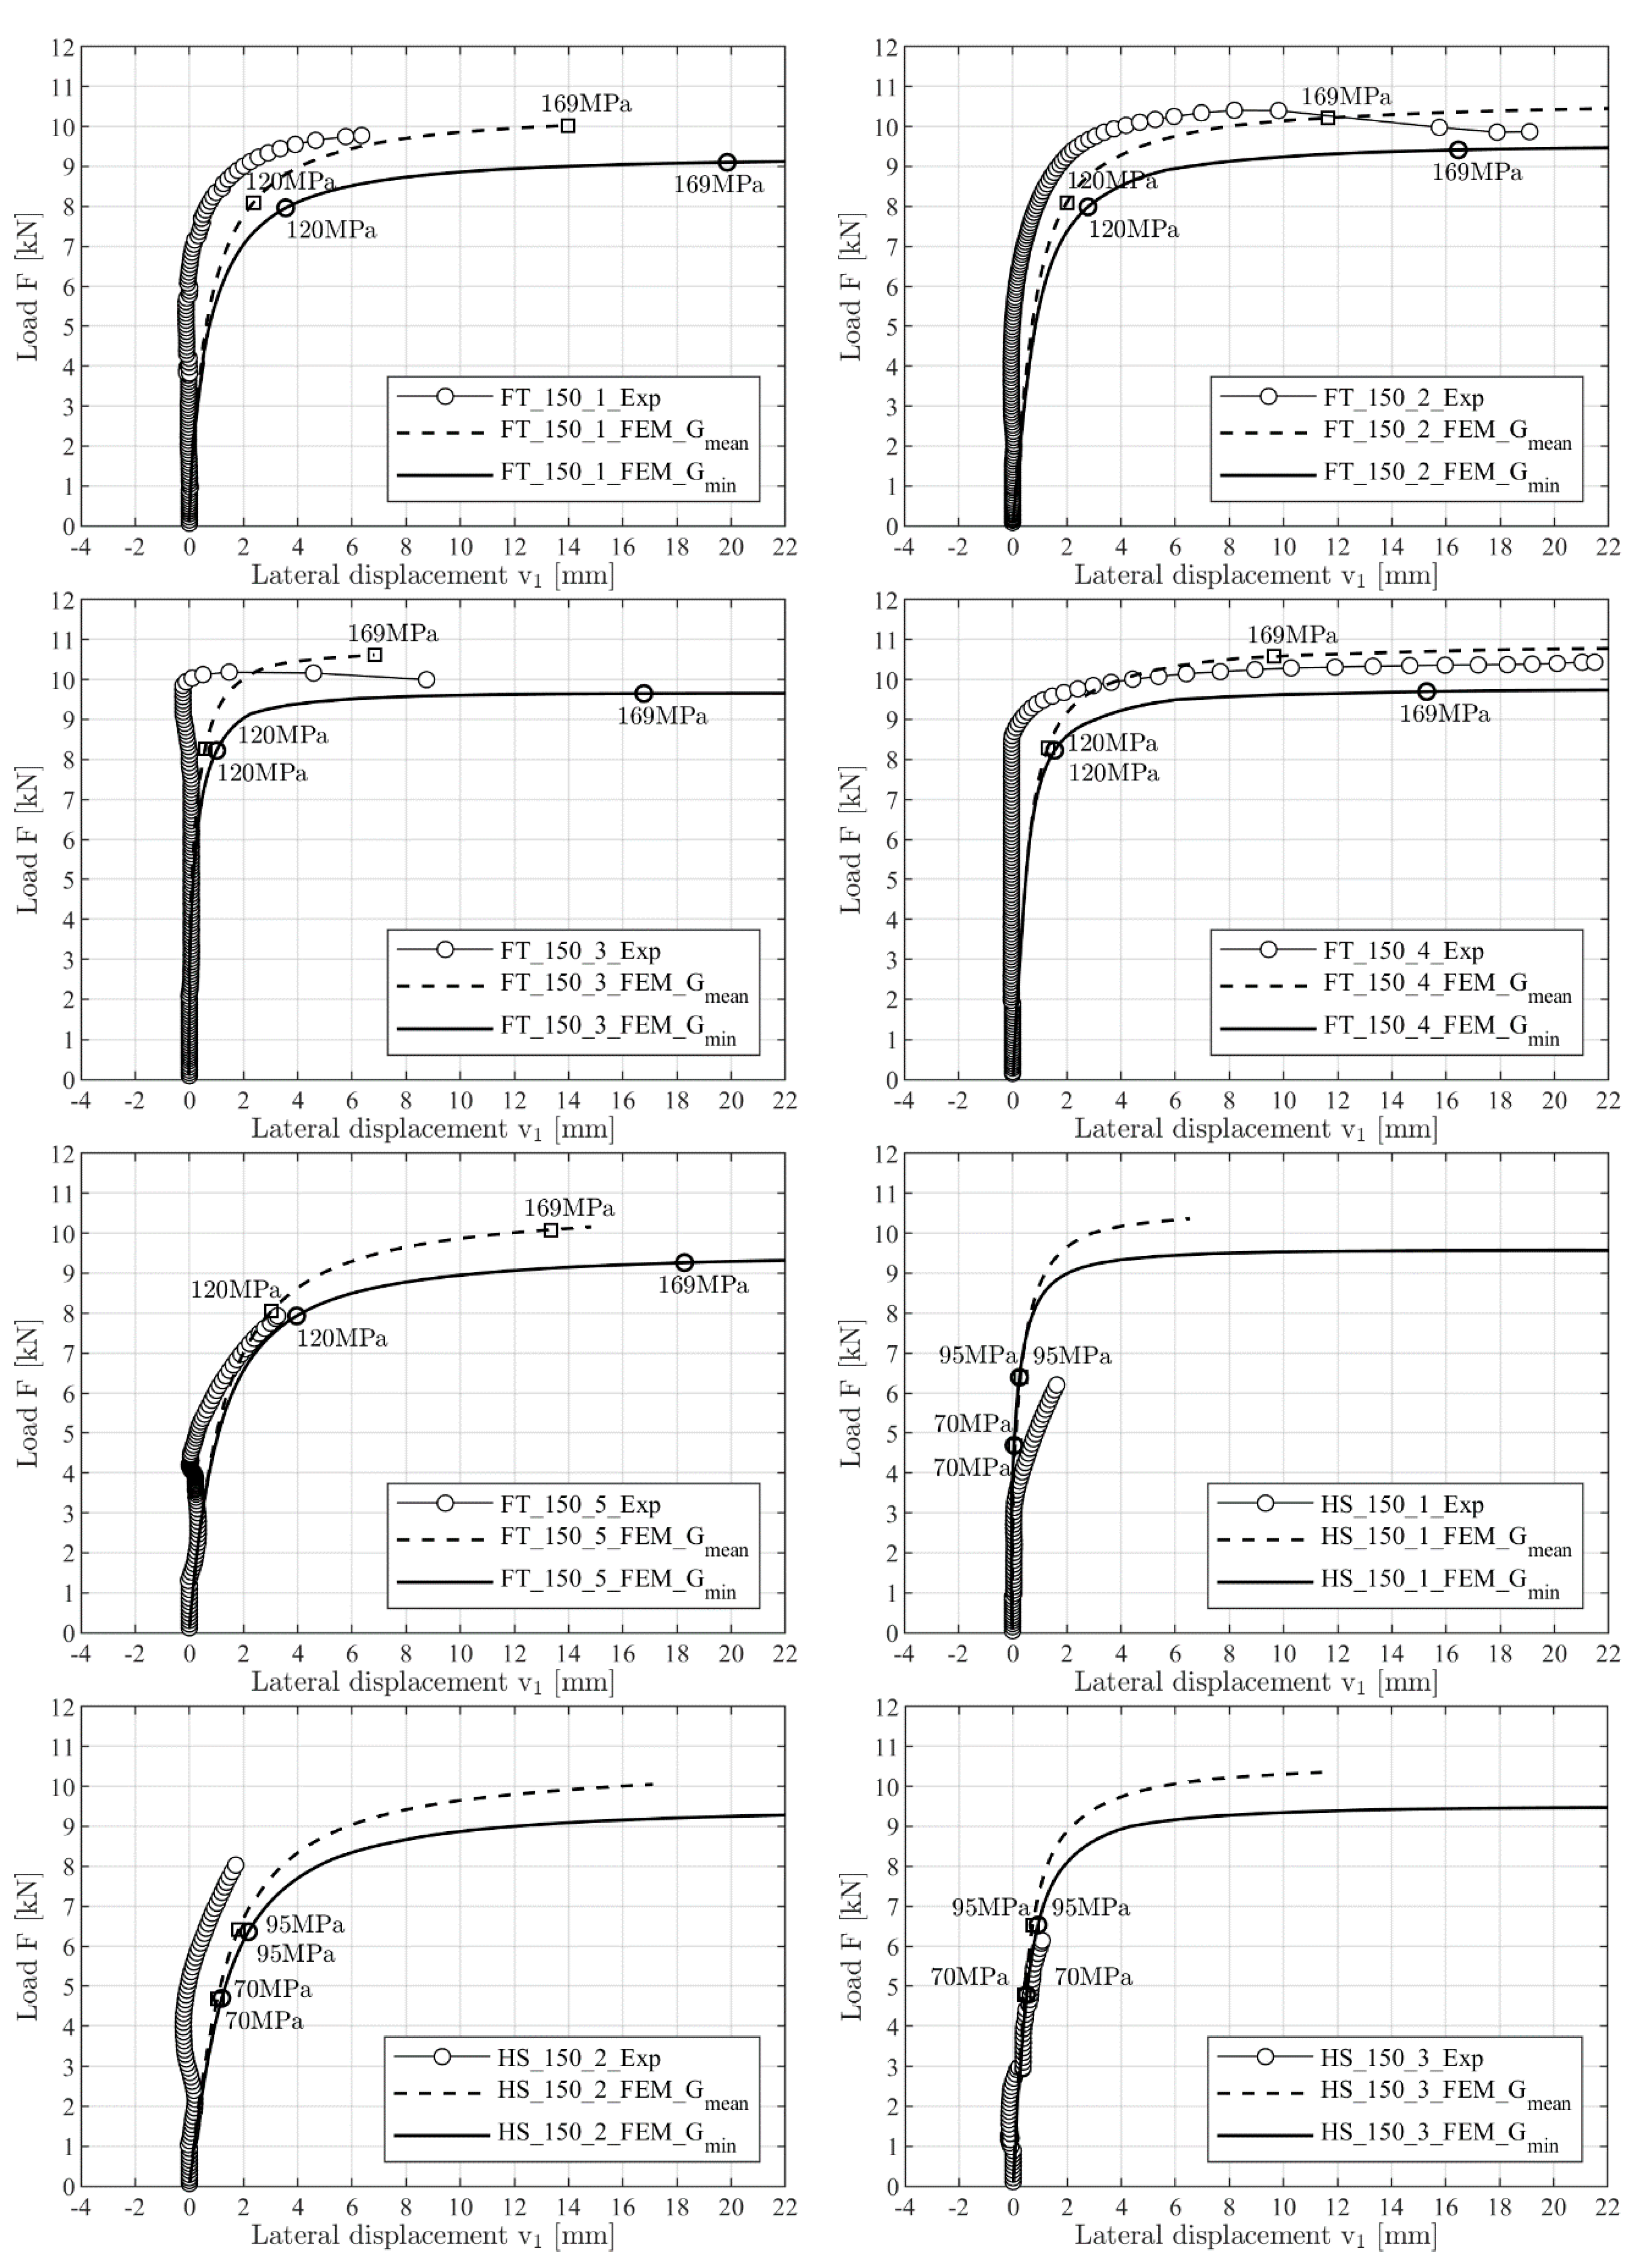
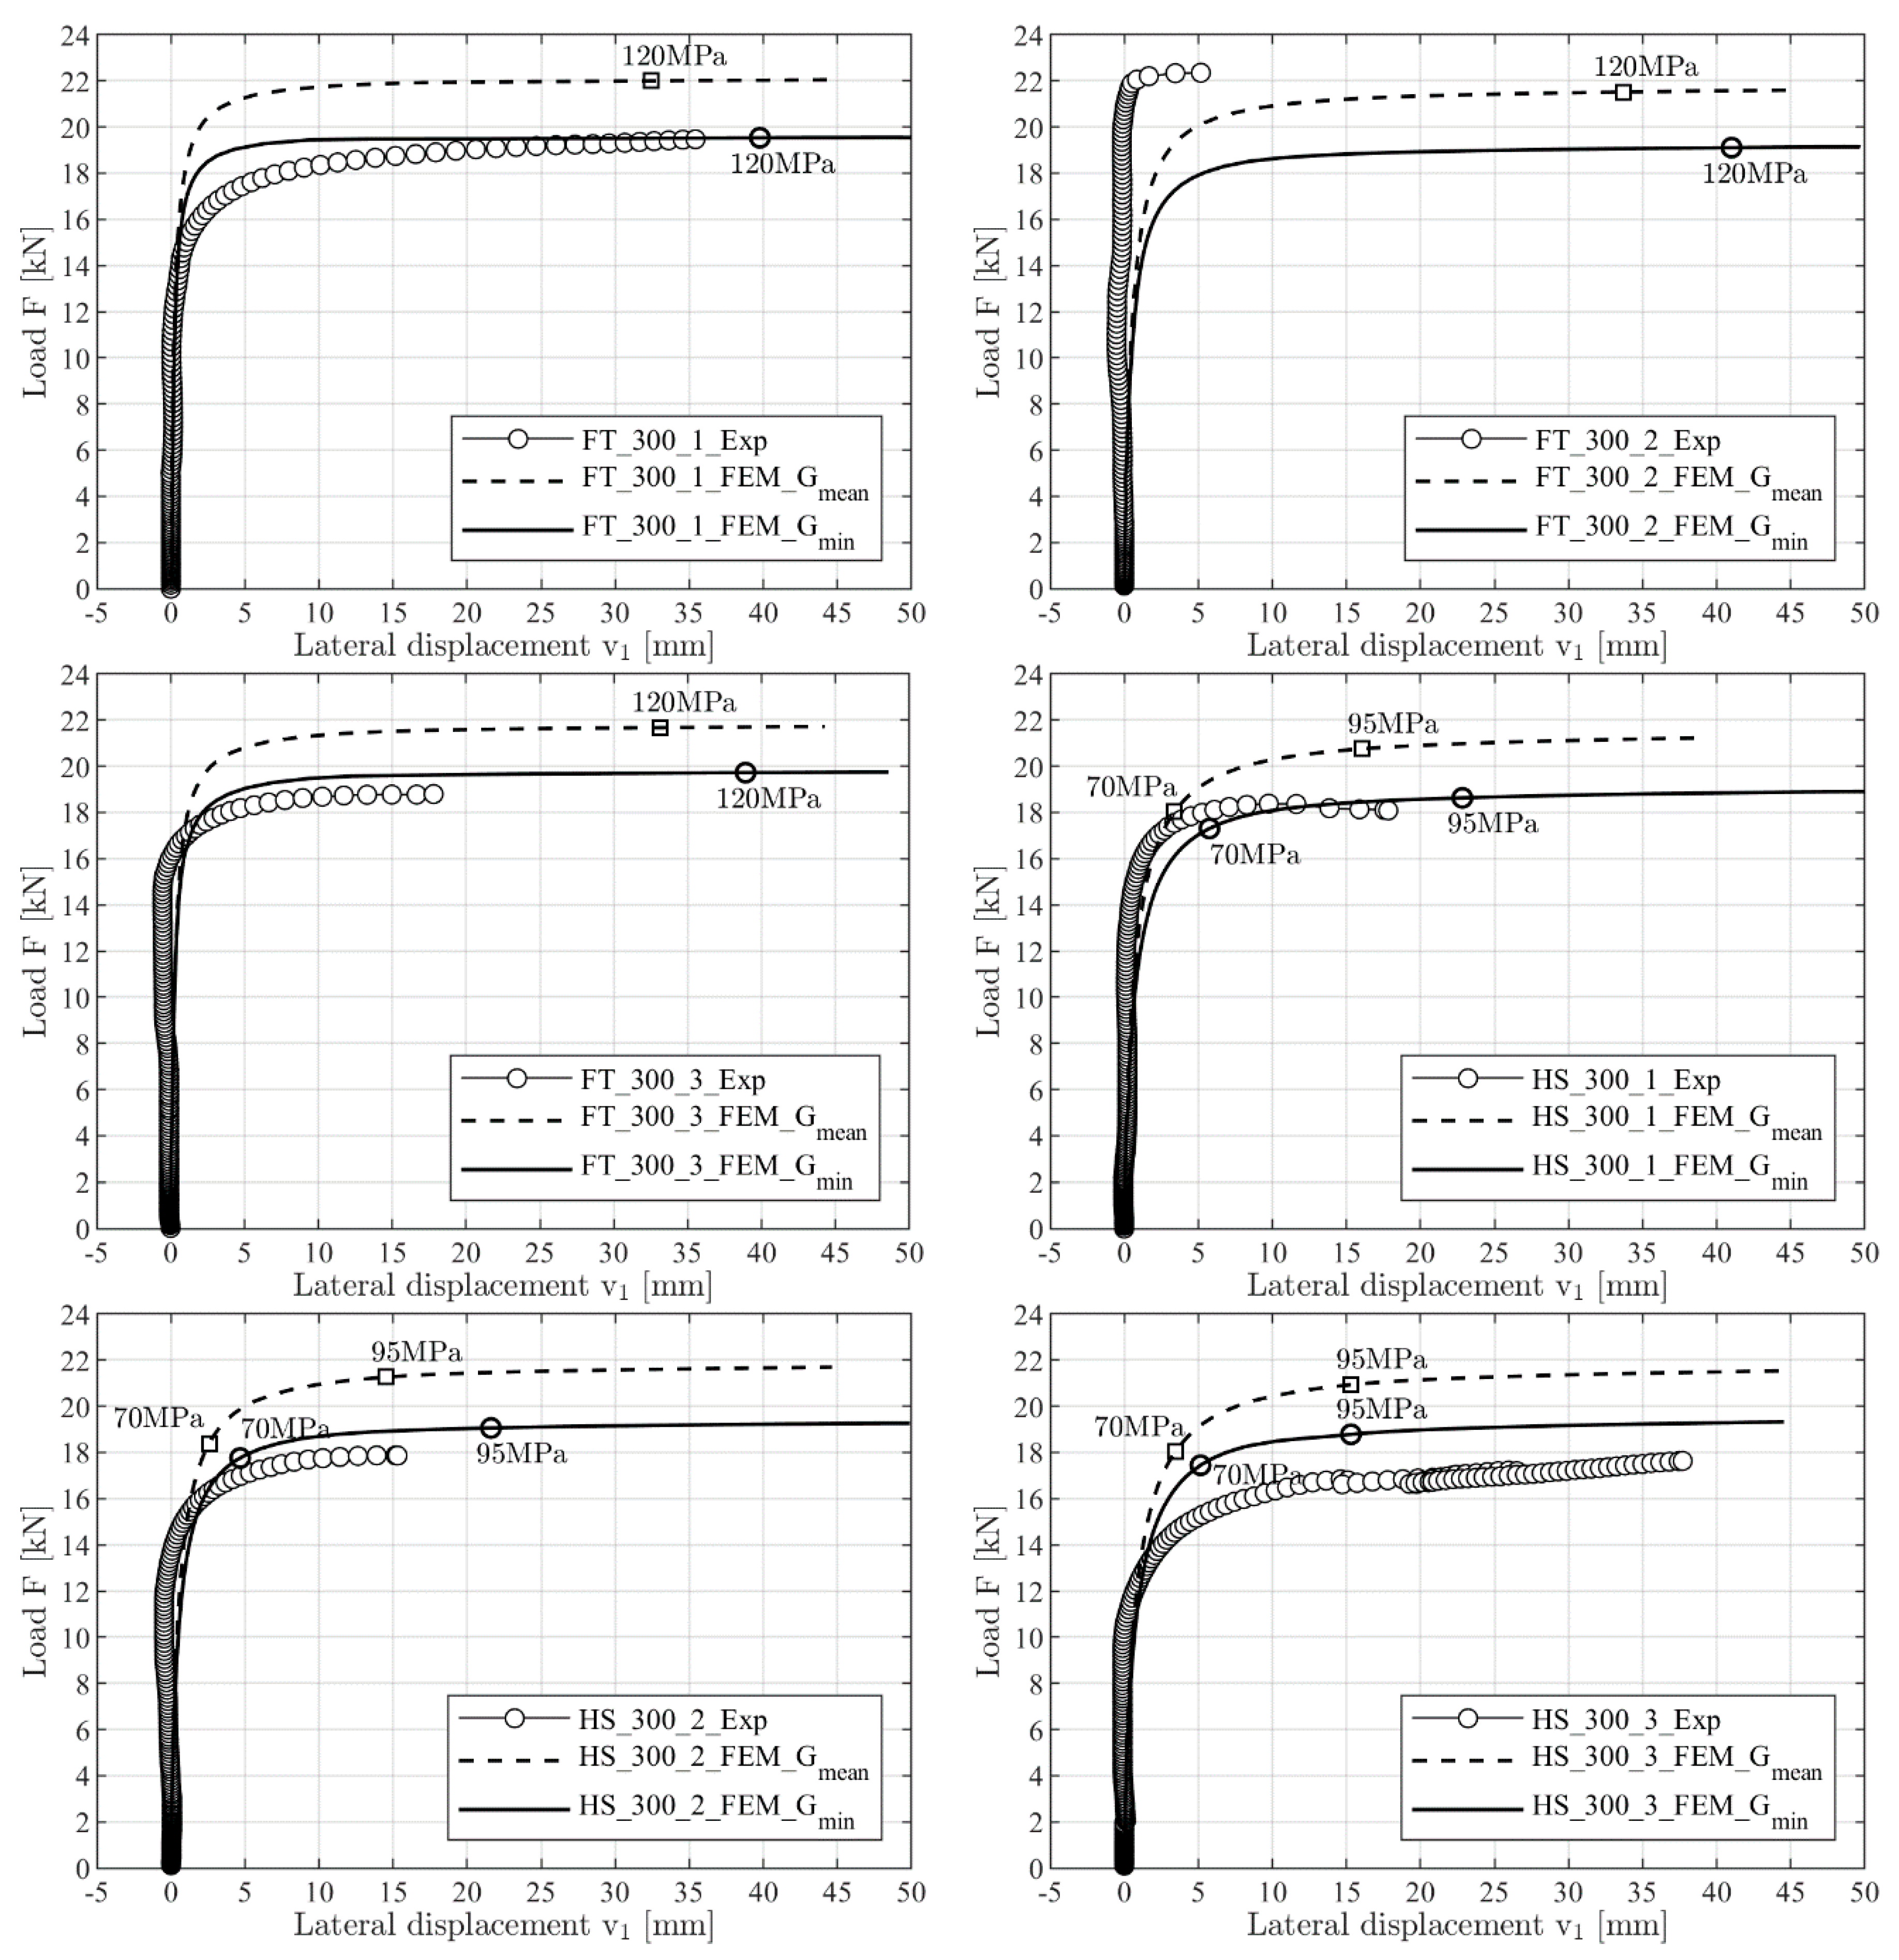
The numerical model applied was similar to the model used for the recalculation of the experiments (see Figure 3), but without modeling the load introduction (universal joint). The load was applied directly at the nodes of the top of the cross-section instead. As previously stated, the investigations have been carried out especially for cantilever beams, used, for example, as a canopy. Therefore, a constant bending moment proved unrealistic for practical use and was not considered.
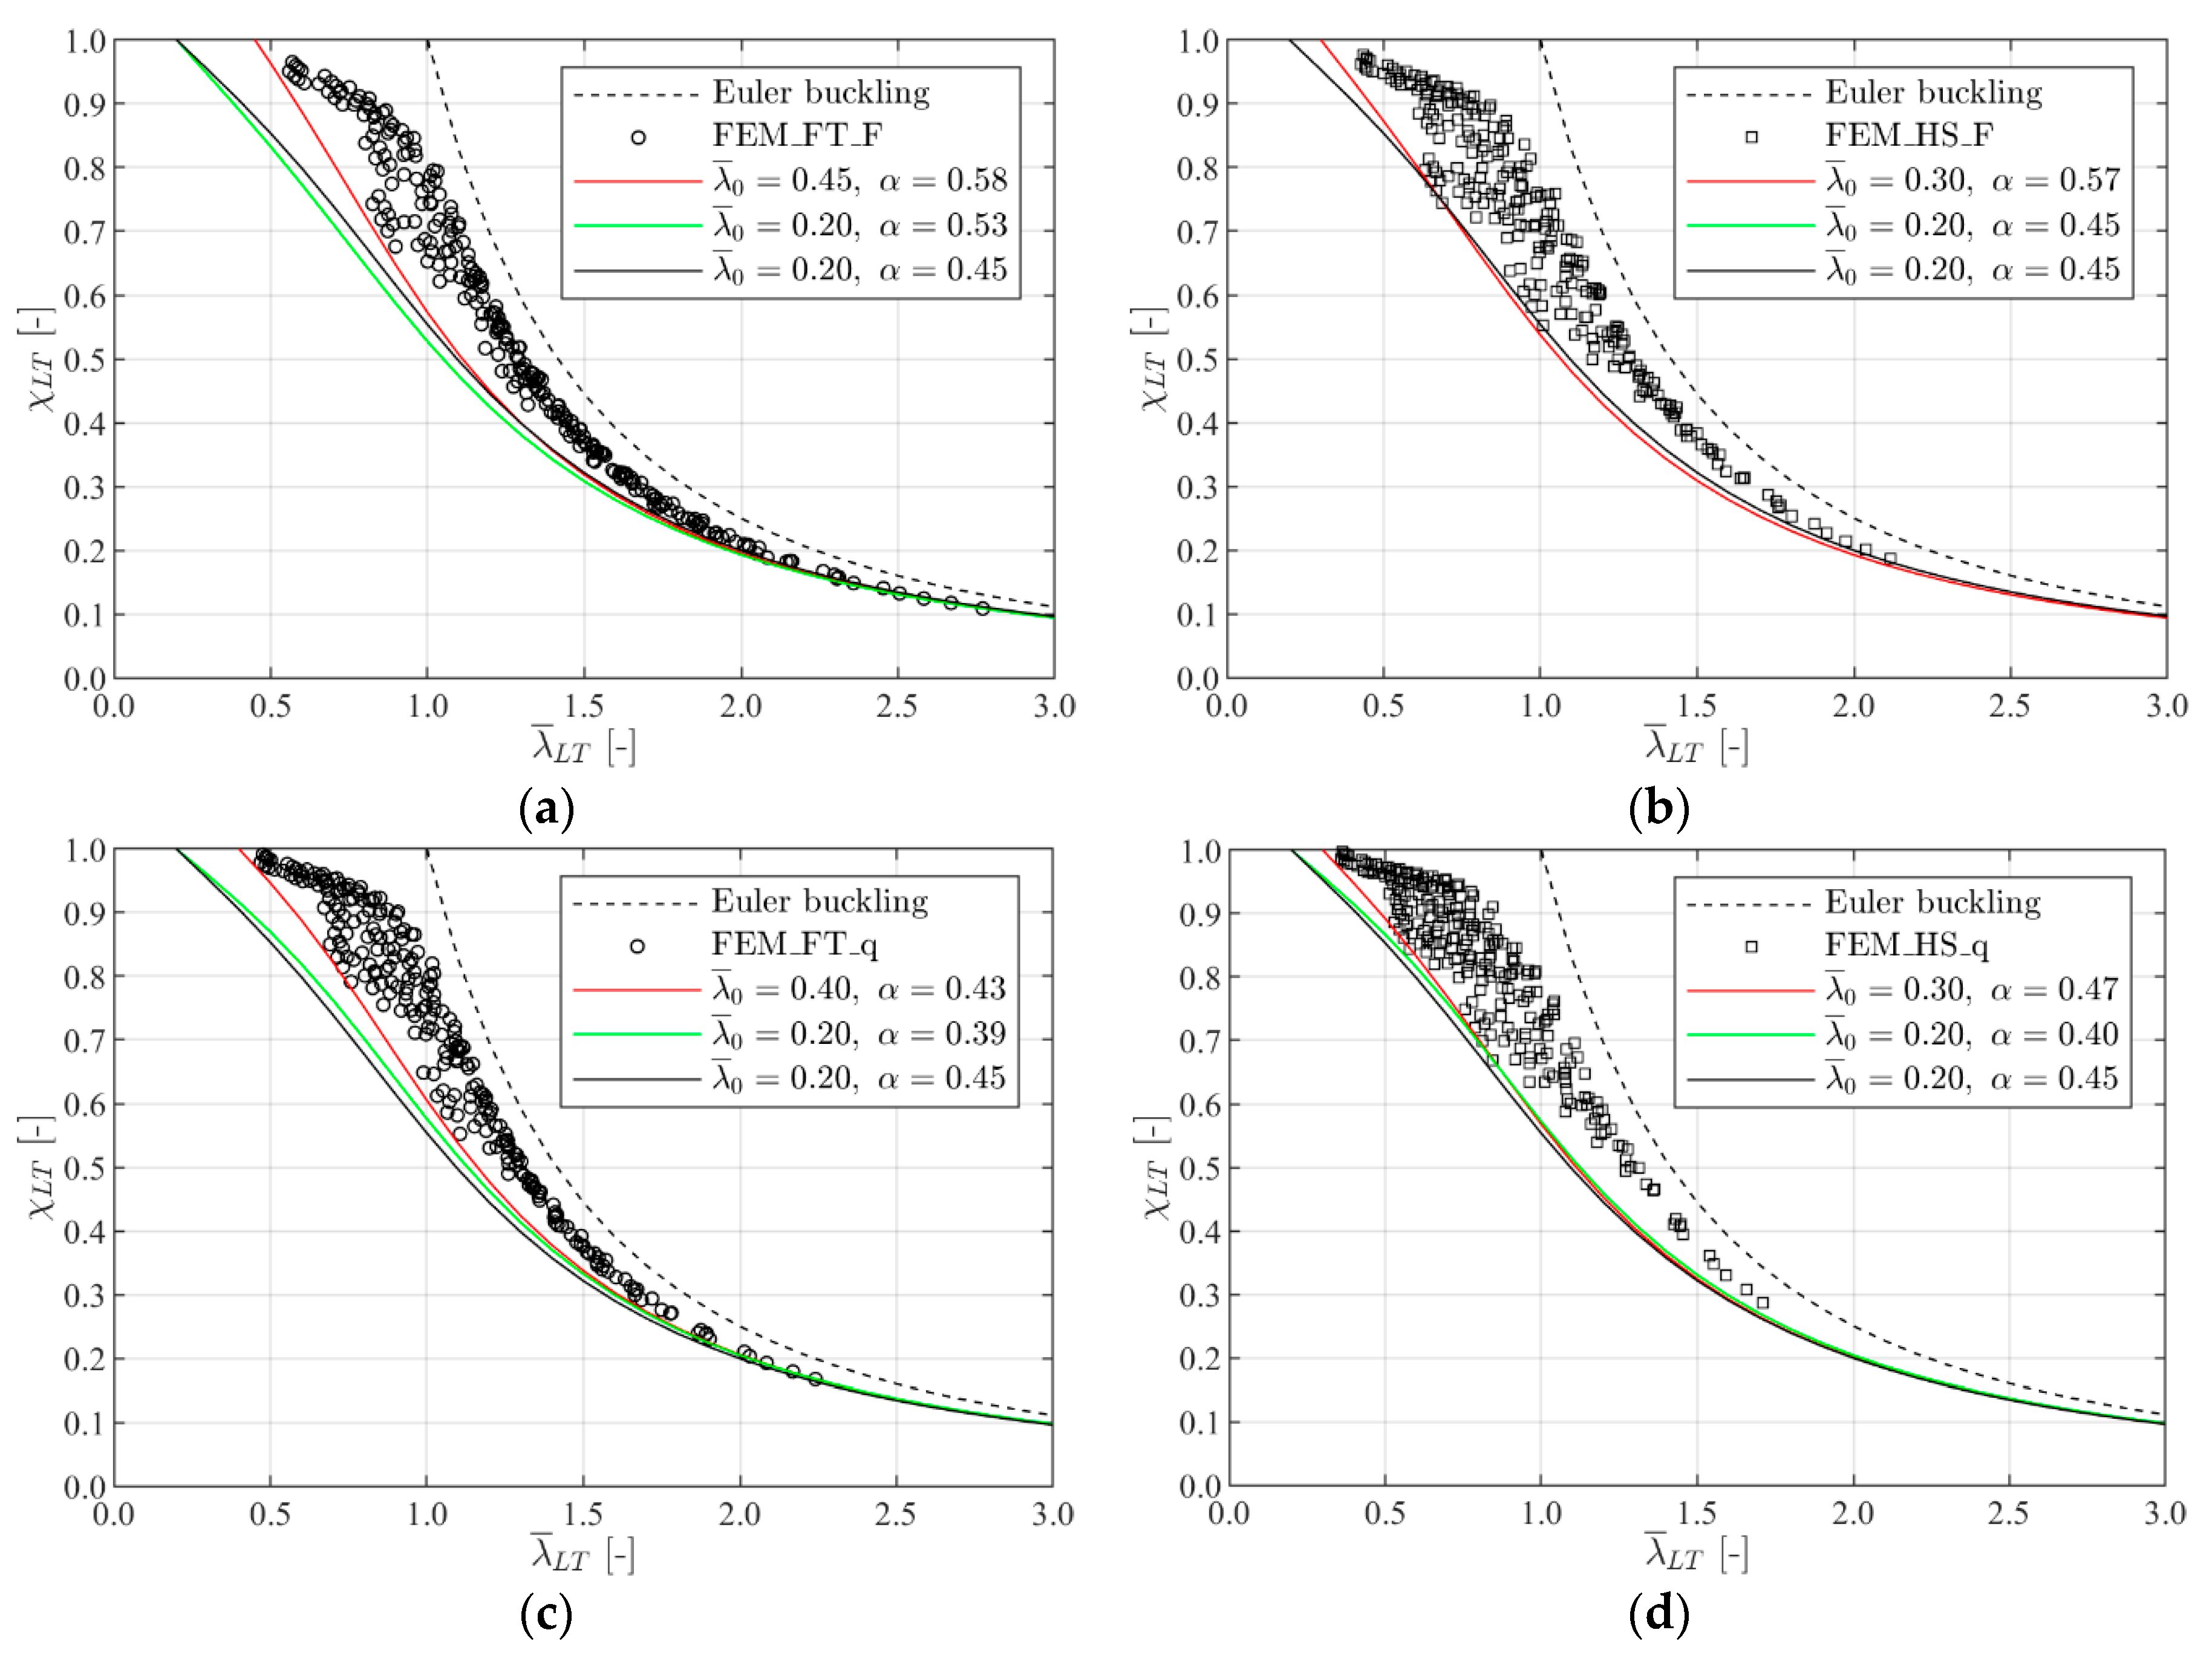
The design buckling curves were fitted to the numerical results by using two different assumptions:
  • The first assumption used a threshold value λ ¯ 0 , which was obtained as near as possible to the results.
  • For comparison then, a fixed threshold value with λ ¯ 0 = 0.20 was used. This value is in accordance with the recommended design buckling curve given in [8].
For both assumptions, the imperfection factor α was then increased until the design buckling curve reached the first numerical obtained result. A distinction was also made between the loading situation (single load F and distributed load q) and the glass type (FT and HS). The determined curves are shown in Figure 9. For comparison, the recommended design buckling curve from [8] with λ ¯ 0 = 0.20 and α = 0.45 was also plotted.
When using a threshold value of λ ¯ 0 = 0.20 (green lines), the developed curves appear to agree with the proposed curve given in [8]. In one case, even identical coefficients were obtained (see Figure 9b). When using threshold values λ ¯ 0 > 0.20 (red lines), the developed curves appear in being slightly more economical, especially when using FT-glass. Especially in the slenderness range of 0.2 to 0.5, other authors reported lower ultimate loads. Due to the chosen parameters (see Table 7), only a few values were obtained in this range in the presented parameter study. However, as mentioned above, other parameters seemed to be unrealistic for practical usage. Other reasons for the different coefficients also arise maybe from the different loading situations and the somewhat different consideration of the imperfections. For a better comparison, the authors recommend [8] for further reading.

5. Discussion and Conclusions

Experimental and numerical investigations on the lateral-torsional buckling behavior of cantilever beams were presented. First, an experimental device was developed. Such experiments are very demanding, a fact also reported by other authors, see [4,10]. Overall, the designed testing device worked well, and satisfying results were obtained.
In most cases, the recalculated load-deflection curves resulted in being in good agreement with the experimentally obtained curves. In some cases, more significant deviations were found, but these deviations could be explained technically (e.g., due to an offset between the single glass panels). The shear-modulus has a strong influence on the ultimate load level. Therefore, the lower bound given in [11] was used and, compared to the tests, conservative results were obtained for nearly all cases. A more advanced calculation under consideration of a creep-law would probably give a better approximation; however, the values of the creep-law are unfortunately still unknown. In conclusion, the lower bound according to [11] is recommended as shear-modulus for numerical simulations as the obtained values from other authors are tendentially higher and therefore less conservative (see the summaries given in [22,23] or the values given in [27]).
Based on the measured imperfections, recommendations were given for numerical simulations. The recommended lateral imperfection of v 0 = L / 400 from literature (e.g., [8]) could be confirmed. Additionally, a value of ϕ 0 = 0.01   rad as unfavorable rotational imperfection at the free end of the cantilever beam should be taken into account.
The developed design buckling curves agree with the recommended curve in [8] as a conservative approach. The curves obtained through this investigation are (slightly) more economical and are, therefore, recommended for the case of a cantilever beam under a single load or a distributed load, which is a frequent application of glass beams in bending. In addition, the presented design curves include a serviceability limit.

Author Contributions

Conceptualization, R.T.; Methodology, R.T. and T.N.; Formal analysis, R.T. and T.N.; Investigation, R.T. and T.N.; Resources, R.T.; Data curation, R.T. and T.N.; Writing—Original draft preparation, R.T.; Writing—Review and Editing, R.T.; Visualization, R.T. and T.N.; Supervision, R.T.; Project administration, R.T.; Funding acquisition, R.T.

Funding

This research was funded by the University of Innsbruck (Forschungsförderungsmittel aus der Nachwuchsförderung 2017 und dem Publikationsfond der Universität Innsbruck).

Acknowledgments

The authors thank the University of Innsbruck, for giving us the opportunity to carry out this research and for providing the open access funding.

Conflicts of Interest

The authors declare that there is no conflict of interest. The funders had no role in the design of the study, in the collection, analyses, or interpretation of data, in the writing of the manuscript or in the decision to publish the results.

References

  1. Feldmann, M.; Langosch, K. Knickfestigkeit und einheitliche Knickkurven für scheibenförmige Glasstützen mit Monoglasquerschnitt aus TVG und ESG. Stahlbau 2010, 79, 70–79. [Google Scholar] [CrossRef]
  2. Pešek, O.; Horáček, M.; Melcher, J. Experimental Verification of the Buckling Strength of Structural Glass Columns. Procedia Eng. 2016, 161, 556–562. [Google Scholar] [CrossRef] [Green Version]
  3. Langosch, K. Das Tragverhalten von Glasstützen mit Mono-und Verbundquerschnitten. Ph.D. Thesis, Hochschulbibliothek Rheinisch-Westfälische Technischen Hochschule Aachen, Aachen, Germany, 2012. [Google Scholar]
  4. Luible, A. Stabilität von Tragelementen aus Glas, Thése No 3014. Ph.D. Thesis, École Polytechnique Fédérale de Lausanne (EPFL), Lausanne, Switzerland, 2004. [Google Scholar]
  5. Bedon, C.; Amadio, C. Flexural–torsional buckling: Experimental analysis of laminated glass elements. Eng. Struct. 2014, 73, 85–99. [Google Scholar] [CrossRef]
  6. Amadio, C.; Bedon, C. Buckling of laminated glass elements in out-of-plane bending. Eng. Struct. 2010, 32, 3780–3788. [Google Scholar] [CrossRef]
  7. Bedon, C.; Belis, J.; Luible, A. Assessment of existing analytical models for the lateral torsional buckling analysis of PVB and SG laminated glass beams via viscoelastic simulations and experiments. Eng. Struct. 2014, 60, 52–67. [Google Scholar] [CrossRef]
  8. Bedon, C.; Amadio, C. Design buckling curves for glass columns and beams, Proceedings of the Institution of Civil Engineers-Structures and Buildings. Struct. Build. 2015, 168, 514–526. [Google Scholar] [CrossRef]
  9. Bedon, C.; Belis, J.; Amadio, C. Structural assessment and lateral–torsional buckling design of glass beams restrained by continuous sealant joints. Eng. Struct. 2015, 102, 214–229. [Google Scholar] [CrossRef]
  10. Belis, J.; Bedon, C.; Louter, C.; Amadio, C.; van Impe, R. Experimental and analytical assessment of lateral torsional buckling of laminated glass beams. Eng. Struct. 2013, 51, 295–305. [Google Scholar] [CrossRef]
  11. Kasper, R.; Sedlacek, G.; Feldmann, M. Das Biegedrillknickverhalten von Glasträgern aus Verbundglas. Stahlbau 2007, 76, 167–176. [Google Scholar] [CrossRef]
  12. Lindner, J.; Holberndt, T. Zum Nachweis von stabilitätsgefährdeten Glasträgern unter Biegebeanspruchung. Stahlbau 2006, 75, 488–498. [Google Scholar] [CrossRef]
  13. Luible, A.; Schärer, D. Lateral torsional buckling of glass beams with continuous lateral support. Glass Struct. Eng. 2016, 1, 153–171. [Google Scholar] [CrossRef] [Green Version]
  14. Machado-e-Costa, M.; Valarinho, L.; Silvestre, N.; Correia, J. Modeling of the structural behavior of multilayer laminated glass beams: Flexural and torsional stiffness and lateral-torsional buckling. Eng. Struct. 2016, 128, 265–282. [Google Scholar] [CrossRef]
  15. Sonck, D.; Belis, J. Elastic lateral-torsional buckling of glass beams with continuous lateral restraints. Glass Struct. Eng. 2016, 1, 173–194. [Google Scholar] [CrossRef] [Green Version]
  16. Haese, A. Beitrag zur Bemessung Scheibenbeanspruchter Stahl-Glas-Elemente. Ph.D. Thesis, Universität der Bundeswehr München, Neubiberg, Germany, 2013. [Google Scholar]
  17. Silvestru, V.; Englhardt, O. Stabilitätsverhalten von Kragträgern aus Verbundsicherheitsglas. Stahlbau 2015, 84, 213–227. [Google Scholar] [CrossRef]
  18. Hasani, B. Stabilität von Tragelementen aus Glas: Analytische und Numerische Untersuchung Kippgefährdeter Kragträger aus Verbundsicherheitsglas. Master’s Thesis, Technische Universität Graz, Fakultät für Bauingenieurwissenschaften, Graz, Austria, 2014. [Google Scholar]
  19. Feldmann, M.; Kasper, R.; Abeln, B.; Gessler, A.; Langosch, K.; Beyer, J.; Schneider, J.; Schula, S.; Siebert, G.; Haese, A.; et al. Guidance for European Structural Design of Glass Components; JRC Scientific and Policy Reports, Joint Research Center; Publications Office of the European Union: Luxembourg, 2014. [Google Scholar] [CrossRef]
  20. FARO 3D-Messtechnik und Bildverarbeitungstechnologie. Available online: https://www.faro.com (accessed on 14 June 2019).
  21. ANSYS Engineering Simulation & 3D Design Software. Available online: https://www.ansys.com/ (accessed on 14 June 2019).
  22. Neulichedl, T. Untersuchungen zum Biegedrillknicken von Kragträgern aus Glas, AB Stahlbau und Mischbautechnologie. Master’s Thesis, Universität Innsbruck, Institut für Konstruktion und Materialwissenschaften, Innsbruck, Austria, 2018. [Google Scholar]
  23. Bucak, Ö.; Schuler, C.; Meißner, M. Verbund im Glasbau–Neues und Bewährtes. Stahlbau 2006, 75, 529–543. [Google Scholar] [CrossRef]
  24. ÖNORM B 3716-1, Glas im Bauwesen-Konstruktiver Glasbau Teil 1: Grundlagen; Austrian Standards Institute: Wien, Austria, 2015.
  25. Timmers, R.; Wieser, A.; Lener, G. Untersuchungen zum Allgemeinen Nachweisverfahren gegen Biegedrillknicken nach EN 1993-1-1. Stahlbau 2016, 85, 558–564. [Google Scholar] [CrossRef]
  26. Beier-Tertel, J. Geometrische Ersatzimperfektionen für Tragfähigkeitsnachweise zum Biegedrillknicken von Trägern aus Walzprofilen. Ph.D. Thesis, Fakultät für Bau-und Umweltingenieurwissenschaften der Ruhr-Universität Bochum, Bochum, Germany, 2008. [Google Scholar]
  27. Van Duser, A.; Jagota, A.; Bennison, S. Analysis of Glass/Polyvinyl Butyral Laminates Subjected to Uniform Pressure. J. Eng. Mech. 1999, 125, 435–442. [Google Scholar] [CrossRef]
Figure 1. (a) Testing device, (b) coordinate system and definition of the imperfections, (c) definition of the measured displacements at the free end of the cantilever beam.
Applsci 09 03432 g001
Figure 2. Testing device and procedure exemplary for a fully tempered (FT) glass panel: (a) Failure of the first glass panel, (b) total failure of all three panels.
Applsci 09 03432 g002
Figure 3. Finite-element (FE)-model with geometry, material definitions, boundary conditions and part of the mesh.
Applsci 09 03432 g003
Figure 4. Range of the scatter of the G (23 °C, t) -curves (reproduced with permission from [11], Wiley, 2007).
Applsci 09 03432 g004
Figure 5. Exemplarily some results from the numerical simulations: (a) Lateral displacements v (mm, in y-direction), (b) maximum principal stress (MPa).
Applsci 09 03432 g005
Figure 6. Experimental and numerical load-deflection curves (values obtained at the free end of the cantilever beam) from test specimens with a glass-height of 150 mm.
Applsci 09 03432 g006
Figure 7. Experimental and numerical load-deflection curves (values obtained at the free end of the cantilever beam) from test specimens with a glass-height of 300 mm.
Applsci 09 03432 g007
Figure 8. Comparison of the ultimate loads.
Applsci 09 03432 g008
Figure 9. Proposed design buckling curves, based on v 0 = L / 400 and ϕ 0 = 0.01   rad , for different situations: (a,b) Single load F, (c,d) distributed load q, (a,c) fully tempered glass, (b,d) heat strengthened glass.
Applsci 09 03432 g009
Table 1. Overview of the test specimens.
Test SpecimenGlass TypeCross-Section [mm]Height h [mm]Length L [mm]Number of Specimens
FT_150_xFT10/1.52/10/1.52/1015021007
FT_300_xFT10/1.52/10/1.52/1030021003
HS_150_xHS10/1.52/10/1.52/1015021005
HS_300_xHS10/1.52/10/1.52/1030021003
Table 2. Measured lateral and rotational imperfections of all test specimens.
Test SpecimenLateral Imp. L / v 0 [–]Rotational Imp. ϕ 0 [rad]Thickness [mm]
FT_150_17820.01232.84
FT_150_24780.00733.11
FT_150_37240.00932.98
FT_150_45080.00833.15
FT_150_51359−0.00333.11
FT_150_619240.00533.05
FT_150_7172660.00733.27
FT_300_1121440.00132.99
FT_300_25879−0.00132.80
FT_300_320780.00132.92
HS_150_15320.01232.95
HS_150_24710.00433.00
HS_150_37960.00432.96
HS_150_414540.007- 2
HS_150_518460.012- 2
HS_300_115630.00532.74
HS_300_233840.00332.97
HS_300_311900.00132.99
Empirical Mean1561 10.00532.99
Emp. 5%-Quantile476 10.00132.79
Emp. 95%-Quantile4008 10.01233.18
1 Calculated without FT_150_7 and FT_300_1 (assumed as outliers). 2 No value obtained.
Table 3. Parts and material properties.
Material E   [ MPa ] ν   [ - ]
Glass70,0000.23
POM-C2,7000.35
Steel210,0000.30
Table 4. Estimation of the actual glass strength.
Test Specimen F exp [kN] f exp [MPa]
FT_150_612.15169
FT_150_712.12169
HS_150_47.3395
HS_150_57.2995
Table 5. Comparison of ultimate loads from experiments and numerical simulations for FT-glass.
Test SpecimenLoad Duration [s]Experiment [kN]FEM in [kN] for σ max = 120   MPa 1,2FEM in [kN] for σ max = 169   MPa 1,2
FT_150_111749.787.96/8.099.10/10.03
FT_150_2110210.427.99/8.109.41/10.22
FT_150_399810.208.22/8.269.65/10.62
FT_150_4110010.448.22/8.289.70/10.58
FT_150_511227.937.93/8.059.26/10.09
FT_300_1101519.4719.53/22.0019.53/22.00
FT_300_2100422.3519.11/21.5219.11/21.52
FT_300_386818.8019.73/21.6719.73/21.67
1 Calculated loads when the maximum principal stress reached σ max . 2 First value calculated with G min and second value with G mean .
Table 6. Comparison of ultimate loads from experiments and numerical simulations for HS-glass.
Test SpecimenLoad Duration [s]Experiment [kN]FEM in [kN] for σ max = 70   MPa 1,2FEM in [kN] for σ max = 95   MPa 1,2
HS_150_17376.254.69/4.696.39/6.40
HS_150_28708.094.70/4.686.36/6.41
HS_150_311706.144.79/4.786.53/6.53
HS_300_191318.3917.31/18.0318.63/20.76
HS_300_292517.8817.76/18.4019.06/21.26
HS_300_3121417.6317.45/18.0418.78/20.93
1 Calculated loads when the maximum principal stress reached σ max . 2 First value calculated with G min and second value with G mean .
Table 7. Used parameters and parameter range.
ParameterParameter Range
Thickness of a single glass pane t in mm8/12
Height of the glass beam h in mm150/300
Length of the glass beam L in m0.5/0.75/1.0/1.25/1.5/2.0/2.5/3.0
Shear modulus G in MPa0.05/0.20/0.40/0.80
Load distributionSingle load F at the free end of the beam/Distributed load q over the whole beam length
Number of glass panels2/3

