1. Introduction
Biosensor-based Internet of Things (IoT) devices combined with intelligent wireless technology and data-mining techniques lead to a better healthcare system for investigating information using interactive patient monitoring methods. This new interactive healthcare system will gather information from a patient within a short period of time using biosensors and sensor-less devices. Researchers believe that the collection of medical information is one of the major parts of healthcare research [
1]. Human–Computer Interaction (HCI) is therefore crucial for gathering a greater amount of patient information with less effort and less time to analyze.
A huge amount of ongoing data is produced by the healthcare system, and comes in unstructured or semi-structured format. To store this information, current healthcare systems use electronic health records (EHRs). As indicated by the data analysis of healthcare, US healthcare produced 150 exabytes of medical data in 2011 [
2]. That amount had reached the zettabytes in 2014. It is necessary to negotiate an interactive healthcare system with this big amount of medical data to uncover hidden patterns, and search for unrevealed correlations from prior medical information of patients. The main task in medical data analytics is to address the characteristics of big data identified by the 5 Vs: volume, velocity, variety, value, and veracity. In this new interactive healthcare system, patient data comes from various sources, describing the volume of data. The arrival rate of data represents the velocity of data. The doctor’s note and the other clinical reports come from numerous sources, and those data come in structured, semi-structured, or unstructured format, which describes the variety. Those data need to be analyzed to reveal meaningful information, which is considered to be the value of data. There are many uncertain numbers, in the data which we call hidden data, and they represent the veracity.
Some advanced technologies, such as tensors, cloud computing, and some intellectual frameworks, are used to analyze big data [
3,
4,
5,
6,
7,
8]. Big data processing, however, leads to problems, as much semi-structured and unstructured information exists. International Business Machines (IBM) healthcare researchers found that 80% of big data in healthcare is unstructured. They also claimed to recover helpful patient information and rendered these data in a structured format, and these comprehensive unorganized data need to be examined [
9]. As digital data has proliferated, IBM scientists have compared the volume of the last decade’s structured and unstructured data. According to International Data Corporation (IDC) research, among all the complete incremental digital data, almost 90% of the data are unstructured [
10]. The unstructured and semi-structured dataset may contain appropriate data information, and this is the reason for providing inaccurate dataset information.
An interactive healthcare system needs to provide a user-friendly environment for data analysis. HCI in data analytics can activate data visualization with the help of new technologies. Data analytics is indispensable for user understanding, and HCI in data analytics can facilitate that efficiently and accurately. Advanced HCI solutions generate not only confidential data but also represent data analytics result more efficiently. To promote the diagnostic impact, HCI in data analytics enables visualization of the graphical perspective of data.
From all the medical data of a patient using big data analytics and HCI, the interactive healthcare system must predict the disease of the patient and should predict probable illnesses that a patient may suffer in the future. The predictive facility should also be available for the interactive healthcare. To accomplish this objective, a prediction algorithm could be used. There is a powerful connection between the model of prediction and the quality of medical data. Some scientists have been experimenting with prediction analysis in medicine over the past year and describing the significance, and also showing the healthcare enhancement through prediction analysis.
The Prediction Model helps to minimize the treatment variations and the unexpected costs, such as an unnecessary medical test, to know from what types of disease a patient is suffering. The interactive healthcare system must be standardized with respect to the outcome of the predictive model with other functionalities, minimizing the expense of the healthcare system. Doctors do not have to wait for the results of a large number of medical tests to diagnose a disease using the prediction outcome. This prediction model enables physicians to interact with their patient rapidly, and by decreasing diagnostic time and unnecessary therapy costs, HCI offers better service for both therapist and patient.
Within this paper, we have proposed an interactive healthcare system named iHealthcare, which uses a patient’s logical reason (e.g., symptoms of a disease) and feelings as the input data along with the patient’s medical history and genetic data. This system can review the data and predict what the patient is suffering from. It will provide users with a visualization of those data. The system can provide adequate treatment in a quicker manner based on prediction analysis. In addition, the scheme can decrease unnecessary and costly testing, minimize oversight of drug prescription and medication administration, and reduce preventable casualties.
We can summarize our contribution to this paper as follows:
An interactive data-collection scheme gets data with less difficulty using IoT devices and sensors.
Significant data analysis of unstructured and semi-structured data creates a structured database and stores the data efficiently.
A two-way connection and compatible data warehouse with a high-performance computer (HPC) and cloud synchronization can store medical data for the future.
This system can address disease symptoms, the emotional state of a patient, genetic data, and previous medical data about patients.
A prediction model can predict both cost calculation and disease prediction in a faster way.
We have organized this paper as follows.
Section 2 presents some related works,
Section 3 describes the system architecture,
Section 4 reviews the problem formulation and brief system architecture of the system. The experimental results are presented in
Section 5, and the last
Section 6 is the conclusion.
2. The State-of-Art
The healthcare industry has been continually improving over the past half-decade, using sophisticated techniques to keep track of patient data. However, a more advanced medical system is being developed by scientists. Many scientists have recently suggested several alternatives to enhance the quality of healthcare. Among those system, “BDAEH” provides a potential method to enhance the service of the medical healthcare system. This suggested technique addresses the appropriate physical and emotional information of the patient and then analyzes the data to provide better medical facilities [
11]. “BDAEH”, however, neglects two key variables: a patient’s medical history and their genetic information. “IHEMHA”, another suggested healthcare system, is concerned with these significant variables and shows the importance of prediction analysis [
12].
While researchers are developing the interaction between the healthcare industry and the patient, some have also clarified the significance of important data analysis. They outlined that medical data could provide healthcare organizations with future possibilities. Researchers have also prioritized the importance of analyzing big data in healthcare as data increases in the time domain [
13,
14,
15]. There are still some techniques suggested that could improve a medical system’s interaction and improve the healthcare industry’s service. The EHR is such a solution that can gather data from the patient and analyze it. For the development of a diagnostic model, some other healthcare decision support systems have been suggested, applying some machine-learning algorithms to medical data [
16,
17]. While these models provide helpful techniques for enhancing the healthcare service, a drawback of these schemes is the data storage capacity that the patients generate. Medical images, and signal and genomic data are another important information source for big medical data. These data also need to be processed and analyzed as they also have [
18].
Researchers are currently researching an interactive solution for the storage of medical data [
19,
20,
21]. Some experts suggest not only using a cloud server for big data analysis, but also providing rapid computing with prediction analysis, which plays an important role in the various clinical circumstances [
22,
23]. An additional concern, while dealing with big data from the database, is to handle the missing attributes. According to academics, the Markov model could be a solution to handle missing data [
3].
Researchers have shown that medical data are being collected from the patient continuously, which will lead to the storage of a significant amount of data, and could be difficult to handle using the existing technology. The reason for this is that those collected data are somewhat unstructured, semi-structured, or sometimes structured. We need to use a structured database before evaluating these data to prevent unnecessary errors. MapReduce would be effective in converting the unstructured and semi-structured dataset to the structured dataset. MapReduce algorithm can handle the huge quantity of data and can faster transform these data into a structured format [
1,
24].
The emotional state of a patient is another critical factor in detecting disease. Emotion is a complex method that involves facial expression and responses, intuition and behavior. Scientists have studied the feeling of a patient. The Emotion API is one of the pieces of research on emotion detection that can identify a person’s emotional state from images and videos [
25]. There has been some research to classify emotion using Heart Rate Variability (HRV) features [
26]. The HRV features deal with multiple signals that a patient produces in order to extract the emotional state. MIT scientists have recently created a piece of technology to acknowledge human emotion by transmitting Radio Frequency (RF) signals that can obtain emotional data from anyone using a heartbeat extraction algorithm where the RF signal can calculate group segments and detect a person’s emotional state by classifying a subsystem [
27]. Furthermore, some IoT systems are accessible to continually monitor a patient’s condition to identify their external and internal issues, such as blood pressure, blood sugar, oxygen, and diabetic levels.
To create an advanced interactive healthcare system, researchers are currently continuing their research. We have presented an interactive healthcare design in this article that will be of assistance to all types of users.
3. Architecture of Proposed System
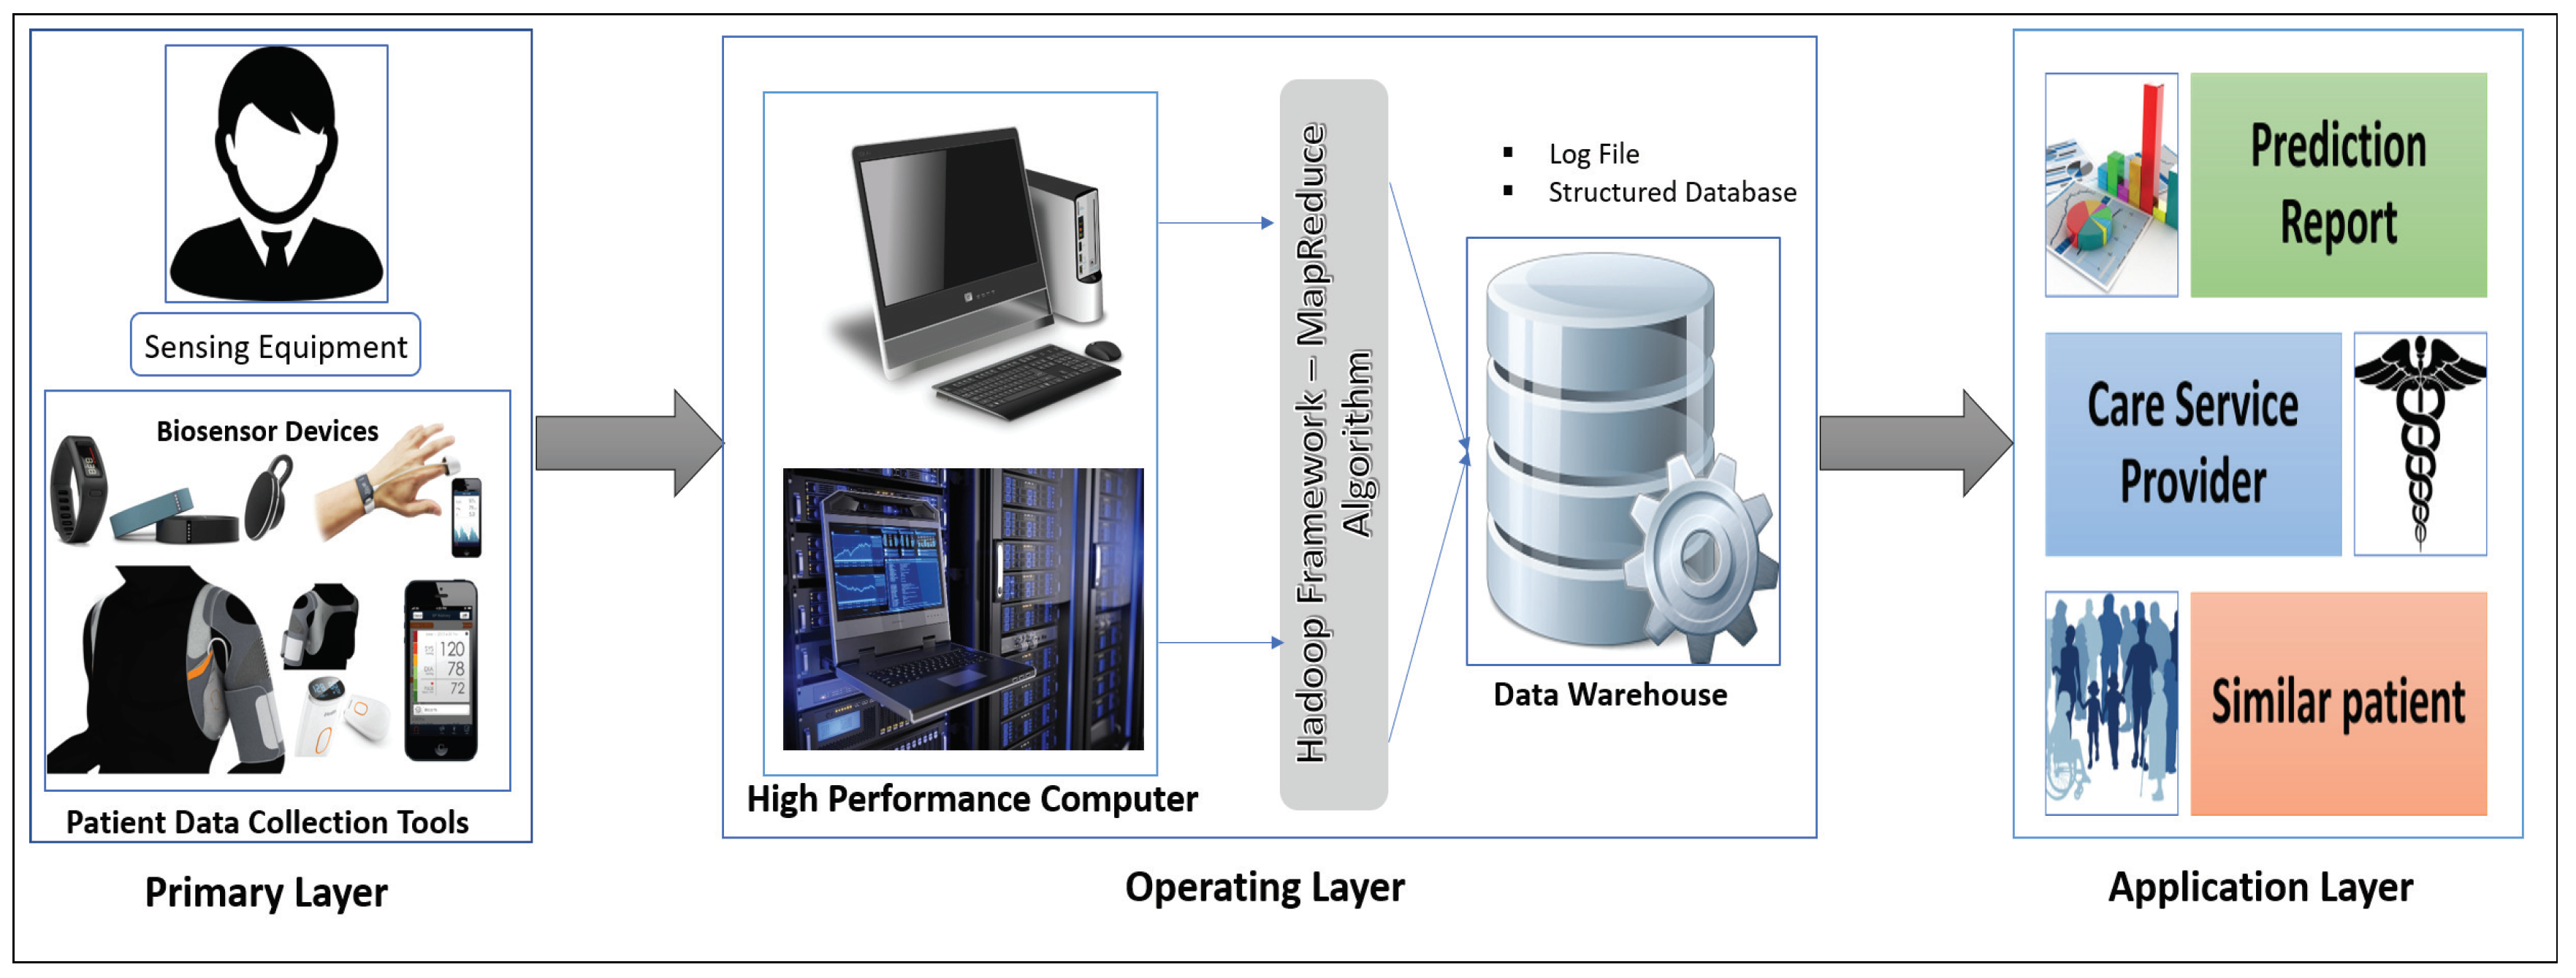
Our proposed interactive healthcare system architecture focuses on three phases, as shown in
Figure 1: data collection with the unique interaction of smart biosensor devices, analysis of a massive volume of data from individual patients and hospitals for future disease prediction, and discovery of patterns within similar patients.
The system will compute the biomedical data and the emotional condition of the patient through biosensor devices. The medical history, images, and signal data will be gathered from the hospital server. Those data are then sent for initial evaluation to the HPC server. In our system, the data-collecting phase in HPC is called the Primary layer of the data analysis scheme. In this Primary layer, all types of data (current and previous patient data) will be collected including disease symptoms, genetic data about the patients and emotional data.
The next segment is the Operating layer. Here all of the collected data from the Primary layer will be the input of this layer and all of the uncategorized and unorganized data will be categorized by some programming model such as the Hadoop MapReduce framework, which will be applicable for creating a structured database with a log file and metadata. Those metadata and databases will make for good user interaction in data management. After the log file and the database has been created, these will be incorporated and sent to another high-performance server called a data warehouse. The log file is used as metadata for providing a fast searching capability and analysis. This layer also stores all the structure data of the patient, and all the data transfer to the next layer via HPC, which is the Application layer.
In the Application layer, the data warehouse sends the database to the data center for data storage located in the cloud. The cloud provides the facility of fast computing, to diagnose a disease and predict future diseases, and enables other facilities based on the prediction outcome. Finally, all the analyzed results will be sent to both users (patient and physician).
4. Problem Formulation and Brief System Architecture
A cloud-based healthcare environment enables the access to store information in a continuous time domain and further analysis through fast computing capabilities. The HPC collects the healthcare raw data and manages the data for processing to explore the most valuable information. In traditional healthcare systems, hospitals are the main source of generating healthcare data. We consider a hospital along with individual patients as they are the major source of the proposed interactive healthcare environment. Consider an interactive healthcare system where patients are in set where the total number of patient is There are some patients who consult with a doctor but do not need to stay overnight in the hospital. Those patients are continuously monitored through many biosensor devices. Some patient consult with a doctor but need to stay overnight in the hospital. We consider all patient in the set P. The major source of generating biomedical big data is the hospital. We consider k number of hospitals are in a set where . It is assumed that n number of departments are associated with each hospital in a set where . Suppose there are l number of doctors who are working on a department in a hospital. We consider the set such that and . The relationship illustrates the hospital within department, where and . For example, refers to the 4th doctor in the 1st department of 5th hospital. As we analyze all the big data in the common HPC server, the patient and doctor set would be and respectively.
In the proposed model, it is assumed that data are gathered in a continuous time domain. The HPC will do a linear regression over the data considered in the Y-axis and time in X-axis for the primary prediction analysis. Then the analyzed result is sent to the cloud data center. HPC also sends the biomedical data to the cloud in a time interval t, where t refers the change of biological data over time. All data centers where relate to data warehouses, where . The future prediction analysis will be done in the cloud server.
4.1. Primary Layer
The Primary layer of the proposed architecture is an interactive data-collection scheme which helps to explore the most crucial information and discover valuable knowledge. HCI is essential for collecting healthcare data which can play a vital role in providing sophisticated outcomes.
4.1.1. Data Collection
Our proposed data-collection scheme focuses on data generated by the individual patient and overall data generated by a hospital. An interaction between patient and smart device can provide a better outcome to the new healthcare system and explore more information to diagnose a disease. Presently, a lot of biosensors, motion sensors, and wearable devices including smartphone and smartwatches are being developed to measure a patient’s heart rate, temperature, breath rate, ECG, back pain, and many other medical parameters. Those devices can compute a user’s biological condition and transmit the result to any server. Another important fact related to health is a patient’s emotional state. We adopt an advanced emotion-detecting technology known as EQ radio, which is used to find out a user’s emotional state. The patient’s medical history will be collected from the hospital server. A doctor’s note is collected from e-prescription. The EHR also provides many more data about an individual patient. Another significant source of data is the medical clinic and hospital. Those hospital data are gathered from the medical hospital server. A cloud-based environment can provide some social networking facilities as well as secure storage and high computing capabilities. We create interactions between all patients and doctors through cloud-based social networking to collect similar patients’ public health status as well as familial genetic syndromes. Altogether, all those data are sent to a high-performance computer server.
4.1.2. Data Acquisition
Our primary data sources are patient and hospital. A patient generates data through the visiting frequency to a doctor in a hospital or through some wearable device. The data source of a hospital is their doctor and patient information, medical billing information, and biomedical research and medical test results. In our proposed system, we analyze the data generated by a patient to provide a better outcome in the hospital and make a functional interaction between doctor and patient.
Definition 1. An individual patient generates at least amount of data in a visiting frequency to a hospital.
Proof. Suppose a patient generates w amount of data through some wearable device. As biomedical factors of a human change in the time domain, thus we take the latest data of the wearable device. The frequency visit of a patient is v in time interval t to the department of hospital, where and . In each visit, a patient generates some data through the doctor’s note which is generated when a patient consults a doctor D and some medical test and patient information which are kept in the department’s server. We take the union set of doctors and department, represented respectively as and .
Thus, a patient generates
amount of data at a hospital. The genomic sequence g of a patient changes very slowly, thus we assume that any genomic sequence is constant. So, the equation can be expressed as Equation (
1).
It is noted that the data generation of a patient increases very sharply when the visiting frequency is increased to a hospital. ☐
Definition 2. Data generated by a hospital for all patients is at least .
Proof. A hospital consists of various departments. Those departments generate a lot of medical data. Two types of patients generate data for a hospital. The first type consults with a doctor, but they do not stay overnight, and their generation of data is at least
, proved in Definition 1. The other type of patient stays overnight in the hospital and generates more data. In a hospital, data consists of both text data such as a doctor’s note and some medical test reports, and image data such as X-rays and signal data, e.g., ECG or heart rate. The patient who stay overnight in the hospital generates s, t, and u megabytes of data from text, image, and signal, respectively. The data made by a patient in a hospital is f(TD), f(ID), and f(SD), where TD refers to text data, ID means image data, and SD is signal data. A patient generates
amount of data in a hospital, which can be expressed by Equation (
2).
Total medical data generation for a patient is
shown in Equation (
3).
Thus, the data generated by a hospital for all patients is at least
in Equation (
4).
☐
4.2. Operating Layer
A massive amount of healthcare data needs to be processed and analyzed, and it requires provision of a storage system which, will be done in the operating layer. HPC collects all unstructured and semi-structured healthcare data from different sources. To get a structured distributed file management system (SDFM), HPC applies the Hadoop MapReduce framework over the unstructured or semi-structured data. Then, the SDFM is sent to a data warehouse which creates an interaction between the Operating layer and Application layer.
4.2.1. Hadoop MapReduce Framework
In the data-collection phase, HPC collects healthcare data in a continuous time domain. Hadoop provides the “Hadoop Distributed File System” (HDFS) to store those data in a structured database.
The MapReduce algorithm has two primary class—the mapper class and the reducer class—which enables making a structured distributed database from raw unstructured and semi-structured data. The data record is kept as input in the mapper class with an assigned key to the corresponding value of the data record. Then, the Map function shuffles those records, sorts them, and sends them to the reducer class. The reducer class merges the same keyed data as per the algorithm instruction and provides the structured database, which is stored in HDFS.
To apply the MapReduce framework, let us consider that HPC provides
number of active servers shown in a set
. The server set performs parallel computation in the operating layer for the MapReduce framework. From the (
4), we need to analyze
amount of data. Each server receives the input dataset and makes multiple partitions for parallel distribution and computation. Suppose the input dataset is divided into k number of partitions or chunks. Thus, each partition size will be C, which is represented in Equation (
5).
Therefore, C amount of data quantity is distributed in each partition block of each server for analysis and sent to the set of Mapper class M where and m are the number of map functions. The map() then tokenizes all the input records with the key and value, and sends on to reducer class. Let r be the number of the reducer function in a set of reducer class R where and . reducer() receives the mapped data and shuffles and sorts them and provides a structured database that sends to the data warehouse with all metadata and log files.
4.2.2. Architecture of the Data Warehouse
Our proposed interactive healthcare system holds the structured clinical database in the data warehouse and enables more functionality. After analysis of the data in HPC storage in HDFS, the database with metadata is sent to the data warehouse. The data warehouse keeps the clinical database with the modification of metadata and sends the database to the cloud server for fast computation facility with higher accuracy and privacy. There is two-way communication between the HPC and the cloud server. The primary purpose of a data warehouse is to keep track of all the data in the database with the metadata along with log files. It will make an interactive environment of the doctor, patient, and system developer. The user can search and get the information quickly from the data warehouse, even if they are not familiar with any programming languages. This warehouse can take the user question and then convert it as the query language using natural language processing (NLP).
The architecture of data warehouse holds two units: metadata with log files and structured clinical database. Nodes work with metadata to do faster searches and access the clinical database. For the system developer, it is essential to provide a developing interactive environment and provide a facility to omit a complex query. Thus, metadata offers exploratory information extraction through its log file system and distributed database. The top unit of metadata holds the knowledge graph, which maps with the information base and log file. In this unit, we apply NLP to extract the information of a given query interactively. The log file contains some intent keywords such as blood pressure, respiratory rate, etc., and the knowledge of database table is attributed, establishing the relationship of every table to one another. The other part of a data warehouse is a clinical database which makes the communication between the cloud server and HPC. When a user wants to search something, the data warehouse takes the question and converts it into a query with a convenient word, and makes a map from the information base and knowledge graph and sends it to the cluster node for parallel computing to provide a fast searching facility. In
Figure 2, we show the architecture of the data warehouse for an interactive healthcare system.
4.3. Application Layer
The Application layer starts from the cloud server, where all users of the system need to create an account and will provide their necessary information. This is essential for mapping all the users to their family members so that the system gets the genetic information of all users.
Prediction Model Pipeline
Prediction analysis provides the early detection of a disease, which can minimize the cost of hospitalization and reduce mortality rate. A proper estimation of early disease prediction can provide an accurate diagnosis and fast treatment facility to a patient. Thus, we build a prediction model pipeline to predict a disease more accurately.
Prediction Target
Prediction target is the intersection of the interest set of disease and the possible set of disease. Suppose
is the interest set of disease which is calculated by etiology analysis.
be the set of possible disease measured by clinical vital signs and observation tools, which we collect with biosensor devices. Thus, the prediction target is represented in Equation (
6).
In the top unit of prediction modeling, we use the MapReduce algorithm to analyze a patient’s etiology function. A patient’s genetic sequence, such as DNA information, is a constant value collected from the patient’s cloud server. The severity of diseases in specific geography at a given time interval will be gathered from the cloud database, and the epigenetic features or the genetic diseases to which a patient is exposed will be collected from his medical history. All those are put into the map class for tokenizing with a key and value, and then sent to reduce the class to get interest sets of disease. We take some vital signs which we are integrated with a patient’s emotional state to get the possible set of disease.
Cohort Construction
To construct the cohort, we take a study sample from the total population (all test cases from the database), which we get from our database. Then, we identify the patient who exposes the risk factor of the target prediction disease. For example, let us imagine that a target prediction of a patient is heart failure. Therefore, in cohort construction, we take the study population of all heart failure patients. The key to the cohort study is to identify the clues of the correct inclusion and exclusion criteria. From cohort construction, the system will set its training dataset and test dataset and can to find the hidden evidence of disease.
Feature Selection
The important clinical feature selection for the target predicted disease is another important factor in disease prediction. The complexity of the prediction algorithm depends on feature selection. A clinical feature which is related to a disease is a subset of a total number of biomedical functions. Let us consider there are n number of clinical features produced by a patient who is represented in a set . Among them, f number of features are responsible for a specific disease. Those features responsible for a disease are a subset of the total features, thus we can say . Thus, it is necessary to extract the features from all medical attributes.
Now, if a patient generates the ∂ amount of data with an n number of clinical attributes, then number of the subset is possible as a set of relevant features. From that, the optimal subset of the clinical feature needs to be extracted. A comparison is the most expensive operation if there is an increasing number of clinical features. The rank matrix algorithm may also be used for feature selection to rank the features by their information gain. However, the cost of this algorithm is also higher as several operations take place for gain calculation. Thus, we apply the genetic algorithm to calculate the fitness of the feature and eliminate those features which do not get adequate fitness.
Prediction Algorithm
The predictive model is a function of input feature of a disease and output target disease, which is represented mathematically in Equation (
7) as
Where T is the predicted target disease,
is the set of target features which is extracted from all clinical features, and e denotes error. Equation (
7) shows that if we know the clinical features, past medication, and the medical history, we can identify the disease. This equation also shows the prediction model is either a regression problem or a classification problem. If a patient wants to predict the cost of the disease, which makes an impact on his biological condition, then T is continuous, and it is a regression problem. Popular data-mining techniques such as linear regression or the generalized additive model can be used for regression analysis. In the classification problem, T is categorical, which denotes whether a patient suffers a disease or not. Some well-known techniques for predicting classification problems are Decision Tree (C5.0), Naive Bayes (NB), Artificial Neural Network (ANN), Random Forest (RF), and Support Vector Machine (SVM).
Evaluation Criteria
We applied the prediction model to a test dataset to predict the class of unseen data. The performance of the model is measured for getting unbiased establishment from the generation of errors. A confusion matrix is a useful tool for identifying the class level and the model performance. The accuracy of the model is measured by the correct identification of a classifier from the given test dataset. Sensitivity and specificity refer to true positive rate and true negative rate of the classifier which the model correctly classifies. The confusion matrix involves the risks and gains as well as cost and benefit in a classification model.
5. Experiment and Result
We conducted our experiment with R programming language using RStudio (Version 1.0.153—©2009–2017 RStudio, Inc.). The pre-processing stage is carried out to establish a structured database in Linux Mint environment installed on a virtual machine. Java Eclipse Integrated Development Environment provides the facility to implement the MapReduce algorithm. We collect two different sets of patient data for our simulation. We use a dataset of fetal cardiotocogram (CTG) for measuring the fetal heart rate and uterine contraction. This dataset is considered with a less hidden value which has 21 features with 3000 patient observations, and after pre-processing there were 2126 patients. The CTG dataset contains a categorical outcome in three categories: Normal, Suspect, and Pathologic. The diabetic’s dataset represents the more hidden state, and dissimilarity among the attributes with eight features are used to identify the binary outcome with 1000 patient’s observation (after pre-processing there were 768 patients) which predicts whether a patient has diabetes or not. We toured various hospitals in Dhaka, Bangladesh for the data. We have monitored some patients to produce data using certain IoT equipment and our datasets are gathered from an organization called Data Analysis and Technical Assistance Limited (DATA), which offers data for public use.
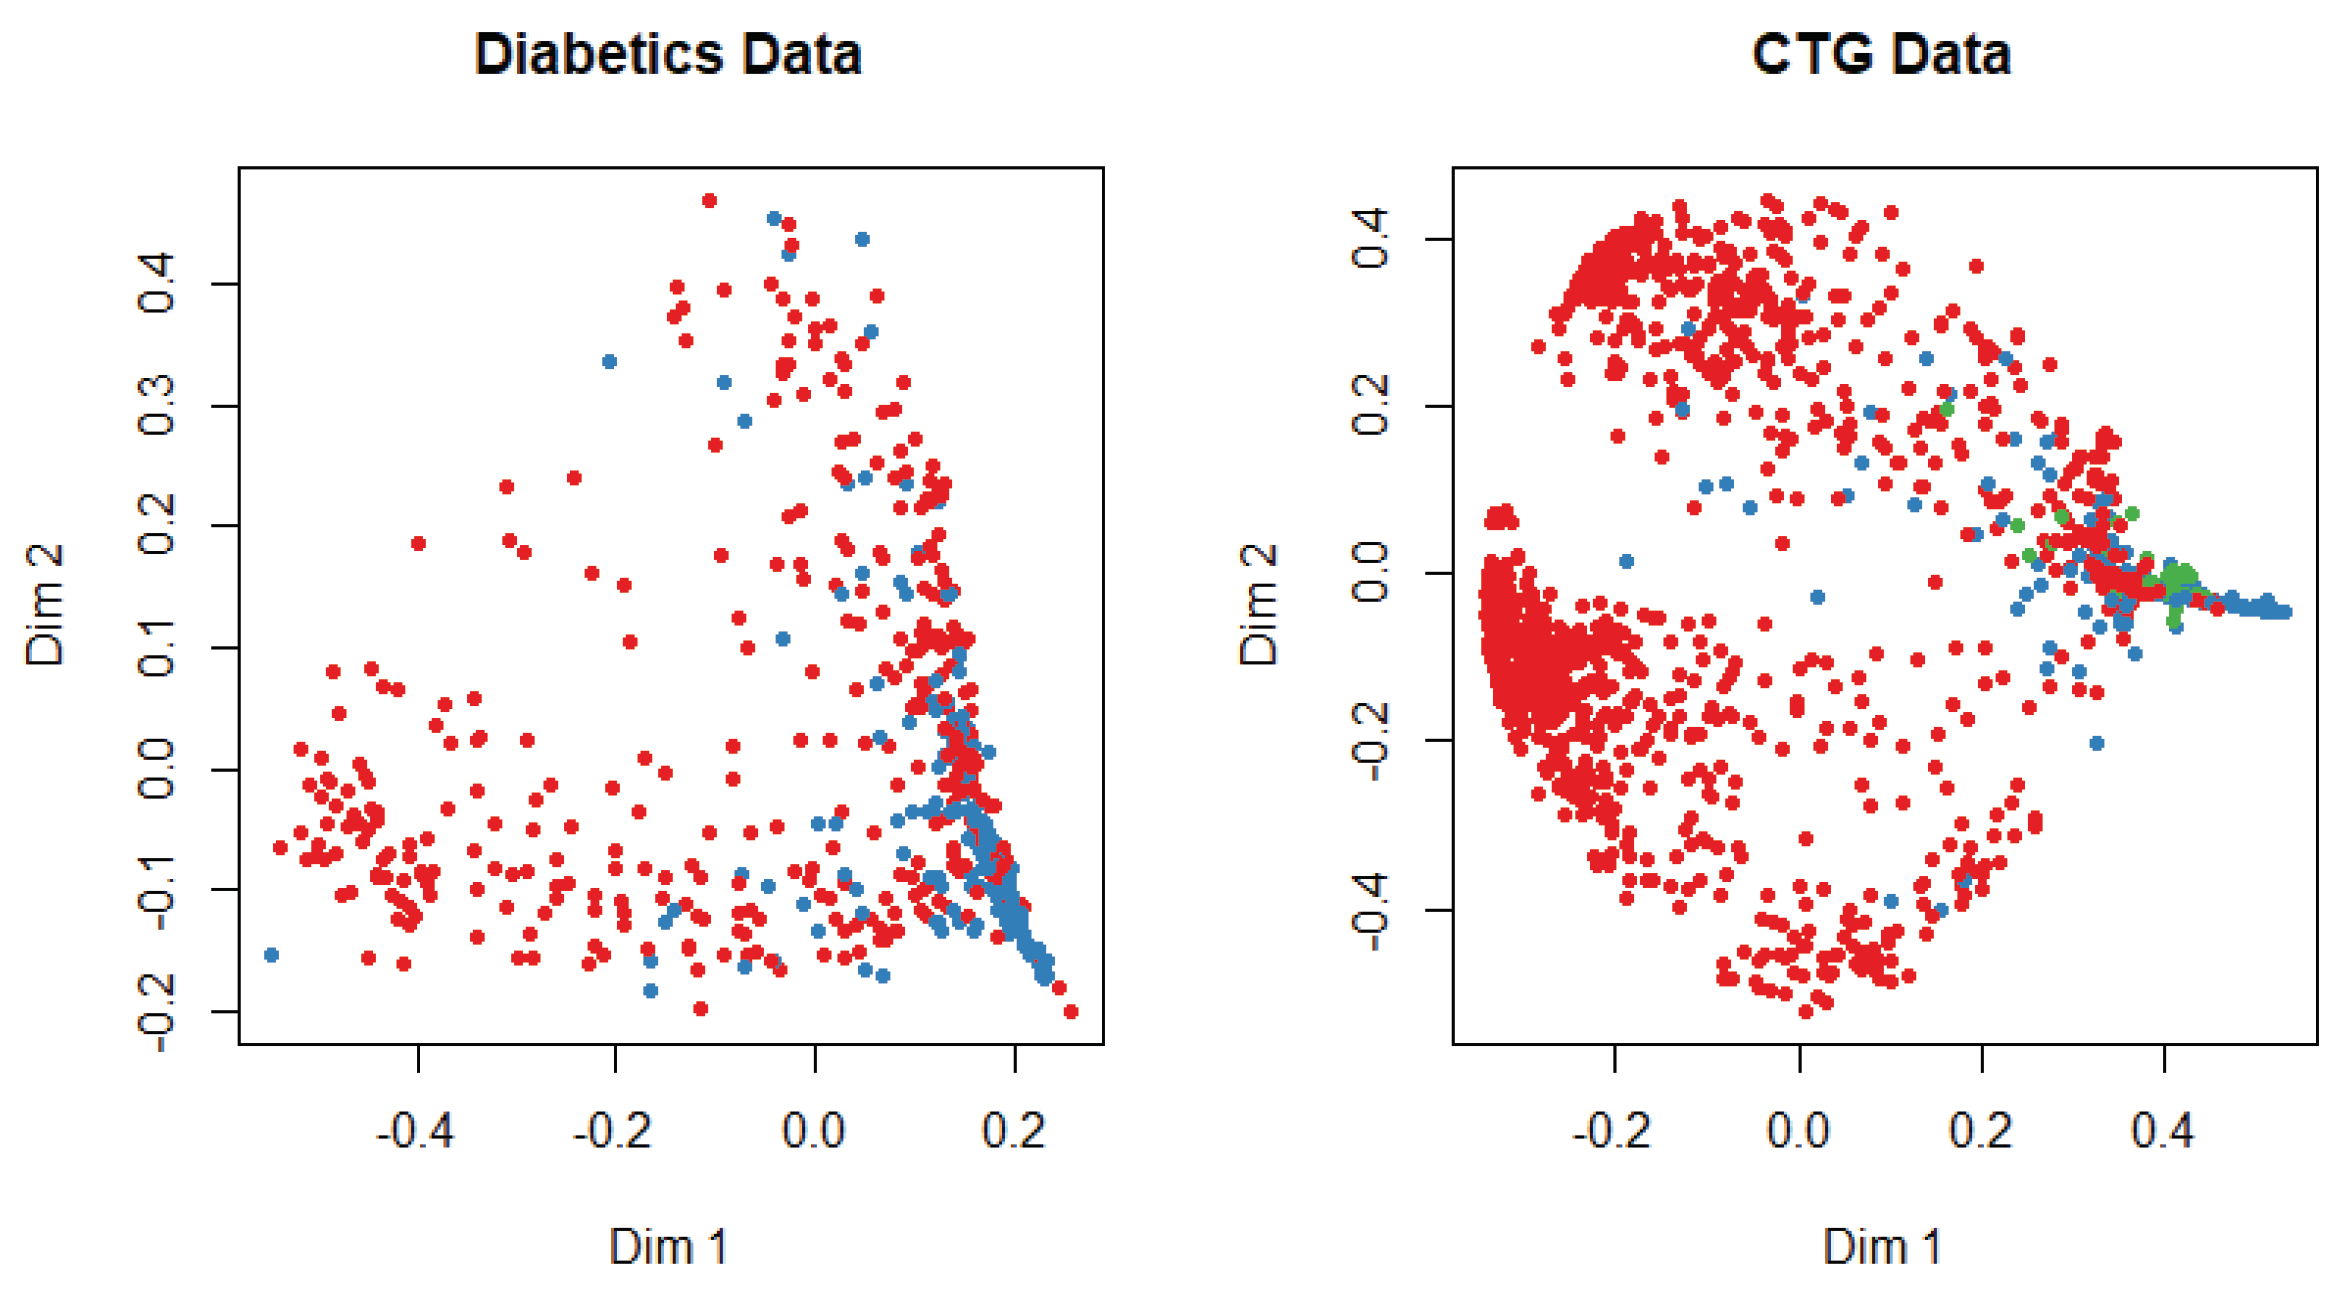
At the beginning of the simulation, the packages and library files are initialized for the smooth experiment. The dataset is divided into training and test data with a probability of 0.7 and 0.3, respectively. We apply several machine-learning algorithms on both datasets and get different accuracy for a different algorithm. The multi-dimensional scaling plot is shown in
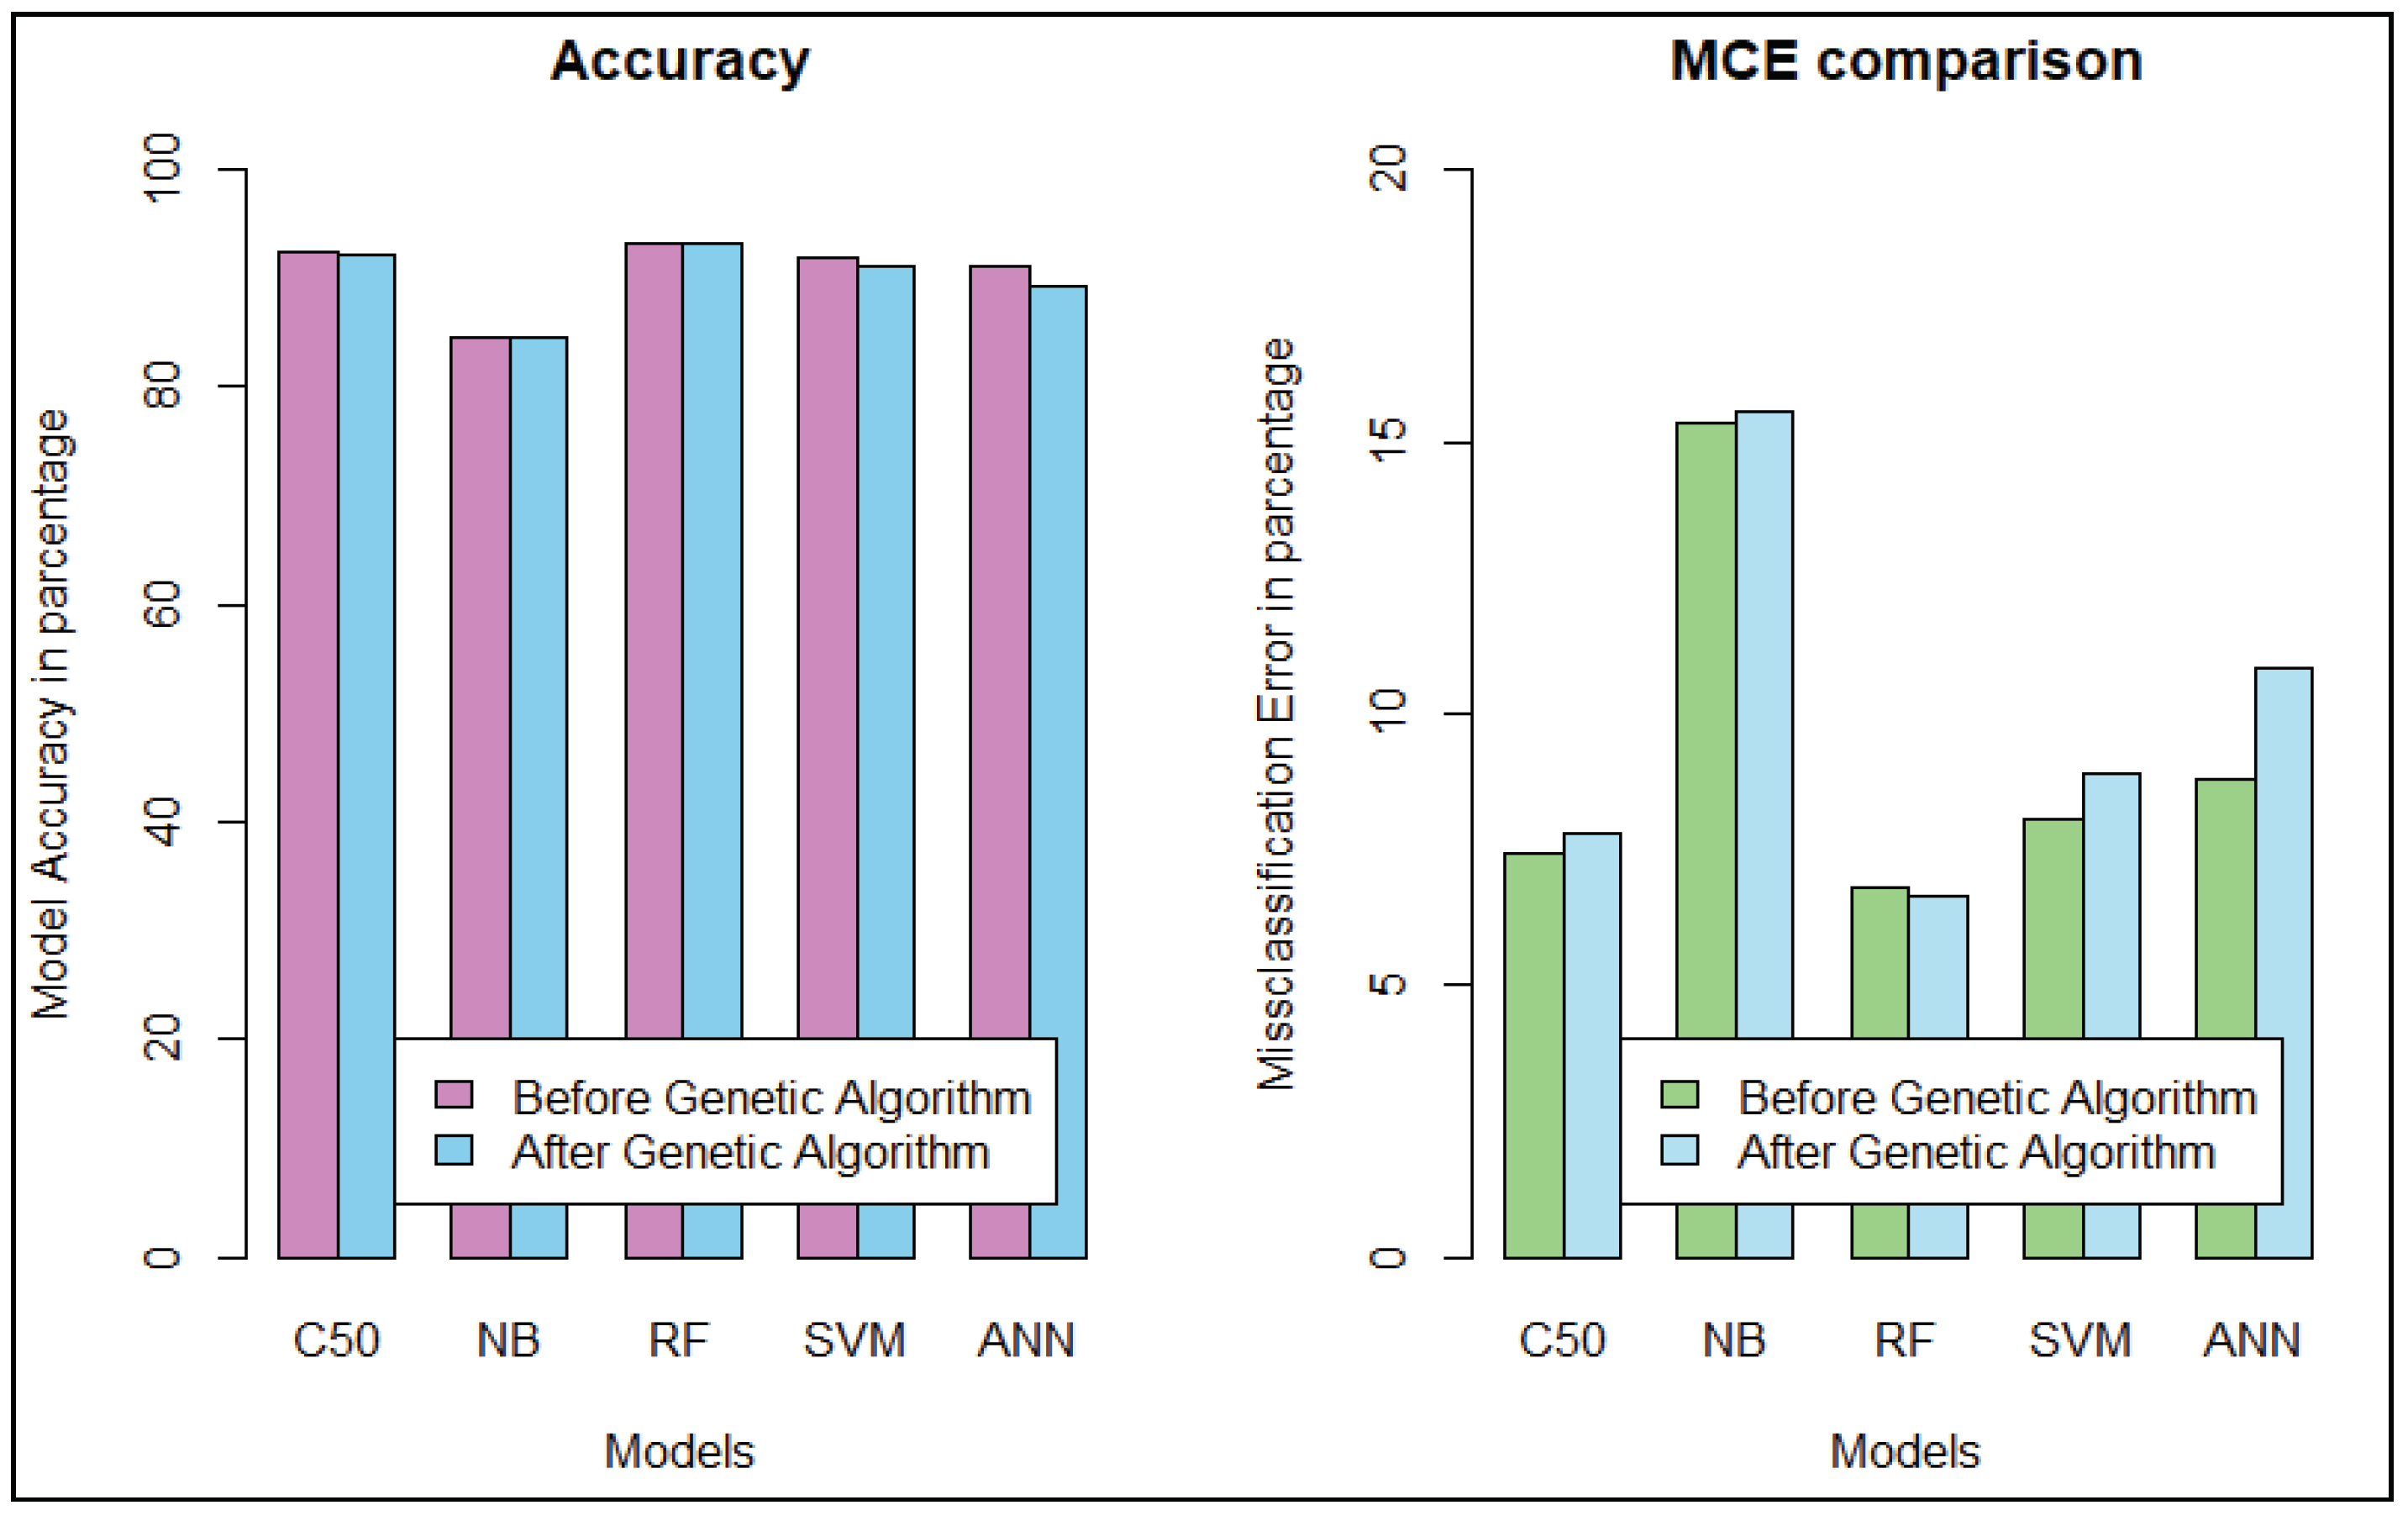
Figure 3 to understand the similarity of the outcome of both datasets. This plot indicates that data are more scattered for diabetic patients than for the cardiotocogram patient. To identify the relationship between features, we calculate the correlation coefficient of data. We get a positive correlation among features of both datasets. We incorporated the genetic algorithm to eliminate the irrelevant features. In the genetic algorithm, we use the default mutation and crossover probability which is 0.1 and 0.8, respectively. After extracting features, we apply different classifiers such as random forest, support vector machine, artificial neural network, C5.0, and Naive Bayes algorithm to predict a patient disease. We also apply those classifiers before we implement the genetic algorithm to identify the best performance. In diabetic dataset classification, 0 denotes the patient who does not have diabetics, and 1 indicates the diabetic patient, whereas in CTG, 1 indicates regular patient, 2 indicates the suspect and 3 represents the pathologic. A comparison is shown in
Table 1 and
Table 2. Evaluation criteria for diabetic patient data describes the prediction evaluation of all classifiers for the diabetic dataset before and after applying the genetic algorithm.
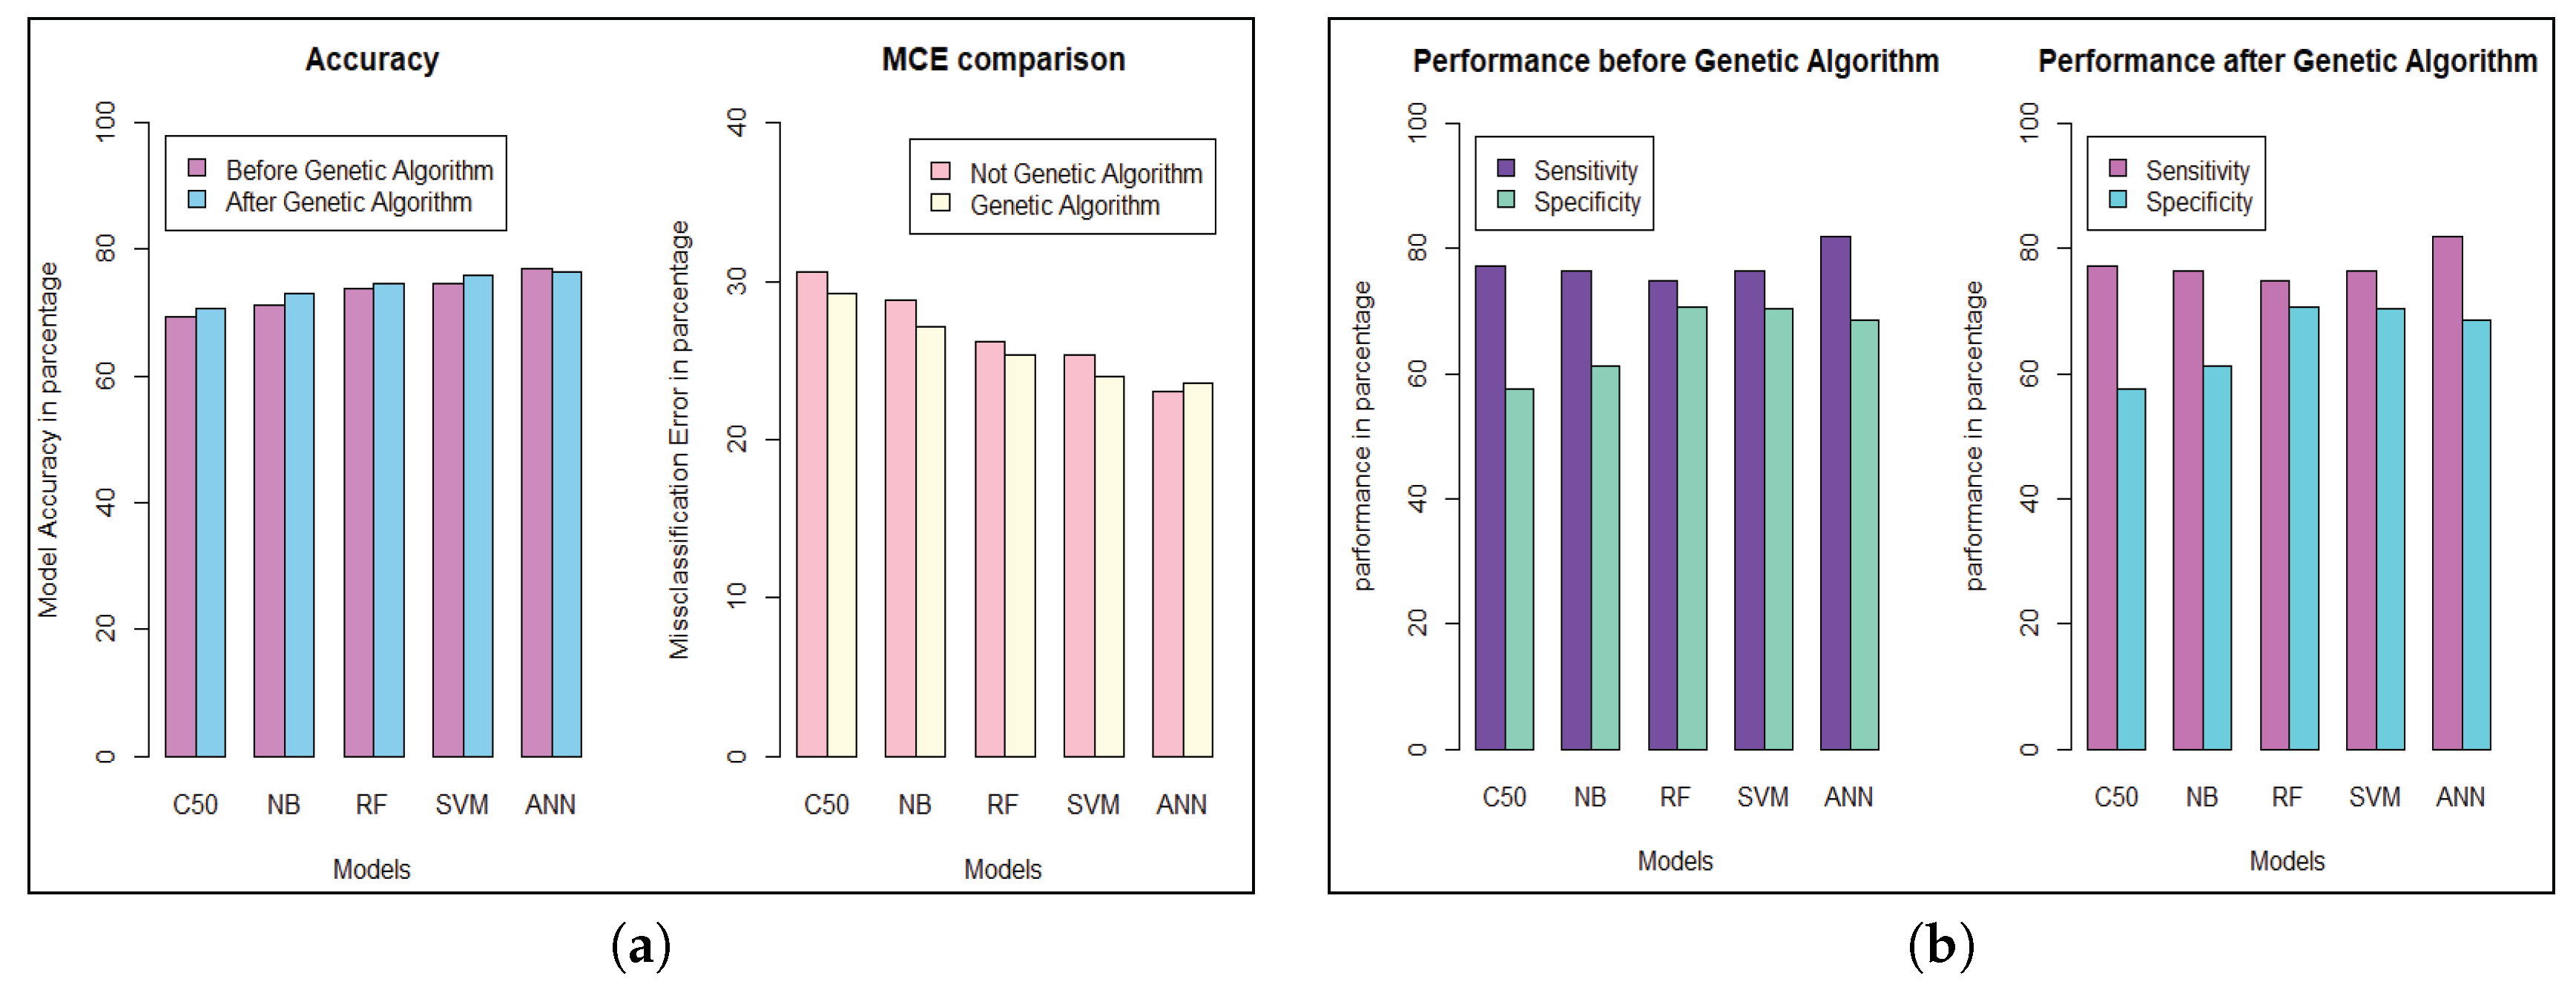
We get the highest accuracy in the artificial neural network for the diabetic dataset, but this model takes maximum time to develop the model. After implementing the genetic algorithm, we can minimize the model construction time, but it slightly decreases the accuracy of ANN where another model’s performance is enhanced. A comparison between different algorithms is shown to illustrate the accuracy and misclassification error with model performance for the diabetic patients, as represented in
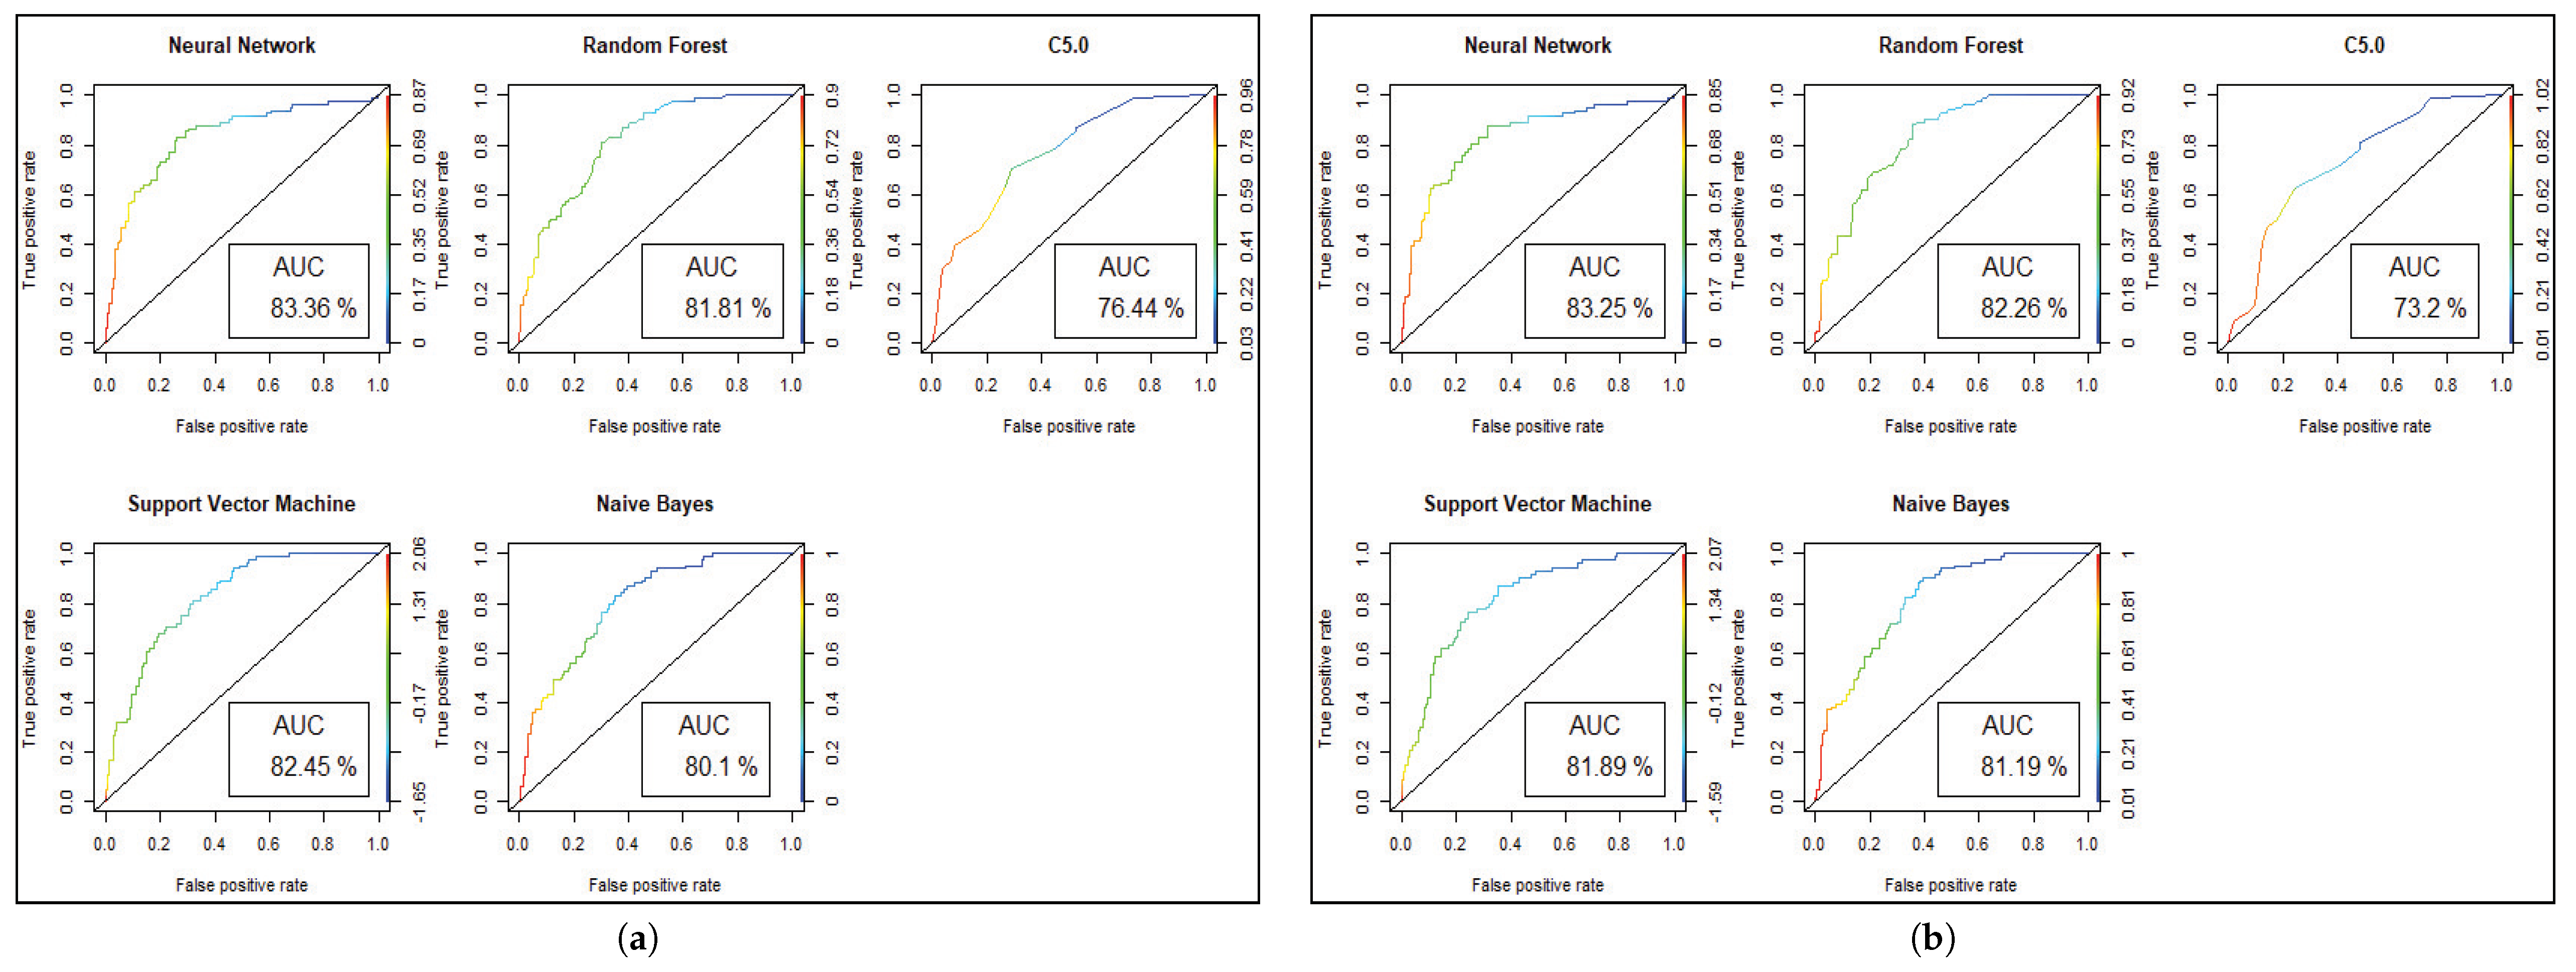
Figure 4. For visualizing the performance of the classifier, a graph of sensitivity (TPR) over specificity (FPR) is shown in
Figure 5. The ROC curve for the diabetic prediction model shows that ANN can predict well in both scenarios compared to other models, and we get 83.36% AUC for ANN before implementing the genetic algorithm. The different model predictions are also good, but the performance of C5.0 classifier is not so good for diabetic disease prediction where the dataset holds less feature similarity.
Model performance changed for the CTG dataset, which has less hidden value and a better similarity among the cases of data. To predict the fetal heart rate from CTG data, we get maximum accuracy in Random Forest. The evaluation result for all the criteria is shown in
Table 3,
Table 4,
Table 5,
Table 6,
Table 7 and
Table 8.
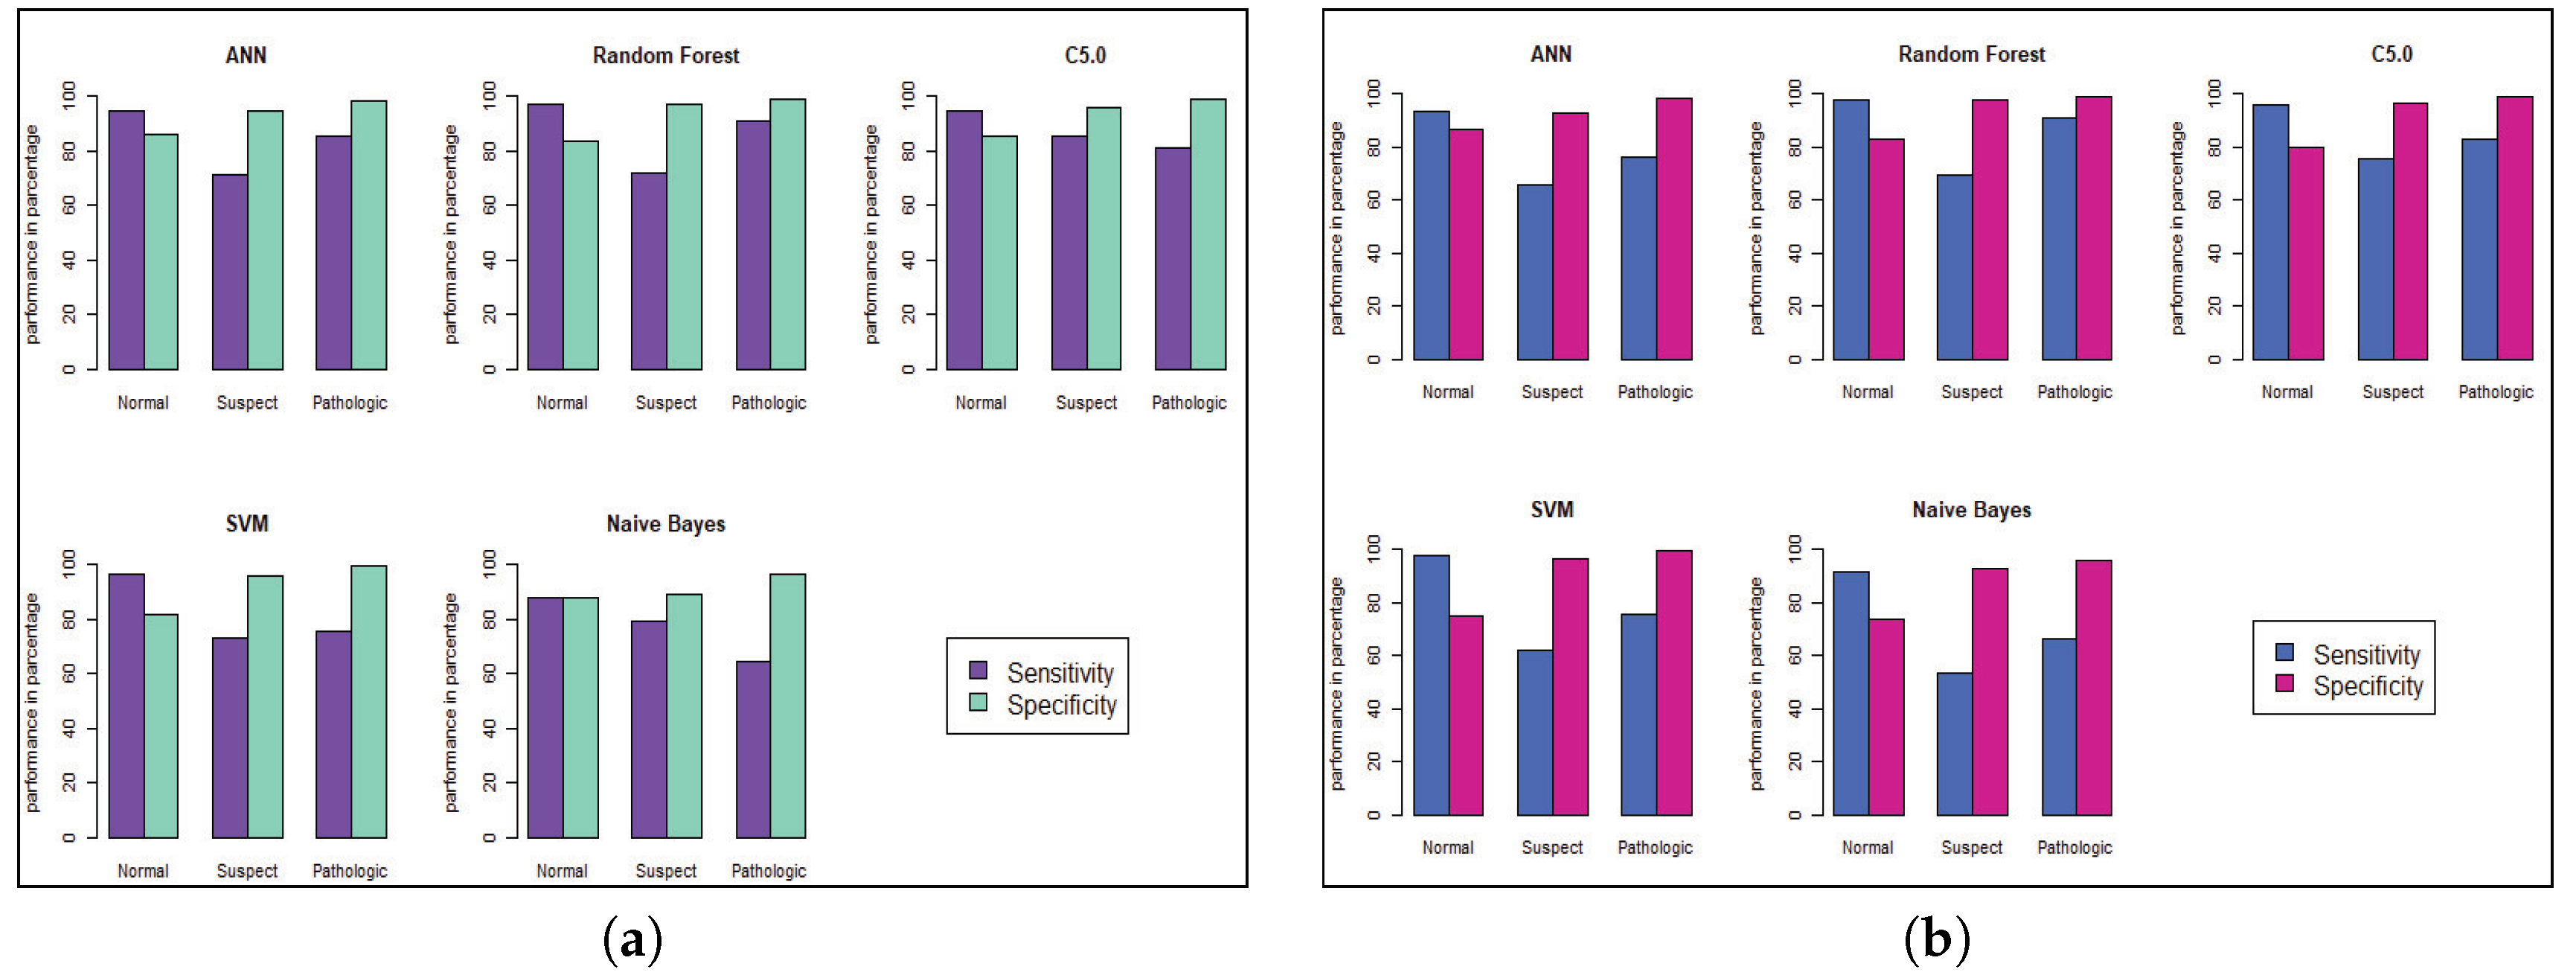
Figure 6 and
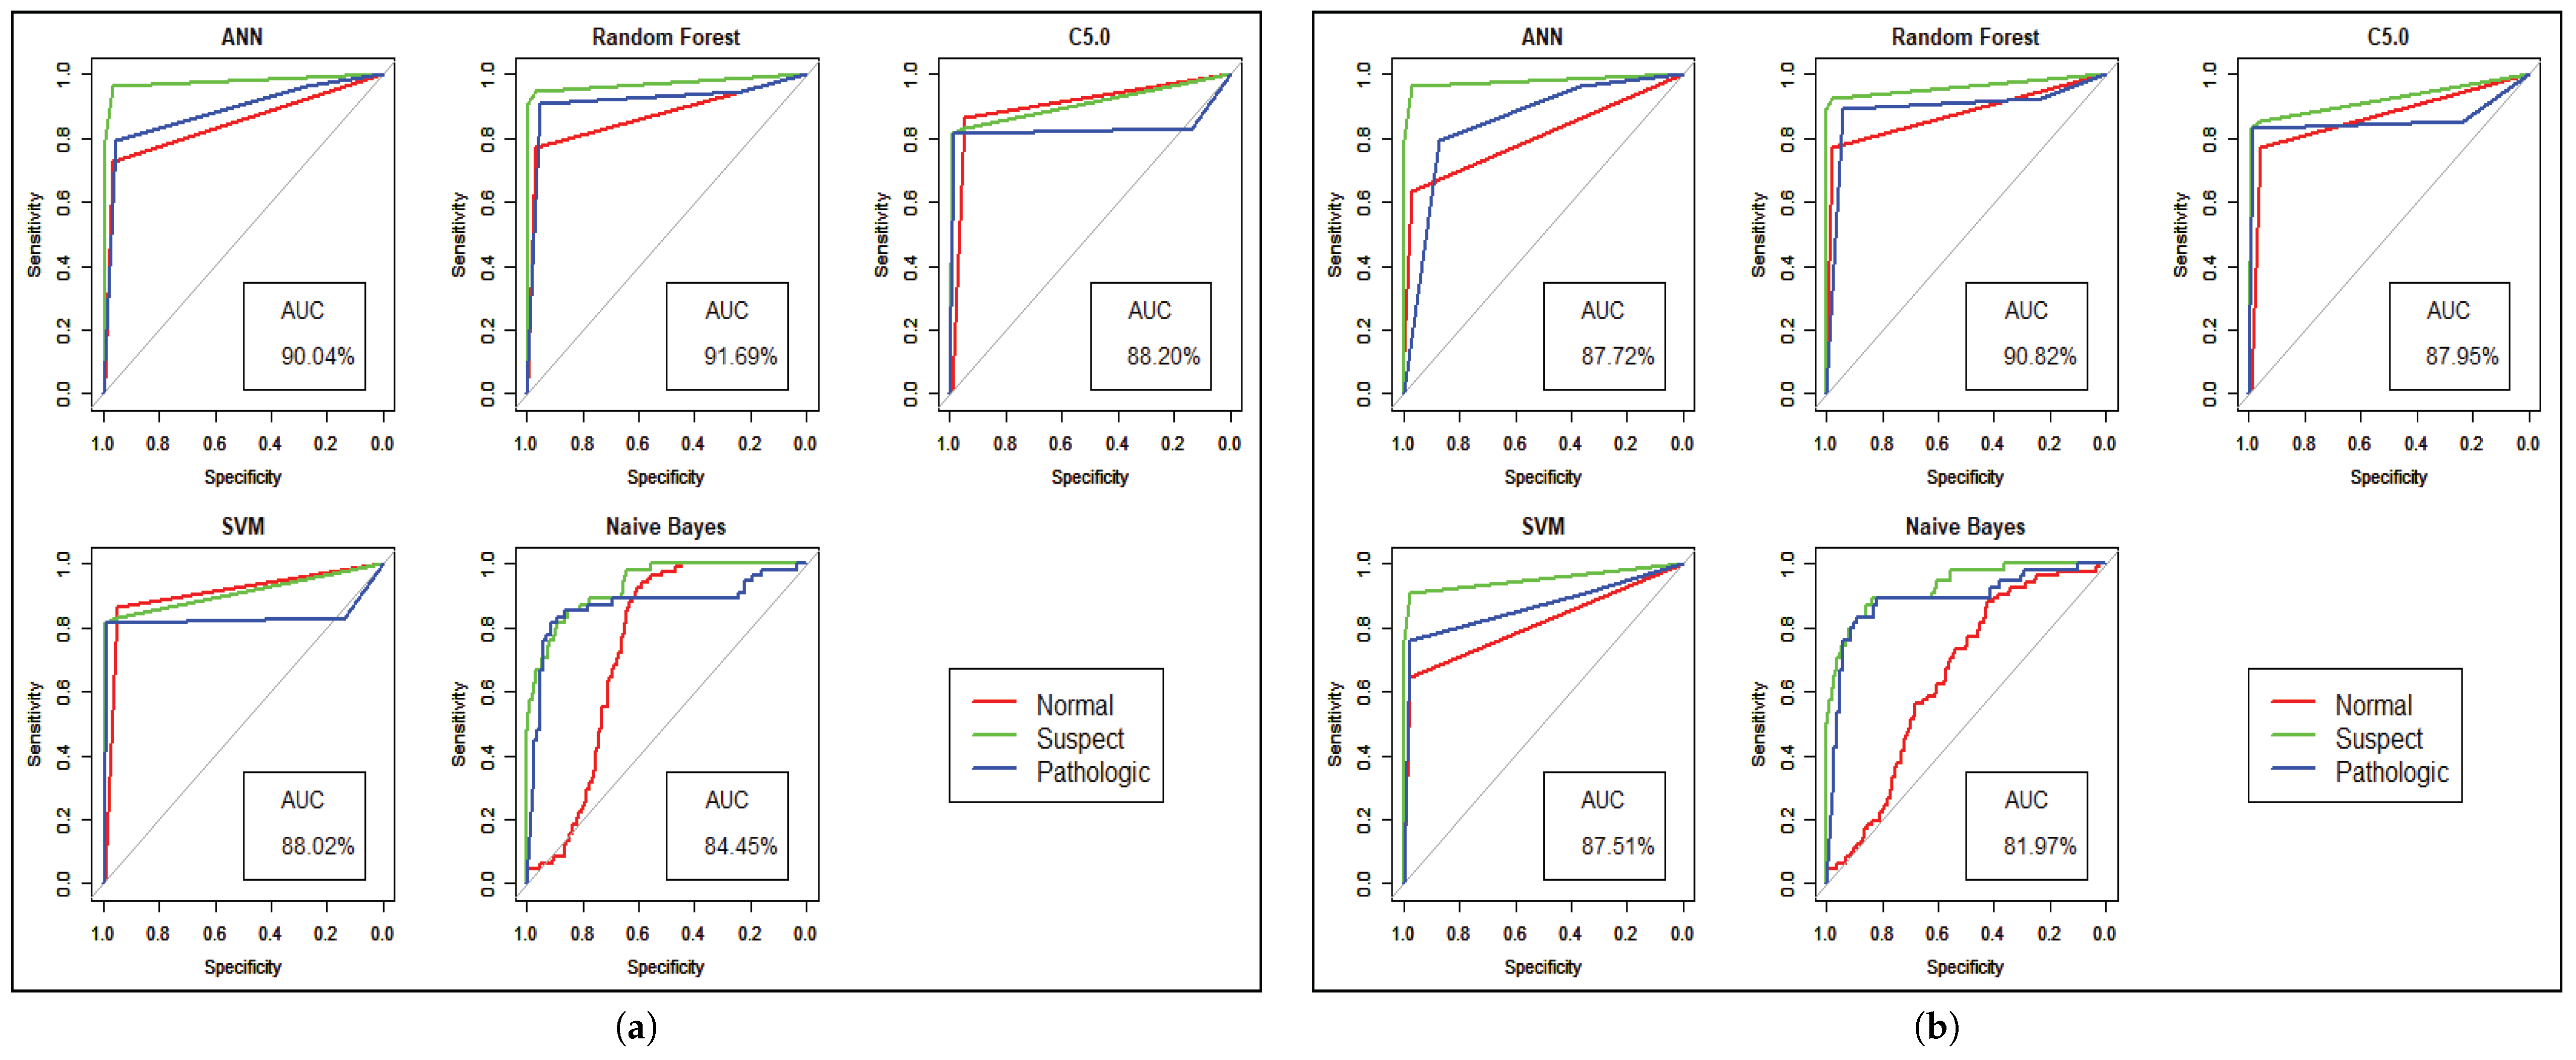
Figure 7 shows the statistical overview of all models with the calculation of accuracy, misclassification error, and sensitivity with specificity. The ROC curve is incorporated with the calculation of AUC in
Figure 8 to visualize the performance of the model with each class. The ROC curve shows that almost all the model provides better performance in fetal heart disease prediction. In our experiment, we get a better outcome when the similarity among the features of data is good.
6. Conclusions
This paper describes a new healthcare system, which deals with a large volume of patient data along with a full overview of patient medical conditions. In this research, we have designed a data acquisition scheme which will be helpful to analyze the massive amount of unstructured data. A data warehouse is introduced to store data and enables other functions to make two-way interactions between an HPC and cloud server. We have proposed a medical system with a prediction analysis of the existing dataset, and showed the performance of our study. Future work will involve analyzing the signal processing and image analysis, which can expose a new dimension in the healthcare industry and will introduce many more features to an interactive healthcare system. Thus, dealing with signal and image data is another part of future ventures.


