Article

Research on Lifespan Prediction of Composite Insulators in a High Altitude Area Experimental Station

1
State Key Laboratory of Power Transmission Equipment & System Security and New Technology, Chongqing University, Shapingba District, Chongqing 400044, China
2
Nanjing Institute of Technology, Nanjing 210000, China
*
Author to whom correspondence should be addressed.
Appl. Sci. 2019, 9(16), 3364; https://doi.org/10.3390/app9163364
Submission received: 3 August 2019 / Revised: 11 August 2019 / Accepted: 12 August 2019 / Published: 15 August 2019
(This article belongs to the Section Electrical, Electronics and Communications Engineering)

Abstract

:

Featured Application

The prediction method proposed in this paper can be used to determine aging time of composite insulators from Factory A, which can be widely adopted in future research.

Abstract

In this paper, composite insulators of the same batch from Factory A, aged for 1–12 years in a high altitude area experimental station of Hunan province, were sampled. In order to investigate the changing law of lifespan prediction parameters with aging time, widely accepted testing methods, such as the static contact angle (CA) and hardness, were employed for composite insulators in accordance with previous research. Based on test results, lifespan prediction parameters were concluded and some parameters significantly correlated with aging time were filtered by means of correlation calculation. On this basis, a prediction method which can be used to determine the aging time of composite insulators was proposed based on a back propagation (BP) neural network. Test results indicate that parameters, including the static contact angle (θav), the relative content of Si (XSi) and O (XO) elements, and salt-fog flashover voltage (Uf), have significant correlation with aging time, and that these parameters can be used to evaluate the aging degree of composite insulators. In addition, due to the high accuracy in experimental verification, the method proposed in this paper can be used to predict the aging time of composite insulators from Factory A in high altitude areas in future research.

1. Introduction

Composite insulators, with favorable electrical properties, have been widely used in AC and DC transmission systems [1,2,3,4]. By the mid-1980s, the number of composite insulators applied in the power grid in America had reached 2 million [5].
Although composite insulators were initially considered to be maintenance-free, the performance of silicone rubber material on the surface of composite insulators deteriorated during the aging process in poor operating environments. With the increase of aging time, composite insulators lost their hydrophobicity and allowed cracks to appear in the surficial material, resulting in an increase of the probability of pollution and icing flashover accidents [6,7,8,9].
A significant amount of research of aging composite insulators has been carried out by scholars, proposing a series of methods to evaluate the aging effects of composite insulators. In Reference [10], scholars measured the hydrophobicity of silicone rubber to evaluate the aging effects of composite insulators aged for different numbers of years. In Reference [11,12], researchers studied the surface roughness of silicone rubber to investigate the aging degree of composite insulators.
On this basis, some scholars proposed to use one or several parameters summarized from test results to characterize the aging effects of composite insulators qualitatively or quantitatively. In Reference [13,14], the static contact angle in the surface material was proposed to characterize aging effects of composite insulators. In Reference [15,16], a new method was proposed to characterize the aging degree of composite insulators by analyzing the test results of Fourier transform infrared spectroscopy (FTIR), along with hardness and images captured by scanning electron microscope (SEM). In addition, some scholars [17] established lifespan prediction methods based on 371 composite insulators from the lines in high temperature and humidity regions. In these studies, most composite insulators sampled were running in the same transmission line where operating environments have some differences over the large length of the line. Unfortunately, due to the great influence of operating environments on aging performance of composite insulators, there are some deviations among the results calculated by the prediction methods and actual results.
In this study, composite insulators of the same batch of Factory A exposed for 1–12 years in a high altitude area experimental station of Hunan province (as shown in Figure 1) were sampled. The changing law of lifespan prediction parameters was investigated by means of widely accepted methods, including the hydrophobicity classes test method (HC test), the static contact angle (CA) method, the hardness method, scanning electron microscopy (SEM), Fourier transform infrared spectroscopy (FTIR), X-ray photoelectron spectroscopy (XPS), and the salt-fog flashover test. Test results are presented in Section 2. In Section 3, by means of correlation calculation, parameters significantly correlated with aging time are obtained. On this basis, a prediction method based on a back propagation (BP) neural network is proposed for determining the aging time of composite insulators.

2. Corresponding Parameters of Composite Insulators under Different Aging Years for Lifespan Prediction

In this research, composite insulators (recorded as A1, A2, A3, A4, A5, A6) exposed for 1–12 years in a high altitude area experimental station of Hunan province were sampled. In order to investigate the changing law of lifespan prediction parameters under different years, several widely accepted methods, including the HC method, the CA method, the hardness test, SEM, FTIR, XPS and the salt-fog flashover test, are employed for composite insulators aged for different years in this section [18].

2.1. Physical Properties

2.1.1. Hydrophobicity

Hydrophobicity is an important indicator in evaluating the aging effects of composite insulators under different aging times. The most commonly accepted methods for measuring hydrophobicity of silicone rubber are the HC and CA tests. In this paper, both were employed on samples A1–A6. Three samples of the same aging time were applied in the HC and CA tests, and test methods were as follows.
In this research, the HC test criterion was in accordance with IEC/TS 62073—2003 [19], where HC test results are classified to 7 levels. If the HC test result is 1–4, insulators are regarded as being in good operating condition; if the HC result is above 5, insulators are regarded as being in poor operating condition.
In this research, a Drop Meter A-100P was used to evaluate the hydrophobicity of silicone rubber. The CA test criterion was in accordance to IEC/TS 62073—2003 [19], where CA test results are divided into two parts. In this standard, if the CA test result is more than 90°, insulators are regarded as hydrophobic, otherwise, insulators are regarded as hydrophilic. Three samples were selected under the same conditions for six repeated tests, and the average CA, denoted θav, was obtained for comparing the hydrophobicity between samples aged for different years.
The results of HC and CA tests are listed in Table 1.
Table 1 shows that when aging time increases, it leads to an increase of HC along with a decrease of θav. For example, the HC and θav of sample A1 aged for 1 year are level 1 and 130.2°, respectively. When aging time reaches 10 years, θav of sample A5 declines to 94.3°, and HC increased to 4. Moreover, according to DL/T 864-2004 [20], when θav of sample A5 is above 90° and HC is below 5, the conclusion that composite insulators of Factory A maintain good hydrophobicity for a period of up to ten years can be obtained.

2.1.2. Hardness

The hardness test is one of the most commonly adopted methods for evaluating the aging degree of composite insulators under different aging times. In this paper, a Shore A durometer was used to analyze the hardness of three samples with the same aging time. The test methods for hardness are as follow.
The hardness test criterion is in accordance to GB/T 531.1-2008 [21]. Six points, denoted a–f, from the rod to the edge of the shed of each composite insulator sample, were tested, and the hardness of each point was the average value of the hardness of the same three samples at this point. The average hardness of six points, denoted A, was obtained for comparing the hardness between samples aged for different years.
The hardness test results are listed in Table 2.
Table 2 shows the following:
(1) When aging time increases, it leads to an increase of A of composite insulators. For example, the average hardness of sample A1 aged for 1 year is 72.9. When aging time reaches 8 years, the average hardness of sample A4 increases to 74.8.
(2) In one single sample, the hardness tends to decrease from the edge of the shed to the rod of the composite insulator. For example, the hardness measurements of six points of sample A2 aged for 3.5 years from the rod to the edge of the shed are 72.6, 73.2, 73.5, 74.8, 75.3 and 75.6, respectively.

2.1.3. Scanning Electron Microscopy Test

Using scanning electron microscopy (SEM) to analyze the surface condition of silicone rubber has been widely adopted in evaluating the aging degree of composite insulators aged for different aging times [11]. In this paper, the surface topography of samples after each aging process was assessed with SEM. The test methods of SEM are as follow.
The surfaces of the samples were inspected using a FEI Quanta 200 SEM from Philips. To enhance the electrical conductivity of silicone rubber, samples were sprayed with gold for 60 s before testing.
The differences in the micro-structures of samples tested by SEM at a magnification of 5000× are shown in Figure 2.
In Figure 2a, there are few cracks and voids detected on the surface of sample A1 aged for 1 year. When aging time increases, the number of cracks and voids appearing on samples increases compared with A1, as shown in Figure 2b,c. However, in this case, the surface material of silicone rubber remained flat and the silicone rubber was still in good condition. When the aging time reaches 8 years, it can be found that some rough bumps along with cracks and voids appear (sample A4). With an increase of aging time, there are more rough bumps, exposed fillers and organic residues, as shown on the surface of sample A6 aged for 12 years, leading to more loose space in the surface material of sample A6. Based on images captured by SEM, it can be inferred that samples manufactured by Factory A still have a good anti-aging ability under an environment of strong UV radiation and high humidity for a period of up to 6 years. When the aging time exceeds 8 years, the anti-aging ability of samples gradually weakens and their aging rate gradually accelerates.
In Reference [22], it was found that the hydrophobicity of the surface material was related to the micro-structure of the surface material, and roughness and porosity were the main factors affecting the micro-structure of silicone rubber. This paper adopts the Wenzel model to explain the contact between a water drop and the surface material of silicone rubber. In the Wenzel model, the relationship between the static contact angle θ and Young’s contact angle θ1 (contact angle of new composite insulators) is as follows:
cos θ = r cos θ 1
where, r is the rate of roughness in the Wenzel model, which can be obtained by the ratio of the real contact area of a water drop on the surface of silicone rubber to the contact area of a water drop on the surface of silicone rubber.
In Figure 2a–c, the roughness of the surface material of silicone rubber gradually increases with time, which leads to a slow increase of r. As shown in Figure 3a–c, with an increase of r, the contact area of a water drop on the surface material expands, but with no sign of collapsing. This means the hydrophobicity of silicone rubber is good at this stage. When aging time exceeds 8 years, the rate of surface roughness increases faster, which leads to a faster increase of r. As is shown in Figure 3d–f, the water drop on silicone rubber collapses gradually, leading to a decrease of hydrophobicity in the surface material of silicone rubber.
In this paper, a method where aging levels (denoted Sem) of composite insulators are classified by the roughness of silicone rubber was proposed, and aging levels Sem of composite insulators sampled in this paper based on standards are listed in Table 3.

2.2. Chemical Properties

2.2.1. Fourier Transform Infrared Spectroscopy Test

Fourier transform infrared spectroscopy (FTIR) has been widely adopted in material analysis to obtain an infrared spectrum of absorption of samples. In this paper, the existence or absence of certain functional groups, as well as their abundance, was indicated by FTIR. Key absorption peaks corresponding to functional groups in silicone rubber material are listed in Table 4.
The results of wave numbers of the functional groups of the composite insulators sampled are plotted in Figure 4.
Figure 4 shows the following:
(1) The main functional groups of samples in FTIR are mainly consistent, and no new key functional groups appear in the surficial in aging process.
(2) With the increase of aging time, the Si–O–Si absorption peak altitude at wave number 1100–1000 cm−1 gradually decreases, which indicates that the content of the main Si–O–Si bond decreases. In the aging process, UV radiation could interrupt the main Si–O–Si bond in the surface material of silicone rubber, which would result in an organosilicon molecule in silicone rubber transferring to pollution layers, along with the decrease of the Si–O–Si absorption peak altitude.
(3) The Si–(CH3)2 absorption peak altitude at wave number 840–790 cm−1 decreases gradually with the increase of aging time, resulting in the silicone rubber tending to be polar and gradually hydrophobic in the aging process.
(4) For aging composite insulators, the –OH absorption peak altitude at wavenumber 3700–2800 cm−1 of surface materials rises gradually with the increase of aging time, and there are two main reactions occurring in –OH during this process. One is that water, the catalyst in the hydrolysis reaction, promotes mutual combination of diversified free radicals under high temperature conditions in the aging process, which results in the rise of the –OH absorption peak altitude. The other is that a large amount of free O–H groups in the surface material of silicone rubber volatilizes after contact with air, leading to a decrease of the –OH absorption peak altitude. In Figure 4, the –OH absorption peak altitude increases with the increase of aging time, showing that the first factor has greater influence than the second factor, leading to an increase of the content of the –OH bond.
Previous research [23] indicates that the decrease of Si–O–Si and C–H absorption peak altitudes, which results in the materials being polar, has greater influence than the rise of –OH absorption peak altitude, which adds some hydrophilic groups resulting from the hydrolysis reaction. In this paper, the ratio (denoted H) of the Si–(CH3)2 absorption peak altitude to the Si–O–Si absorption peak altitude is used to characterize the aging degree of composite insulators.
The results for H of the composite insulators are listed in Table 5.

2.2.2. Element Content Analysis

In order to further study the changes of chemical aging effects of silicone rubber with aging time, element content analysis was performed, with the help of X-ray photoelectron spectroscopy (XPS) conducted by an ESCALAB 250Xi from Thermo Fisher Scientific Company. Test results are listed in Table 6.
Table 6 shows the following:
(1) With the increase of aging time, the relative content of Si and C elements gradually decreases, which leads to a decrease of Si–O–Si absorption peak altitude and Si–(CH3)2 absorption peak altitude.
(2) Combined with the analysis in Section 2.2.1, the hydrolysis reaction in the surface material of silicone rubber will lead to an increase of the relative content of the O element as aging time increases.
(3) With the increase of aging time, there are few changes in the relative contents among the Al, Fe and Pt elements in the samples. Some fluctuations result from the differences among the fillers of composite insulators with different voltage levels.
(4) Based on the test results of XPS, the relative contents of Si, C and O elements (denoted XSi, XC and XO, respectively) are taken as parameters to characterize the aging degree of composite insulators.

2.3. Electrical Properties

Salt-Fog Flashover Test

In this research, a salt-fog flashover test was performed in a testing hall of Chongqing University. The test power supply was provided by a YDJ 5 kVA/50 kV AC transformer, which could meet the power requirements of the salt-fog flashover test. Three samples of the same aging time were cut from silicone rubber, with a size of 6 cm × 4 cm, as shown in Figure 5. The sample was placed between high-voltage and ground electrodes, as also shown in Figure 5, and flashover was produced between the two electrodes. The wiring diagram of the test principle is shown in Figure 6.
In Figure 6, T and B are AC test transformers, R0 is a current limiting resistor, L represents the artificial air fog chamber, P is the salt-fog generator, and DAS (Data Acquisition System) is a voltage measuring system where flashover voltage can be displayed directly.
To prepare the test, the samples were washed with anhydrous ethanol, rinsed with water and dried in the shade for 24 h.
The salt-fog flashover test is in accordance with IEC 60060-1989 [24]. According to this standard, the concentration of salt-fog in this study was 1000 μS/cm. In order to ensure the accuracy and rationality of the test, three samples were selected under the same conditions for six repeated tests. The average flashover voltage was obtained for comparing the electrical properties between samples aged for different years, and the standard error between average flashover voltage and each flashover voltage should be less than 10%. The equations for calculating the average flashover voltage Uf and deviation error σ% are expressed in Equations (2) and (3):
U f = i = 1 N U i N
σ % = i = 1 N ( U i U f ) 2 N 1 · 100 % U f
σ% is the standard error of the flashover voltage.
Test results of the salt-fog flashover test are listed in Table 7.
Table 7 shows the following:
(1) With the increase of aging time, the salt-fog flashover voltage of samples gradually decreases. For example, Uf of sample A1 aged for 1 year is 13.87 kV. When the aging time reaches 10 years, Uf of sample A5 declines to 9.99 kV.
(2) The increasing rate of salt-fog flashover voltage accelerates gradually with an increase of aging time from 1 to 12 years. The decreasing rate of salt-fog flashover voltage is slower in the aging process from 1 to 6 years. After rough bumps appear in the surface material of silicone rubber, the salt-fog flashover voltage decreases faster than before.

3. Lifespan Prediction Method

This section covers the details for the process of proposing a prediction method for determining the aging time of composite insulators, including analysis of relative parameters for lifespan prediction and a prediction method for the aging time of composite insulators.

3.1. Analysis of Relative Parameters for Lifespan Prediction

In Section 2, corresponding parameters of composite insulators under different aging years for predicting lifespan were studied, as listed in Table 8.
In this paper, Pearson correlation analysis, a statistical method, was employed and the correlation coefficient r was utilized to preliminarily analyze the correlation between each lifespan prediction parameter and the operating year [25]:
r = i = 1 n ( x i x ¯ ) ( t i t ¯ ) i = 1 n ( x i x ¯ ) 2 i = 1 n ( t i t ¯ ) 2
where, xi is the lifespan prediction parameters of the ith sample; ti is the aging year of the ith sample; x ¯ is the mean value of lifespan prediction parameters of samples aged for different years; t ¯ is the mean value of aging time of samples aged for different years.
The t-test was used to detect the significance of correlation coefficients between lifespan prediction parameters and aging time. The calculation is expressed in Equation (5).
T = r n 2 1 r 2   ~   t ( n 2 )
In Equation (5), if the significance value α is less than 0.05, it indicates that there is a certain correlation between two variables; if α is less than 0.01, it indicates that there is a significant correlation between two variables. Test results are listed in Table 9.
Table 9 shows the following:
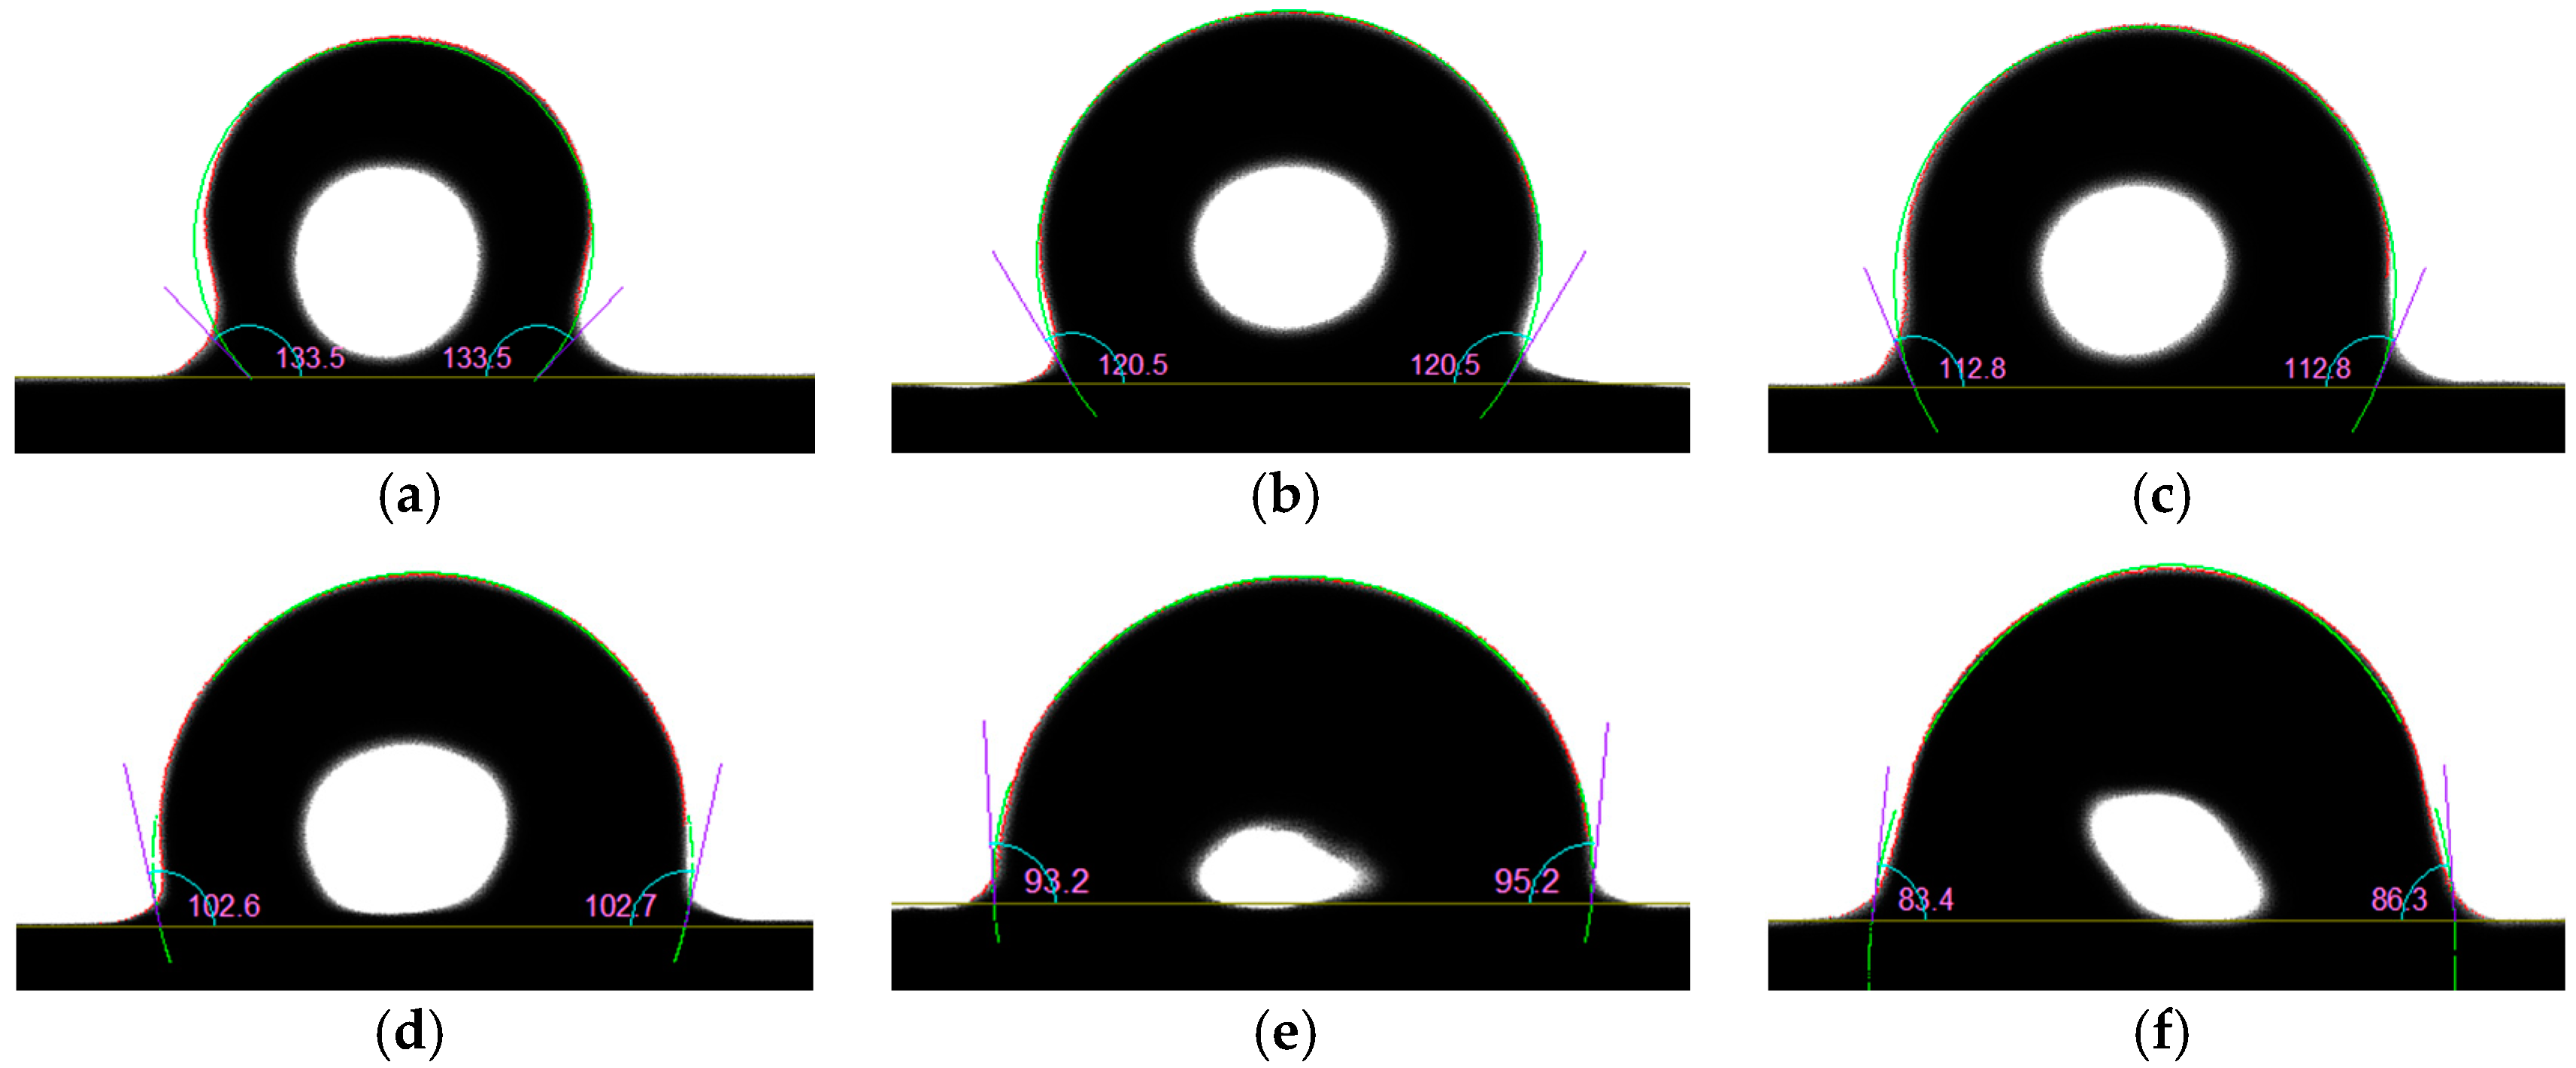
(1) According to the results of correlation analysis (Table 9), with the increase of aging time, the static contact angle θav, the relative content of Si element XSi and salt-fog flashover voltage Uf decrease significantly, and the relative content of O element XO increases significantly. These four parameters are significantly correlated with aging time (α < 0.01). These parameters can be used in evaluating the aging degree of aged composite insulators and proposing a prediction method to determine the aging time of composite insulators.
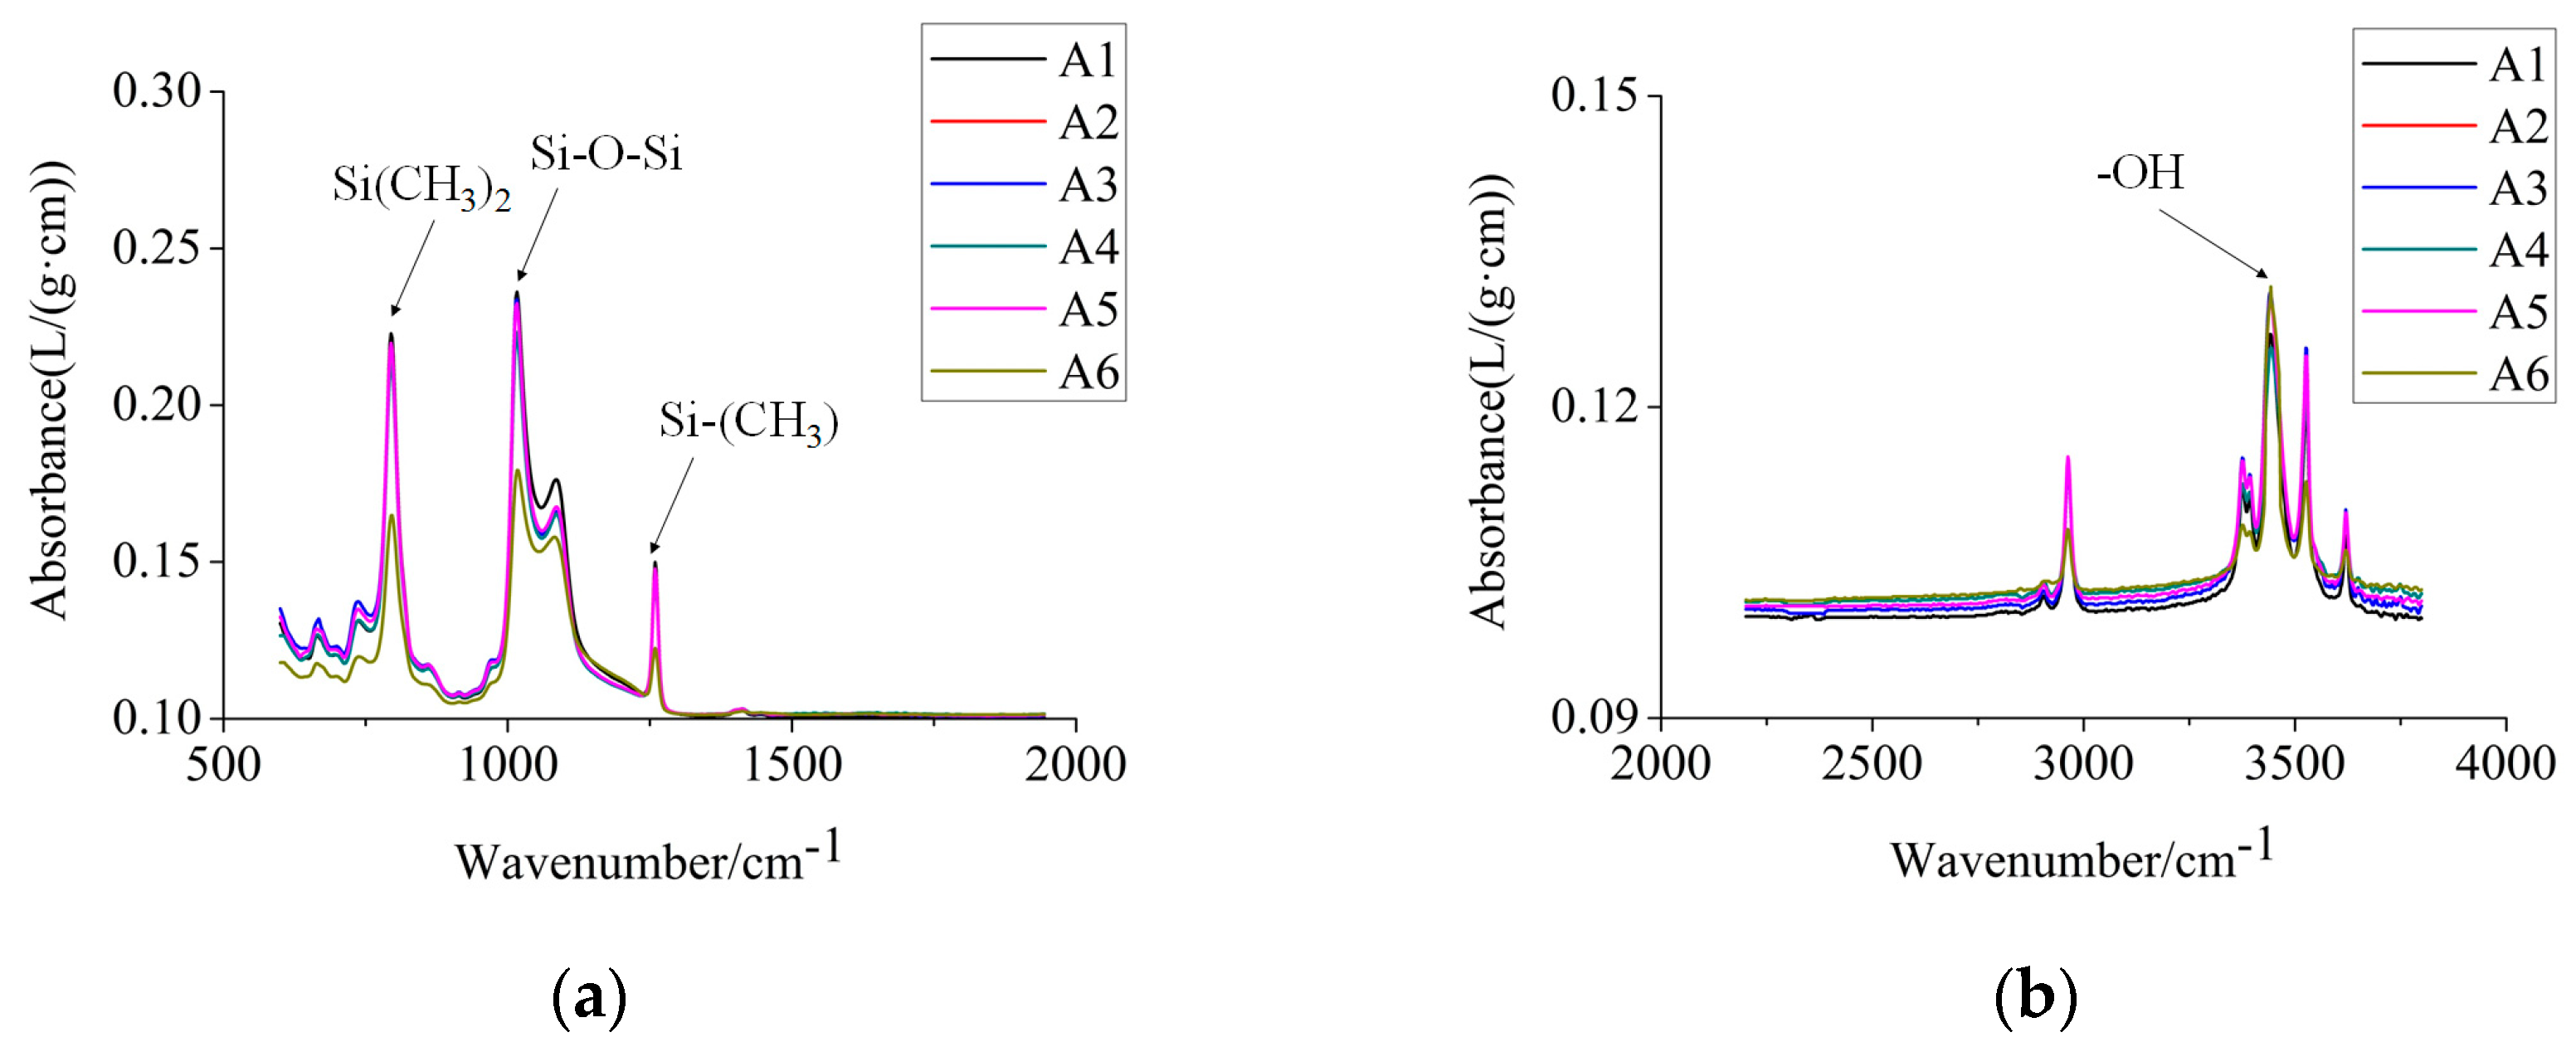
(2) With the increase of aging time, the hardness A and the aging level Sem increase, and the ratio of Si–(CH3)2 absorption peak altitude to Si–O–Si absorption peak altitude (H) and the relative content of C element XC decrease. These four parameters were correlated with aging time (α < 0.05). On this basis, these parameters can be used as auxiliary indexes in evaluating the aging effects of composite insulators.

3.2. Prediction Method for Aging Time of Composite Insulators

A BP neural network is a kind of multi-layer feed-forward neural network. Because of its simple structure, many adjustable parameters, training algorithms and good maneuverability, BP neural networks have been extensively applied [
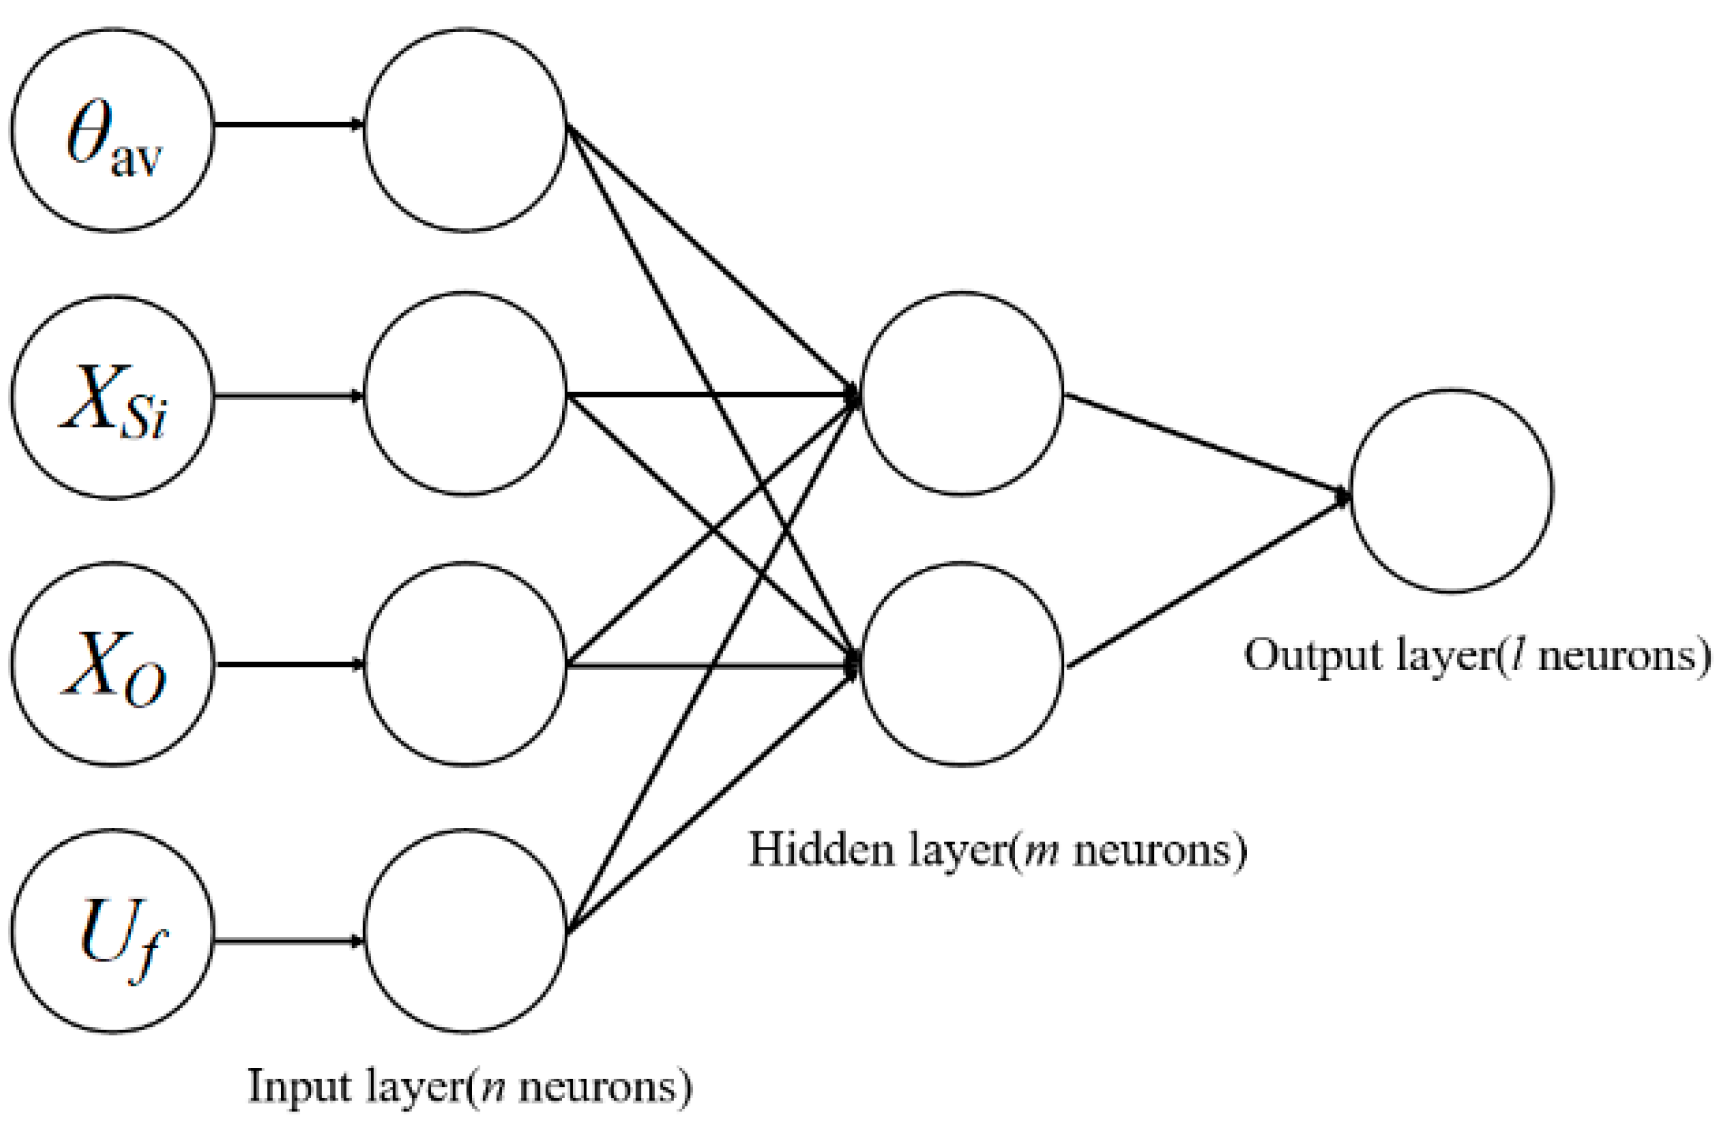
26]. In this case, a BP neural network was employed to propose a prediction method for determining the aging time of composite insulators by means of the four parameters which are significantly correlated with aging time. The structure of the BP neural network used in this paper is shown in Figure 7.
In Figure 7, there are n neurons in the input layer of the BP neural network, m neurons in the hidden layer and l neurons in the output layer. Based on Reference [27], the optimal number of neurons in the hidden layer are given by Equations (6)–(8).
m < n 1
m < n + l + a
m = log 2 n
where n is the number of neurons in the input layer; l is the number of neurons in the output layer; m is the number of neurons in the hidden layer; a is a constant between 0 and 10.
This paper employs four parameters, namely, the static contact angle θav, the relative content of Si element XSi, the relative content of O element XO and the salt-fog flashover voltage Uf, which are significantly correlated with aging time, as the input neurons, and the aging time as the output neuron. Thus, the number of neurons in the hidden layer is 2. Moreover, the goal of the error is set as 10−8.
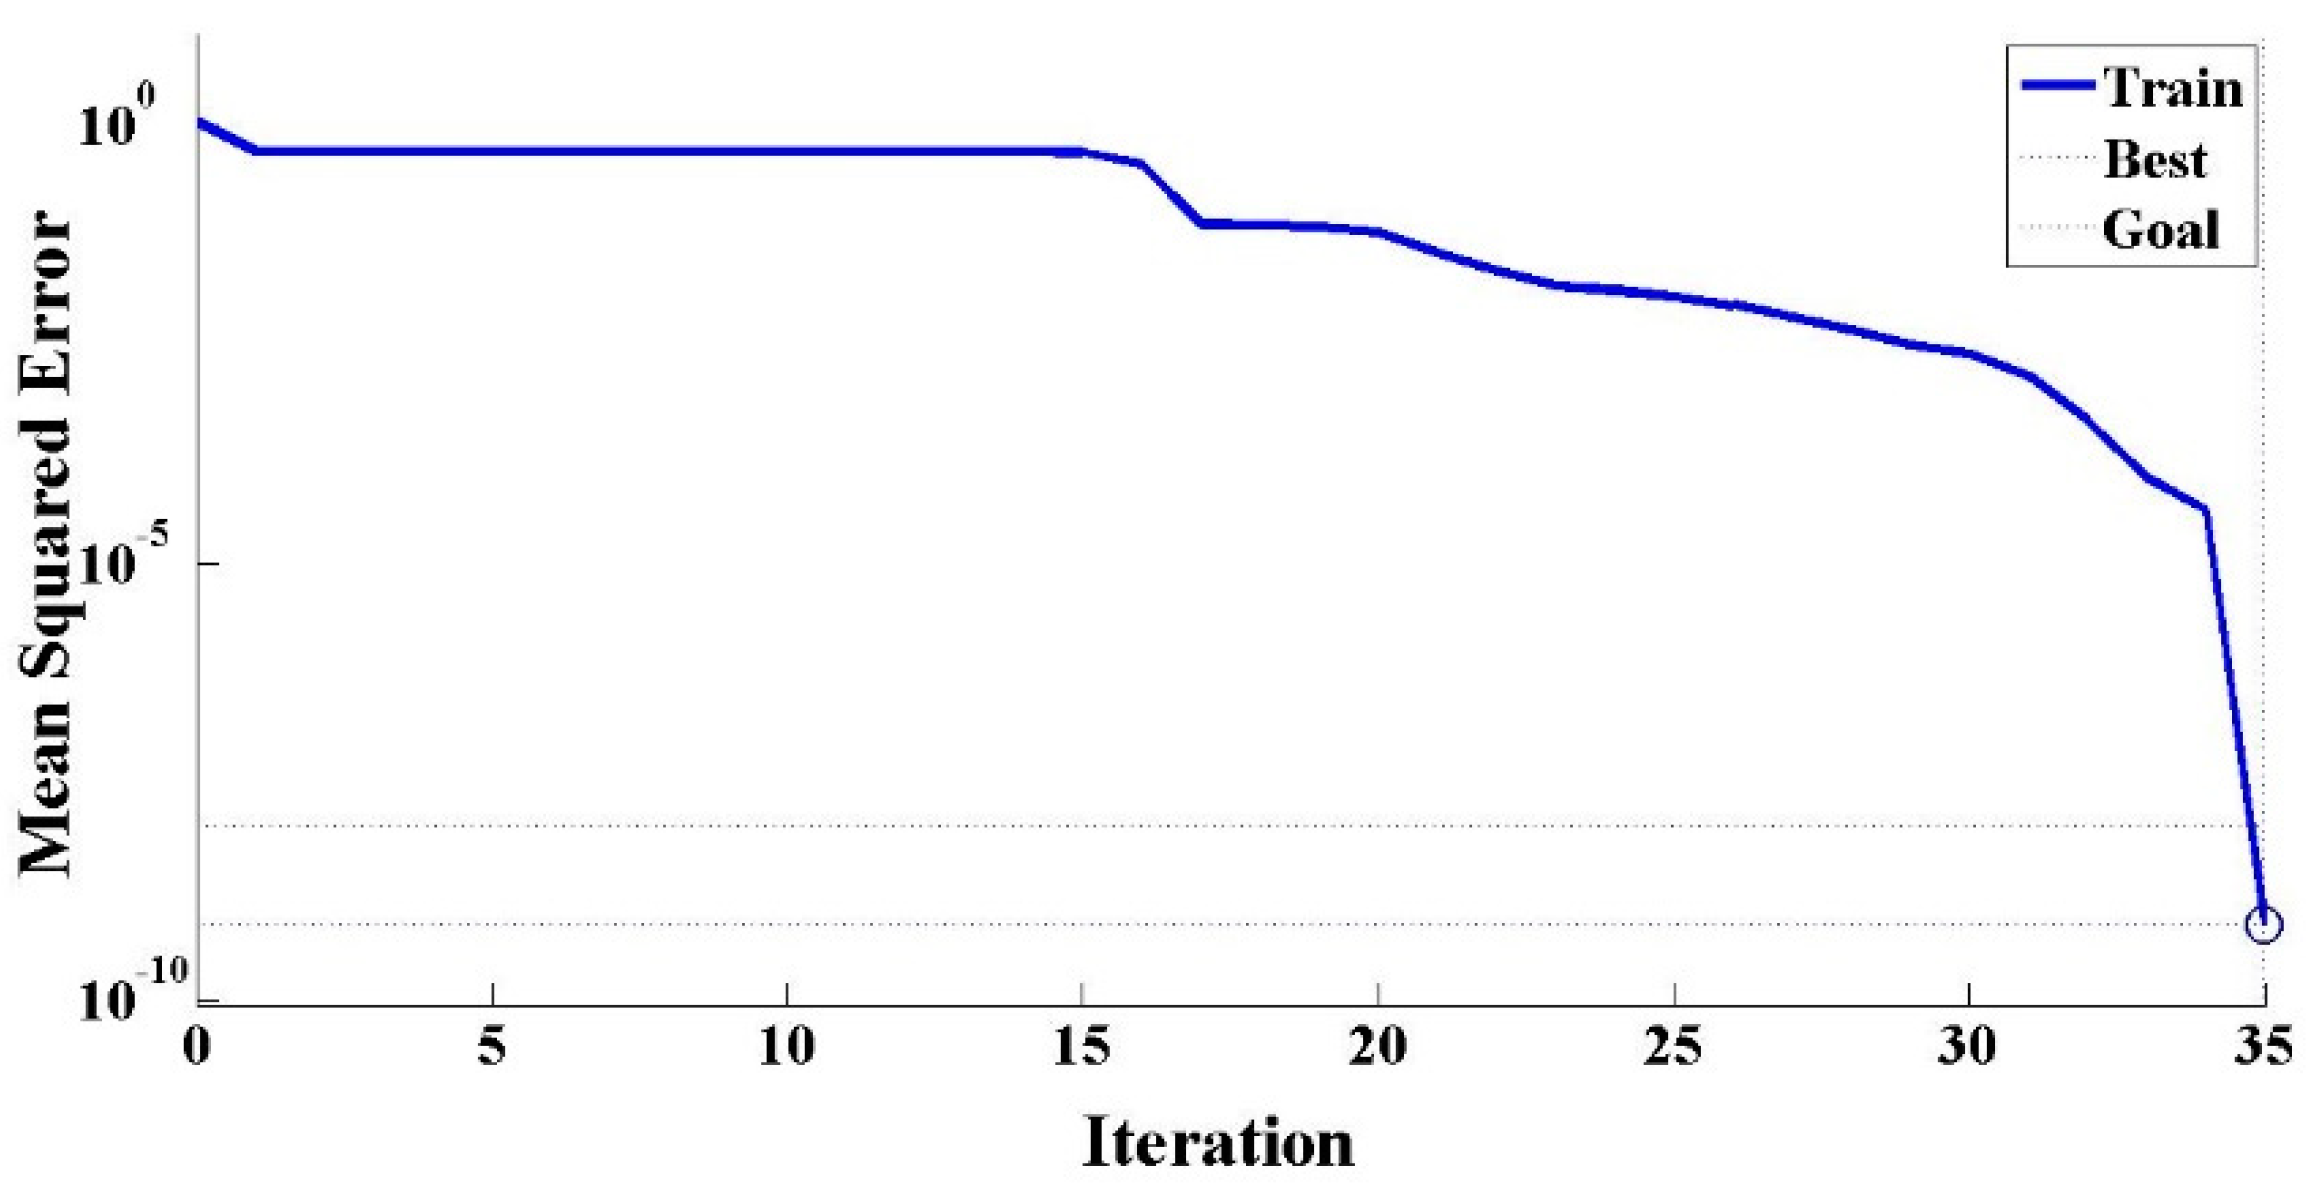
In BP neural network testing, parameters of composite insulators aged for 1–10 years were employed as training samples, and parameters of composite insulators aged for 12 years were employed as test samples. The error changes during training are shown in Figure 8.
In the process of BP neural network training for aging time prediction, the mean squared error of the predicted aging time of composite insulators scarcely changed at first. During the process from 30 to 35 iterations, the mean squared error of predicted aging time decreased rapidly and achieved convergence in 35 iterations. In this case, the mean squared error of predicted aging time is 10−8, which indicates that the equivalent relationship between significantly correlated parameters and aging time can be established accurately based on the BP neural network, and that the aging time of composite insulators can be predicted accurately based on the method proposed in this paper.
In this paper, σ1 is defined as the relative error between the predicted aging time (denoted a1) and actual aging time (denoted a). Results for a1, a and σ1 of samples aged for 12 years are shown in Table 10.
σ 1 = | a 1 a | a × 100 %
Table 10 shows that the relative error σ1 between the predicted and actual values is less than 5%, which is within the range of high accuracy in engineering practice. In this case, the method based on a BP neural network can be used in predicting the aging time of composite insulators from Factory A in future research.

4. Conclusions

In this paper, the changing law of lifespan parameters corresponding with the aging time of composite insulators was investigated by widely accepted methods. Based on test results, lifespan prediction parameters significantly correlated with aging time were obtained. On this basis, a prediction method based on a BP neural network was proposed for determining the aging time of composite insulators. The main conclusions are as follows:
(1) With the increase of aging time, the number of cracks and voids appearing in the surface material of samples increases gradually, the hardness of samples rises, and organosilicon molecules in silicone rubber begin to transfer to pollution layers. At this stage, composite insulators can still maintain a good condition. After rough bumps appear in the surface material of samples, these parameters that correspond with the aging time of composite insulators decline significantly.
(2) By means of calculation of the correlation between lifespan prediction parameters and aging time, it was found that the static contact angle θav, the relative content of Si and O elements (XSi and XO, respectively), and salt-fog flashover voltage Uf have significant correlation with aging time, and that these parameters can be used to evaluate the aging degree and in a prediction method for determining the aging time of composite insulators. In addition, hardness A, the ratio of Si–(CH3)2 absorption peak altitude to Si–O–Si absorption peak altitude H, the aging level Sem, and the relative content XC all have certain correlation with aging time. These parameters can be used as auxiliary parameters to evaluate the aging degree of composite insulators under different aging times.
(3) In this paper, a prediction method for determining the aging time of composite insulators based on a BP neural network was proposed. Due to the high accuracy in experimental verification, this method can be used to predict the aging time of composite insulators from Factory A in a high altitude area in future research.

Author Contributions

The authors gratefully acknowledge the contributions as following: Y.Z., Z.Z., X.J., T.L. and D.Z. conceived and designed the experiments; Y.Z. performed the experiments, analyzed the data and wrote the paper.

Funding

This work was supported by the National Natural Science Foundation of China (No. 51677013), National Natural Science Foundation of Jiangsu Province (BK20181021), and High-level Talent Introduction Scientific Research Foundation of Nanjing Institute of Technology (YKJ201819). The authors thank all members of external insulation research team in Chongqing University for their hard work to obtain the experimental data in this paper.

Conflicts of Interest

The authors declare no conflict of interest.

References

  1. Karady, G.G.; Shah, M.; Brown, R.L. Flashover mechanism of silicone rubber insulators used for outdoor insulation-1. IEEE Trans. Power Deliv. 1995, 10, 1965–1971. [Google Scholar] [CrossRef]
  2. de La, O.A.; Gorur, R.S.; Burnham, J.T. Electrical performance of non-ceramic insulators in artificial contamination tests. Role of resting time. IEEE Trans. Dielectr. Electr. Insul. 1996, 3, 827–835. [Google Scholar] [CrossRef]
  3. Liang, X.; Wang, S.; Ju, F.; Zhicheng, G. Development of composite insulators in China. IEEE Trans. Dielectr. Electr. Insul. 1999, 6, 586–594. [Google Scholar] [CrossRef]
  4. Jiang, X.; Yuan, J.; Zhang, Z.; Hu, J.; Shu, L. Study on Pollution Flashover Performance of Short Samples of Composite Insulators Intended for /spl plusmn/800 kV UHV DC. IEEE Trans. Dielectr. Electr. Insul. 2014, 14, 1192–1200. [Google Scholar] [CrossRef]
  5. Cherney, E.A.; Reichman, J.; Stonkus, D.J.; Gill, B.E. Evaluation and Application of Dead-End Type Polymeric Insulators to Distribution. IEEE Trans. Power Appar. Syst. 1984, 4, 121–132. [Google Scholar] [CrossRef]
  6. Jiang, X.; Xiang, Z.; Zhang, Z.; Hu, J.; Qin, H.; Shu, L. Predictive Model for Equivalent Ice Thickness Load on Overhead Transmission Lines Based on Measured Insulator String Deviations. IEEE Trans. Power Deliv. 2014, 29, 1659–1665. [Google Scholar] [CrossRef]
  7. Qin, H.; Wang, S.; Shu, L.; Jiang, X.; Jian, L.; Gang, Q. Comparison of AC icing flashover performances of 220 kV composite insulators with different shed configurations. IEEE Trans. Dielectr. Electr. Insul. 2016, 23, 995–1004. [Google Scholar]
  8. Qin, H.; Wei, Y.; Shu, L.; Jiang, X.; Wang, S. Comparison of DC Pollution Flashover Performances of Various Types of Porcelain, Glass, and Composite Insulators. IEEE Trans. Dielectr. Electr. Insul. 2008, 23, 1183–1190. [Google Scholar]
  9. Jiang, X.; Yuan, J.; Shu, L.; Zhang, Z.; Hu, J.; Feng, M. Effects of Electric Field Distribution on Icing and Flashover Performance of 220 kV Composite Insulators. IEEE Trans. Dielectr. Electr. Insul. 2014, 21, 2181–2189. [Google Scholar]
  10. Gubanski, S.M.; Vlastos, A.E. Wettability of naturally aged silicon and EPDM composite insulators. IEEE Trans. Power Deliv. 1990, 5, 1527–1535. [Google Scholar] [CrossRef]
  11. Haddad, G.; Wong, K.L.; Petersen, P. Evaluation of the aging process of composite insulator based on surface charaterisation techniques and electrical method. IEEE Trans. Dielectr. Electr. Insul. 2016, 23, 311–318. [Google Scholar] [CrossRef]
  12. Lutz, B.; Cheng, L.; Guan, Z.; Wang, L.; Zhang, F. Analysis of a Fractured 500 kV Composite Insulator-Identification of Aging Mechanisms and their Causes. IEEE Trans. Dielectr. Electr. Insul. 2012, 19, 1723–1731. [Google Scholar] [CrossRef]
  13. Rowland, S.M.; Xiong, Y.; Robertson, J.; Hoffmann, S. Aging of silicone rubber composite insulators on 400 kV transmission lines. IEEE Trans. Dielectr. Electr. Insul. 2007, 14, 130–136. [Google Scholar] [CrossRef]
  14. Xie, C.; Yao, Z.; Wang, J.; Hao, Y.; Gao, M.; Yang, L. Research on evaluation method of composite insulators aging. In Proceedings of the 2009 IEEE 9th International Conference on the Properties and Applications of Dielectric Materials, Harbin, China, 19–23 July 2009; pp. 321–324. [Google Scholar]
  15. Chughtai, A.R.; Smith, D.M.; Kumosa, M. FTIR analysis of non-ceramic composite insulators. IEEE Trans. Dielectr. Electr. Insul. 2004, 11, 585–596. [Google Scholar] [CrossRef]
  16. Chakraborty, R.; Reddy, B.S. Studies on high temperature vulcanized silicone rubber insulators under arid climatic aging. IEEE Trans. Dielectr. Electr. Insul. 2017, 24, 1751–1760. [Google Scholar] [CrossRef]
  17. Cheng, L.; Wang, L.; Guan, Z. Aging characterization and lifespan prediction of silicone rubber material utilized for composite insulators in areas of atypical warmth and humidity. IEEE Trans. Dielectr. Electr. Insul. 2016, 23, 3547–3555. [Google Scholar] [CrossRef]
  18. 18. Working Group B2.21. Guide for the Assessment of Composite Insulator in the Laboratory after Their Removal from Service, CIGRE Brochure 481; CIGRE: Paris, France, 2011. [Google Scholar]
  19. IEC (International Electrotechnical Commission). Guidance on the Measurement of Wettability of Insulator Surfaces, IEC/TS 62073; IEC: Geneva, Switzerland, 2003. [Google Scholar]
  20. SAC (Standardization Administration of the People’s Republic of China). GB/T 531.1-2008 Rubber Vulcanized or Thermoplastic-Determination of Indentation Hardness-Part 1: Duromerer Method (Shore Hardness); SAC: Beijing, China, 2008. [Google Scholar]
  21. SAC (Standardization Administration of the People’s Republic of China). DL/T 864-2004 Application Guide of Composite Insulators for AC Overhand Lines with a Nominal Voltage over 1000V; SAC: Beijing, China, 2004. [Google Scholar]
  22. Chen, C.; Jia, Z.; Ye, W.A.; Guan, Z.; Li, Y. Condition assessment strategies of composite insulator based on statistic methods. IEEE Trans. Dielectr. Electr. Insul. 2017, 23, 3231–3241. [Google Scholar] [CrossRef]
  23. Cheng, L.; Mei, H.; Wang, L. Study on long-term aging characteristics and impact factors for silicone rubber sheath of composite insulators. Power Syst. Technol. 2016, 40, 1896–1902. [Google Scholar]
  24. IEC (International Electrotechnical Commission). High-Voltage Test Techniques-Part 1: General Definitions and Test Requirements, IEC 60060-1, 2nd ed.; IEC: Geneva, Switzerland, 1989. [Google Scholar]
  25. Iversen, G.R.; Gergen, M. Statistics; Springer Undergraduate Textbooks in Statistics; Springer Nature: Basel, Switzerland, 1997; Volume 21, pp. 17–37. [Google Scholar]
  26. Pan, X.; Zhou, W.; Lu, Y.; Sun, N. Prediction of network traffic of smart cites based on DE-BP neural network. IEEE Access 2019, 7, 55807–55816. [Google Scholar] [CrossRef]
  27. Liu, M.; Zhang, M.; Zhao, W.; Song, C.; Wang, D.; Li, Q.; Wang, Z. Prediction of congestion degree for optical networks based on BP artificial neural network. In Proceedings of the 2017 16th International Conference on Optical Communications and Networks (ICOCN), Wuzhen, China, 7–10 August 2017. [Google Scholar]
Figure 1. Aging environments of composite insulators in a high altitude area experimental station.
Applsci 09 03364 g001
Figure 2. Morphology of samples using scanning electron microscopy (SEM), 5000×: (a) A1; (b) A2; (c) A3; (d) A4; (e) A5; (f) A6.
Applsci 09 03364 g002
Figure 3. Static contact angle of samples under different years: (a) A1; (b) A2; (c) A3; (d) A4; (e) A5; (f) A6.
Applsci 09 03364 g003
Figure 4. FTIR analysis results of samples under different years: (a) wave number between 500 and 2000 cm−1; (b) wave number between 2000 and 4000 cm−1.
Applsci 09 03364 g004
Figure 5. Schematic diagram of samples and the electrodes in the electrical test.
Applsci 09 03364 g005
Figure 6. Test circuit.
Applsci 09 03364 g006
Figure 7. Structure of back propagation (BP) neural network.
Applsci 09 03364 g007
Figure 8. Reduction of deviation by training.
Applsci 09 03364 g008
Table 1. Hydrophobicity test results on samples.
SamplesAging Time/YearTest Results
θavHC
A11130.21
A23.5122.51
A36111.82
A48100.63
A51094.34
A61284.14
Table 2. Hardness test results of samples from Factory A.
SamplesHardness (Shore A)
abcdefA
A170.372.573.173.47474.172.9
A272.673.273.574.875.375.674.2
A37474.274.374.574.875.274.5
A473.974.374.87575.175.874.8
A574.274.97575.375.576.175.2
A673.374.374.875.475.976.675.0
Table 3. Aging level of composite insulators of Factory A.
SamplesAging Time/YearStandards of DivisionSem
A11Some cracks and voids1
A23.5Some cracks and voids1
A36Some cracks and voids1
A48Penetrating cracks and voids2
A510Penetrating cracks and voids, some rough bumps3
A612Penetrating cracks and voids, some rough bumps3
Table 4. Key absorption peaks of silicone rubber in Fourier transform infrared spectroscopy (FTIR) analysis.
Functional GroupsWave number/cm−1
O-H3700–3200
CH3(C-H)2960
C-H1440–1410
Si-CH3(C-H)1270–1255
Si-O-Si(Si-O)1100–1000
O-Si(CH3)2-O(Si-O)840–790
Si(CH3)3800–700
Table 5. The results for H of composite insulators.
SamplesSi-(CH3)2Si-O-SiH
A10.22280.23610.9437
A20.21980.23370.9405
A30.21760.23240.9363
A40.21390.22930.9328
A50.2030.21880.9278
A60.16490.18320.9202
Table 6. Main element contents (%) of composite insulators of Factory A.
SamplesSiCOAlFePt
A122.5141.8530.774.540.060.27
A221.7540.1933.724.150.060.13
A320.8838.6235.364.830.050.26
A419.6436.4438.485.060.130.25
A518.6236.2340.224.620.070.24
A617.5135.3642.124.710.090.21
Table 7. The results of salt-fog flashover voltage of samples of Factory A.
SamplesAging Time/Year1000 μS/cm
Uf (kV)σ%
A1113.873.27
A23.513.304.89
A3612.762.27
A4811.212.13
A5109.994.76
A6128.113.28
Table 8. Lifespan prediction parameters of samples.
No.ParametersTest Methods
1θavCA of the surface of samples
2AAverage hardness of the surface of samples
3SemAging level based on SEM test
4HThe ratio of Si-(CH3)2 absorption peak altitude to Si-O-Si absorption peak altitude
5XSiRelative content of Si element of samples
6XCRelative content of C element of samples
7XORelative content of O element of samples
8UfSalt spray flashover voltage of samples
Table 9. Correlation between lifespan prediction parameters and aging time.
ParametersCorrelation CoefficientSignificanceCorrelation
θav−0.997α = 0.0006Significant negative correlation
A0.915α = 0.0106Positive correlation
Sem0.906α = 0.0136Positive correlation
H−0.861α = 0.0286Negative correlation
XSi−0.992α = 0.0006Significant negative correlation
XC−0.904α = 0.0136Positive correlation
XO0.996α = 0.0006Significant positive correlation
Uf−0.963α = 0.0026Significant negative correlation
Table 10. Predicted and actual aging time of composite insulators.
Samplesa1/Yeara/Yearσ1 (%)
A612.60125.0

