Article

1D Barcode Detection via Integrated Deep-Learning and Geometric Approach

1
College of Computer Science, National University of Defense Technology, Changsha 410000, China
2
College of Computer Science and Software Engineering, Shenzhen University, Shenzhen 518000, China
*
Author to whom correspondence should be addressed.
Appl. Sci. 2019, 9(16), 3268; https://doi.org/10.3390/app9163268
Submission received: 29 June 2019 / Revised: 24 July 2019 / Accepted: 6 August 2019 / Published: 9 August 2019
(This article belongs to the Special Issue Computer Vision and Pattern Recognition in the Era of Deep Learning)

Abstract

:
Vision-based 1D barcode reading has been the subject of extensive research in recent years due to the high demand for automation in various industrial settings. With the aim of detecting the image region of 1D barcodes, existing approaches are both slow and imprecise. Deep-learning-based methods can locate the 1D barcode region fast but lack an adequate and accurate segmentation process; while simple geometric-based techniques perform weakly in terms of localization and take unnecessary computational cost when processing high-resolution images. We propose integrating the deep-learning and geometric approaches with the objective of tackling robust barcode localization in the presence of complicated backgrounds and accurately detecting the barcode within the localized region. Our integrated real-time solution combines the advantages of the two methods. Furthermore, there is no need to manually tune parameters in our approach. Through extensive experimentation on standard benchmarks, we show that our integrated approach outperforms the state-of-the-art methods by at least 5%.

Graphical Abstract

1. Introduction

The detection of 1D barcodes has applications in sectors such as production, retailing, logistics, and transportation. Complementary to the traditional human-operated hand-held laser barcode reader, vision-based barcode reading has been gaining much attention in recent years because it allows for automatic object identification, which in turn facilitates a higher degree of automation. The robust automated 1D barcode detection approach aims at detecting a pure 1D barcode region and rotation angle through sensor vision. The right rotation angle ensures the correctness of the decoding result, while accurate region segmentation contributes to faster decoding for barcode decoding tools (such as ZXing library [1]) and image distortion restoration. However, detecting complete barcodes in harsh visual surroundings with accuracy and speed is still a difficult problem.
Existing approaches to vision-based barcode reading are either geometric-based [2,3,4] or learning-based [5,6]. While geometric approaches perform better in terms of accurateness of segmentation, they tend to be weak in the presence of severe distortion or occlusion. Learning-based methods, especially those based on deep neural networks (as Hansen et al. [6] use an object detection network for location) are gaining attention due to their good generality. However, the lack of interpretation of the detection and the segmentation process limits their practical application. Segmentation neural networks can output the segmentation region quickly, but even a tiny defect in the 1D barcode region can cause a completely different decoding result, which often occurs in real-world scenarios.
Meanwhile, for excellent 1D barcode detection results, existing 1D barcode detection approaches need to tune many thresholds set in the algorithms to apply in different detection conditions. The correctness of the threshold value may directly influence the performance of the algorithm, for example, threshold T which determines the candidate for the parallel segment detector by Creusot et al. [3], and the value of threshold ratio k t h for bar description by Namane et al. [4].
In this work, we propose a novel 1D barcode detection approach using integrated deep-learning and geometric methods in two-stages: barcode location and region extraction. We design two neural networks for each of the two stages. The outputs of the two networks are then post-processed using geometric methods. The barcode location stage first locates the bounding box region of the 1D barcode quickly, using a you only look once (YOLO) [7] object detection network. We also predict the rotation angle of the 1D barcode by detecting line segments with the line segment detector (LSD) algorithm [8] and clustering their angles in the barcode location stage. In the region extraction stage, we estimate the barcode rectangle region where the line segments of the 1D barcode can be extracted. We design a specific neural network, called the region estimation network, to determine this region. The extracted line segments form the clean barcode, which is easy to decode.
Through extensive experiments, we verify the effectiveness of our integrated approach. We also compare our approach to the state-of-the-art methods on the standard benchmarks, showing that our process improves the accuracy by at least 5%. Furthermore, we show that our approach is faster than the existing approaches.

2. Related Work

In recent years, methods focusing on barcode detection have developed rapidly in the computer vision community. Previous approaches required users to manually center and align the camera with the target barcode before detection to achieve a better performance. To improve efficiency, recent works have focused more on an interaction-free solution, enabling barcode detection to be fully automatic. The first barcode detector based on morphological operators was proposed by Katona et al. [9]. Different approaches based on geometry are widely adopted. Creusot et al. [3] find a candidate line segment in the barcode which crops the region in orthogonal direction by intensity value. Namane et al. [4] estimate whether the line segments, transformed from the outer contours, fit the bar description by length and orientation. Li et al. [10] use maximally stable extremal regions (MSERs) to eliminate the background noise and detect the direction of the barcode. The aforementioned works are all based on the graphic feature that a 1D barcode is composed of, i.e., a series of thin and thick bars, and so detect the line segments and the apparent gradient change in the orthogonal direction.
These methods are accurate in 1D barcode region extraction and perform well in benchmark datasets such as Zamberletti et al. [5], with the 1D barcodes images captured in a close distance; however, there still exists a localization problem. In various industrial applications, it is necessary to process a high-resolution image where 1D barcodes may appear in a small region, which makes localization of the 1D barcodes difficult especially when the background texture is complex. Increasing the image size also caused a rise in computational cost, which directly influences the speed.
Deep-learning-based approaches deal with localization tasks well. Many methods based on deep learning have been proposed, such as in [5], where they use a multi-layer perceptron (MLP) neural network in the 2D Hough transform domain to find potential bars. Hansen et al. [6] use an object detection network to locate the barcodes and another subsequent network to predict the rotation angle of the 1D barcode in the bounding box region. Further segmentation of the 1D barcode is not proposed by Hansen et al. [6]. With the pure 1D barcode region extracted, many image processes, such as distortion correction [11], can be applied to help decode the 1D barcode. Although there exist 2D object detection instance segmentation approaches such as Mask-RCNN [12], a tiny defect in 1D barcode segmentation may cause completely different decoding results; however, the mean average precision (mAP) [12] is still high. Therefore, we propose to use a geometric approach to solve the segmentation problem and combine it with a deep-learning approach to solve the localization problem. Related methods that we use in this work are the object detection network and line segment algorithm.
The object detection task involves the detection, classification, and localization of one or more target objects in an image; this marks objects with bounding boxes and gives them a category [13,14]. Object detection models are mainly built using a deep convolutional neural network, which has excellent performance in graphics processing [14]. The YOLO detection network [7,15,16] is a representative model famous for its speed, which directly predicts four values to describe a bounding box [16]. Compared to other detection systems such as RetinaNet [17] and DSSD513 [18], YOLO performs faster and better.
The line segment detection algorithm (LSD) [4] is a fast line segment detector which does not require one to manually tune the parameters for each image. In essence, LSD is a region growing algorithm; each region starts with just one pixel and the region angle set to the level-line angle at that pixel (orthogonal to the gradient angle). Then, the pixels adjacent to the region are tested; the ones with a level-line orientation equal to the region angle up to a certain precision are added to the region. At each iteration, the region angle is updated to the mean level-line orientation of pixels in the region. The process is repeated until no new point can be added. It always starts from seed pixels with a larger gradient magnitude as they likely belong to straight edges [8].

3. Model Overview

The 1D barcode is usually located on the package surface of a product which can have complex textures, making it difficult for the pure geometric-based methods to locate the region of the barcode. Regions outside 1D barcodes also take unnecessary computational cost, especially when dealing with high-resolution input images, which makes detection hard in real-time applications when using geometric methods, although they perform better in terms of accuracy. Deep-learning-based detection methods can locate the barcode fast using the object detection neural network technique, but the barcode in the bounding box region is still rotated randomly and mixed with background pixels, which makes it hard to decode.
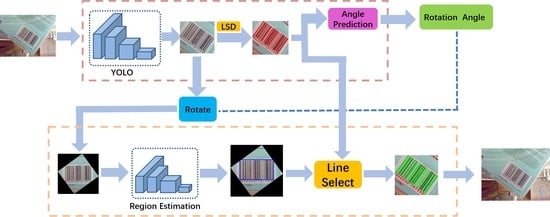
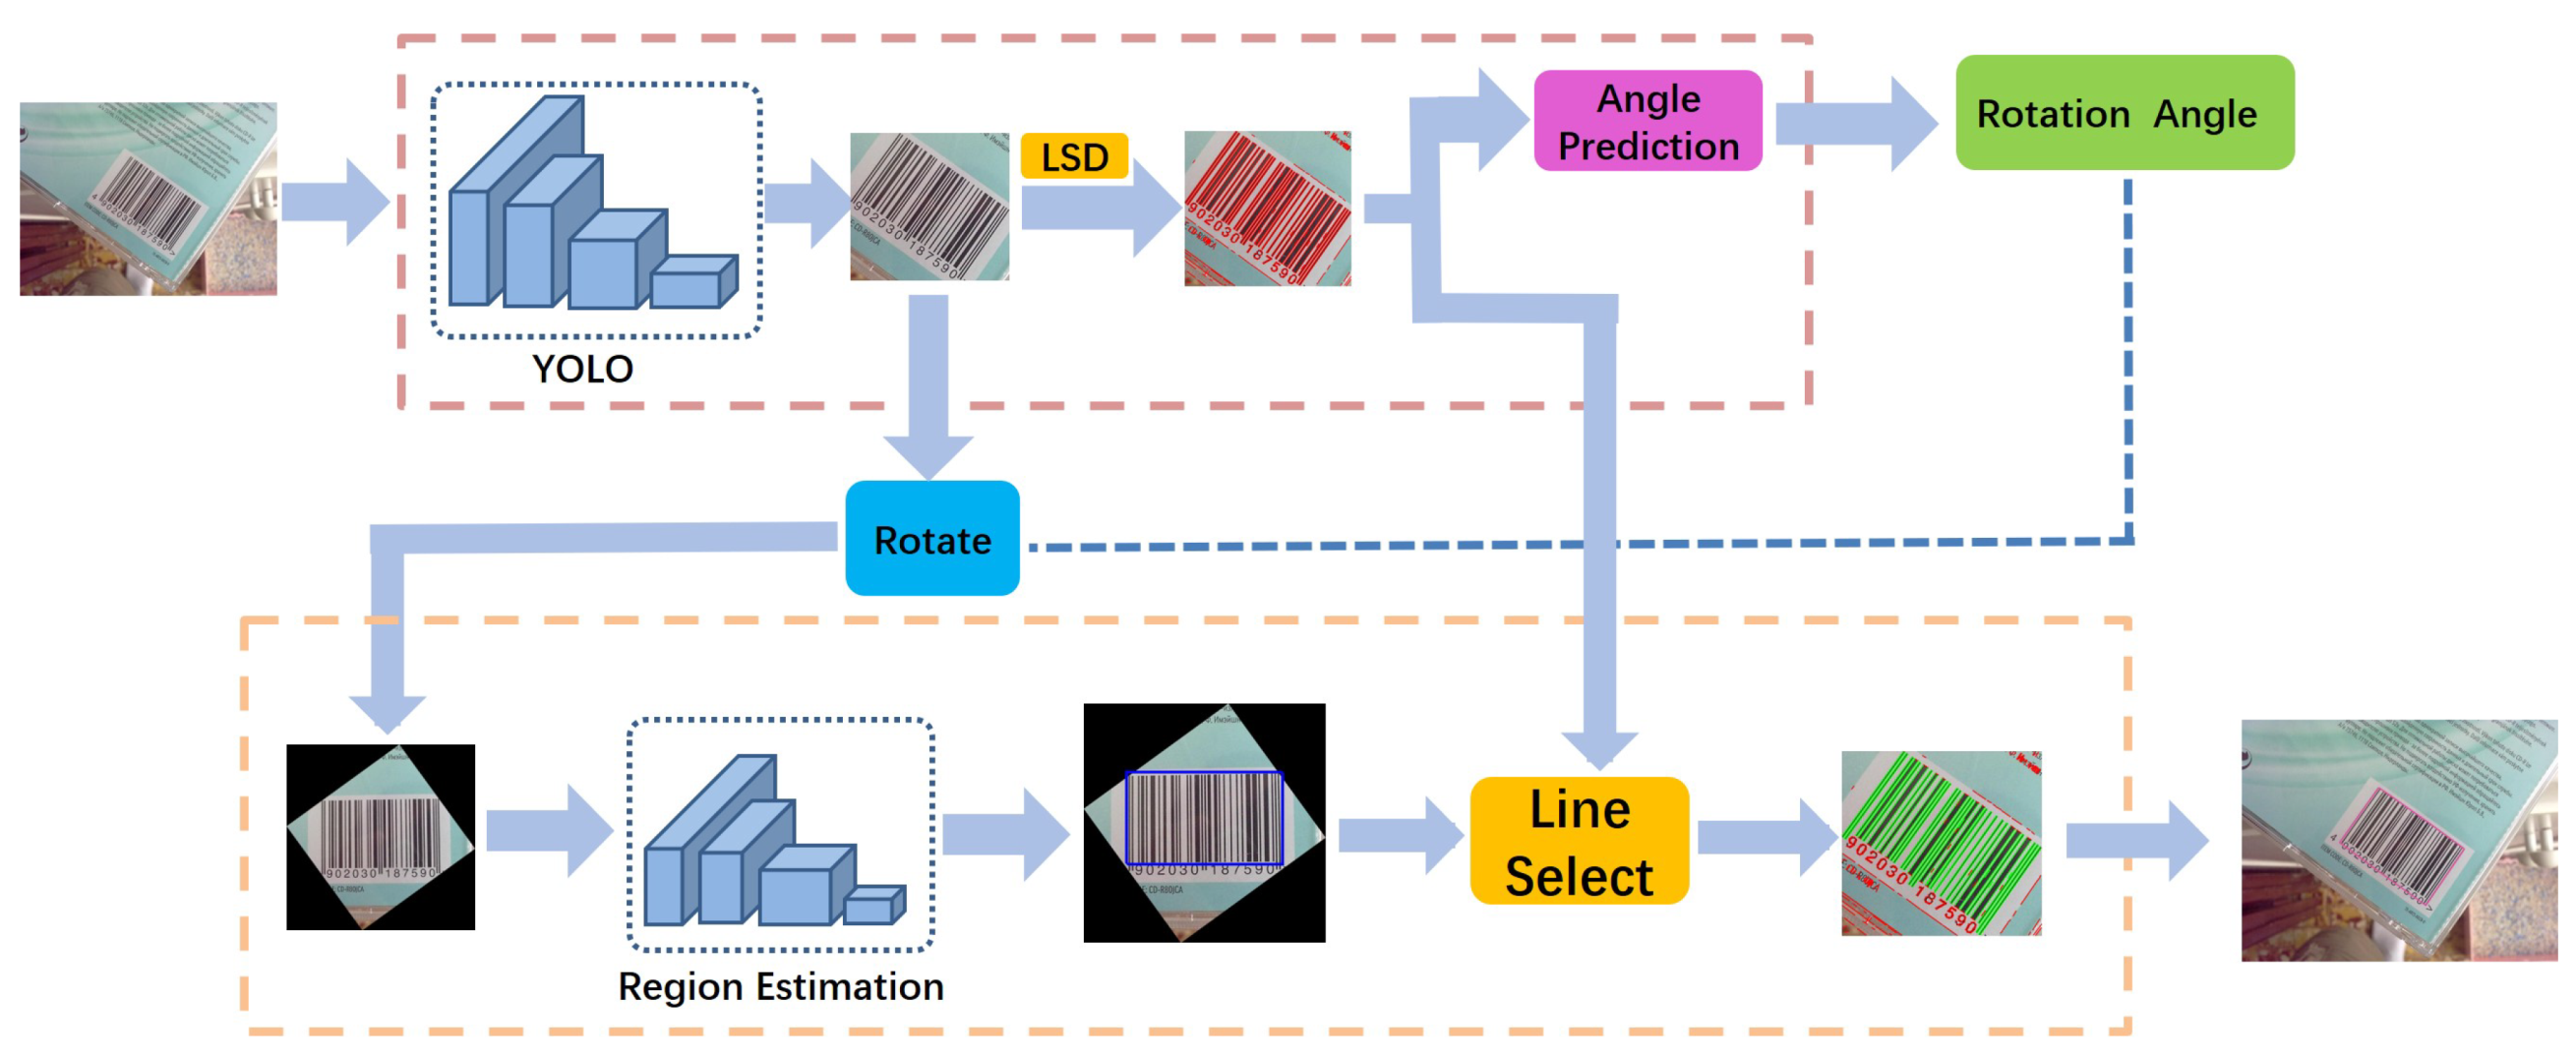
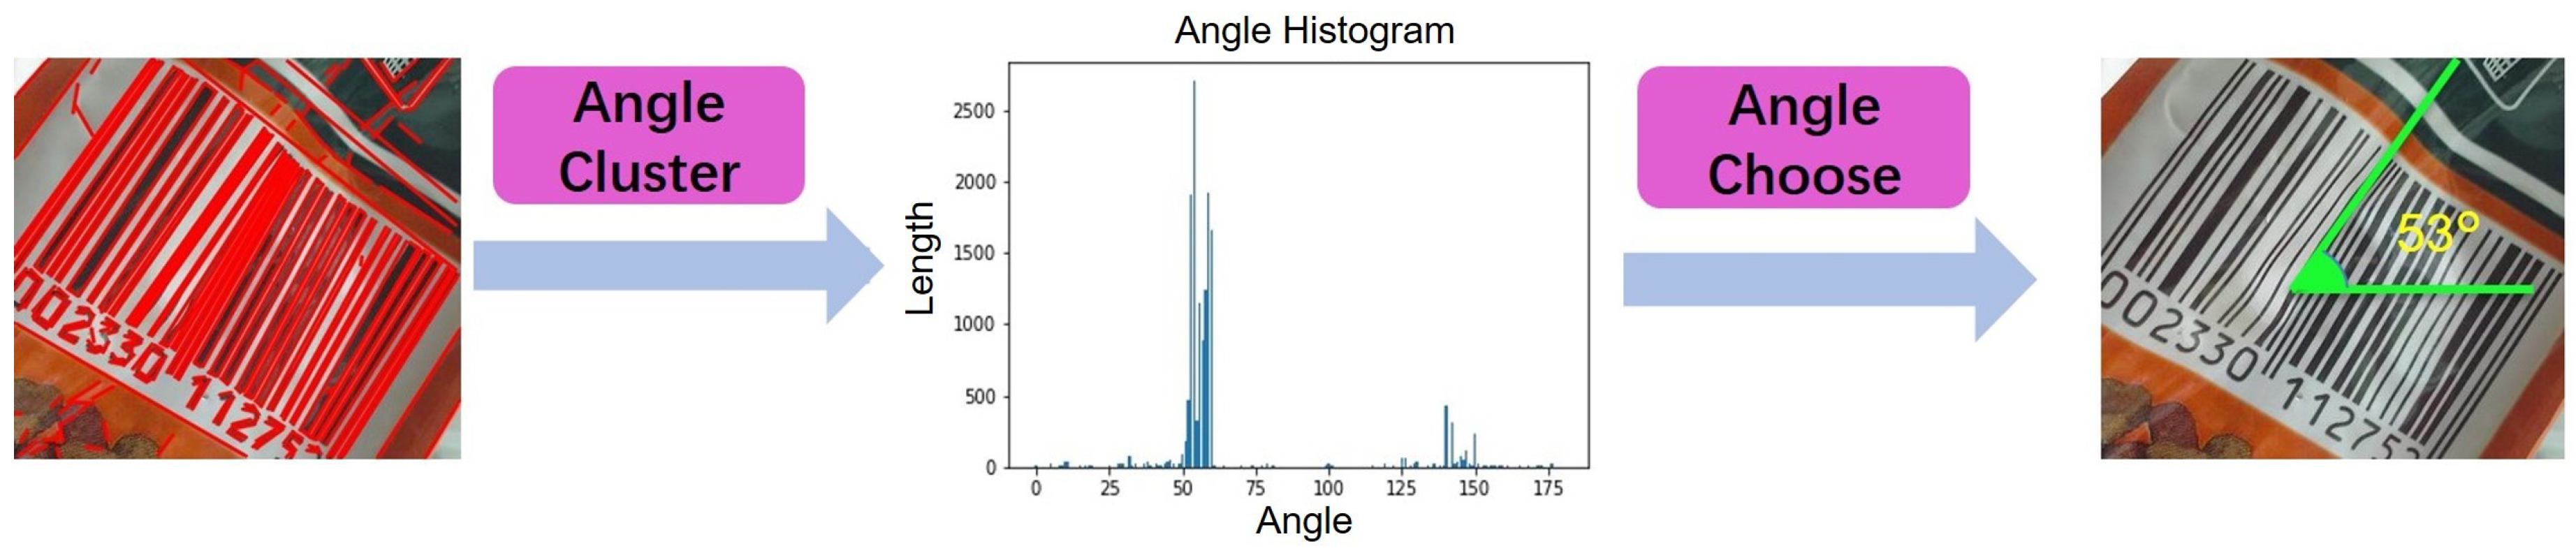
We consider that by incorporating deep-learning and geometric approaches, these problems will become easier to process. Through the fast parallel processing in deep-learning neural networks, geometric approaches help to improve the output accuracy. We propose a novel method in two-stages: barcode location and region extraction. Each stage is composed of a neural network and many geometric processes. The barcode location stage locates the bounding box of the 1D barcode using the YOLO object detection network and detects all line segments in the bounding box region using the LSD algorithm. Because the bars can be considered as a set of parallel line segments in a close distance, the rotation angle of the 1D barcode can be predicted by clustering all of the line segment angles and selecting the angle with the most line segments. Considering any line segments in an image also not belong to the 1D barcode, the region extraction stage processes the images cut from bounding boxes and proposes a selecting range for the line segments using the region estimation network. The final result is generated as a convex hull from the endpoints of the selected line segments. See an overview in Figure 1.
During the entire process, there is no need to tune any manual parameters. All our approach requires is a standard dataset or some 1D barcode images for network training which can easily be gathered.

4. Barcode Localization

In this section, we explain our method for locating the barcode and predicting the rotation angle in the first stage. we take a color image as input and perform object detection for each 1D barcode. Then, for each bounding box region, we detect the line segments and cluster the angles to predict the rotation angle of the 1D barcode.

4.1. Object Detection

The method we choose to locate the bounding box of the 1D barcode is the YOLO (you only look once) object detection network [7]. It can precisely locate 1D barcodes based on their shape and texture. Since YOLO is used as a tool and can be replaced by other object detection framework, we do not analyze its performance further. After inputting the source image containing 1D barcodes, the object detection network detects the bounding boxes of the 1D barcodes, and then we cut them from the source image into a collection I consisting of smaller images.
Even though the positions of 1D barcodes have been detected, the barcode images in I still cannot be read directly for the random rotation of the 1D barcode and background pixels. Angle prediction, the following procedure, which is performed with another neural network by Hansen et al. [6], is performed with a novel method in this stage. The details of the process are described below. However, more than just angle prediction, our technique also extracts the pure 1D barcode region from the bounding box, as is explained in Section 5.

4.2. Line Angle Detection

The 1D barcode can be regarded as a set of parallel line segments in a close distance. Since the 1D barcode already occupies the main region in every bounding box region, we can easily define the main angle of all the line segments to represent the rotation angle of the 1D barcode. The endpoints of the line segments have a further application for a particular region, as is proposed in Section 5.
We use the LSD (line segment detection) algorithm to detect all the line segments in the bounding box region and generate a collection of L, which consists of all the detected line segments. The LSD algorithm does not need to tune parameters manually. Then, we calculate the angle and length of every line segment using the endpoints. The line segments with the same angle are clustered, and each of these angles calculates the line segment length of the sum. The angle with the longest length represents the main rotation angle θ ( 0 θ < 180 ) of the 1D barcode. Figure 2 illustrates the details.
We use the above method to predict the rotation angle, which is dependent on the apparent geometric feature of the 1D barcode. Hansen et al. [6] solve this problem by training another neural network, which can bring unstable training results, unnecessary computational costs, and extra data preparation work; hereafter, we confirm that our approach is more efficient than Hansen et al. [6]. To test our hypothesis, we designed an experiment which shows our approach can predict the rotation angle with a tiny deviation compared to ground-truth. In addition, the rotation angle prediction time in our approach is less than that when using a neural network such as Hansen et al. [6]. Hansen et al. [6] take 17.3 ms to perform the same task, while we take only 14.3 ms in the first stage. See the details in Section 6.

5. Region Extraction

Our objective in this section is to select the line segments belonging to the 1D barcode region. The rotation angle θ was obtained in Section 4; however, we still need an approach to remove the line segments which do not belong to the barcode region and select the correct line segments for region proposal. While a background with complex texture may also detect closed and parallel line segments, as Figure 2 shows, merely measuring the distance of the line segments is not a robust approach. We propose a novel method to select the line segments in the 1D barcode region using a region estimation network and the endpoints of the selected line segments to generate a convex hull region.

5.1. Region Estimation Network

With the rotation angle θ obtained in Section 4, we consider that the 1D barcode rotated back to normal can be approximately regarded as a rectangle in the image. The rectangle is also a minimum bounding rectangle of the 1D barcode region containing all the line segments belonging to the 1D barcode. We try to train a neural network to regress four values to define this rectangle region: Two ratio values of barcode length and height in an image, two offset values from the barcode rectangle center to the image center. We rotate the barcode image in I back by angle θ as predicted in Section 4 and set it as the input of the region estimation network. The task of the region estimation network is the localization of the position of the 1D barcode rectangle and the calculation of its length and height, which helps to extract the correct line segments (line segments from the 1D barcode region) in L. The line segment with the midpoint in this rectangle is selected as a barcode line segment. We do not use the output of the region estimation network directly as a result and only use it as a region selector for the line segments, because practical 1D barcodes may suffer distortion, which makes them look less like a rectangle.
The training data of the region estimation network can be obtained from the same dataset used for training the object detection network in Section 4 with further processing. We describe the data processing procedure in Section 6.
We use the Resnet-18 network [19] as the mainframe of the region estimation network, and replace the last average pool layer with four filters to regress the values with activation functions ReLU (Rectified Linear Units). The loss function is defined as
L = ( w p w g ) 2 + ( h p h g ) 2 + ξ ( ( x p x g ) 2 + ( y p y g ) 2 ) ,
where w p is the prediction of the ratio of the barcode rectangle width to the image width, h p is the predicted ratio of the barcode rectangle height to the image height, x p , y p are the predicted offset values of the barcode rectangle center point to image center point. ξ defines the weight loss of the offset, we set it to 0.1. w g , h g , x g , y g are the ground-truths.
We designed our network to learn to locate the rectangle region of the 1D barcode by describing the area and offsets, which provides a rectangle region used to judge the line segments to be selected or not. For every line segment in L, we check its midpoint position in the rotated image. If the midpoint is still in the rectangle region estimated by the region estimation network, we select this line segment as a barcode line segment. All selected line segments should be collected for accurate region proposal. Figure 3 describes the detail of the line segment selection procedure.

5.2. Accurate Region Proposal

Before region proposal, we exclude the line segments with a short length and an angle deviating far from θ , as in the last step in Figure 3. It mainly contains the line segments detected from the number labeled under the barcode or the texture of fold as Figure 2 shows. Instead of using the output of the region estimation network, which is always a minimum bounding rectangle, we chose to propose the final region by generating a convex hull from the endpoints of all the selected line segments. This reduces doping irrelevant pixels in distortion or occlusion condition. A mask image is generated as a result by using the CGAL (The Computational Geometry Algorithms Library [20]) to extract the convex hull region.

6. Experiment and Evaluation

In this section, we show how to process our experimental data, and present the results compared with previous 1D barcode detection methods [2,3,4,5,6]. For comparison purposes, the detection rate D 0.5 and average Jaccard index J a v g are used as in [2,5]. A testing computer was used with an Intel Core i7-6600 3.50 GHz processor, 48 GB DDR4 memory, 500 GB SSD hard drive, and Nvidia GeForce Titan V with Ubuntu 16.04.2 LTS as the operating system.

6.1. Dataset and Date Processing

In our experiment, we used two 1D barcode datasets to measure the performance. The first dataset is the ArteLab Rotated Barcode dataset (referred to as Arte-Lab hereafter) with ground-truth provided by Zamberletti et al. [5]. It contains 365 EAN (European Article Number) barcodes captured with different cellphones. The second dataset is the WWU Muenster Barcode Database (referred to as Muenster hereafter) provided by Wachenfeld et al. [21]. It consists of 1055 EAN and UPC-A (Universal Product Code) barcodes captured with a Nokia N95 phone. The ground-truth is provided for 595 images [3]. In this experiment, the image sizes of both datasets are 640 × 480.
We prepared two kinds of data to train the object detection network and region estimation network. We obtained information about the bounding box from the mask image, which can be used to train the object detection network. The object detection network (YOLO) was modified to only find one class, 1D barcode.
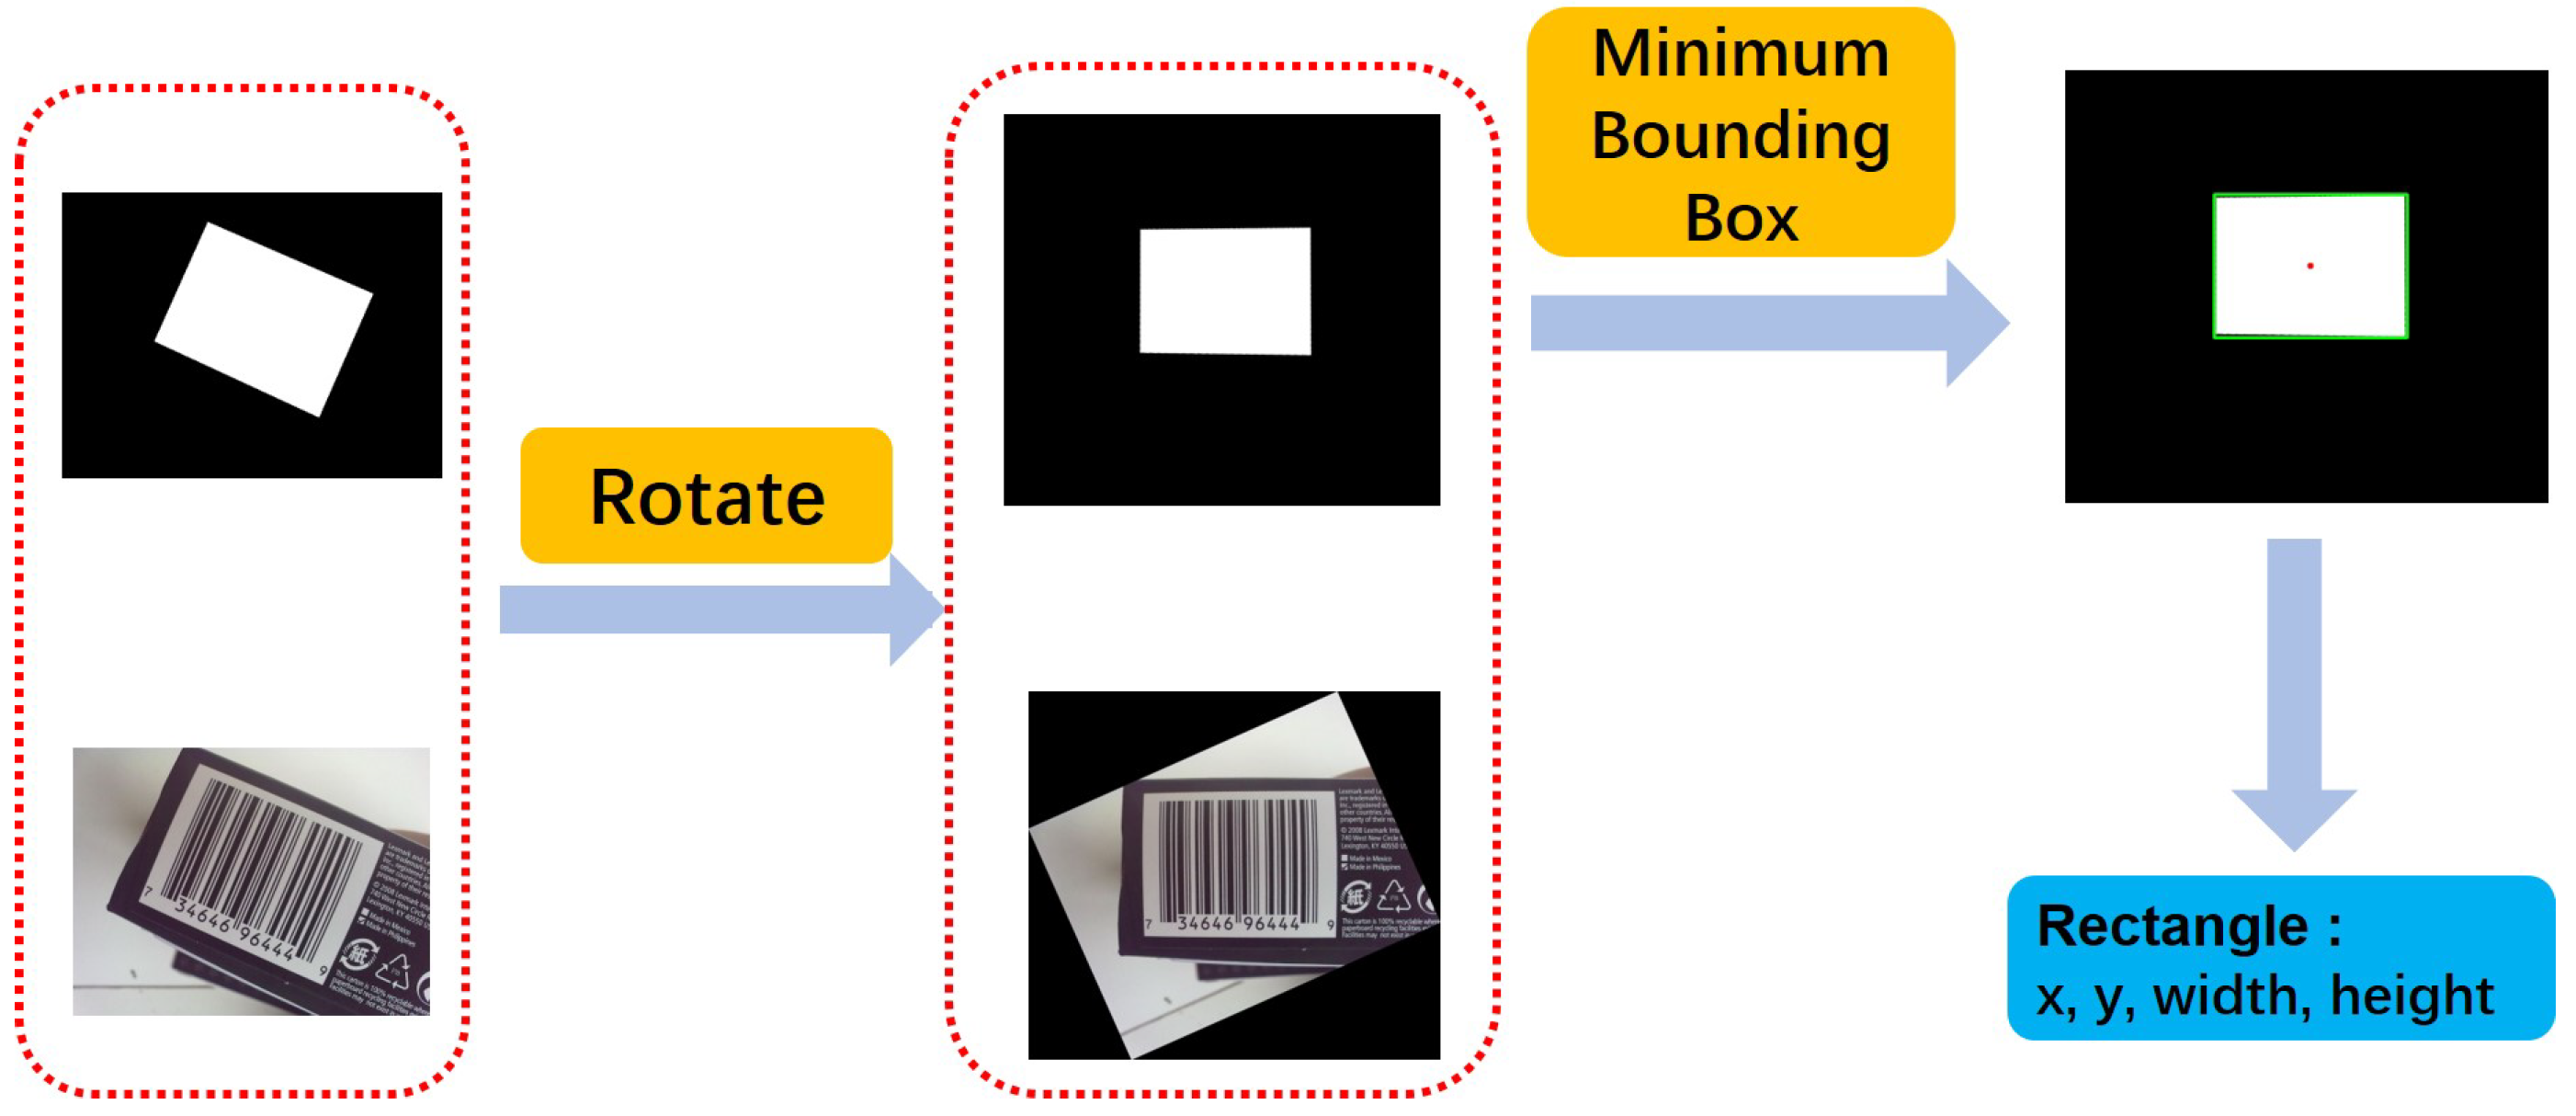
Further data processing was necessary for the region estimation network. We cut the bounding box region individually and estimated the rotation angle of the 1D barcode with the approach in Section 4. Then, we rotated it and generated a new image. We gathered the 1D barcode rectangle information from the mask image, which also was rotated in the same way as the source image. To train a robust model which can predict the barcode rectangle region in different scales, one-third of the images were not cut from bounding box region, but other processes continued operating. Figure 4 shows an example. After the above processing, we fed the data to train the region estimation network.
We trained two networks with 80% random data in two datasets as the training set; the remaining data was used to test the training result. As a result of the constraints of GPU memory and the neural network model size, the batch size we set to 64, and the momentum to 0.9. The initial learning rate was set to 0.001, decreasing by 0.5 ratios in every 4000 steps or when the training loss value tended to be stable.

6.2. Evaluation Metrics

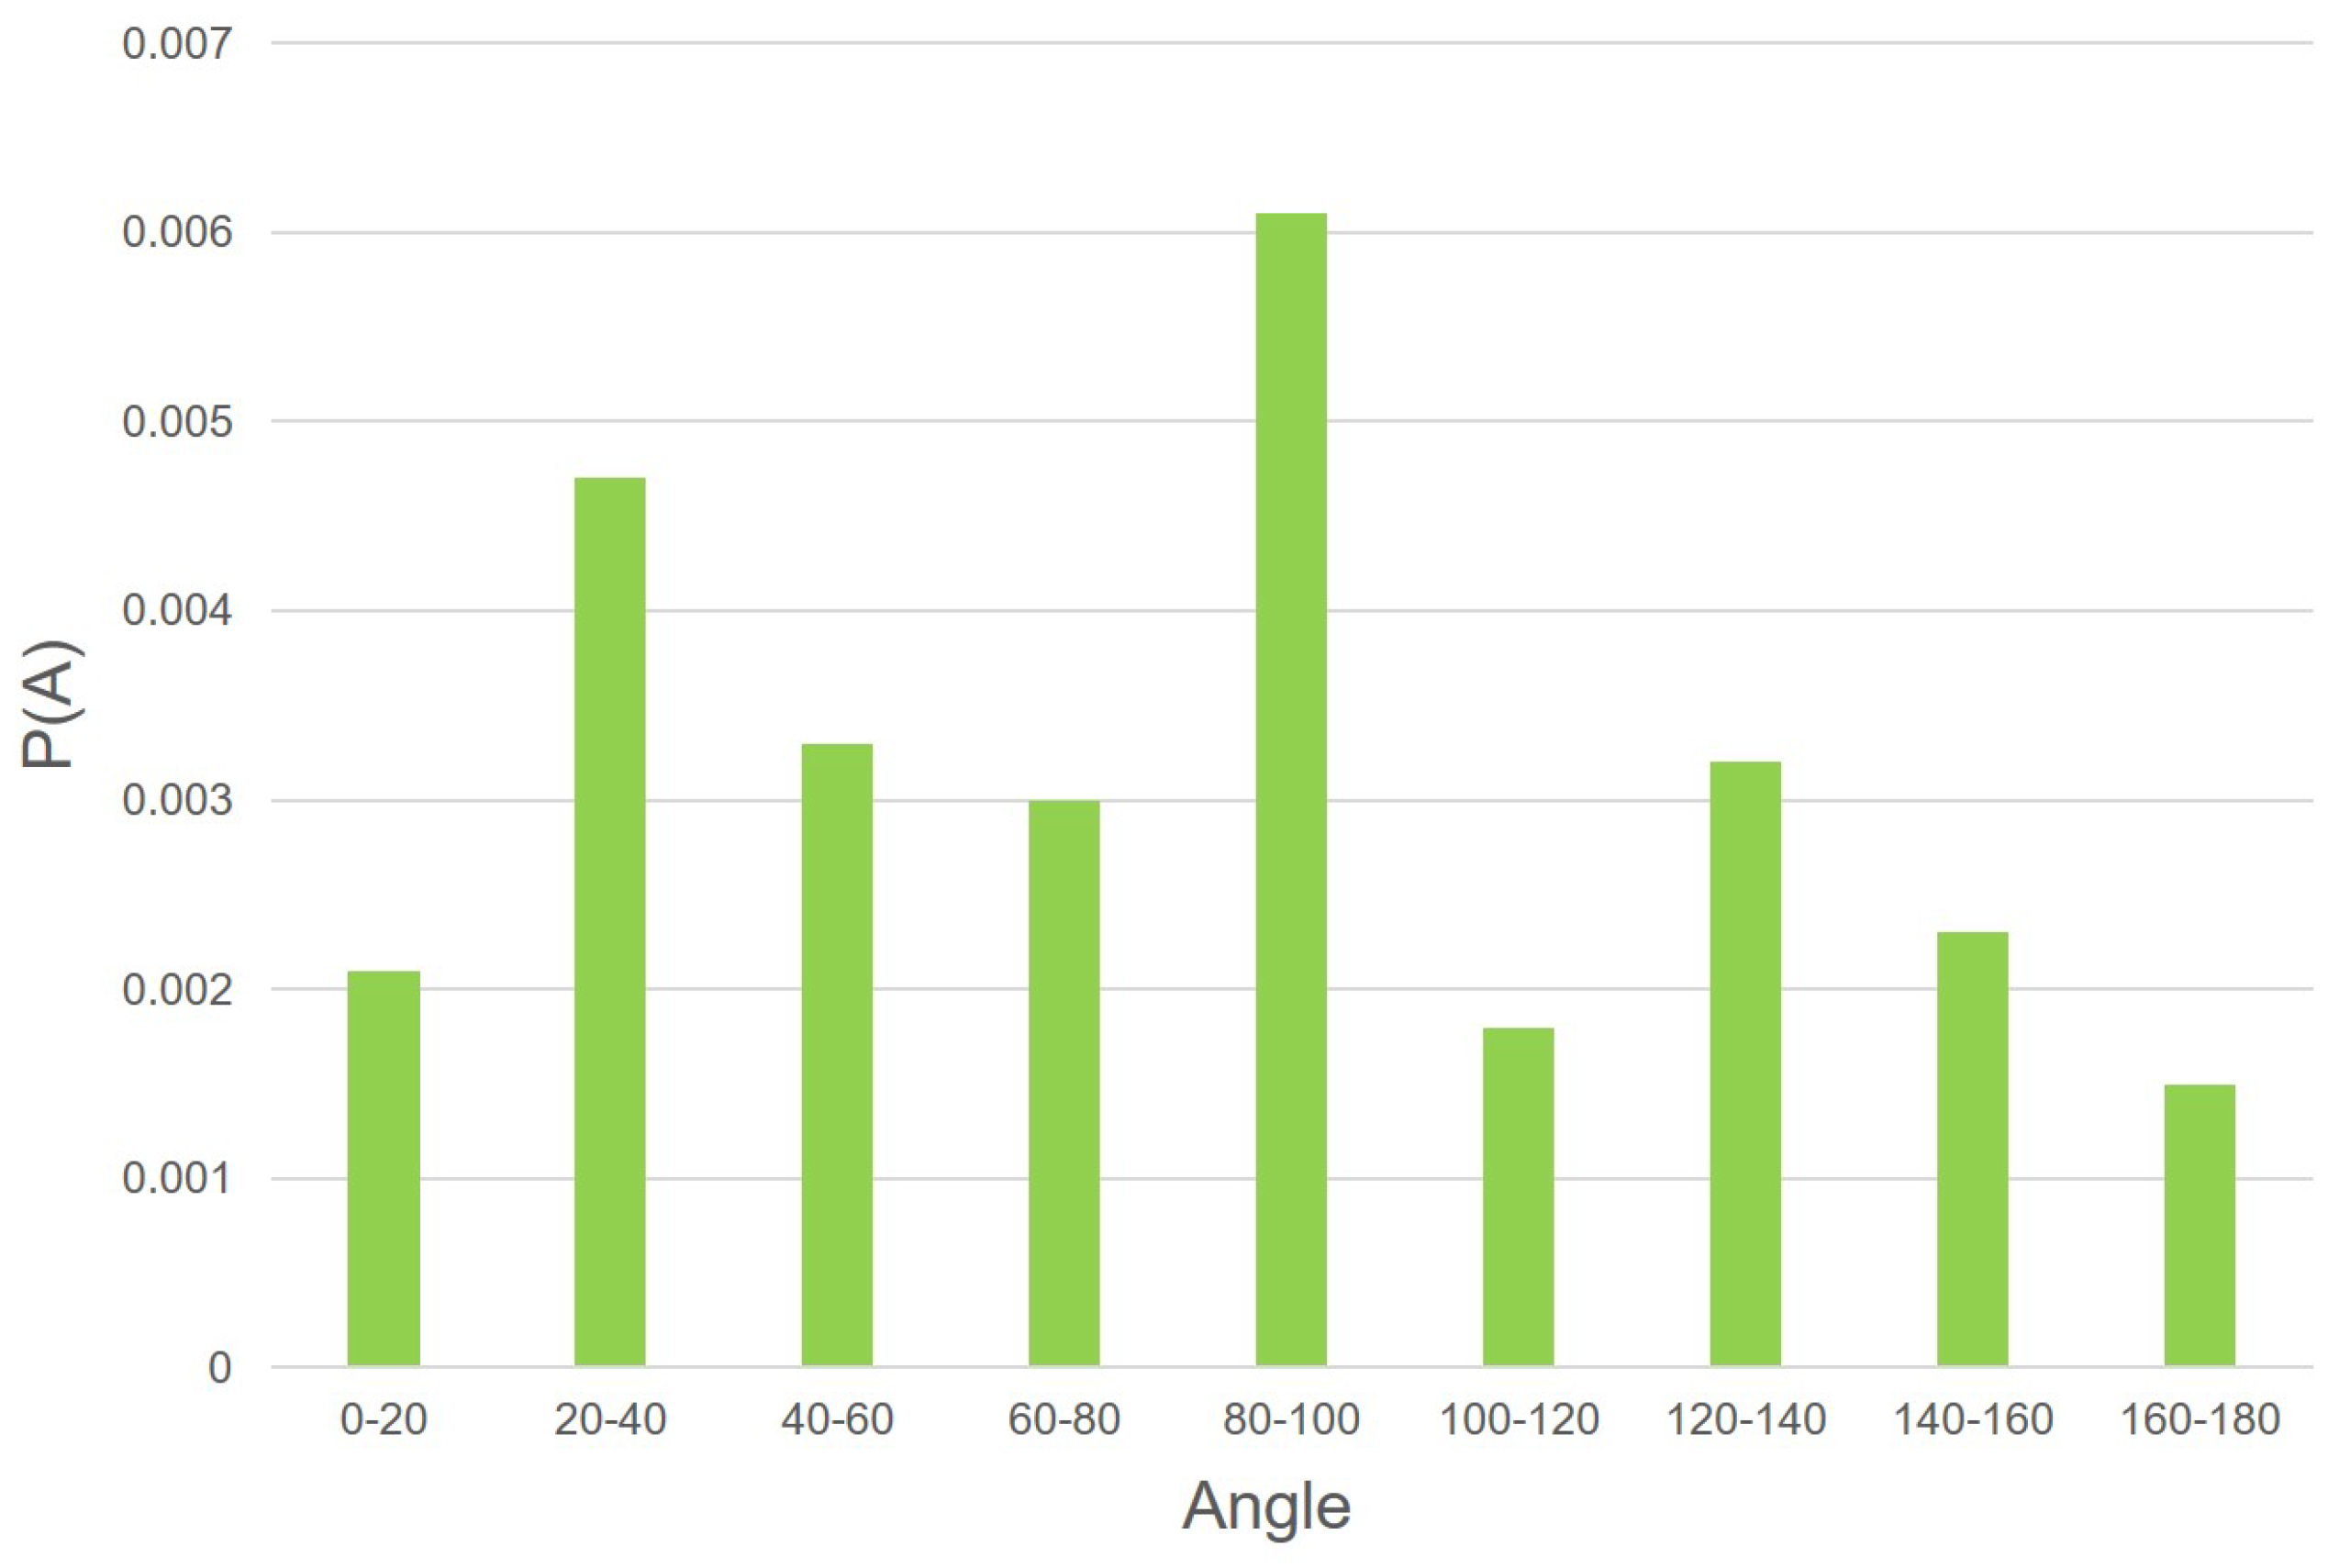
We measured the results of two stages. In the barcode location stage, we propose a novel method to predict the rotation angle. We prepared several images where the 1D barcode rotated with different angles and labeled their rotation angles manually as ground-truth. It was to make sure that the images could be decoded correctly when rotated in a labeled angle. Then, we tested those images in the barcode location stage by measuring the deviation of the predicted angle compared to the ground-truth. The angle deviation is defined as
P ( A ) = A A g π ,
where A is the predicted angle, A g is the ground-truth, and P ( A ) is the deviation value. In this work, we measured it with 86 images at different angles, and the results can be seen in Figure 5. For visual effect, we propose the average angle deviation every 20 degrees.
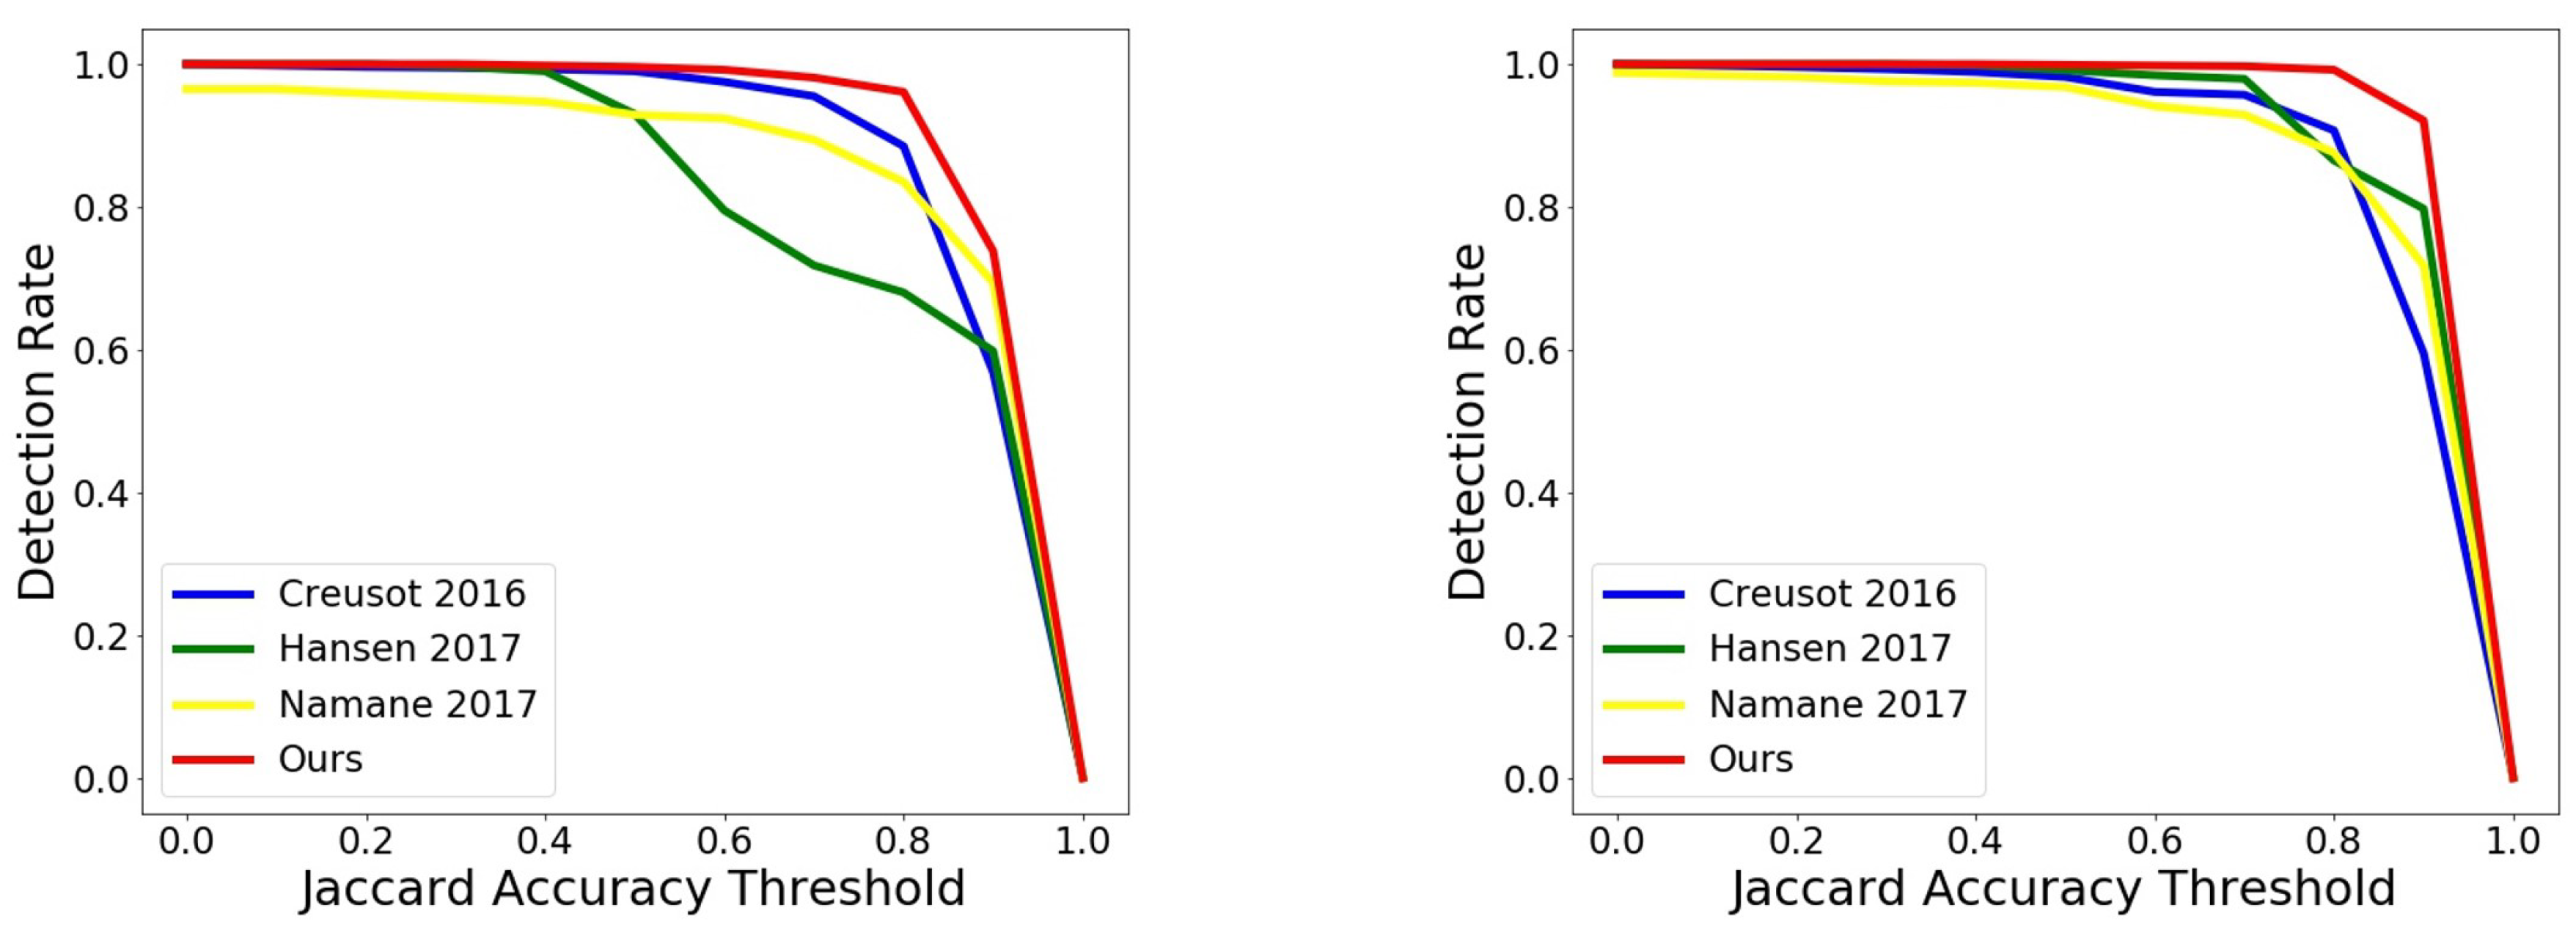
In the region extraction stage, since it gives the final result, we measured it using the same metric for result comparison as in [5]. The main measurement aims at evaluating the Jaccard index between the ground-truth and the detection. Both the detection result R and the ground-truth G are given as binary masks over the whole image [2]. The Jaccard index is defined as
J ( R , G ) = R G R G .
J a v g is the average Jaccard accuracy over the dataset. The overall detection rate D 0.5 corresponds to the proportion of the files in the dataset achieving at least 0.5 Jaccard accuracy (also called O A b b in [5]):
D 0.5 = # ( i S J ( R i , G i ) 0.5 ) , S
where S is the set of files in the dataset. For completeness, we provide the detection for varying accuracy thresholds in steps of 0.1. The results for the two datasets compared with other methods can be seen in Figure 6.

6.3. Results and Comparison

We compared the metrics, the accuracy J a v g , and the detection rate D 0.5 with previous works [2,3,4,5,6] using two datasets: the ArteLab Rotated Barcode Dataset and the WWU Muenster Barcode Database. We collected the results that they report in articles and compared them to the results from our approach. The comparison results for the two datasets are shown in Table 1 and Table 2 (in [3], the accuracy J a v g is not reported). It can be seen that our method shows a noticeable improvement both in the accuracy J a v g and the detention rate D 0.5 . In particular, the accuracy J a v g reaches a score higher than 0.9, which has not been achieved in the previous.
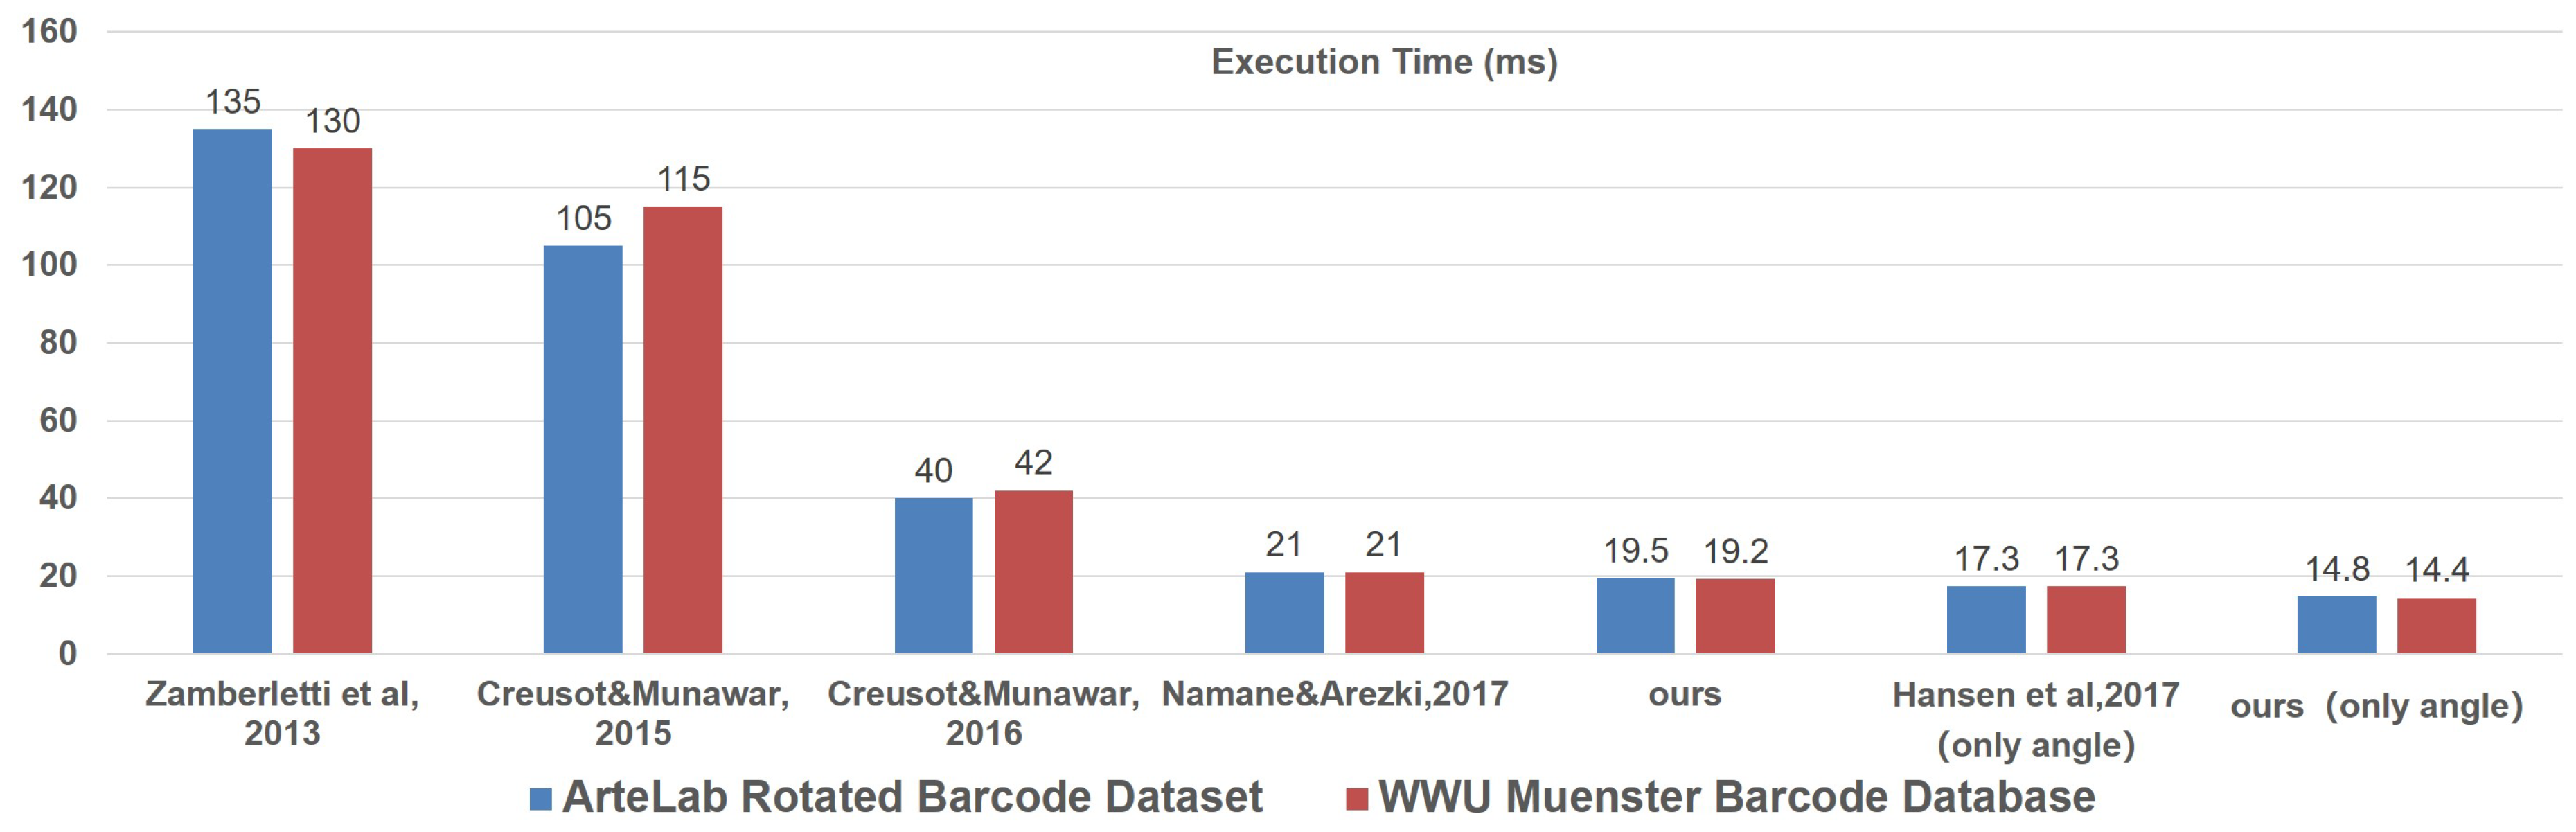
We also compared the speed, which is presented in Figure 7. The barcode location stage took 14.8 ms for the 1D barcode region location and rotation angle prediction. Note that we performed the same task as Hansen et al. [6] in terms of the barcode location stage but with a faster speed. The region extraction stage took 4.7 ms to propose an accurate 1D barcode region. The total process took 19.2 ms; this is also faster than the existing approaches mentioned above [2,3,4,5,6].
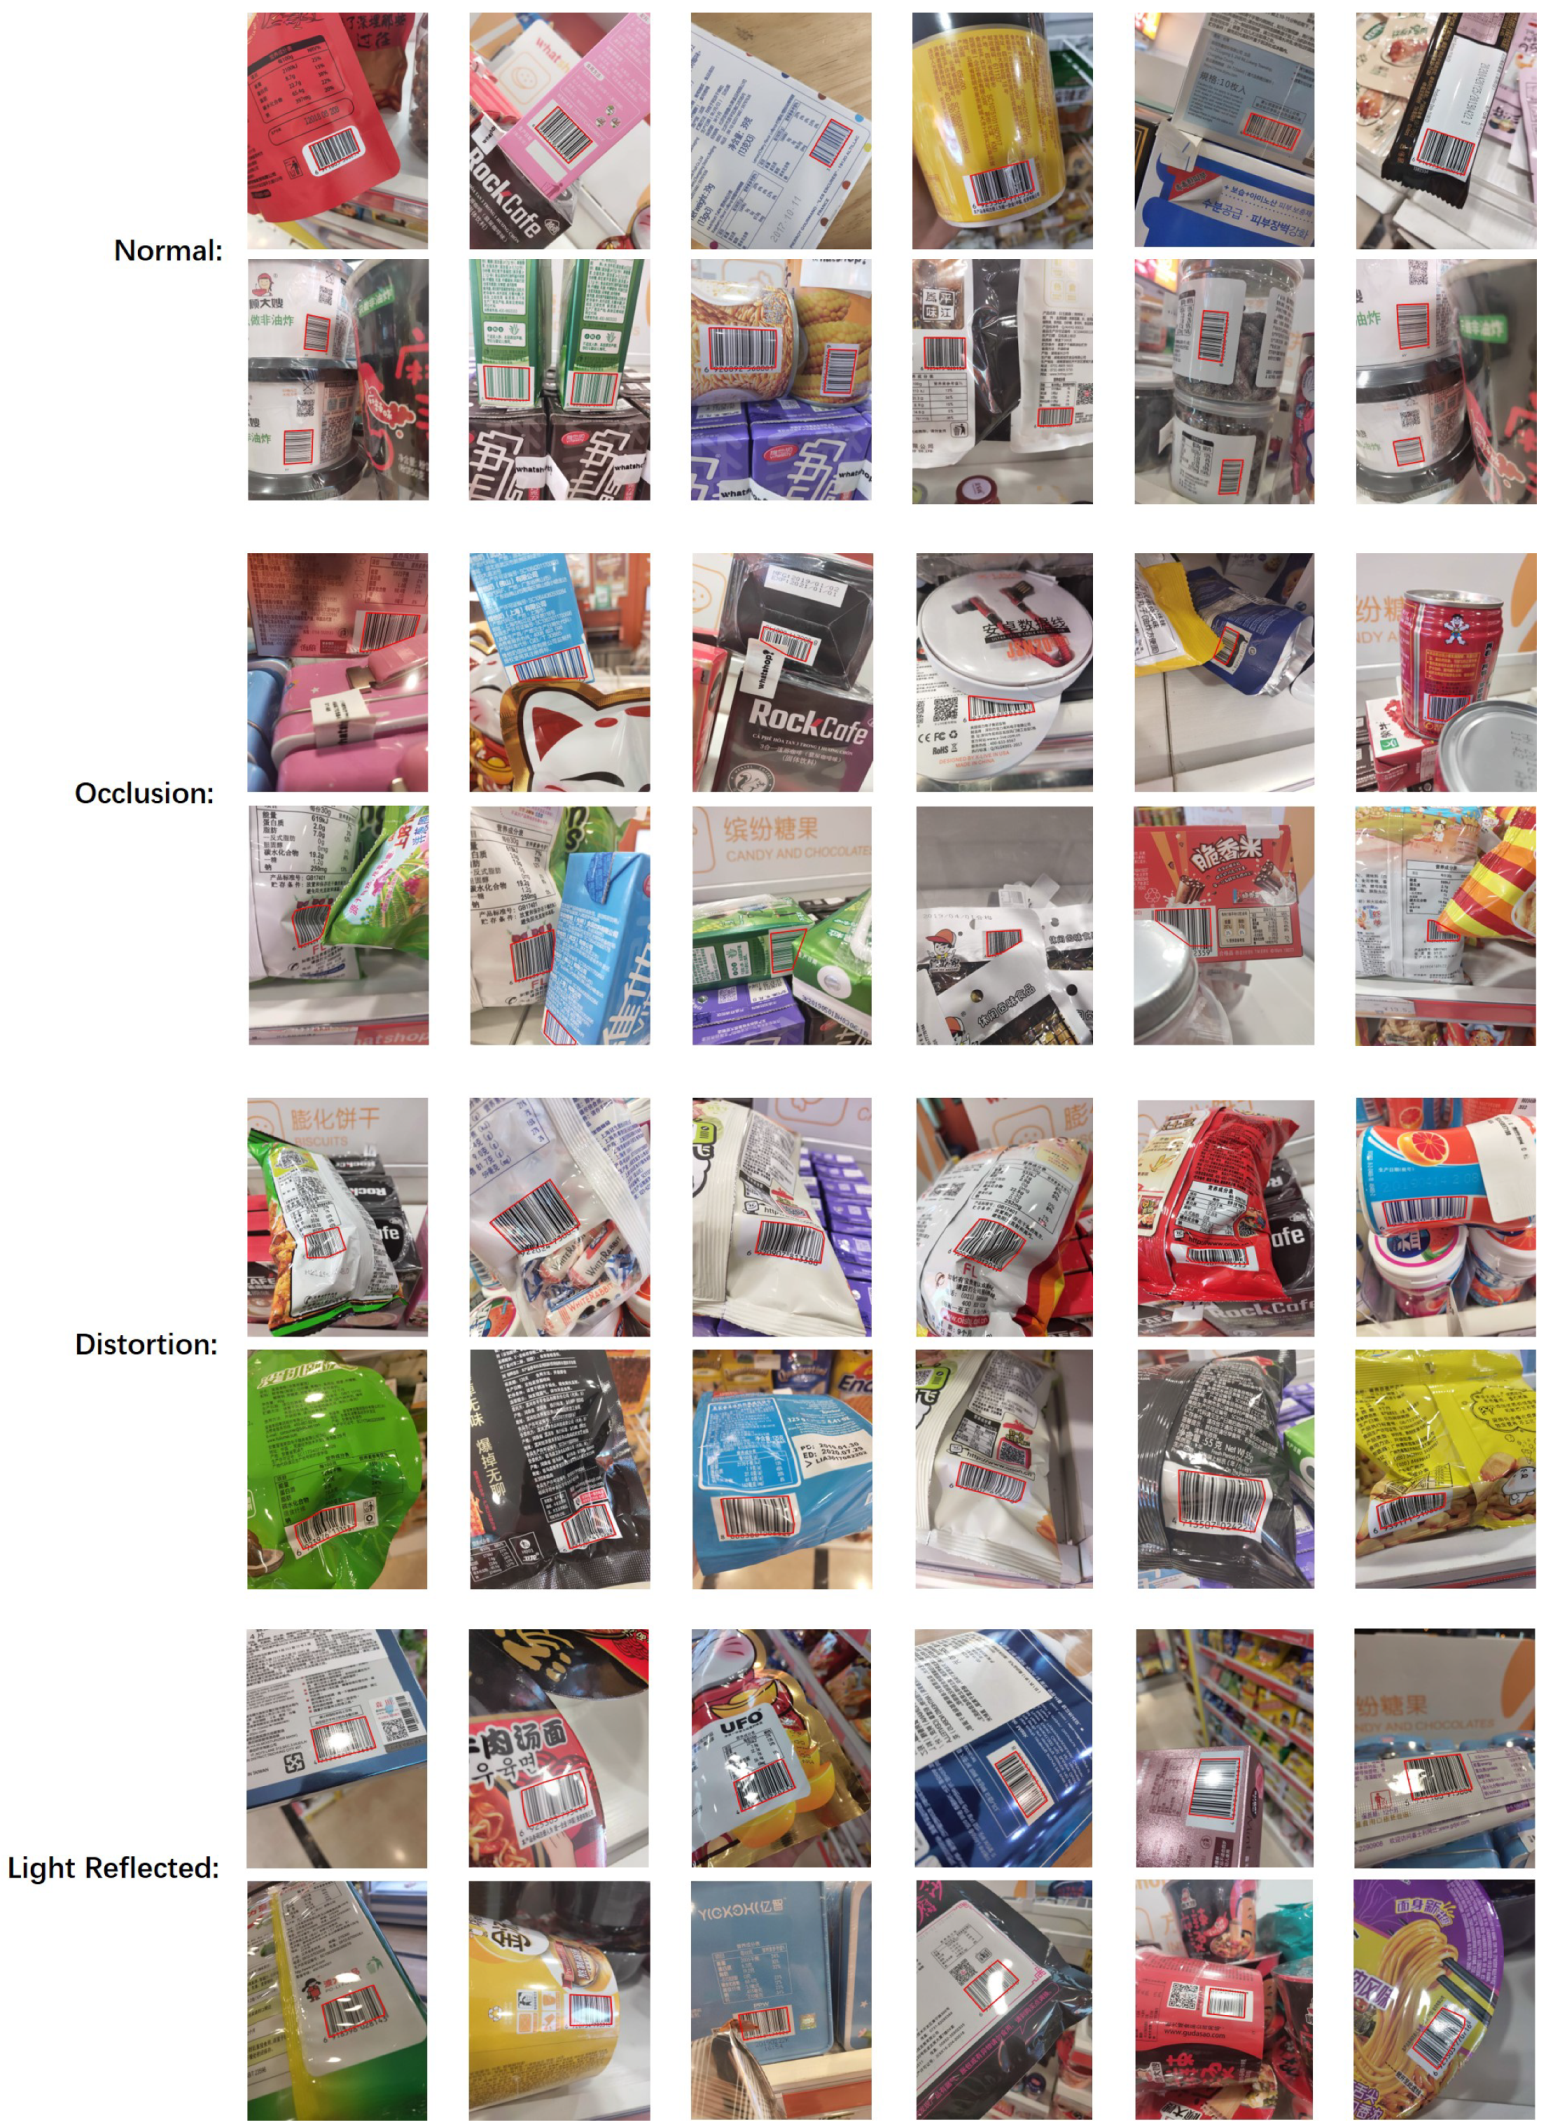
Considering the 1D barcodes may be printed on soft packing surfaces, or packed in plastic film, which brings distortion, occlusion, and reflects light, we collected some images from the retail market using a phone camera to test whether our algorithm can overcome these harsh conditions. The results show that most 1D barcodes can still be captured precisely. The primary purpose of this test in a real-world scenario was to investigate the sensitivity of our approach; some 1D barcodes were not decoded successfully when they were serious distorted and/or occluded. We show some examples in Figure 8.

7. Conclusions

In this work, we propose a novel two-stage method of 1D barcode detection. In the first stage, we use the YOLO object detection network to locate the position of the 1D barcode and detect all the line segments with the LSD algorithm in the bounding box region, where we predict the rotation angle using clustering line angles. In the second stage, we process the images cut from the bounding boxes and propose a selecting range for the line segments using the region estimation network. Finally, the line segments selected are used to generate a convex hull from the endpoints. We achieved state-of-the-art performance both in terms of accuracy and speed by combining the advantages of both the deep-learning model and geometric method. With no need to manually tune the parameters, this approach enjoys practicability, accuracy, and speed. We believe that our approach would be easily applied in practice and is applicable to all types of 1D barcodes.

Author Contributions

Conceptualization, Y.X. and Z.M.; methodology, Y.X.; software, Y.X.; validation, Z.M.; formal analysis, Z.M.; investigation, Y.X.; resources, Y.X.; data curation, Y.X.; writing—original draft preparation, Y.X.; writing—review and editing, Z.M.; supervision, Z.M.; project administration, Y.X.

Funding

This research received no external funding.

Conflicts of Interest

The authors declare no conflict of interest.

Abbreviations

The following abbreviations are used in this manuscript:
YOLOYou Only Look Once object detection network
LSDLine segment detection algorithm
MLPMulti Layer Perceptron neural network
MSERsMaximally Stable Extremal Regions
mAPmean Average Precision
ReLURectified Linear Units

References

  1. Mackintosh, A.; Martin, A.; Brown, B.; Brunschen, C.; Switkin, D. Zxing, Open Source Library to Read 1D/2D Barcodes. 2009. Available online: https://code.google.com/p/zxing (accessed on 21 January 2014).
  2. Creusot, C.; Munawar, A. Real-time barcode detection in the wild. In Proceedings of the 2015 IEEE Winter Conference on Applications of Computer Vision, Waikoloa, HI, USA, 5–9 January 2015; pp. 239–245. [Google Scholar]
  3. Creusot, C.; Munawar, A. Low-computation egocentric barcode detector for the blind. In Proceedings of the 2016 IEEE International Conference on Image Processing (ICIP), Phoenix, AZ, USA, 25–28 September 2016; pp. 2856–2860. [Google Scholar]
  4. Namane, A.; Arezki, M. Fast Real Time 1D Barcode Detection From Webcam Images Using the Bars Detection Method. In Proceedings of the World Congress on Engineering, London, UK, 5–7 July 2017; Volume 1. [Google Scholar]
  5. Zamberletti, A.; Gallo, I.; Albertini, S. Robust angle invariant 1d barcode detection. In Proceedings of the 2013 2nd IAPR Asian Conference on Pattern Recognition, Naha, Japan, 5–8 November 2013; pp. 160–164. [Google Scholar]
  6. Hansen, D.K.; Nasrollahi, K.; Rasmussen, C.B.; Moeslund, T.B. Real-Time Barcode Detection and Classification using Deep Learning. In Proceedings of the 9th International Joint Conference on Computational Intelligence (IJCCI), Funchal, Madeira, Portugal, 1–3 November 2017; pp. 321–327. [Google Scholar]
  7. Redmon, J.; Farhadi, A. YOLO9000: Better, faster, stronger. In Proceedings of the IEEE Conference on Computer Vision and Pattern Recognition, Honolulu, HI, USA, 21–26 July 2017; pp. 7263–7271. [Google Scholar]
  8. Von, G.R.G.; Jakubowicz, J.; Morel, J.M.; Randall, G. LSD: A line segment detector. Image Process. Line 2012, 2, 35–55. [Google Scholar]
  9. Katona, M.; Nyúl, G. A novel method for accurate and efficient barcode detection with morphological operations. In Proceedings of the 2012 Eighth International Conference on Signal Image Technology and Internet Based Systems, Naples, Italy, 25–29 November 2012; pp. 307–314. [Google Scholar]
  10. Li, J.; Zhao, Q.; Tan, X.; Luo, Z.; Tang, Z. Using deep convnet for robust 1d barcode detection. In Proceedings of the International Conference on Intelligent and Interactive Systems and Applications, Beijing, China, 17–18 June 2017; pp. 261–267. [Google Scholar]
  11. Ma, K.; Shu, Z.; Bai, X.; Wang, J.; Samaras, D. Docunet: Document image unwarping via a stacked U-Net. In Proceedings of the IEEE Conference on Computer Vision and Pattern Recognition, Salt Lake City, UT, USA, 18–22 June 2018; pp. 4700–4709. [Google Scholar]
  12. He, K.; Gkioxari, G.; Dollár, P.; Girshick, R. Mask r-cnn. In Proceedings of the IEEE International Conference on Computer Vision, Venice, Italy, 22–29 October 2017; pp. 2961–2969. [Google Scholar]
  13. Sermanet, P.; Eigen, D.; Zhang, X.; Mathieu, M.; Fergus, R.; LeCun, Y. Overfeat: Integrated recognition, localization and detection using convolutional networks. arXiv, 2013; arXiv:1312.6229. [Google Scholar]
  14. Girshick, R.; Donahue, J.; Darrell, T.; Malik, J. Rich feature hierarchies for accurate object detection and semantic segmentation. In Proceedings of the IEEE Conference on Computer Vision and Pattern Recognition, Columbus, OH, USA, 24–27 June 2014; pp. 580–587. [Google Scholar]
  15. Redmon, J.; Farhadi, A. Yolov3: An incremental improvement. arXiv, 2018; arXiv:1804.02767. [Google Scholar]
  16. Redmon, J.; Divvala, S.; Girshick, R.; Farhadi, A. You only look once: Unified, real-time object detection. In Proceedings of the IEEE Conference on Computer Vision and Pattern Recognition, Las Vegas, NV, USA, 27–30 June 2016; pp. 779–788. [Google Scholar]
  17. Lin, T.Y.; Goyal, P.; Girshick, R.; He, K.; Dollár, P. You only look once: Unified, real-time object detection. In Proceedings of the IEEE International Conference on Computer Vision 2017, Venice, Italy, 22–29 October 2017; pp. 2980–2988. [Google Scholar]
  18. Fu, C.Y.; Liu, W.; Ranga, A.; Tyagi, A.; Berg, A.C. Dssd: Deconvolutional single shot detector. arXiv, 2017; arXiv:1701.06659. [Google Scholar]
  19. He, K.; Zhang, X.; Ren, S.; Sun, J. Deep residual learning for image recognition. In Proceedings of the IEEE Conference on Computer Vision and Pattern Recognition, Las Vegas, NV, USA, 27–30 June 2016; pp. 770–778. [Google Scholar]
  20. Fabri, A.; Teillaud, M. Cgal-the computational geometry algorithms library. In Proceedings of the 10e Colloque National en Calcul des Structures, Hyéres, France, 8–13 May 2011; p. 6. [Google Scholar]
  21. Wachenfeld, S.; Terlunen, S.; Jiang, X. Robust recognition of 1-d barcodes using camera phones. In Proceedings of the 2008 19th International Conference on Pattern Recognition, Tampa, FL, USA, 8–11 December 2008; pp. 1–4. [Google Scholar]
Figure 1. Overview of our approach.
Applsci 09 03268 g001
Figure 2. Angle prediction in the bounding box region: We detect all the line segments in the bounding box region, and calculate the angle and length of every line segment using the endpoints. Then, we cluster all the line segments and summarize the length in every degree. As the clustering result shows in the angle histogram, 53 is the maximum length value, which will be chosen as the rotation angle.
Applsci 09 03268 g002
Figure 3. Line segment selection procedure: Given the rectangle region from the region estimation network, if the midpoint of the line segment is in this region, the line should be chosen as a barcode line segment. After removing the line segments with a short length and deviated angle, the selected line segments will generate a convex hull.
Applsci 09 03268 g003
Figure 4. Data processing for the region estimation network: 1D barcode color image and the mask image rotated at the same angle θ . We used the rotated 1D barcode color image as training data. The rotated mask image generates a minimum bounding box where the position and range information (four values in the blue box) are the ground-truth.
Applsci 09 03268 g004
Figure 5. Average predicted angle deviation for different angles. The deviation value P ( A ) at extremely low values indicates that our approach to the predicted rotation angle is a valid method.
Applsci 09 03268 g005
Figure 6. (Left): Test results on the ArteLab Rotated Barcode Dataset. (Right): Test results on the WWU Muenster Barcode Database.
Applsci 09 03268 g006
Figure 7. The different execution times for the two datasets.
Applsci 09 03268 g007
Figure 8. Some examples in different conditions: normal, occlusion, distortion, and light reflected.
Applsci 09 03268 g008
Table 1. Test results on the ArteLab Rotated Barcode Dataset.
ApproachAccuracy J avg Detection Rate D 0.5
Zamberletti et al. [5], 20130.6950.805
Creusot and Munawar [2], 20150.7630.893
Creusot and Munawar [3], 2016-0.989
Hansen et al. [6], 20170.8160.926
Namane and Arezki [4], 20170.8600.930
Ours0.9120.997
Table 2. Test results on the WWU Muenster Barcode Database.
ApproachAccuracy J avg Detection Rate D 0.5
Zamberletti et al. [5], 20130.6820.829
Creusot and Munawar [2], 20150.8290.963
Creusot and Munawar [3], 2016-0.982
Hansen et al. [6], 20170.8730.991
Namane and Arezki [4], 20170.8820.966
Ours0.9390.998

