Article

Impact Performance of Helmholtz Self-Excited Oscillation Waterjets Used for Underground Mining

1
School of Energy and Power Engineering, Wuhan University of Technology, Wuhan 430063, China
2
Changjiang Yichang Waterway Engineering Bureau, Yichang 443000, China
3
Yangtze River Waterway Engineering Bureau Co., Ltd., Wuhan 430021, China
4
Hubei Key Laboratory of Waterjet Theory and New Technology, Wuhan University, Wuhan 430072, China
*
Author to whom correspondence should be addressed.
Appl. Sci. 2019, 9(16), 3235; https://doi.org/10.3390/app9163235
Submission received: 30 June 2019 / Revised: 4 August 2019 / Accepted: 7 August 2019 / Published: 8 August 2019
(This article belongs to the Section Energy Science and Technology)

Abstract

:

Featured Application

The paper will provide nozzle selection basis and impact mechanism of Helmholtz self-excited oscillation waterjets used for underground mining.

Abstract

Pulsed waterjets are widely used in exploitation of fossil fuels for their high efficiency. With the aim to further clarify the impact performance of Helmholtz self-excited oscillation waterjets (HSEOW), numerical and experimental studies were conducted. The morphological characteristics of the erosion surfaces between conical and HSEOW nozzles were compared and the cavitation evolution was obtained. Results show that the cavitation damage caused by the HSEOW nozzle on the specimen was mainly caused by the jet cavitation cloud under submerged conditions. The cavitation effect produced by the HSEOW nozzle had a much greater destructive effect than that of a conical nozzle. The mass loss caused by HSEOW nozzles increased first with the increase of standoff distance, then decreased rapidly after reaching the maximum value. Moreover, the density of holes and the damage intensity weakened with the increase of radial distance. A dimensionless cavity length of 2 and a dimensionless cavity diameter of 8 was the optimal structure that led to maximum mass loss. These results provide a further understanding of cavitation mechanism which leads to the impact performance of pulsed water jets and optimal working parameters in the field of energy exploitation.

1. Introduction

High-pressure water jets have been widely used in mechanical processing, petroleum, chemical industry, metallurgy, and other fields. At present, drilling assisted by water jets has become one of the conventional technical means in exploitation of fossil fuels [1]. Primary crushing was carried out by high pressure water jets at the front of the bit on the rock, which can improve the drilling efficiency of the drill bit. At the same time, water has the benefit of cleaning, lubricating, cooling, and avoiding spark production, which will greatly improve the safety performance in the process of drilling.
Aiming at rock breaking assisted by high-pressure water jets, many scholars have carried out relevant research. As early as 1964, McLean et al. [2] studied the downhole flow field of a mechanical drill bit with high-pressure jets nozzles through laboratory tests and obtained the velocity distribution of downhole overflow tank level and the distribution law of high-pressure jet impact pressure. Shen et al. [3] experimentally studied the attenuation law of high pressure jets before reaching the bottomhole, and the index of half-attenuation distance of impact pressure was put forward, which drew the conclusion that high ambient pressure will reduce the impact performance of water jets. Taherdangkoo et al. [4] proposed a new predicting scheme to evaluate bottomhole circulating pressure in petroleum industry and this method was able to predict the complex relationship between inputs and outputs of a highly nonlinear system. Wen et al. [5] comprehensively analyzed the results of an orthogonal experimental design and demonstrated the optimal structural parameters of a straight cone nozzle. Ge et al. [6] proposed a novel method that used a self-propelled water-jet nozzle to dredge blocked boreholes in coal seams in order to improve the coal bed methane output and coal mine safety. The nozzle inlet pressure was optimized and a field experiment on the blockage removal of blocked coal bed methane drainage boreholes using the proposed method was conducted. Lu et al. [7] designed a self-propelled water-jet drilling nozzle to drill three-type boreholes to improve gas extraction, and drilling experiments were conducted to optimize the nozzle configuration. Li et al. [8,9] designed a new drilling tool to improve drilling rate in deep wells, based on the theory of jets pulsation. Oil field tests in five wells show good applicability of the tool to bit types, formation, drilling densities, flow rates, and dynamic hydraulic drilling motors, etc. As a result, penetration rates are improved ranging from 10.1 to 31.5%.
To increase the damage of water jets on rock, a new water jet technology called ‘self-excited oscillation jets’ has been developing gradually since the 1970s. Through a certain structure, the energy provided by the power source is stored and transmitted to the jets media intermittently, so that the jets media can obtain a huge amount of energy from the jets. Due to its outstanding characteristics of high energy accumulation, strong erosion performance, and high working efficiency, self-excited oscillating pulsed jets have great importance as a new technology with broad application prospects. The application of self-excited oscillating jets on water jets assisted drilling greatly, improved the efficiency of jets’ rock breaking, and has become an important means of oil and gas drilling and production increase. Morel [10] conducted an experimental study of a Helmholtz resonator driven by a round jet passing through it and drew the conclusion that jet instabilities coupled with the Helmholtz resonance to produce very powerful chamber-pressure oscillations at a frequency slightly higher than the chamber frequency. Rockwell and Naudascher [11,12] studied the self-sustained oscillation phenomena produced by fluid flowing past different cavities and confirmed this conclusion through a lot of experiments. Their further research indicated that the structure of the cavity led to a large number of vortexes near the boundary layer, part of which appeared orderly. What is more, the ordered structure exactly induced self-sustained oscillation. Hu et al. [13] described a new way of generating a pulsed-air water jet by entraining and mixing air into the cavity of a pulsed water jet nozzle. A theoretical model which describes the frequency characteristic of the pulsed-air water jet was proposed. Lu et al. [14] theoretically and experimentally investigated the effects of gas content on the oscillating frequencies of self-excited oscillation water jets. The conclusions showed that the increase of gas content in the chamber led to the decrease of the sound speed and oscillating frequencies. Li et al. [15] conducted a series of experiments to investigate the effect of nozzle inner surface roughness, area discontinuity at nozzle inlet [16], and feeding pipe diameter [17] on the characteristics of high speed self-excited oscillation pulsed waterjets, which gave out the optimum structure parameters and working parameters. Wang et al. [18] experimentally studied the effects of the downstream contraction ratio of organ-pipe nozzle on the axial pressure oscillations. The results show that the downstream contraction ratio can affect the development trends of the pressure oscillations and determines the values of the peaks and amplitudes. Liu et al. [19,20] investigated the turbulence flow past a 120° impinging edge Helmholtz nozzle, a modified theoretical model accompanied by numerical simulation was proposed to obtain the range of the oscillation frequency and was verified using experimental results.
As the exploitation of fossil energy gradually turns to depths reaching thousands of meters, the environmental pressure faced by high-pressure jets gradually increases, and the underground environment of a drill bit becomes complicated. In the present study, an indoor water jet experimental system was designed to test the impact performance of erosion on the specimen. Erosion testing was carried out to evaluate performance under different working conditions and structure parameters. Meanwhile, a numerical investigation of cavitation evolution was conducted to further study the erosion mechanism of HSEOW. The difference of erosion mechanisms between a self-excited oscillating nozzle and traditional nozzle was obtained, which can give guidance on the impact performance of water jets for underground mining.

2. Research Method

2.1. Nozzles and Specimen

A Helmholtz self-excited oscillating waterjet (HSEOW) nozzle was used in the present study, which is one of the typical pulsed nozzles used in engineering practice. A Helmholtz oscillator consists of an upstream nozzle, an upstream collision wall, an oscillation chamber, a downstream collision wall, and a downstream nozzle [21], while upstream nozzle diameter is d1, downstream nozzle diameter is d2, collision wall angle is α, oscillation cavity length is Lc, oscillation cavity is Dc. The profile and photo of nozzles is shown in Figure 1. The upstream nozzle and downstream nozzle are made of stainless steel and connected by thread, thus achieving the purposes of pressure-bearing and sealing. In the present study, the upstream nozzle remained unchanged (d1 = 2.6 mm) and nozzle structures are only adjusted by changing the size of the downstream nozzles. The upstream and downstream nozzles are strictly centered in processing, and all of the inner wall roughness is 0.8. The structure parameters are shown in Table 1.
As for the specimen, pure aluminum (1060A Chinese Industry Standard, 100 × 100 × 10 mm) was employed for the tests for its good elongation, high plasticity and corrosion resistance, and reasonable price. The chemical compositions and physical properties of the specimen are shown in Table 2 and Table 3. Before the tests, the hardness of the aluminum plate specimen involved was measured to ensure that the hardness is at the same level and would not cause interference to the test results. Hvst-1000z microhardness tester was selected, with an average hardness value of 23.95 and an error range of −3.9~4.1%. The error of test results was affected by the system error of hardness tester, the error of reading indentation data, and the uneven density distribution of aluminum plates.

2.2. Experimental Setup

In order to better understand the impact performance of HSEOW nozzles, a test system of water jet erosion was established, as shown in Figure 2. Water stored in the tank was pressurized by a plunger pump with a maximum flow rate 120 L/min and a maximum operating pressure 60 MPa. A control panel was deployed to regulate pressure through frequency conversion and an accumulator was used to keep the pressure steady. Water went through a series of pipes, ejected from the nozzle at the end of the connecting rod and finally impacted on the target plate. The specimen was fixed at the bottom of the tank and the standoff distance S was defined as the distance from the specimen surface to the nozzle exit wad adjusted from 10 mm to 90 mm. The data acquisition system was Quantum X and the pressure transducer for the test was BD DMK331P. The test data of the flowmeter and pressure transducer was transmitted to the computer through the acquisition card.
Before the test, the protective films on the surface of the aluminum blocks were teared off. A specimen was placed in the tank on the loading platform and fixed by a stop screw. The vertical distance from the nozzle outlet center to the aluminum block was measured, and the coordinates on the operation panel were calibrated. During the test, the standoff distance was adjusted by accurately reading the number of coordinates on the control panel and controlling the vertical coordinates of the nozzle through the vertical sliding rail motor. The inverter and high-pressure pump power supply were firstly opened. Then the water tank valve and the pipeline pump kept running until the gas in the pipeline was completely discharged. The nozzle was located 500 mm underwater and the pressure was set to the specified value. The above process was repeated after the nozzle and aluminum block were replaced, thus the erosion of various nozzles was accomplished under different operating conditions.
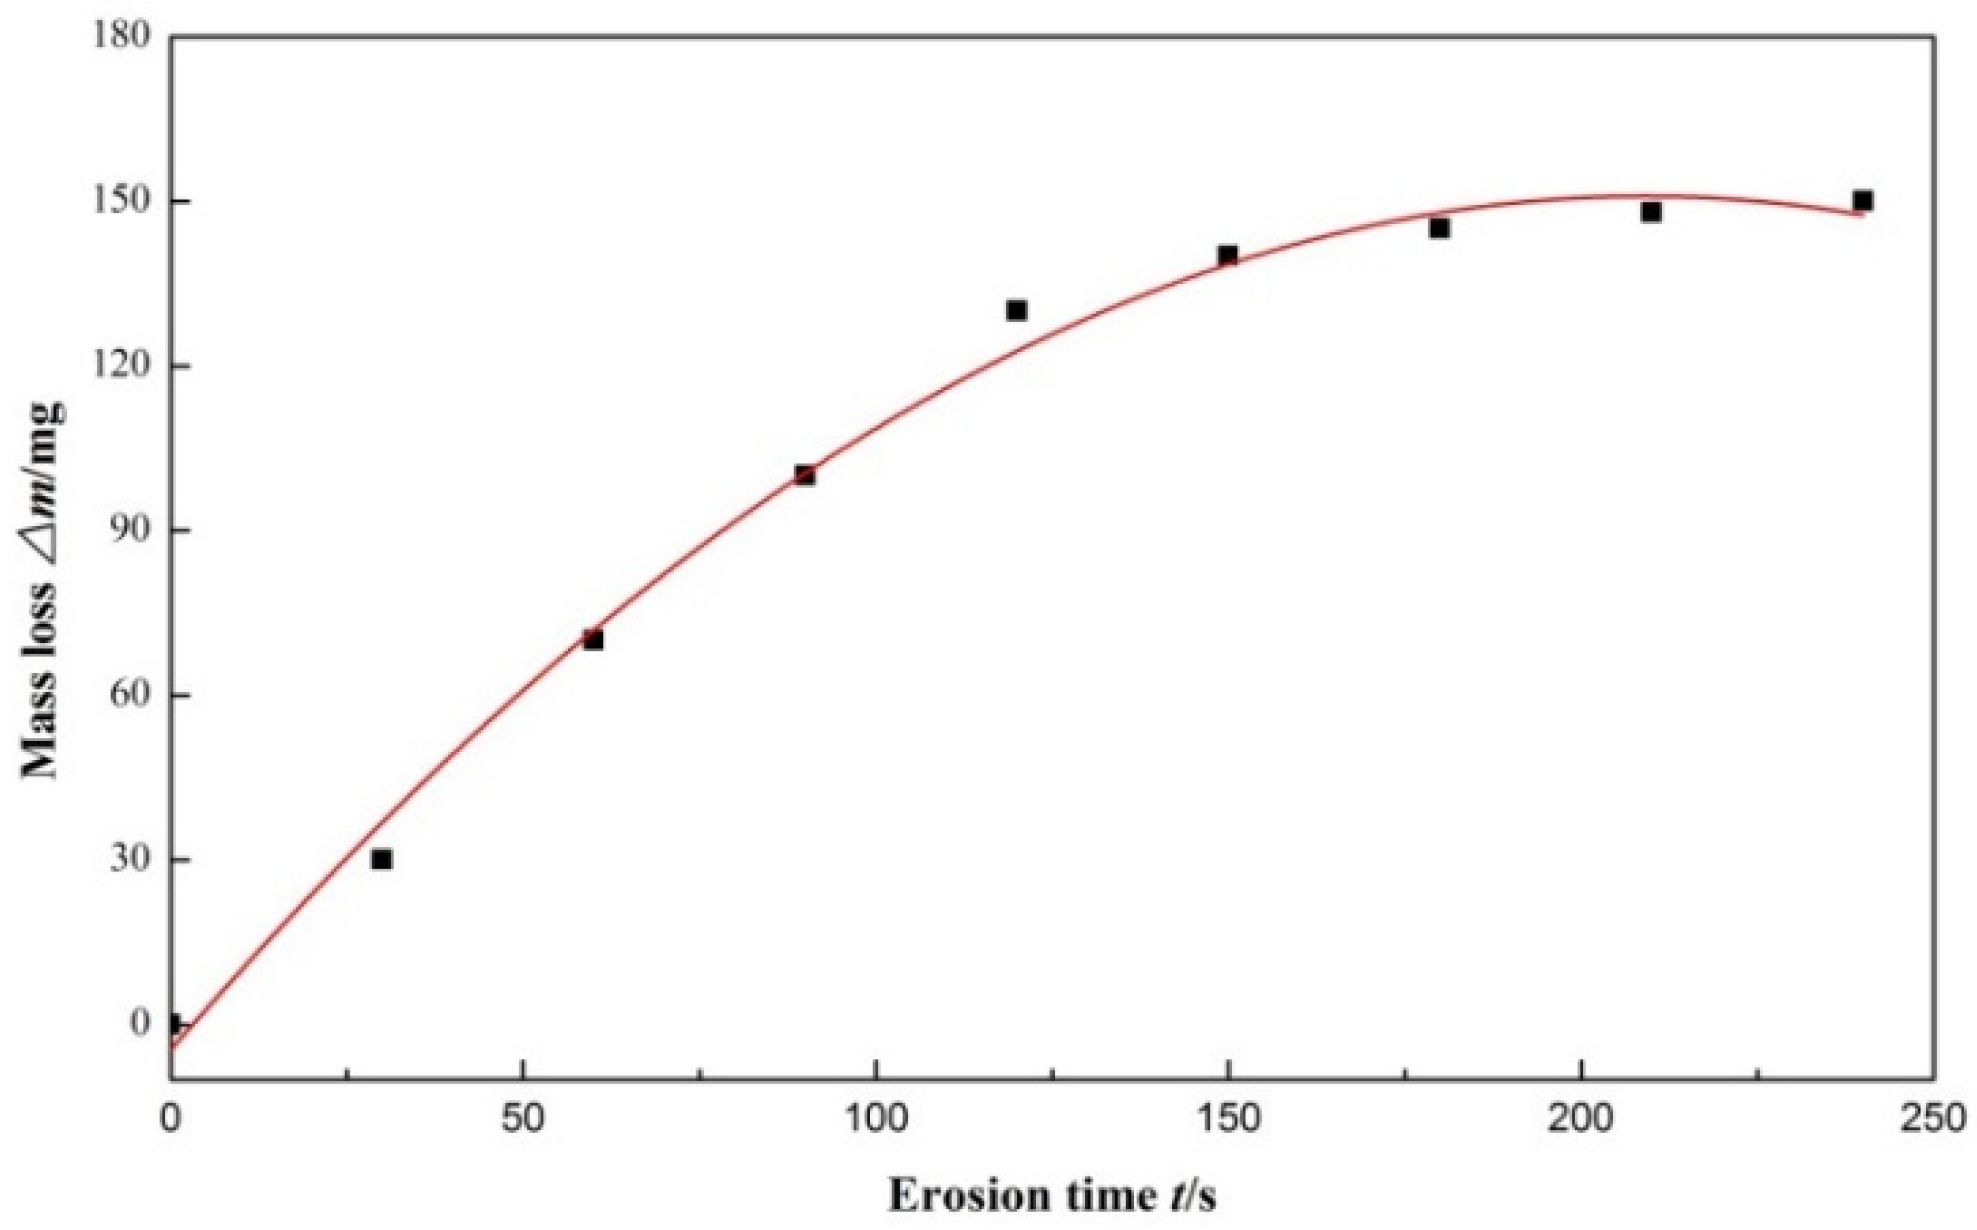
The erosion intensity was evaluated by the mass loss of specimen, Δm, which was defined as the weight of subtracting after and before the test. The mass loss was weighed by an electronic balance with resolution to 0.1 mg. Each erosion test under the same conditions was repeated three times and then the mass loss was averaged in order to reduce the impact of casual factors, thus making the results more reliable. The mass loss changing with time was shown in Figure 3. At the initial stage of erosion, mass loss increased linearly with the increase of erosion time. When the erosion time was higher than 150 s, the mass loss changed little. At this time, increasing the erosion time will only increase the energy consumption. In present study, 180 s was chosen as the erosion time of all tests.

2.3. Numerical Simulation Setup

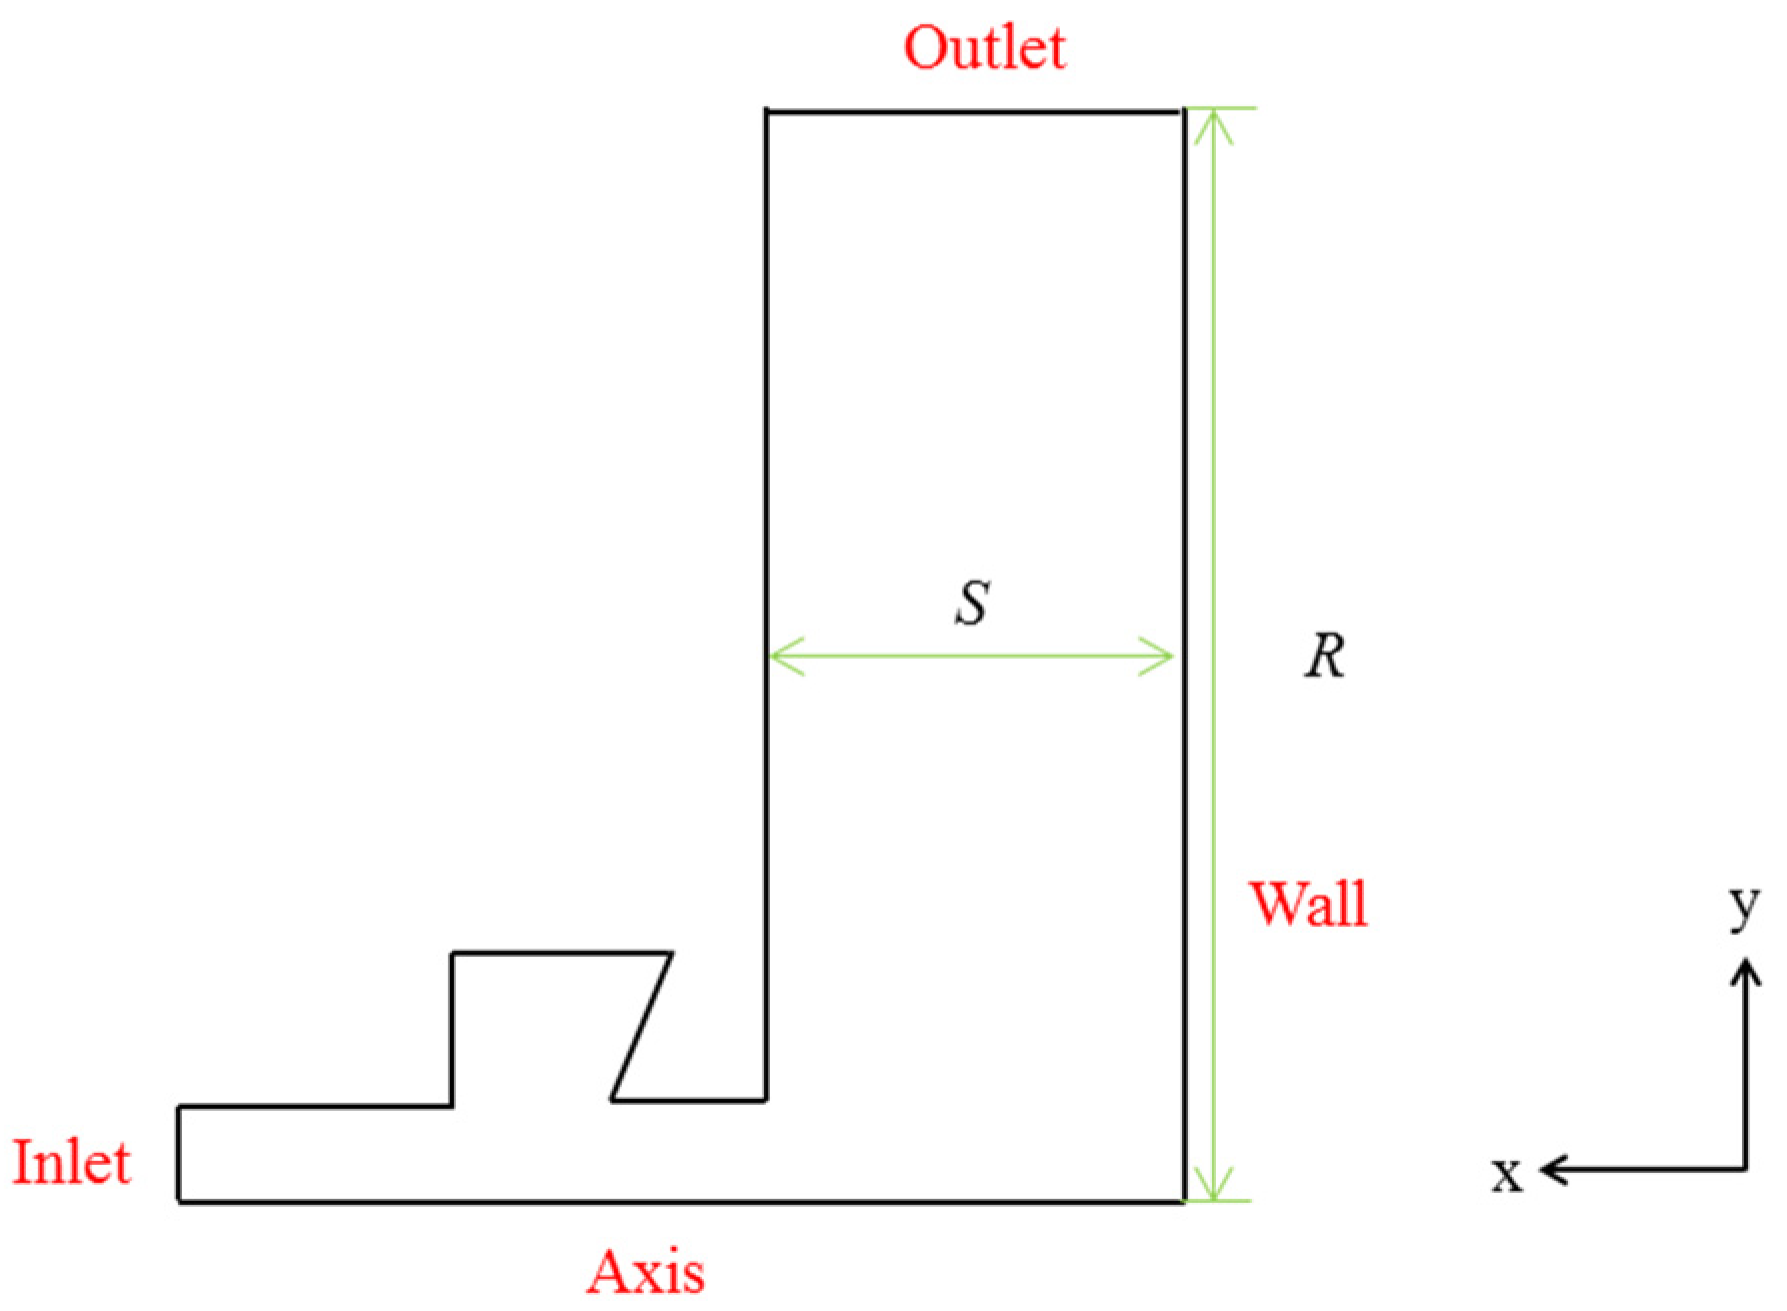
Due to axisymmetric nature of flow and geometry, a two-dimensional analysis is deemed to be suitable for numerical simulation, where the axial direction is x, the radial direction is y. The computational domain is shown in Figure 4 with appropriate boundary conditions. The inlet and outlet are pressure boundaries. The fluid flows through the HSEOW nozzle, and the jets are ejected from the downstream nozzle onto the wall surface, where S is the standoff distance. The radius R of outlet is prolonged to ensure full development.
The flow inside the nozzle was assumed to be unsteady, controlled by the RANS equations together with the continuity equation. RNG k-epsilon model was adopted to govern the turbulence characteristics and the near-wall treatment was left as the standard wall functions. Pressure boundary conditions were applied on the inlet and outlet. ANSYS fluent was employed in the whole simulation works. The governing equations were discretized by the finite volume method and the second order upwind scheme was adopted for spatial discretization of the convection terms. The SIMPLE algorithm was employed to couple the pressure and velocity. The Schnerr–Sauer cavitation model was used to obtain two-phase flow of HSEOW.
The equation of vapor volume fraction has a general form
t ( α v ρ v ) + ( α v ρ v u ) = ρ l ρ v ρ d α v d t
The net quality source terms are
m ˙ = ρ v ρ l ρ d α v d t
The vapor volume fraction and the number of bubbles per unit volume are combined by Equation (2)
α v = n 4 3 π R b 3 1 + n 4 3 π R b 3
The following expression is derived
m ˙ = ρ v ρ l ρ 3 α v ( 1 α v ) R B 2 3 ( p v p ρ l )
R b = ( α v 1 α v 3 4 π 1 n ) 1 3
Equation (1) is adopted to simulate the final form of the condensation process model.
If ppv,
m ˙ + = ρ v ρ l ρ α v ( 1 α v ) 3 R b 2 3 ( p v p ρ l )
m ˙ = ρ v ρ l ρ α v ( 1 α v ) 3 R b 2 3 ( p p v ρ l )
Its source item is usually written as
m ˙ + = ρ v ρ l ρ α v ( 1 α v ) 3 R b 2 3 max ( p v p , 0 ) ρ l
m ˙ = ρ v ρ l ρ α v ( 1 α v ) 3 R b 2 3 max ( p p v , 0 ) ρ l
Bubble radius Rb is related to vapor volume fraction αv and bubble number density Nb, where Nb equals 1013.
R b = ( α v 1 α v 3 4 π 1 N b ) 1 / 3
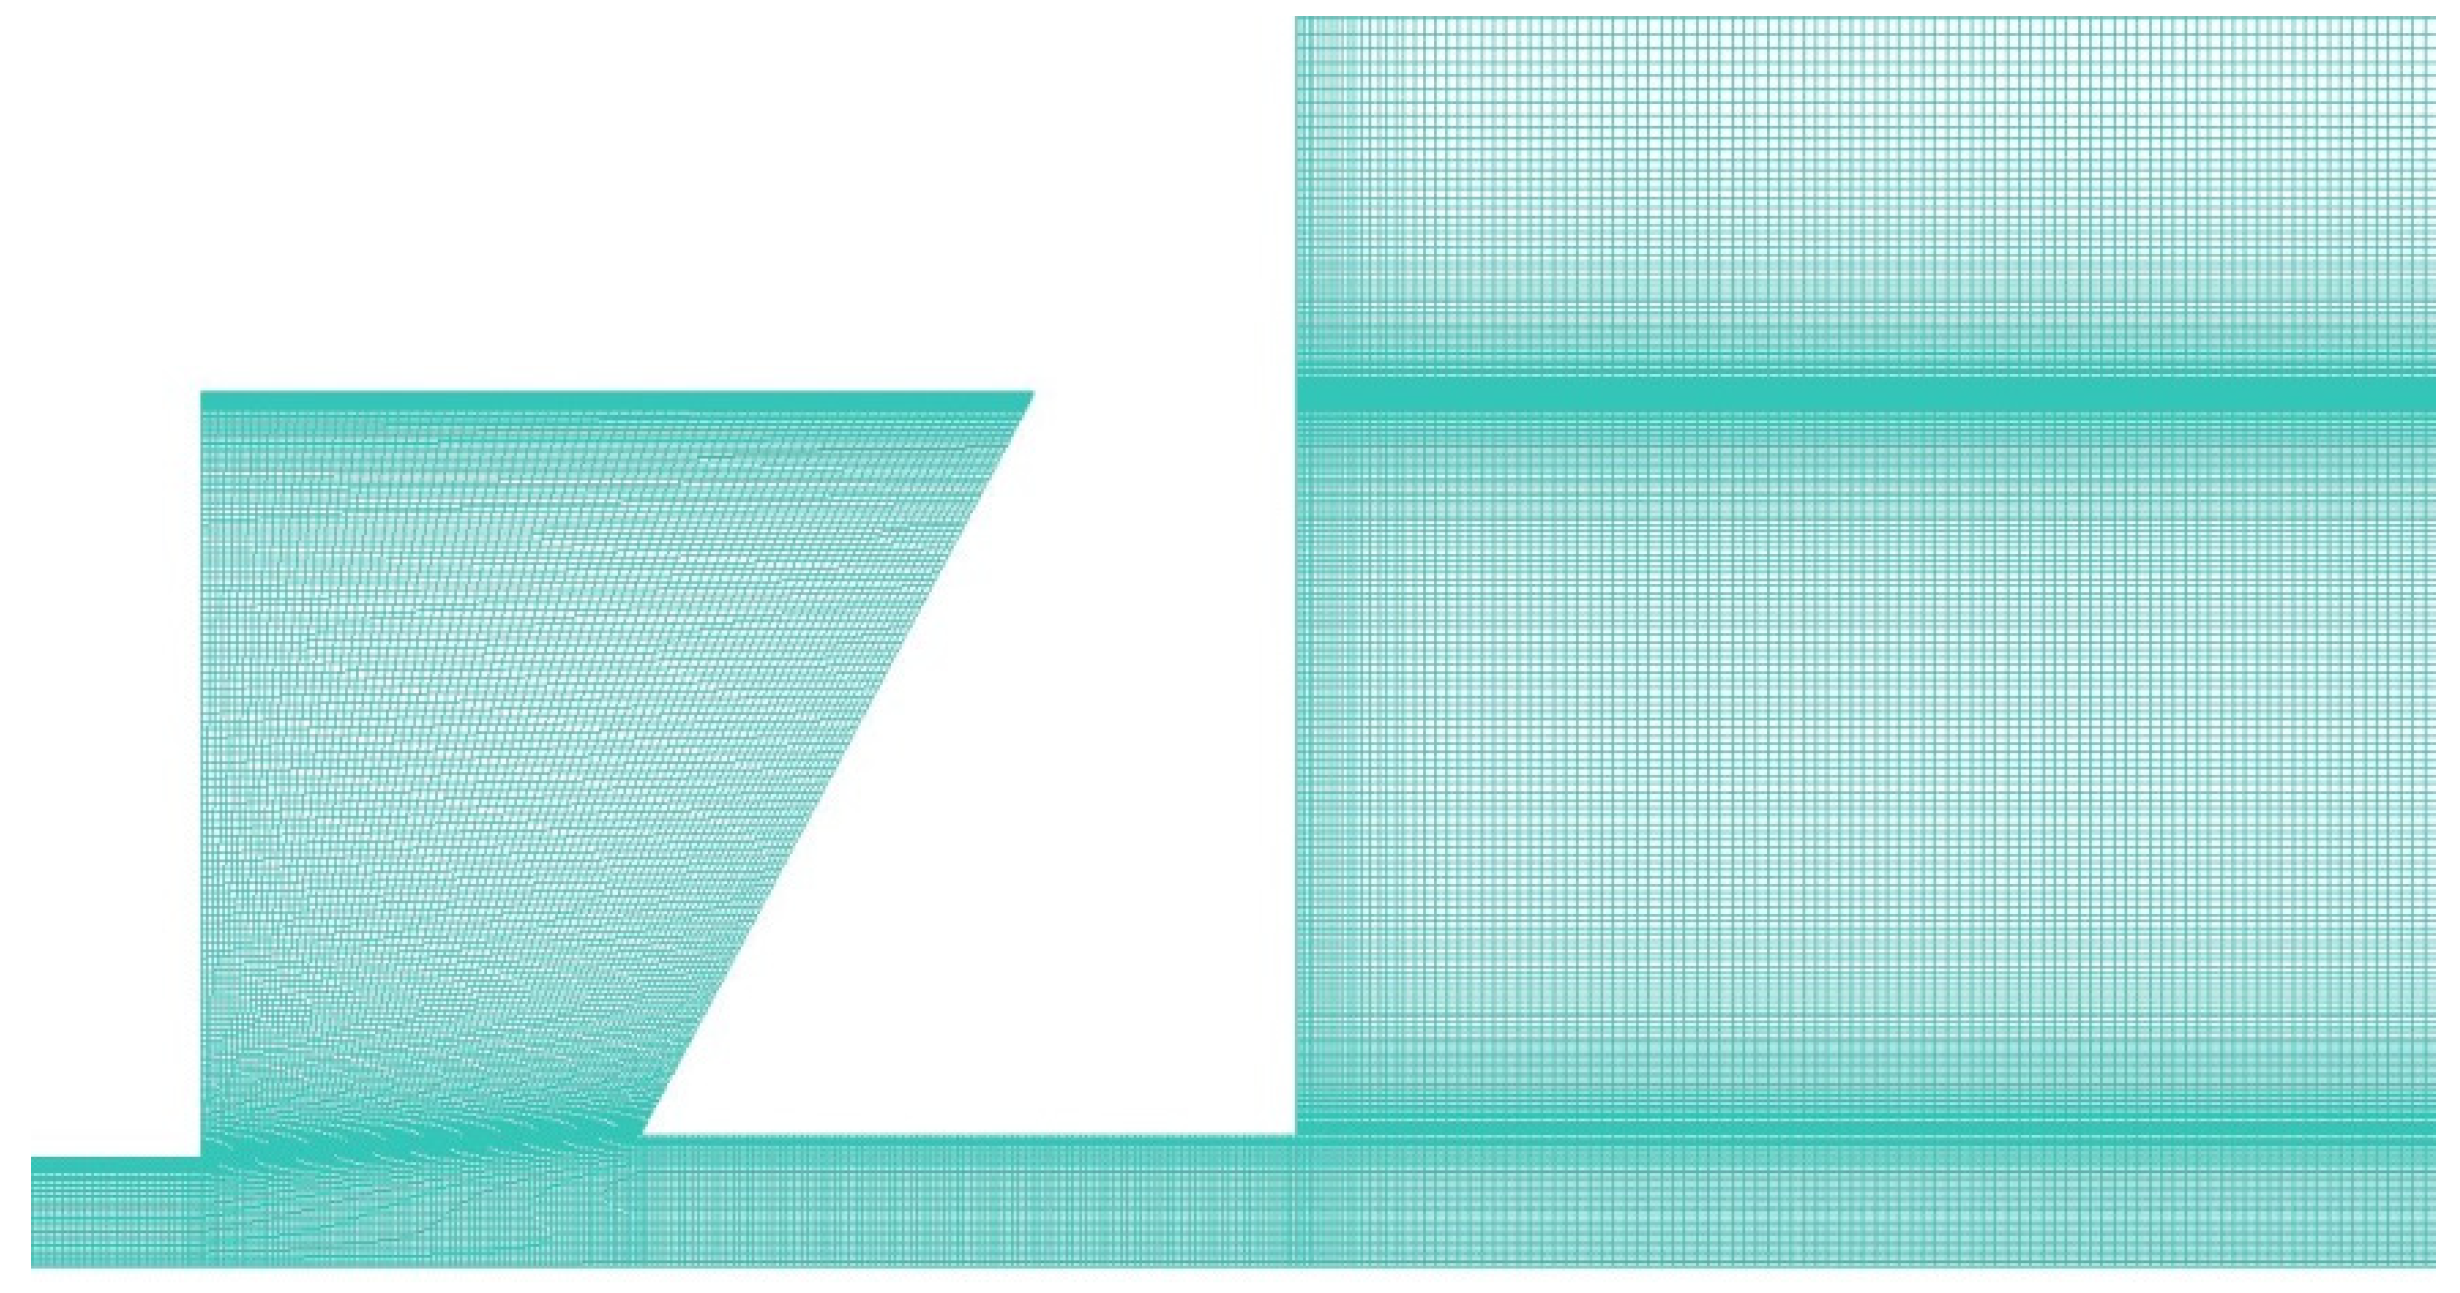
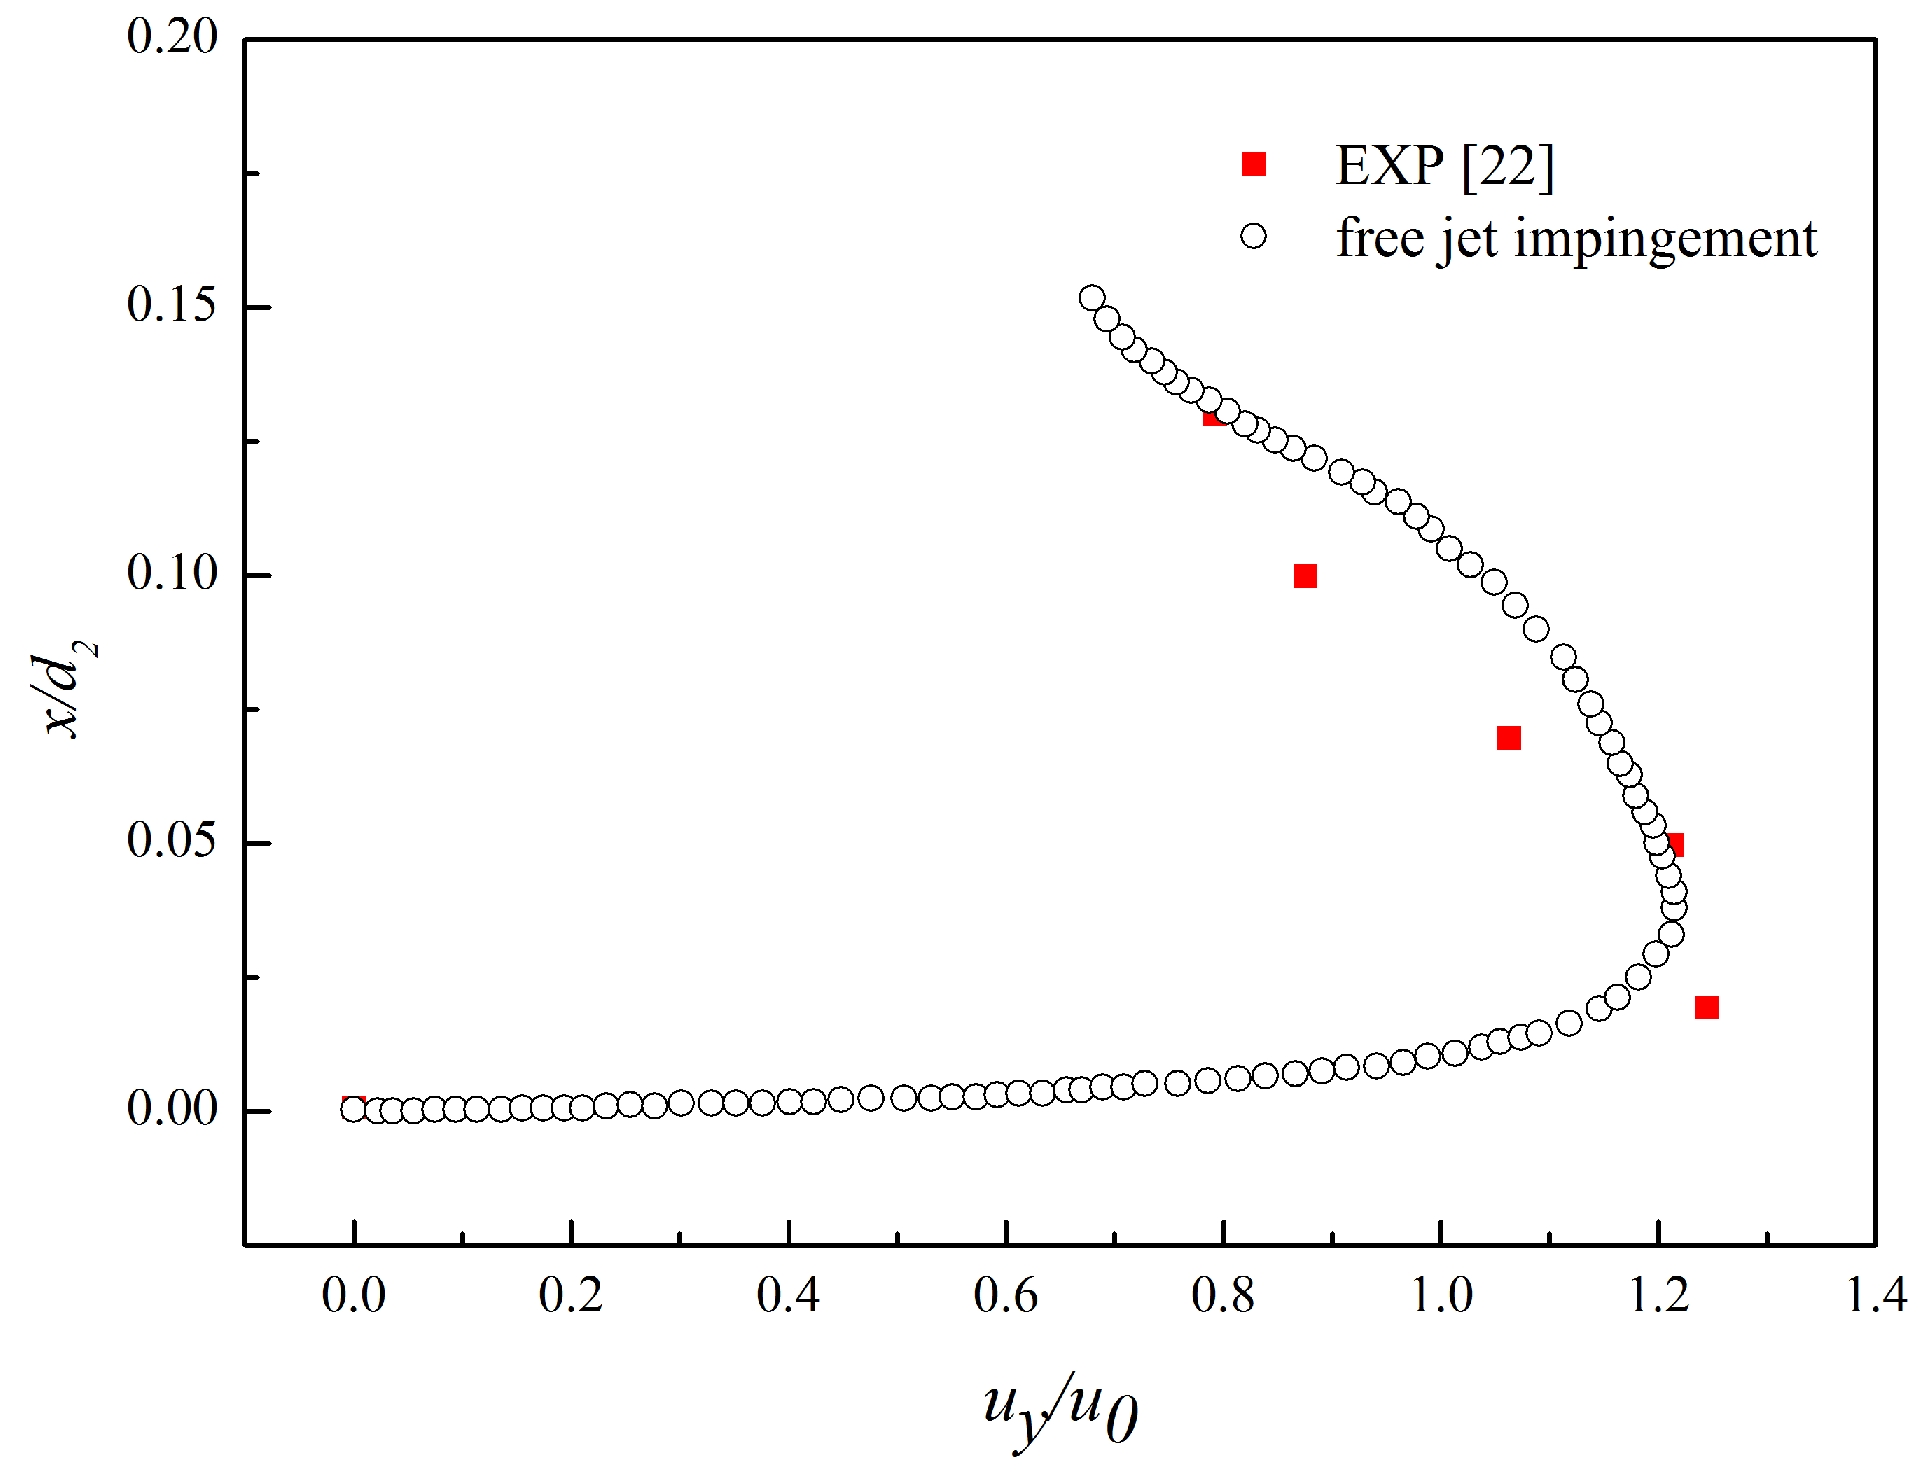
The structured grid was used to discretize the computation domain by commercial software ICEM, and grid refinement was adopted in the area near the wall and inside the chamber, as shown in Figure 5. The free jet impingement calculated by RNG k-epsilon is compared with the experimental values by Stevens and Webb [22] in Figure 6. The mesh independency was proven in Table 4, which indicated that the average velocity of the medium and fine resolution meshes at nozzle outlet is nearly the same. The medium mesh was selected as final grid, which was about 91,000 cells.

3. Results and Discussion

3.1. Velocity Distribution

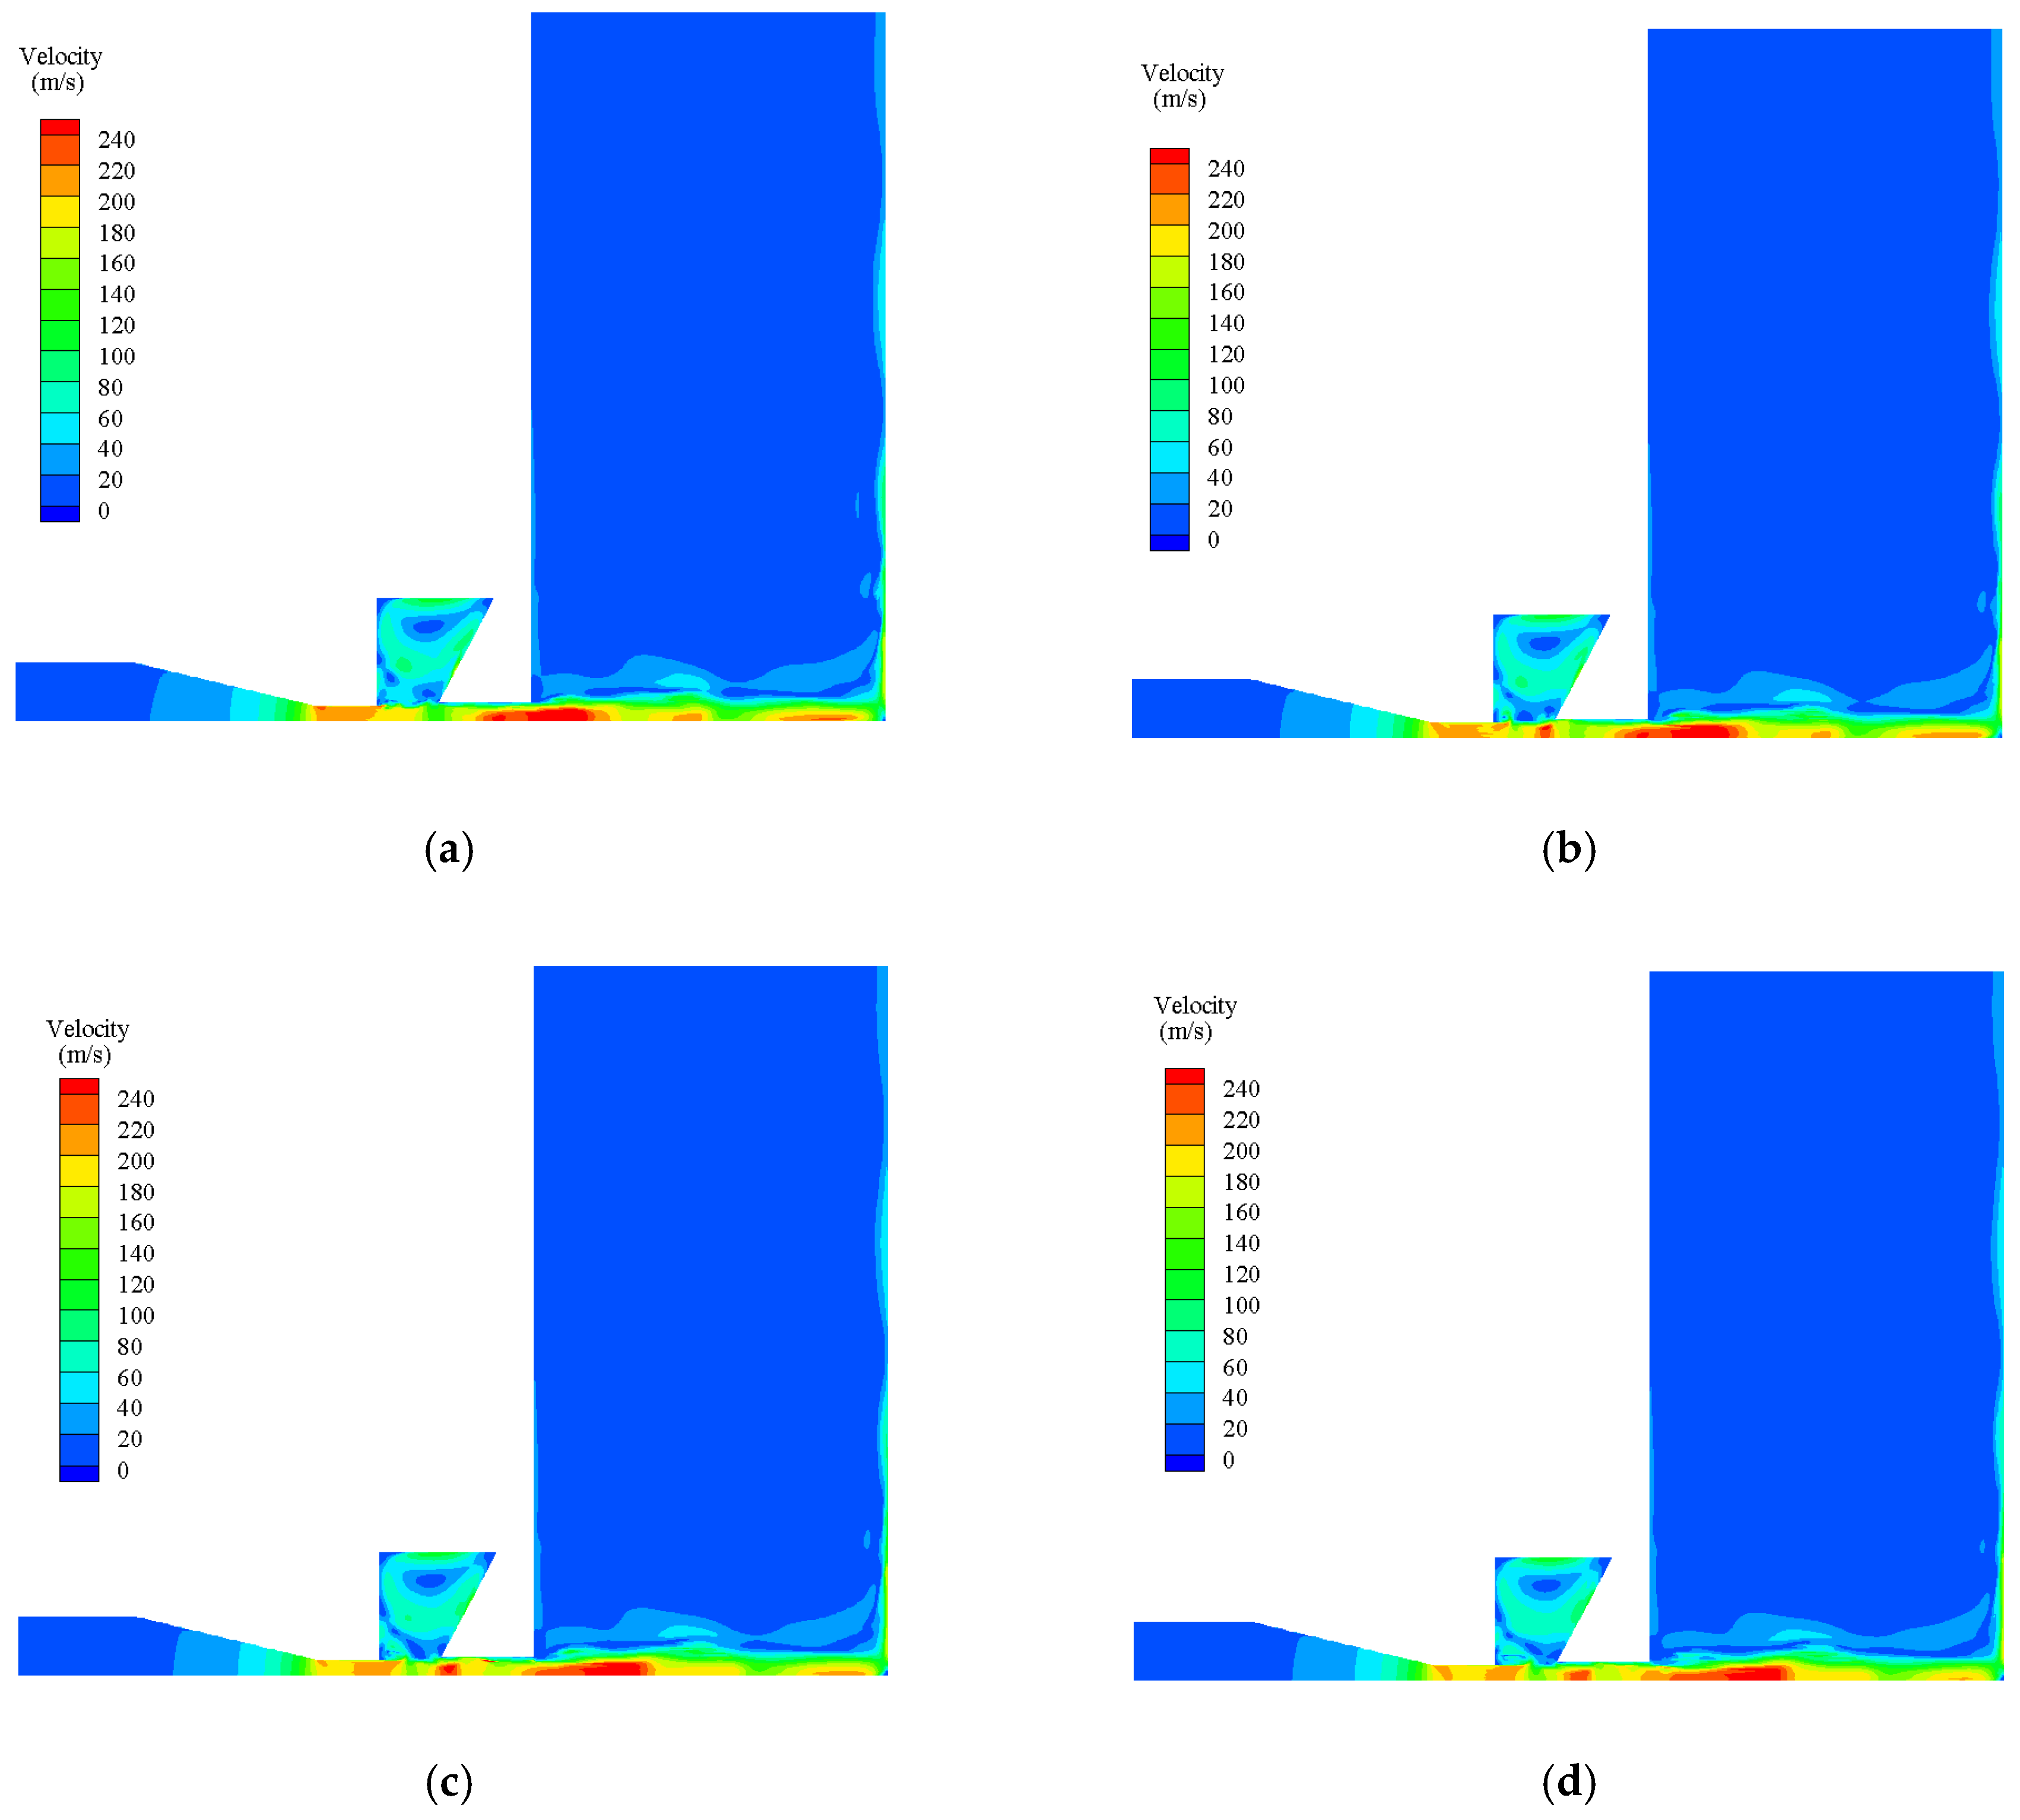
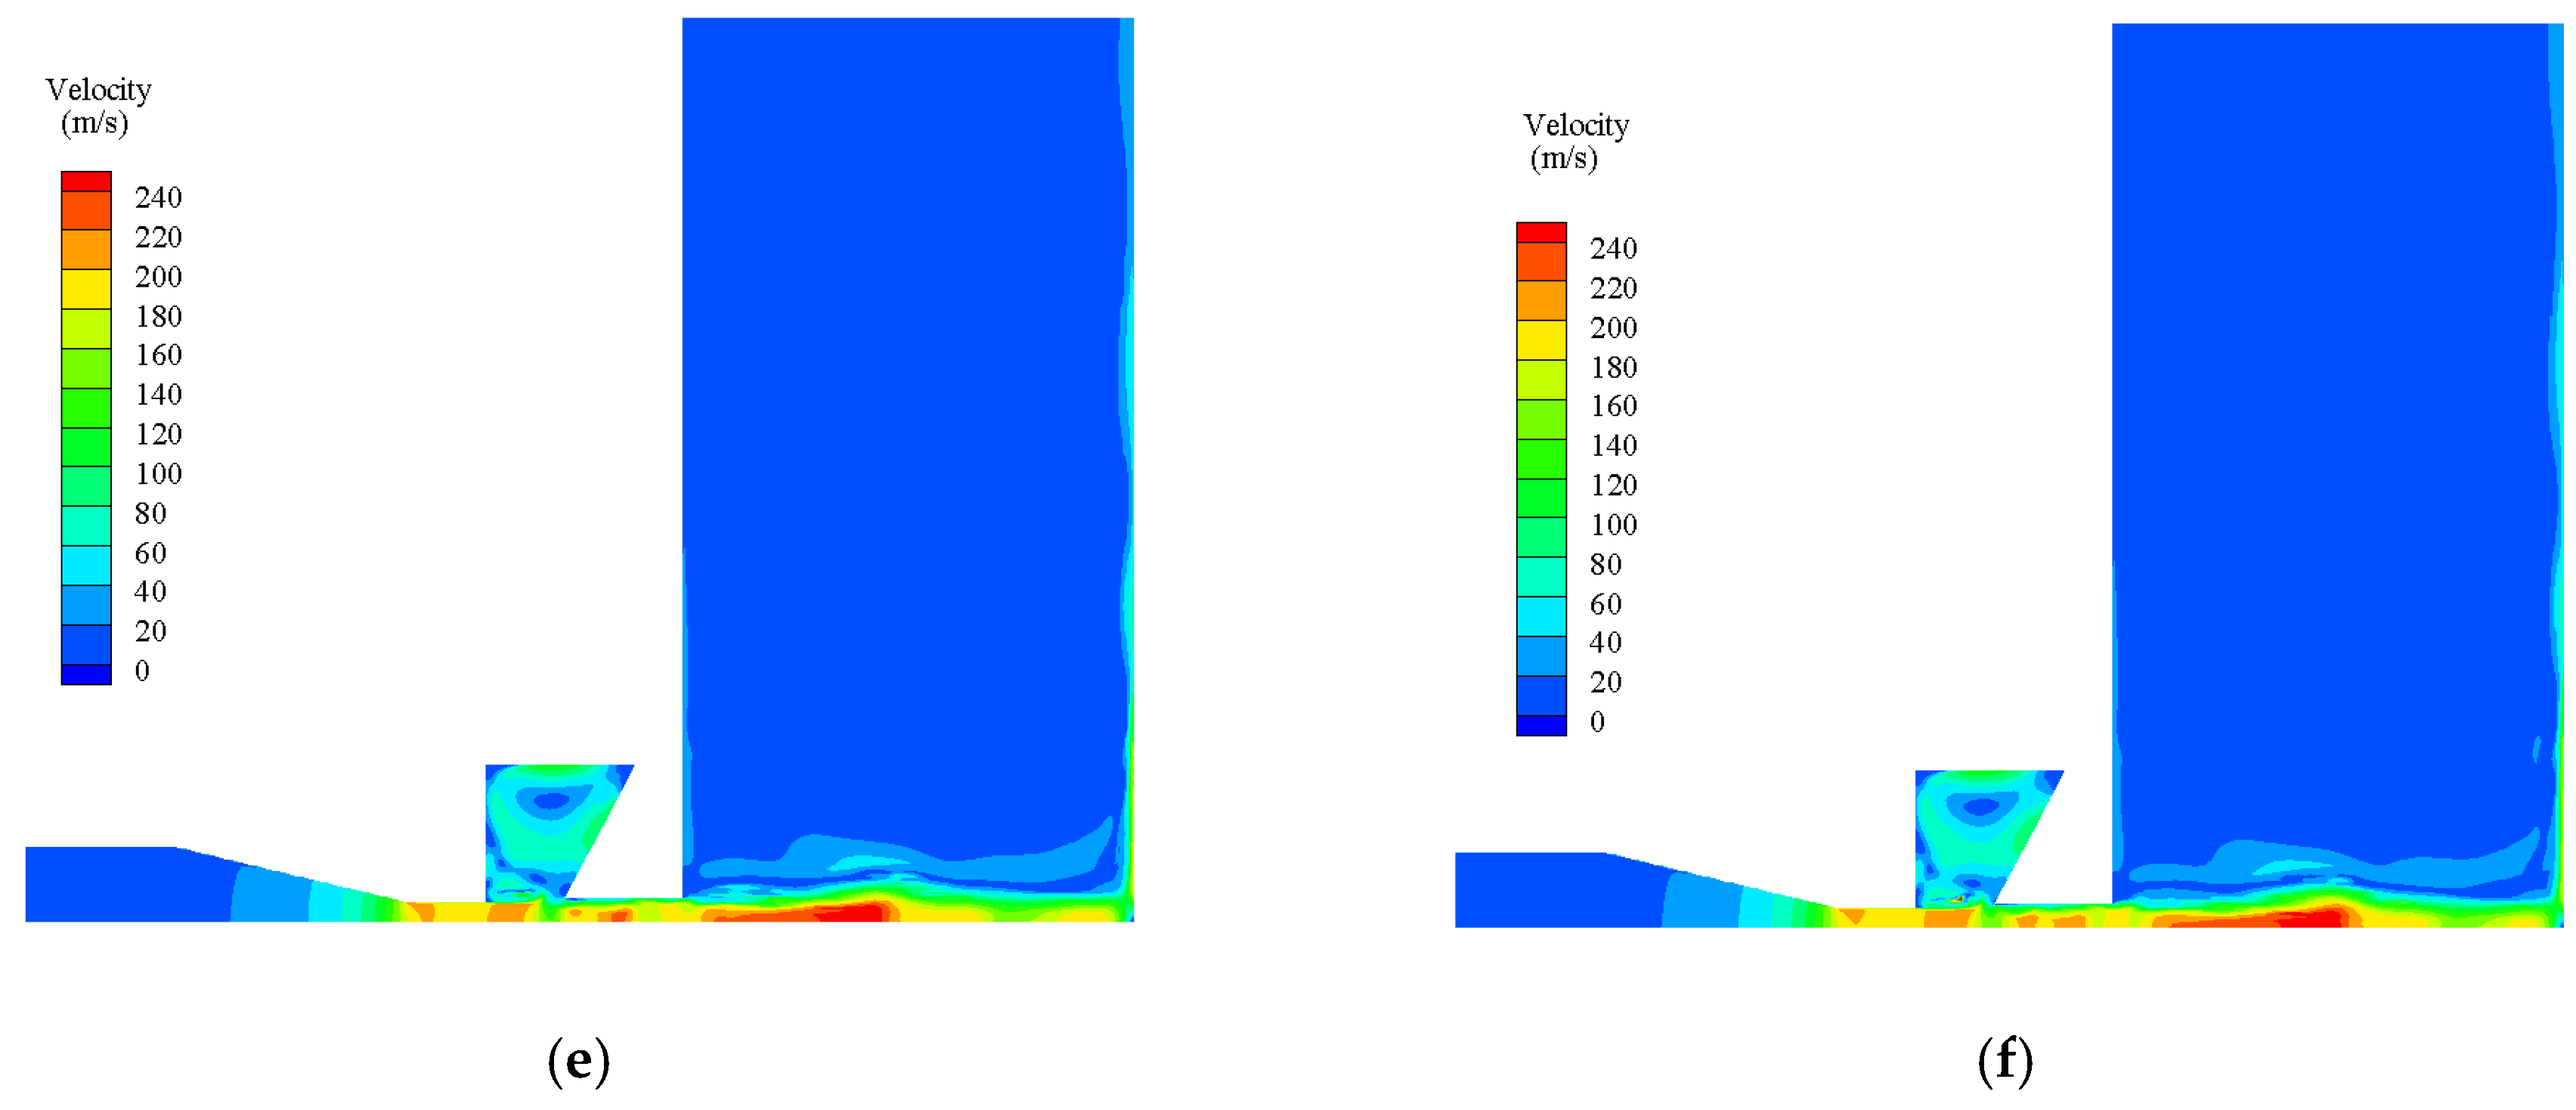
Figure 7 shows the time evolution of the velocity contour. The velocity field inside the chamber is a series of water slugs which is quite different from uniform flow field of continuous jets. The jets flow through the Helmholtz oscillator, forming pressure feedback and backflow vortex on both sides of the cavity. The pressure pulsates as water flows from the downstream nozzle. The maximum velocity reached as high as 1.4 times of inlet velocity. When the jet acts on the target through a certain target distance, its kinetic energy converts into pressure energy, thus the axial velocity gradually drops to 0, and the flow turns to radial distribution along the wall.
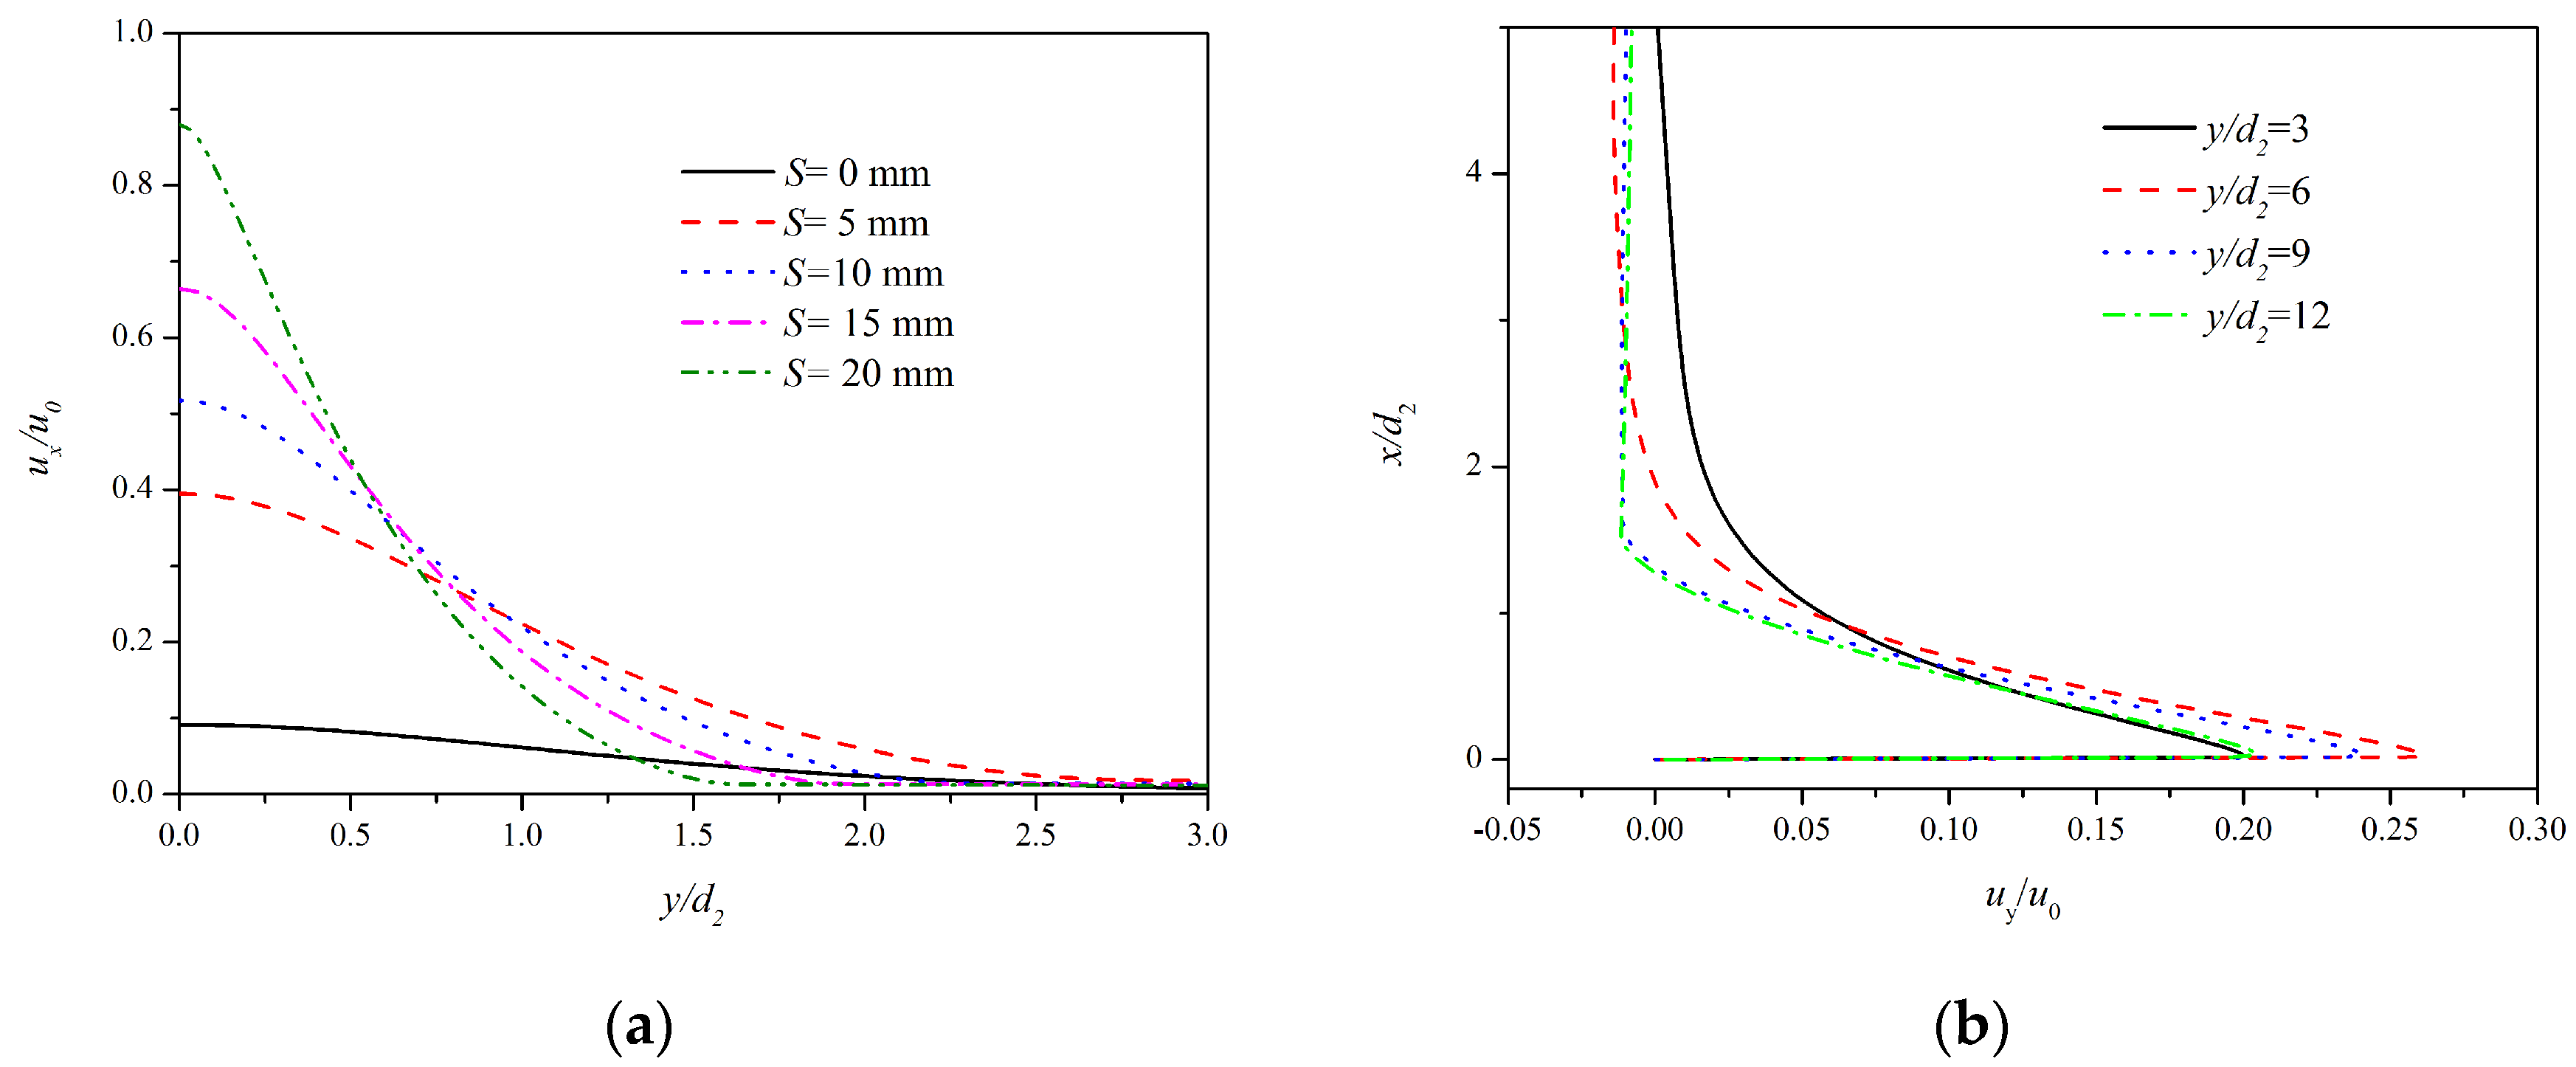
The mean velocity distributions are shown in Figure 8 when Lc/d1 = 2, Dc/d1 = 8, α = 120°, Po = 20 MPa. Figure 8a shows the non-dimensional velocity magnitude at different axial locations. The velocity at jet axis gradually attenuates along the direction of jet flow. When it reaches the wall surface (S = 0 mm), velocity near the wall drops sharply because of the shear layer, so the non-dimensional axial velocity is about 0.09 and the influence radius of the jet increases to 3.0d2. Figure 8b shows the non-dimensional velocity magnitude at different radial locations. At the radial direction, as the jets diffuse along the wall, the velocity decreases gradually. The velocity decreases rapidly near the wall due to shear layer effect. The further away from the jet axis, the faster the velocity decreases. When the radial distance is about 9d2, there is no change in velocity.

3.2. Erosion Pattern on Specimen Surface

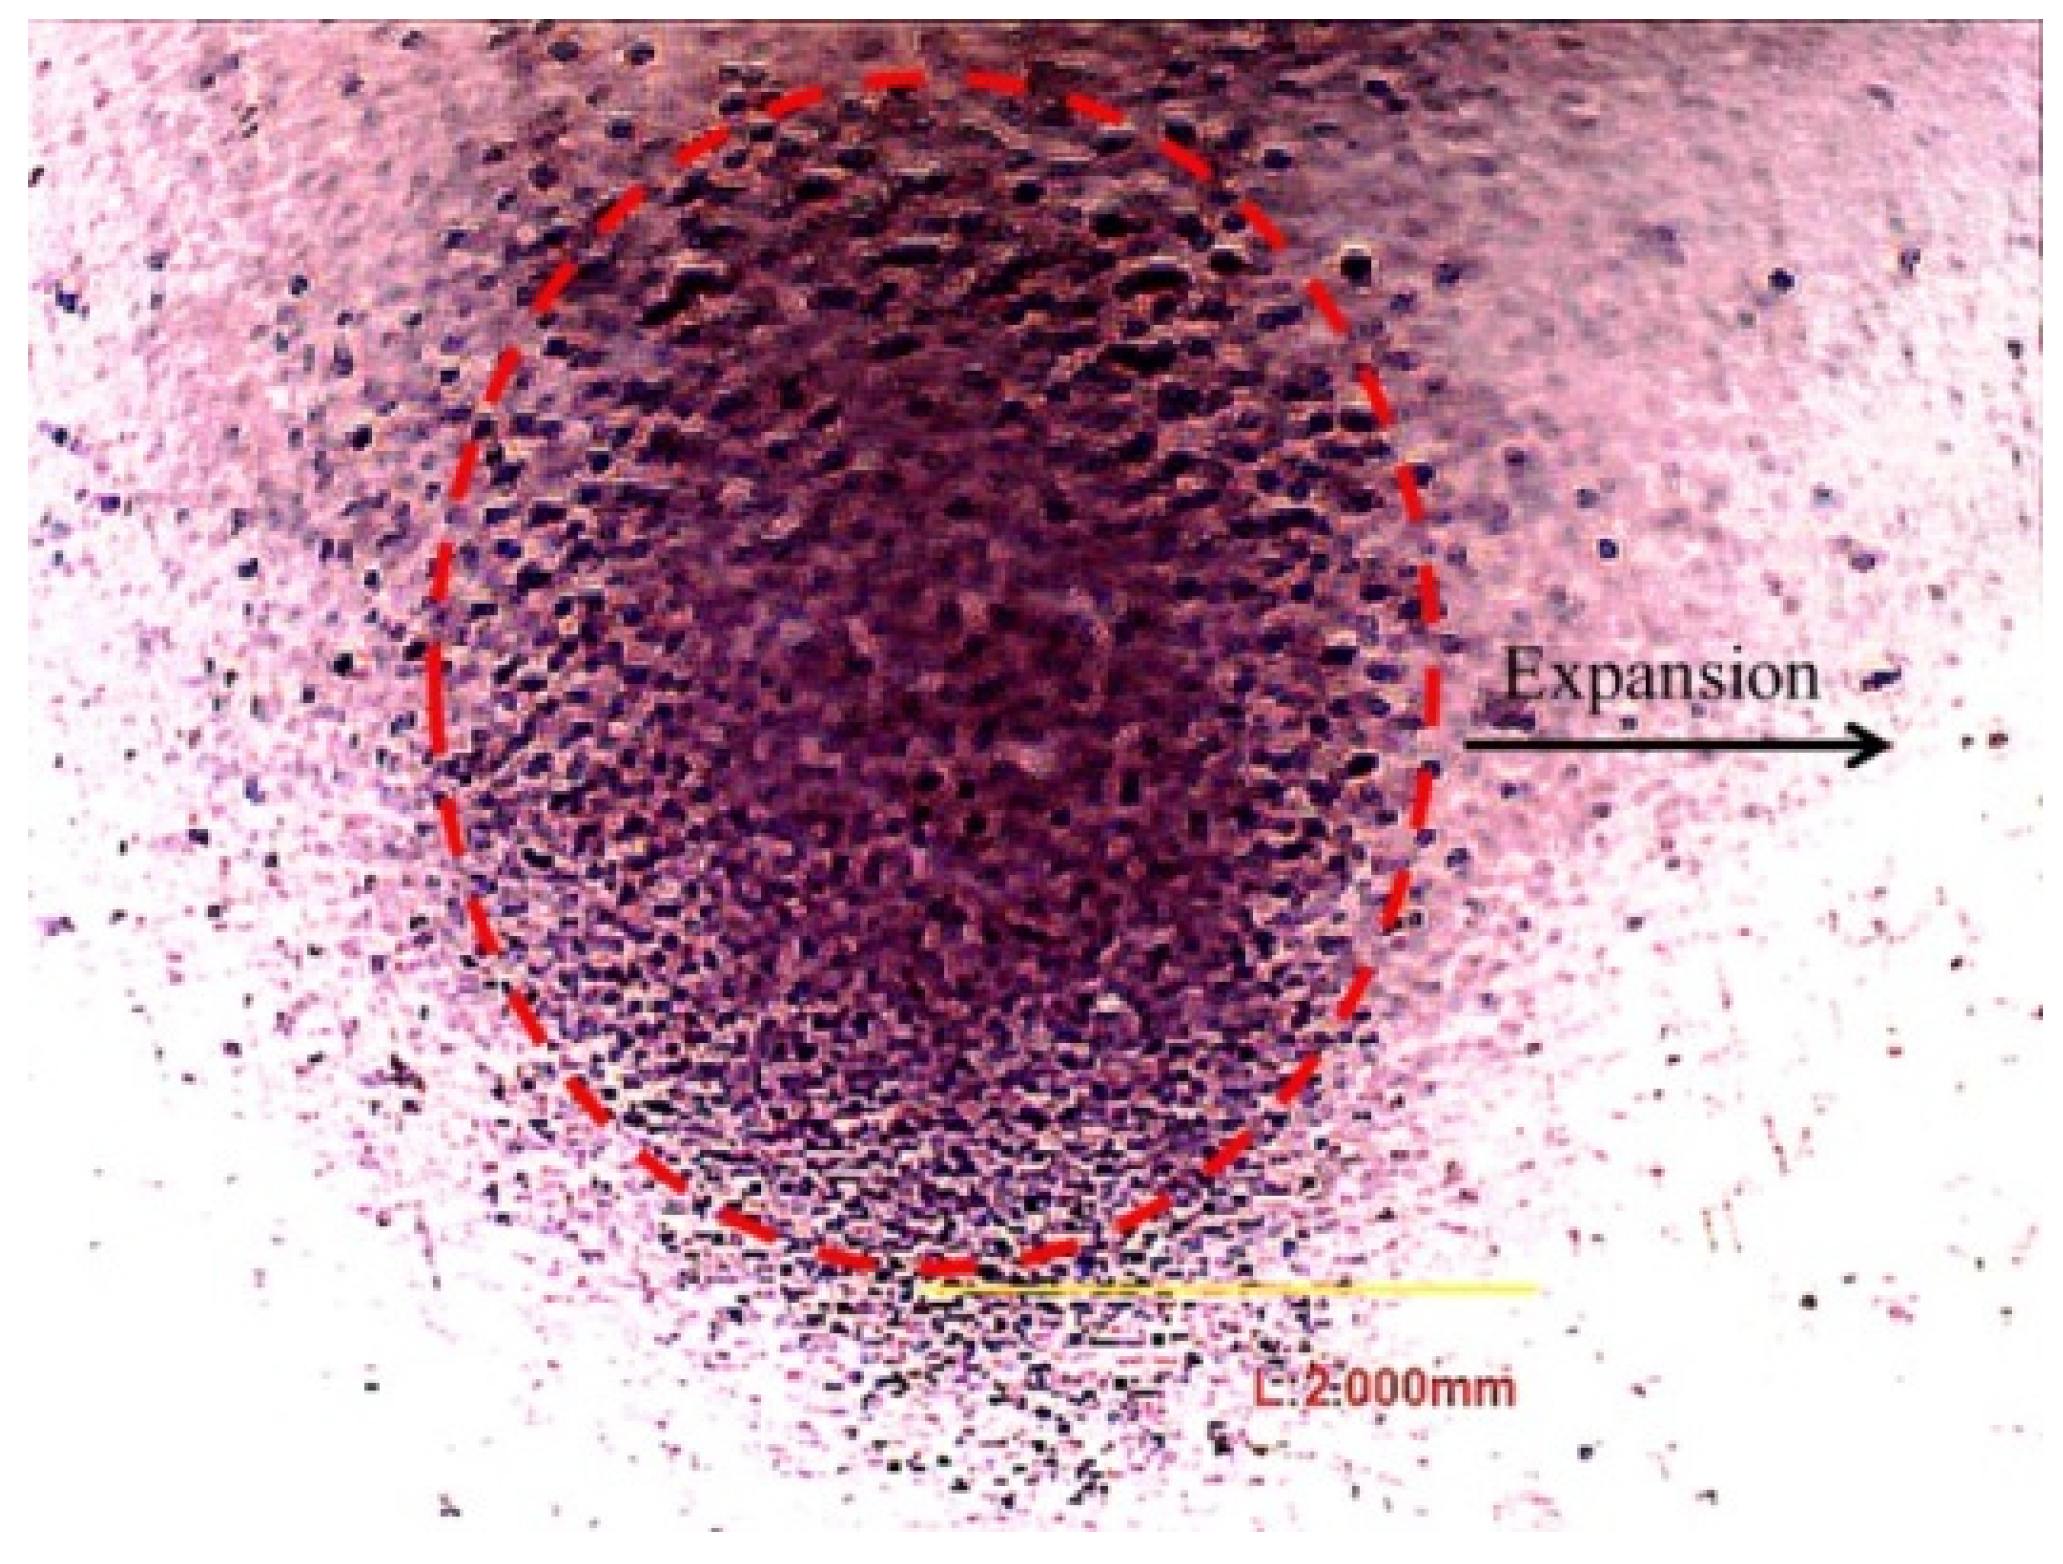
The cavitation damage caused by the HSEOW nozzle on the specimen was mainly the jet cavitation cloud under submerged conditions (see Figure 9) [23,24]. The circular honeycomb dense holes took shape in a radial distribution near the center. The core area of jets was concentrated in the circular area at the center, and the bubble cloud carried by jets collapsed on the target surface. Numerous dense micro-jets repeatedly impacted on the surface so that dense holes were formed. In the vicinity of the central region, the damage was distributed radially due to the stress wave effect. The density of holes and the damage intensity weakened with the increase of distance.
There was cavitation inside the Helmholtz cavity, which also had a great impact on outflow field of the jets [25]. The effects of submerged and non-submerged jets on the specimens were quite different. When the bubble cloud of the non-submerged jets inside the cavity entered into the atmosphere with the jet flow, it collapsed quickly due to the effect of atmosphere pressure. When HSEOW jets flowed into the submerged environment, a strong cavitation effect would be produced. The variations of working parameters and structural parameters affected the flow characteristics and working performance of the cavitation jets [26,27,28].
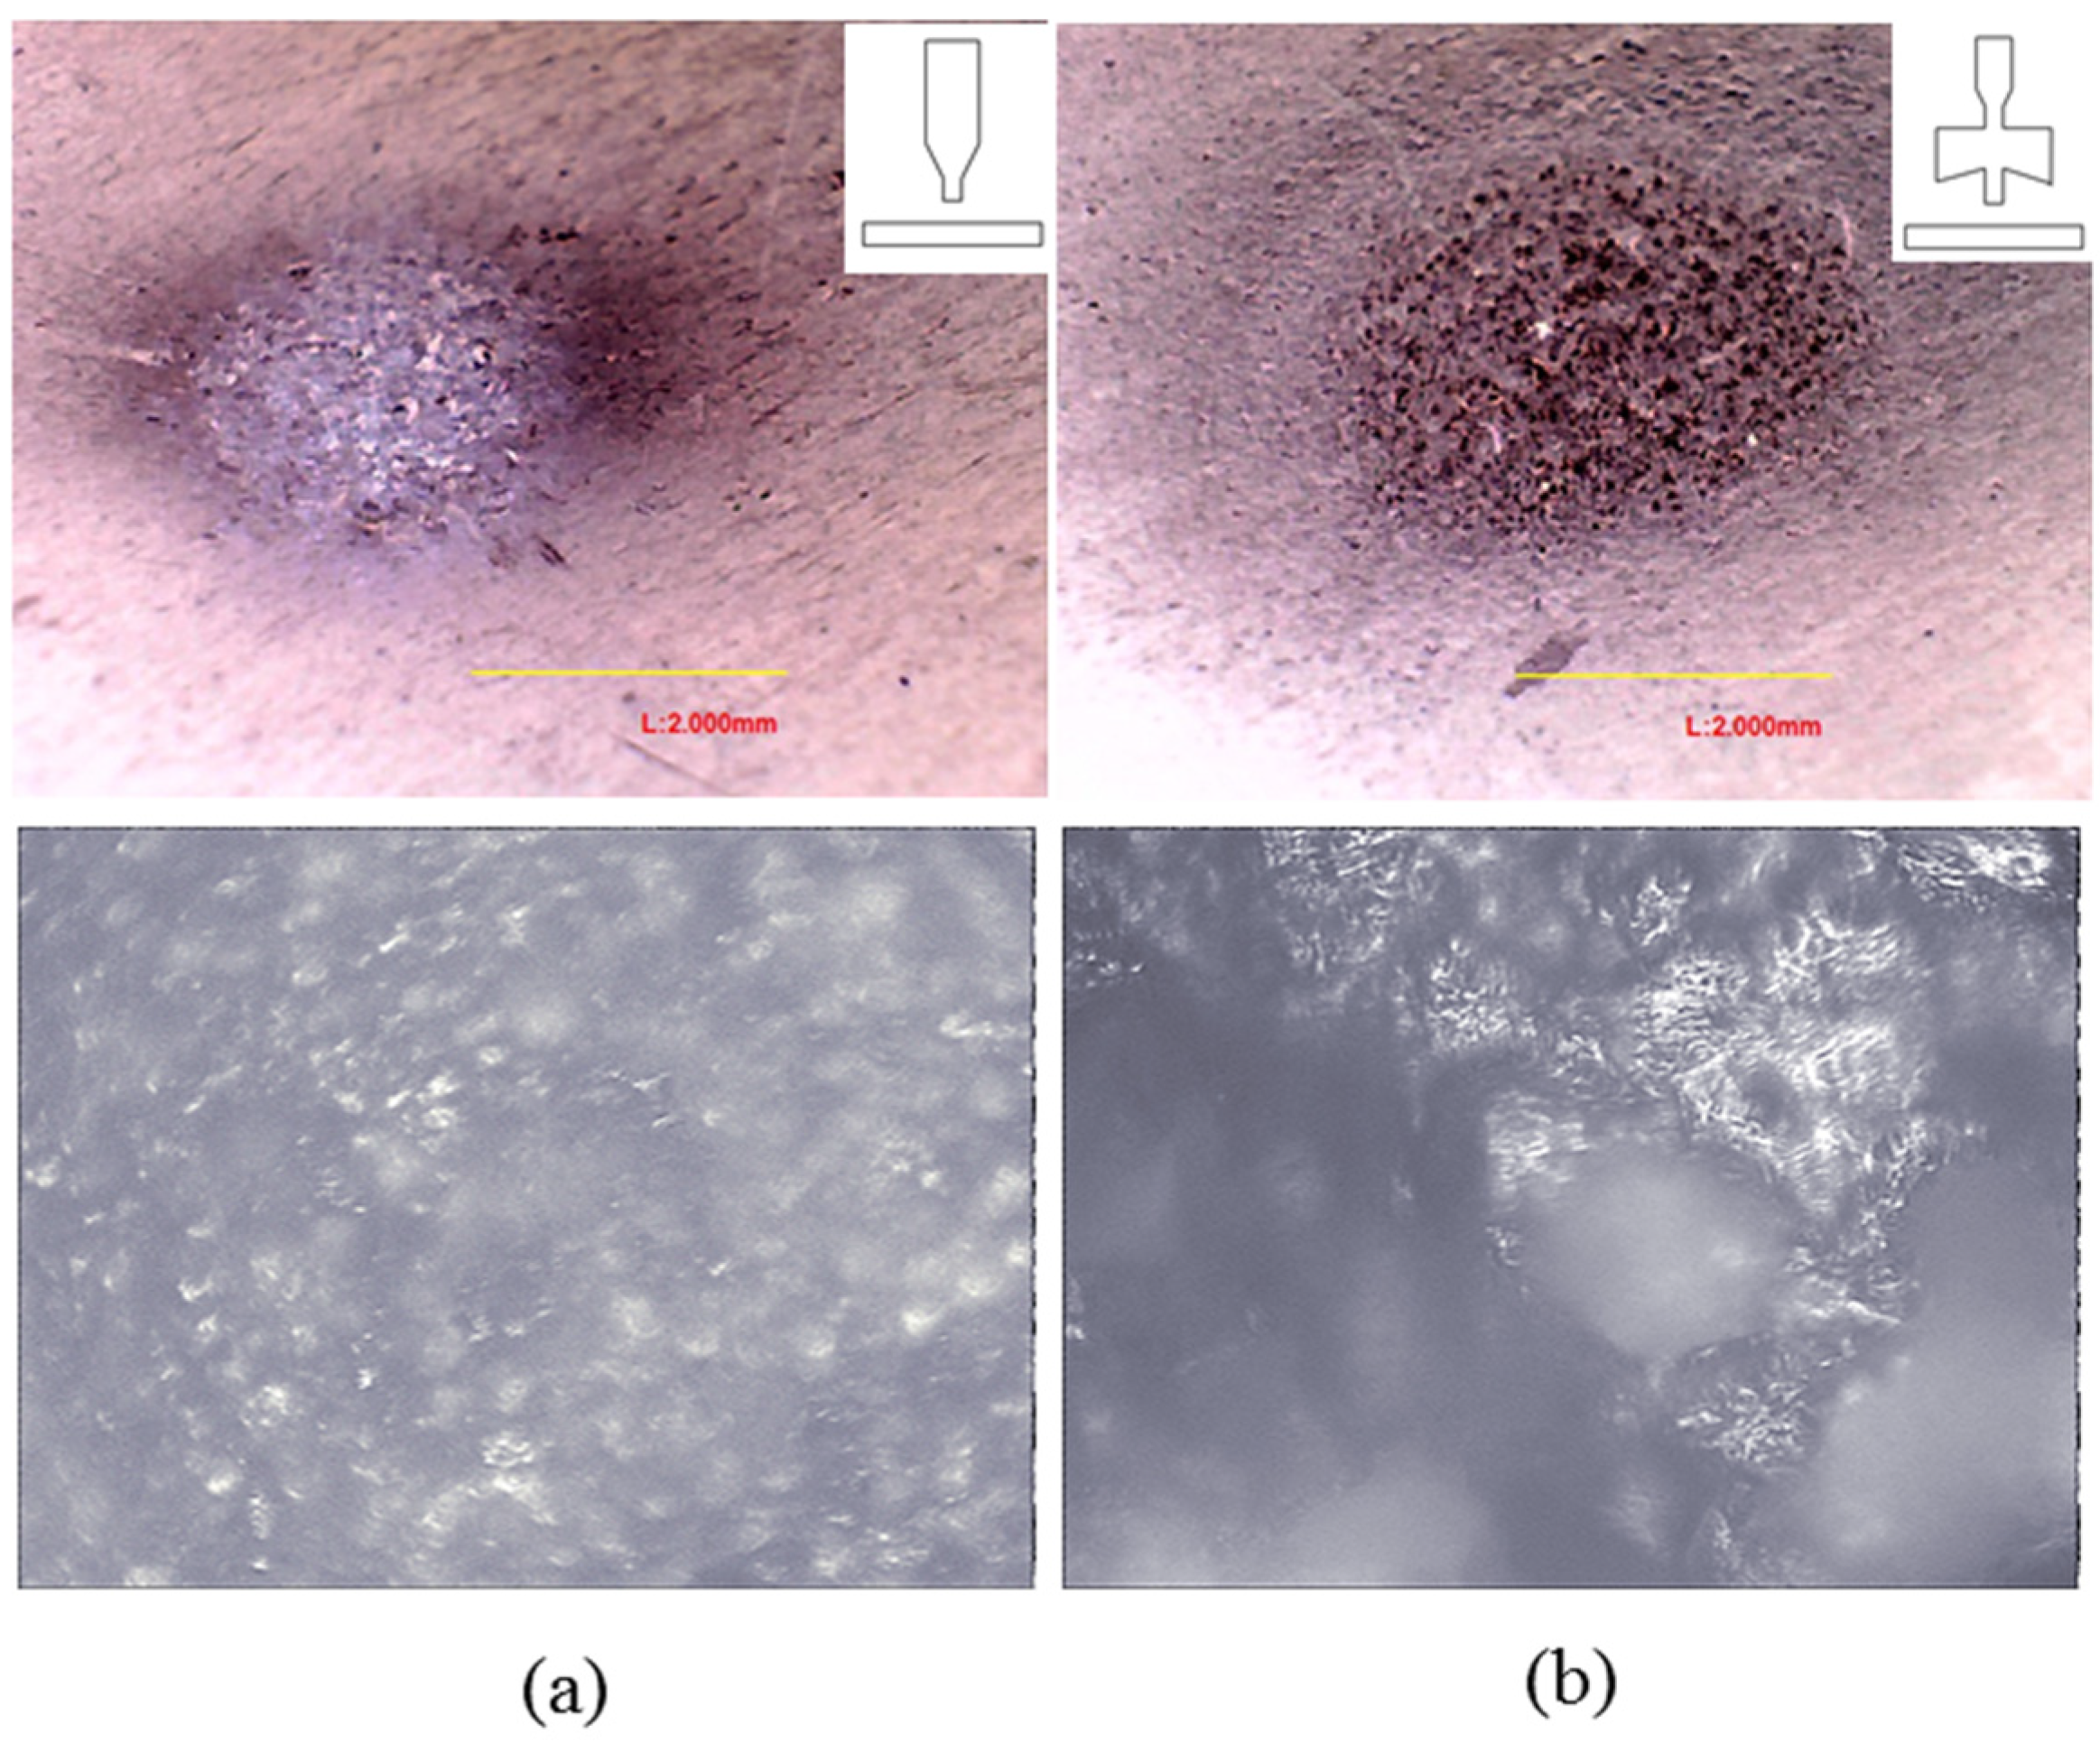
When Lc/d1 = 4, Dc/d1 = 12, α = 120°, Po = 10 MPa, comparison of erosion results between conical nozzle and HSEOW nozzle is shown in Figure 10. In addition to the impact of high-pressure water flow, the specimen destruction of submerged jets was also affected by the erosion of cavitation. Under the same conditions, the cavitation effect produced by the HSEOW nozzle had a much greater destructive effect than that of conical nozzle. At the same time, it also showed that cavitation was the major factor in the destructive mechanism of the target. The 400-times magnification, photos also indicated that the surface appearance hit by HSEOW nozzle was quite different from that of conical nozzle. Pulsed nozzles could form large pits due to strong cavitation, while conical nozzles had relatively uniform surfaces.
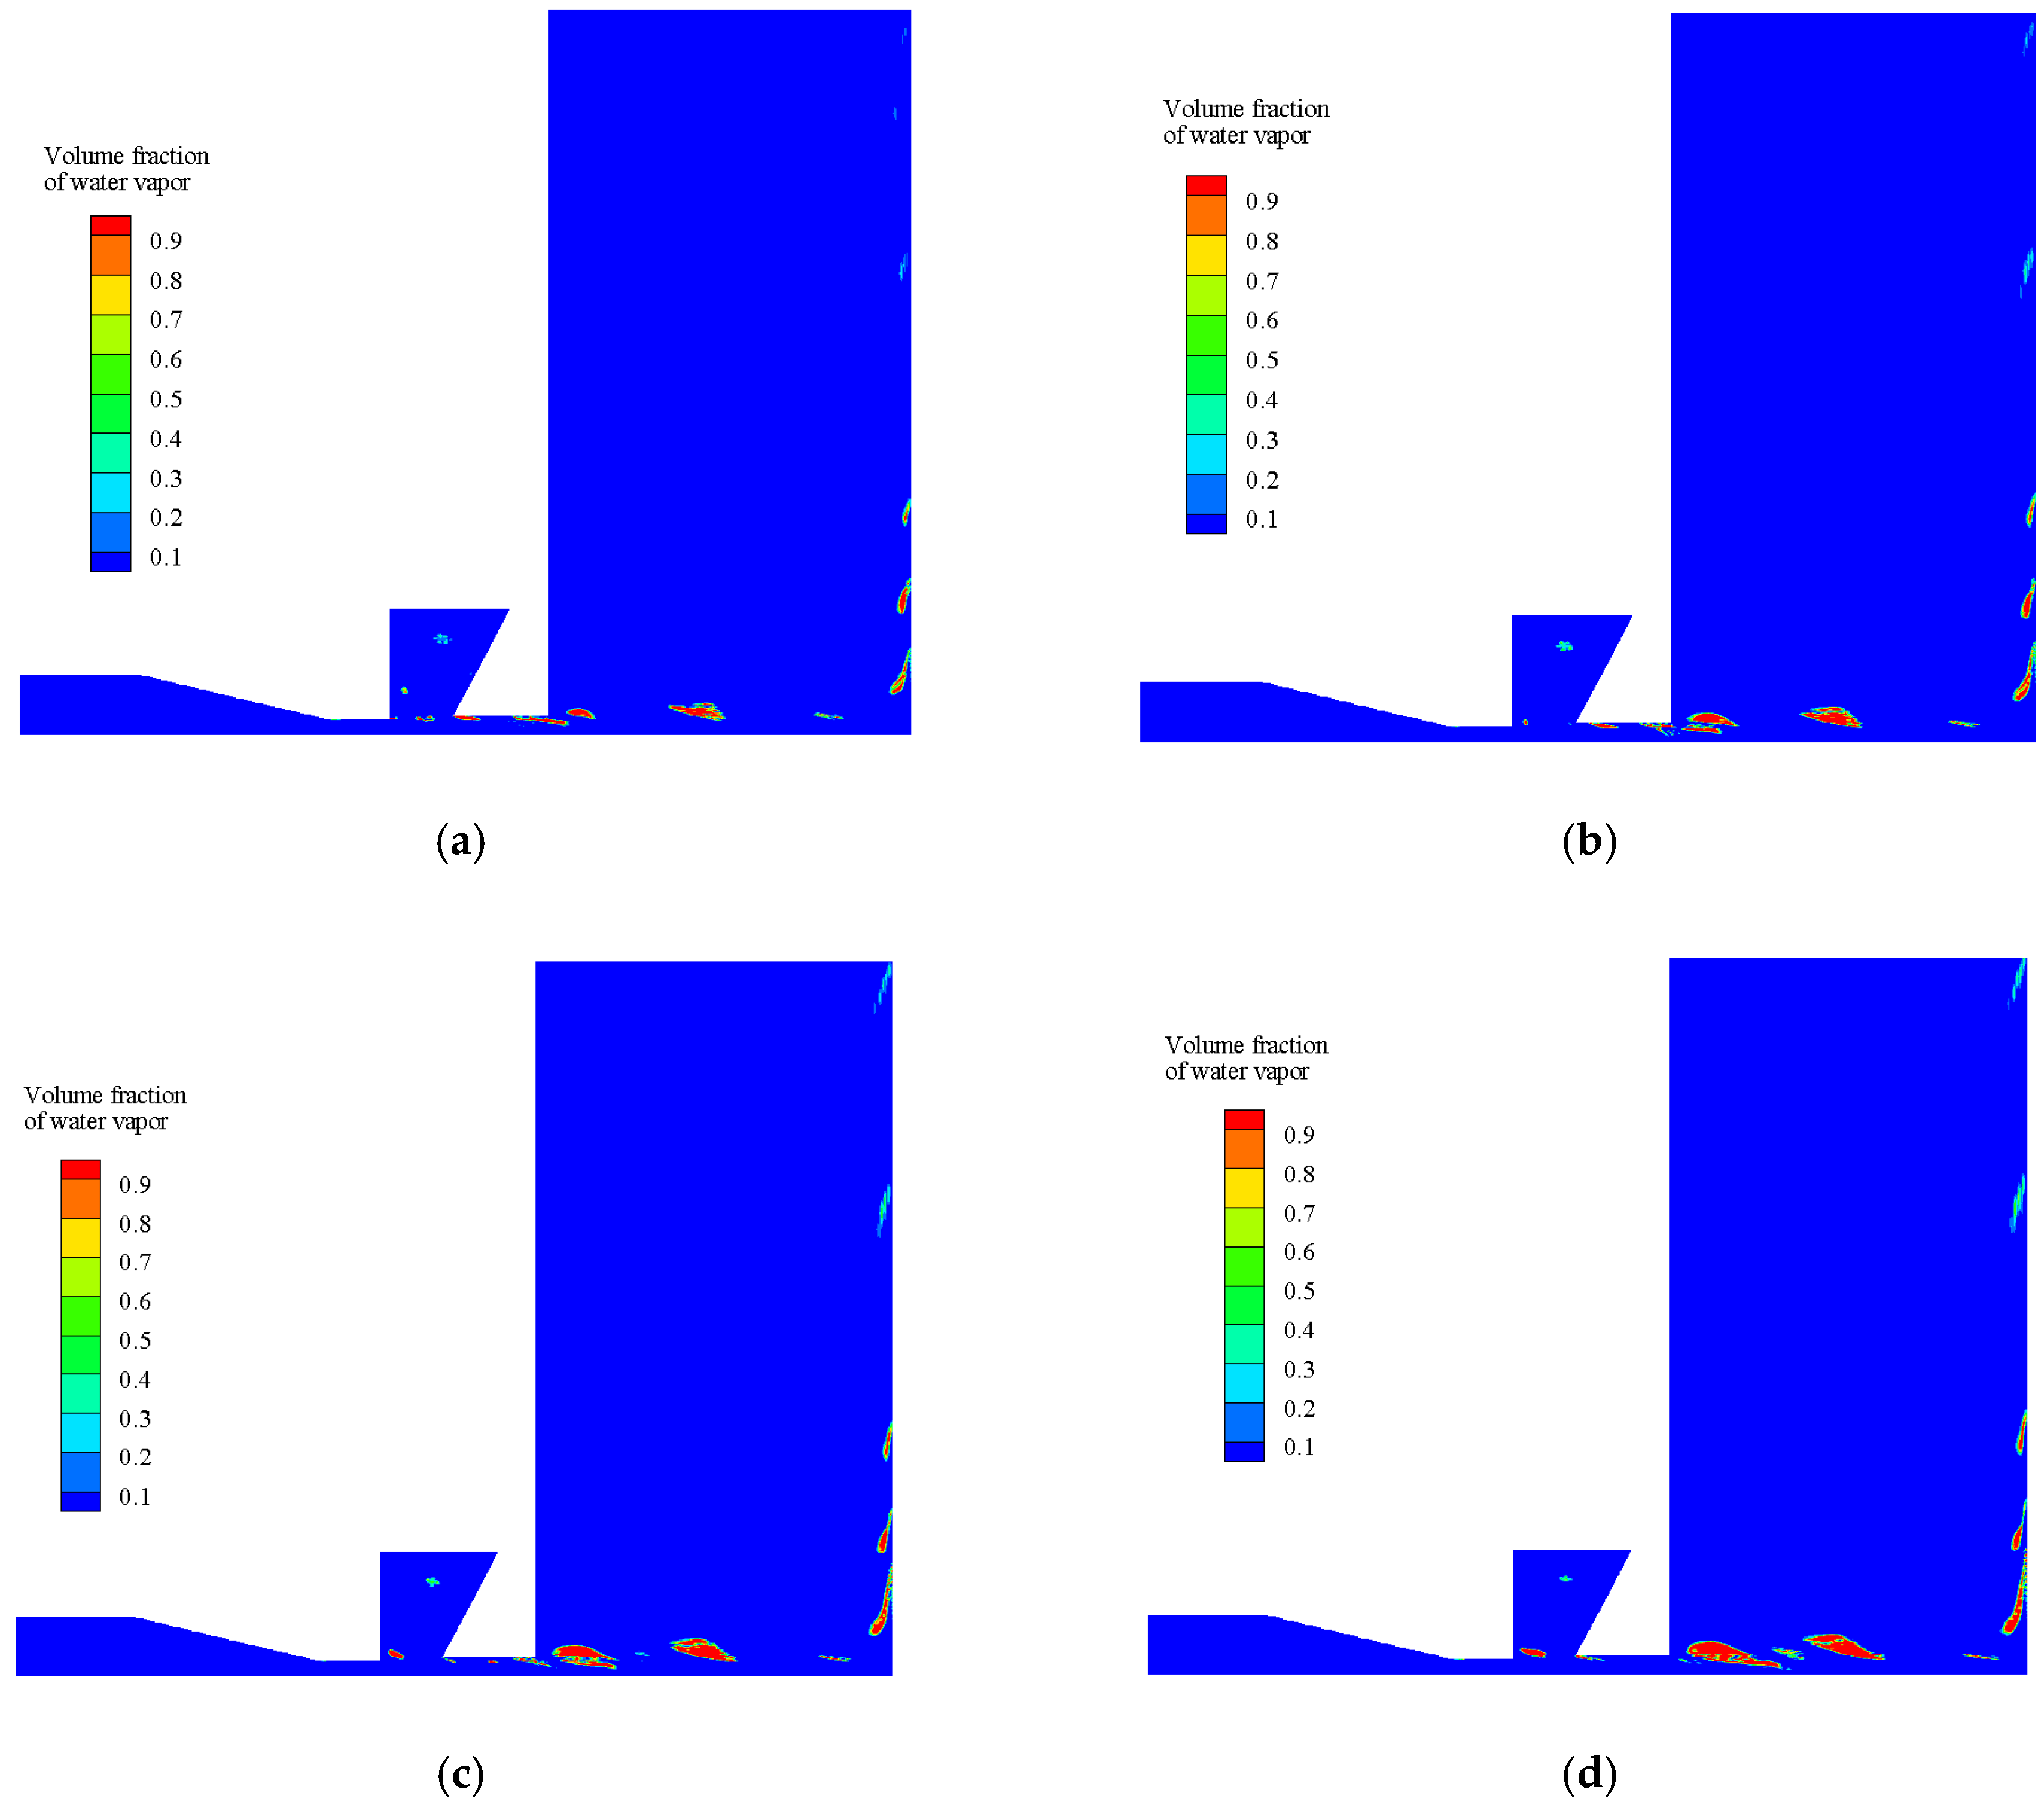
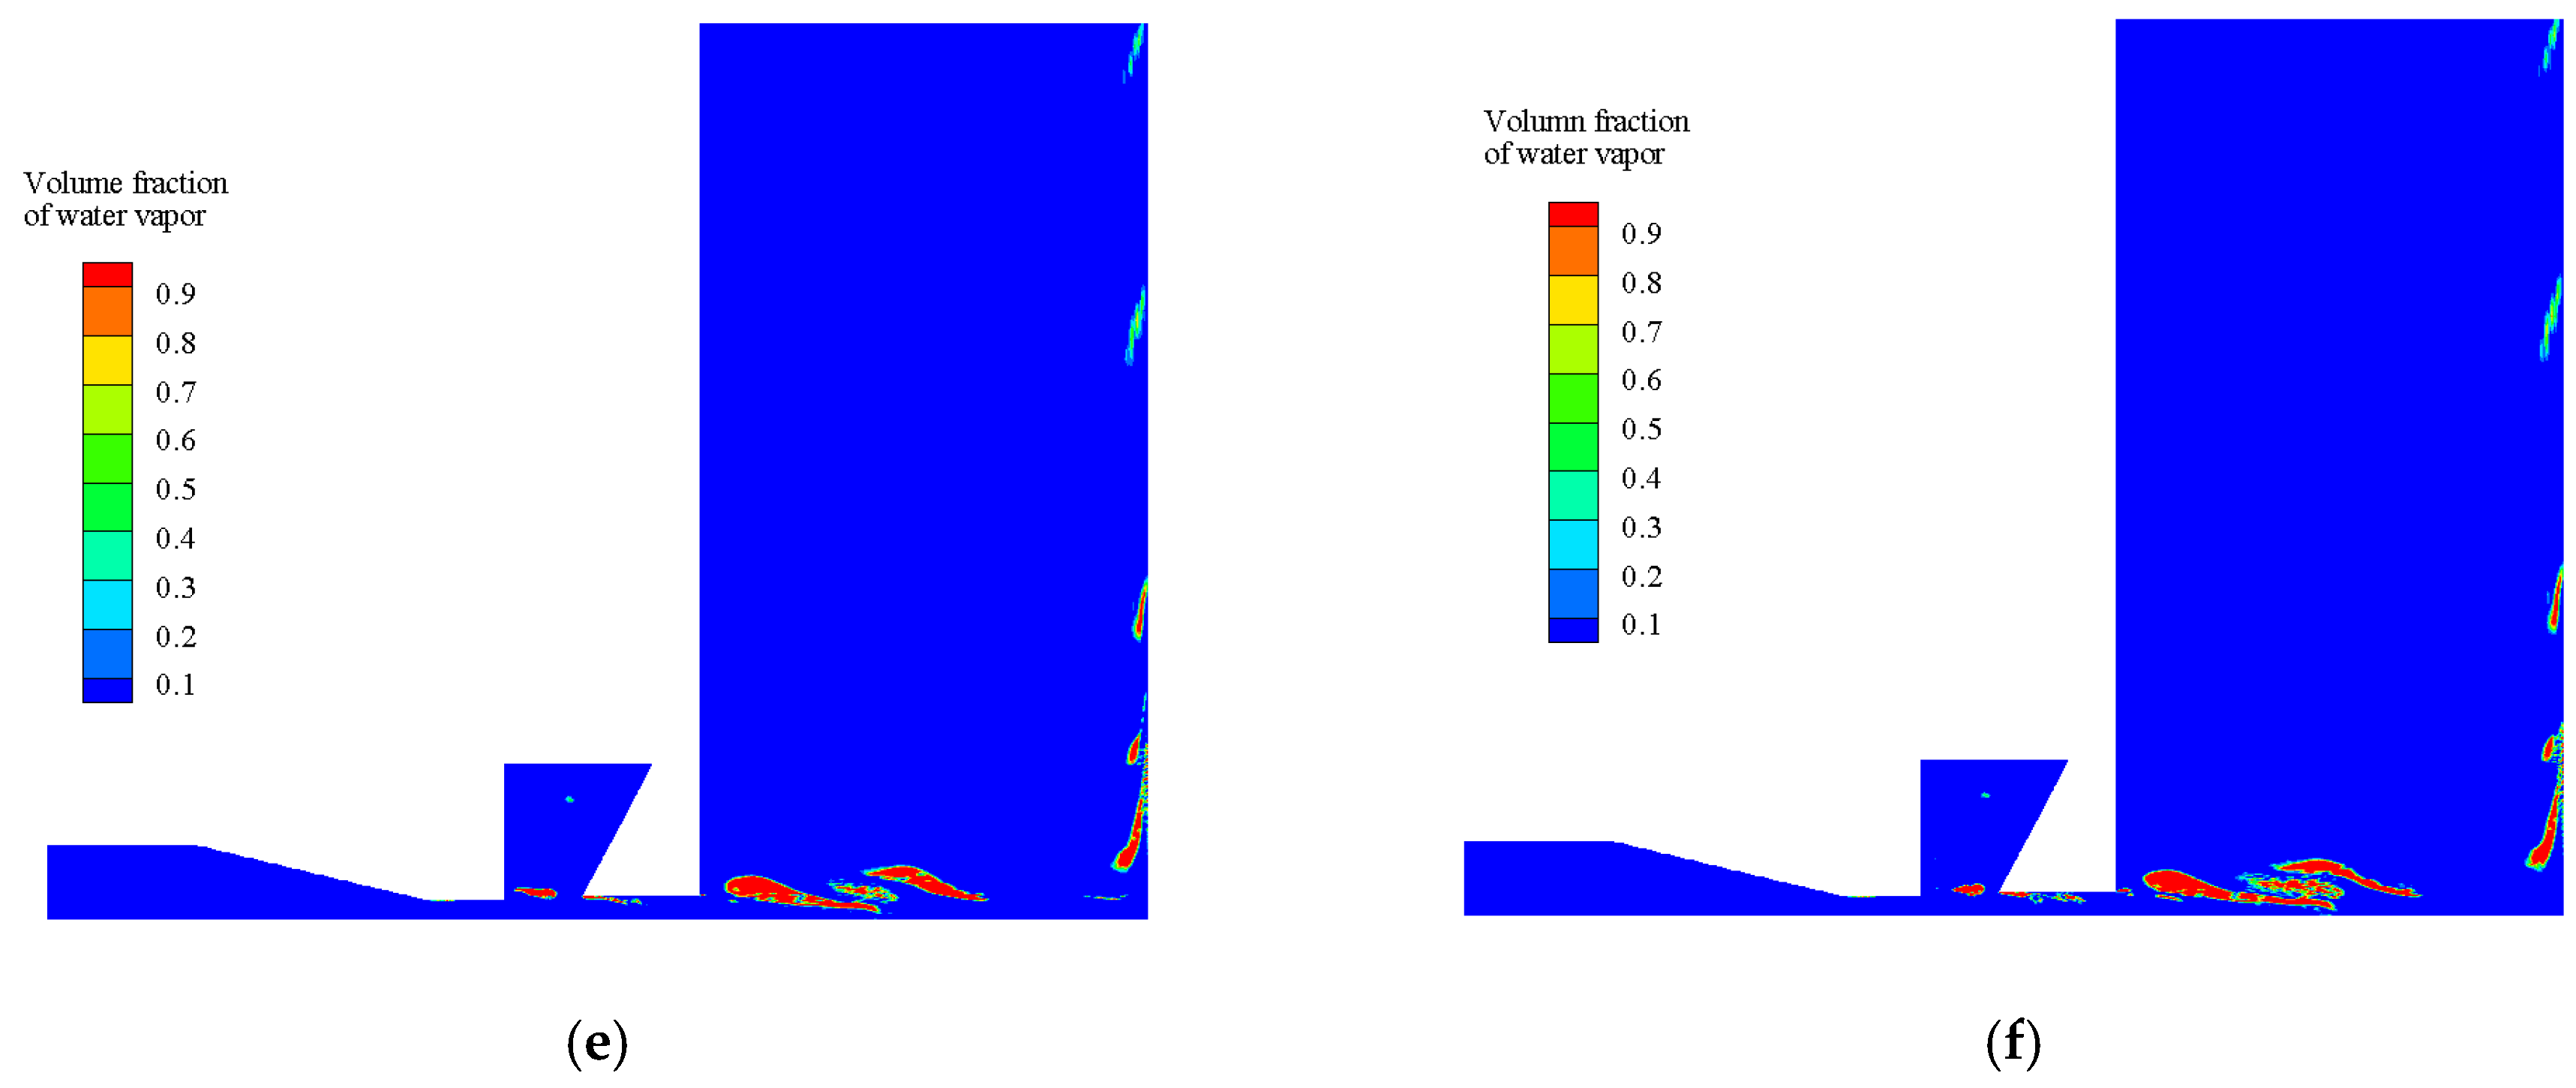
To further understand the cavitation generation and evolution of HSEOW, the time evolution of water vapor volume fraction is shown in Figure 11. The cavitation occurs at the shear layer in the chamber in Figure 11a which migrates downstream to the nozzle and grows up. The cavitation in the interior of the cavity leads to larger cavitation in the external field near the downstream nozzle outlet as shown in Figure 11b,c. The shedding of external cavitation continues until reaching the target wall in Figure 11d,e. The bubbles impact on the wall surface and collapse, which will form high energy and then dissipate gradually along the wall surface as shown in Figure 11f.
The cavitation effect of the conical nozzle was far less than that of the Helmholtz nozzle. The cavitation formed due to the strong shear action in the Helmholtz cavity was ejected with the jets, in the process of migration downstream, it developed and became cloud cavitation [29]. At the end of the cavitation cloud, when the cavitation was close to the point of collapse, many small bubbles formed a fog-like cavitation composed of numerous single bubbles. The collapse process of a single spherical bubble is shown in Figure 12.
The bubble was spherical at the beginning, when it was close to the wall surface, the far end from the wall began to be disturbed and deformed. In the early stage of cavitation collapse, a micro-jet was formed. As the collapse process continued, it impacted the wall surface, and the bubbles formed by numerous small groups collapsed, forming a continuous and dense pressure transfer on the surface of the specimen, which was several orders of magnitude higher than the pressure impact generated by a single bubble. The radiation pressure inside the cavitation bubble was continuously transmitted outwards, and the dense micro-jets accumulated and impacted the target countless times, reaching the fatigue limit of the material and producing cavitation erosion damage to the surface structure.

3.3. Cavitation Erosion Intensity

According to the above research, the intense cavitation by HSEOW nozzles under submerged conditions was much stronger than conical nozzles. The cavitation and the mechanical function were major factors that HSEOW nozzles damage to the specimen [30]. The chamber was the place where cavitation occurred, and its structure parameters had great influence on the size and shape of thr cavitation cloud, which determined the ultimate erosion capacity. Cavity length and cavity diameter were two main parameters considered in this paper.

3.3.1. Influence of Cavity Length

According to the law of jet impact crushing, the damage to a specimen is closely related to the operating pressure and standoff distance [31]. The distribution of axial velocity decreased with the increase of the distance, thus the kinetic energy and the ability to destroy the target were reduced. As for cavitation jets, the failure of the specimen was not only due to the impact of jets, but also the cavitation collapse. When the jets were ejected from the nozzle, cavitation cloud developed completely after a certain distance, then broke and collapsed which indicated that cavitation need enough distance to develop. If the distance between the target and the nozzle outlet was within the effective range—that is, it was within the length range of the cavitation cloud and developed completely—the cavitation bubbles hit the wall surface, broke into small bubbles, and formed a micro-jet near the wall surface with huge local energy, which acted on the surface of the target to form effective damage [32,33]. Moreover, if the standoff distance was not enough for bubble development, the effect of the jets on the target was also affected. Therefore, there must be an optimal standoff distance which best captures the working ability of HSEOW nozzles.
Figure 13 shows the mass loss of specimen against standoff distance under different operating pressure (Po = 10 MPa, 15 MPa, 20 MPa, 25 MPa), which is able to clarify the erosion intensities of the jets. The dimensionless cavity diameter remained constant Dc/d1 = 8, and the dimensionless cavity length varied from 1 to 4. The mass loss of jet erosion increased first with the increase of standoff distance, then decreased rapidly after reaching the maximum value, and finally approached to 0 regardless of operating pressure and nozzle structure. As was mentioned above, when the standoff distance was less than the length of the cavitation cloud, the cavitation was still in the initial stage and had not been fully developed, thus the erosion mass basically grew linearly with the increase of the standoff distance. When the standoff distance of the specimen exceeded the length of the cavitation cloud, the effect of the cavitation on the specimen decreased sharply and the erosion mass decreased sharply. The location of the maximum erosion capacity was related to the intensity of cavitation and the length of the cavitation cloud.
It is obvious that the optimal cavity length of self-excited oscillating jets can achieve the largest mass loss for the reason that the variation of cavity length causes the development distance of the jets in the chamber much longer and the modulation effect on the jet is also changed [34]. When the dimensionless cavity length Lc/d1 were 1 and 2, the curve was very similar, since the performance of self-excited oscillation exceeded the energy loss caused by the increase of cavity length, at this time, the corresponding cavity length of the jets had the strongest working ability. The structure was conducive to the formation of jet pulse and cavitation at Lc/d1 = 2, so its maximum erosion capacity was basically equal to the nozzle of Lc/d1 = 1, while the optimal standoff distance was slightly smaller. If the cavity length continued to increase, the energy loss in the chamber kept growing which resulted that both the mass loss of erosion and the optimal standoff distance were greatly reduced. While the standoff distance exceeded the corresponding length of cavity cloud, the mass loss decreased rapidly; however, the influence of structure was little. It is worth noting that at the rising stage of the curve, the smaller standoff distance meant that cavitation development distance was insufficient, on the contrary, the small cavity length had stronger erosion ability.
It is also observed in Figure 13a–d that the greater the operating pressure was, the larger the optimal standoff distance was. The growing pressure led to an increase of cavitation length, in this way, under the same standoff distance, the kinetic energy converted by the pressure energy was much higher. Meanwhile, the shear layer was prone to cavitation and the mass loss of erosion increased. The jets had the optimal standoff distance of 35 mm, 38 mm, 42 mm, and 46 mm, corresponding to operating pressure of 10 MPa, 15 MPa, 20 MPa, and 25 MPa, respectively.

3.3.2. Influence of Cavity Diameter

In a HSEOW nozzle, the main function of cavity diameter is to control the size of vortices on both sides of the cavity and the feedback effect of backflow. The length of cavitation cloud in the outflow field is less affected by the cavity diameter, while the main influence is the turbulence intensity of the jets. When the cavity diameter is too small, the backflow vortices on both sides of the chamber do not have enough space to be fully developed, which squeeze the main stream and form obvious interference. The energy loss is large at this time, and the working ability of the nozzle is relatively poor. When the cavity diameter is too large, the vortices in the chamber cannot form effective modulation which generates a pulsed jet of strong impact. Therefore, there is also an optimal cavity diameter to maximize the erosion capacity of the nozzle.
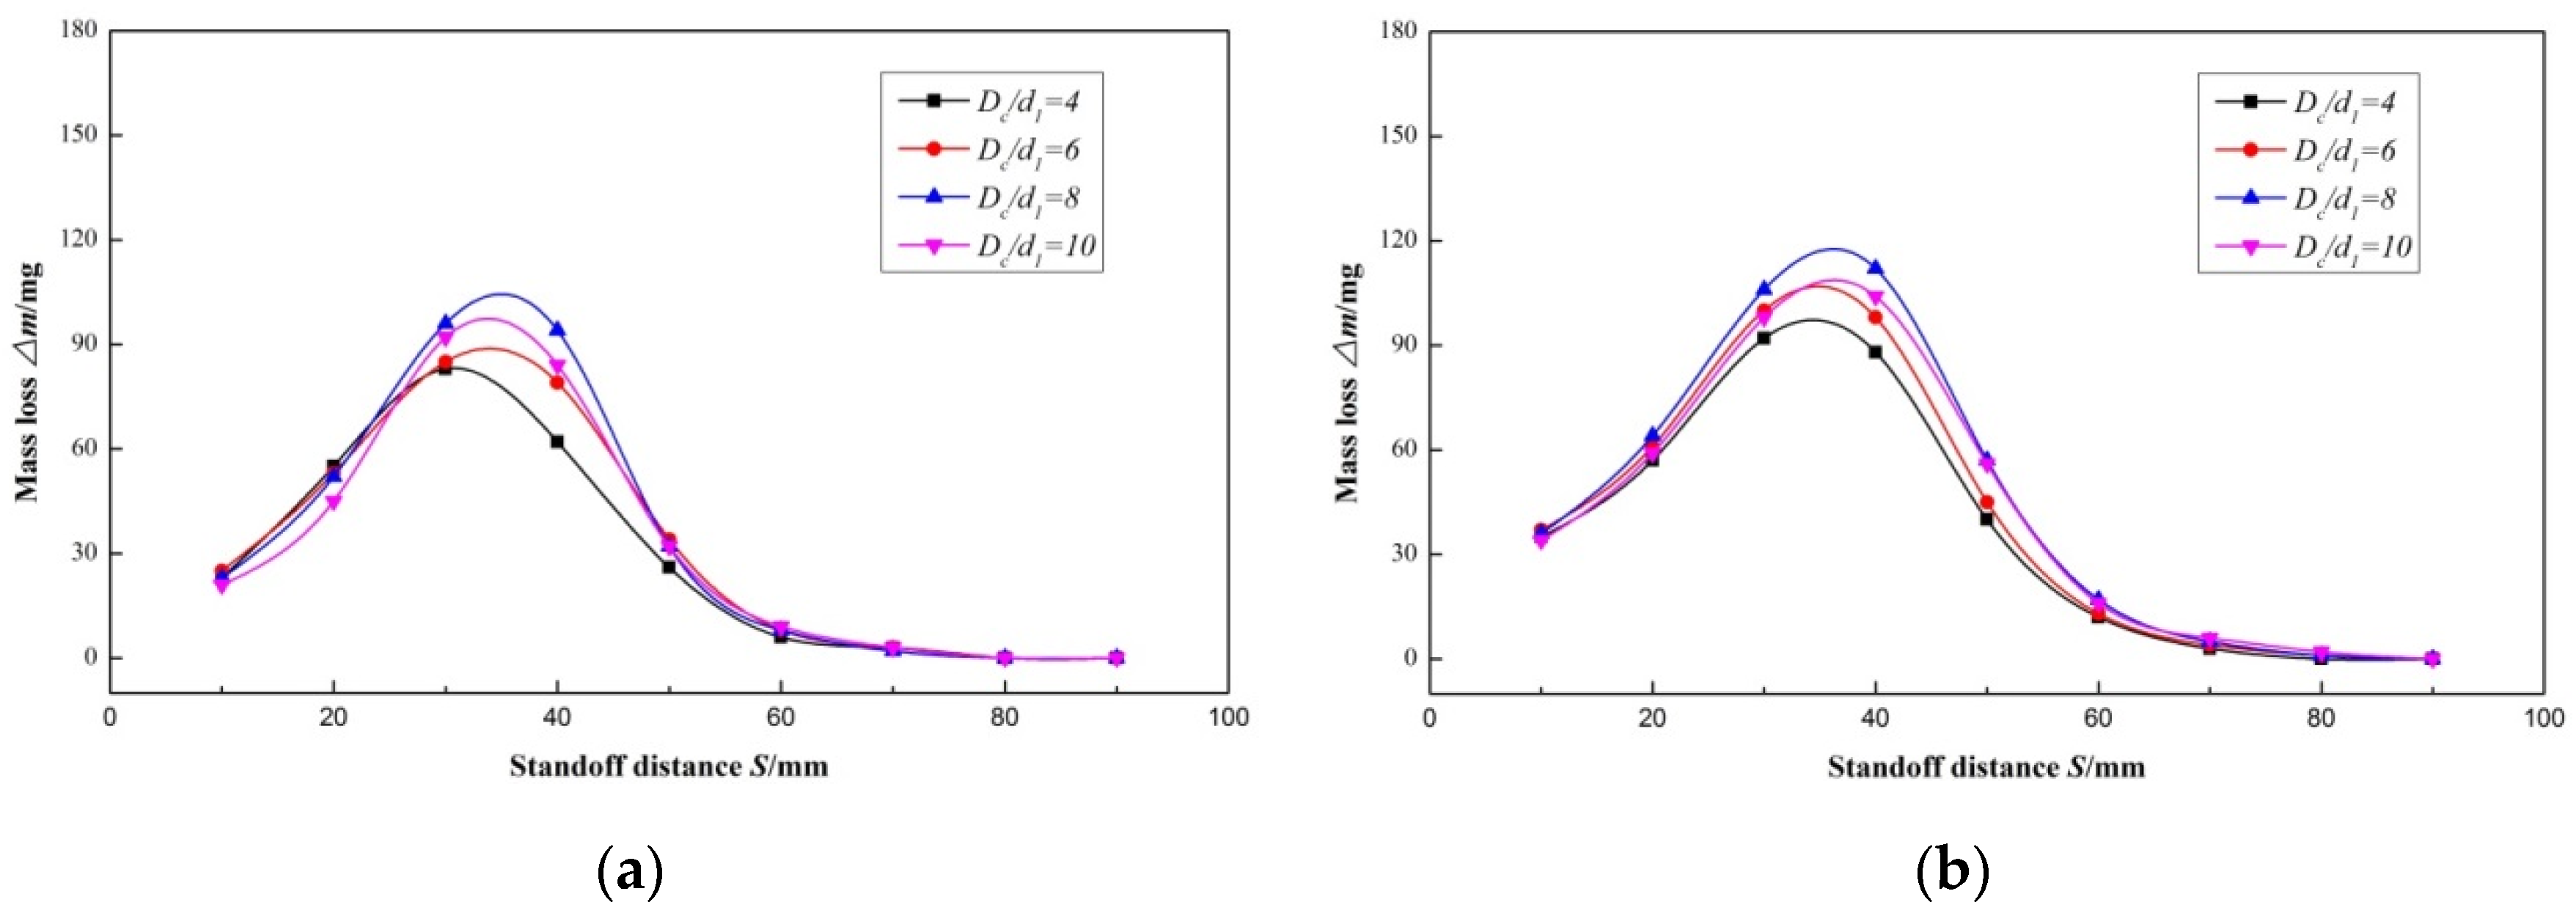
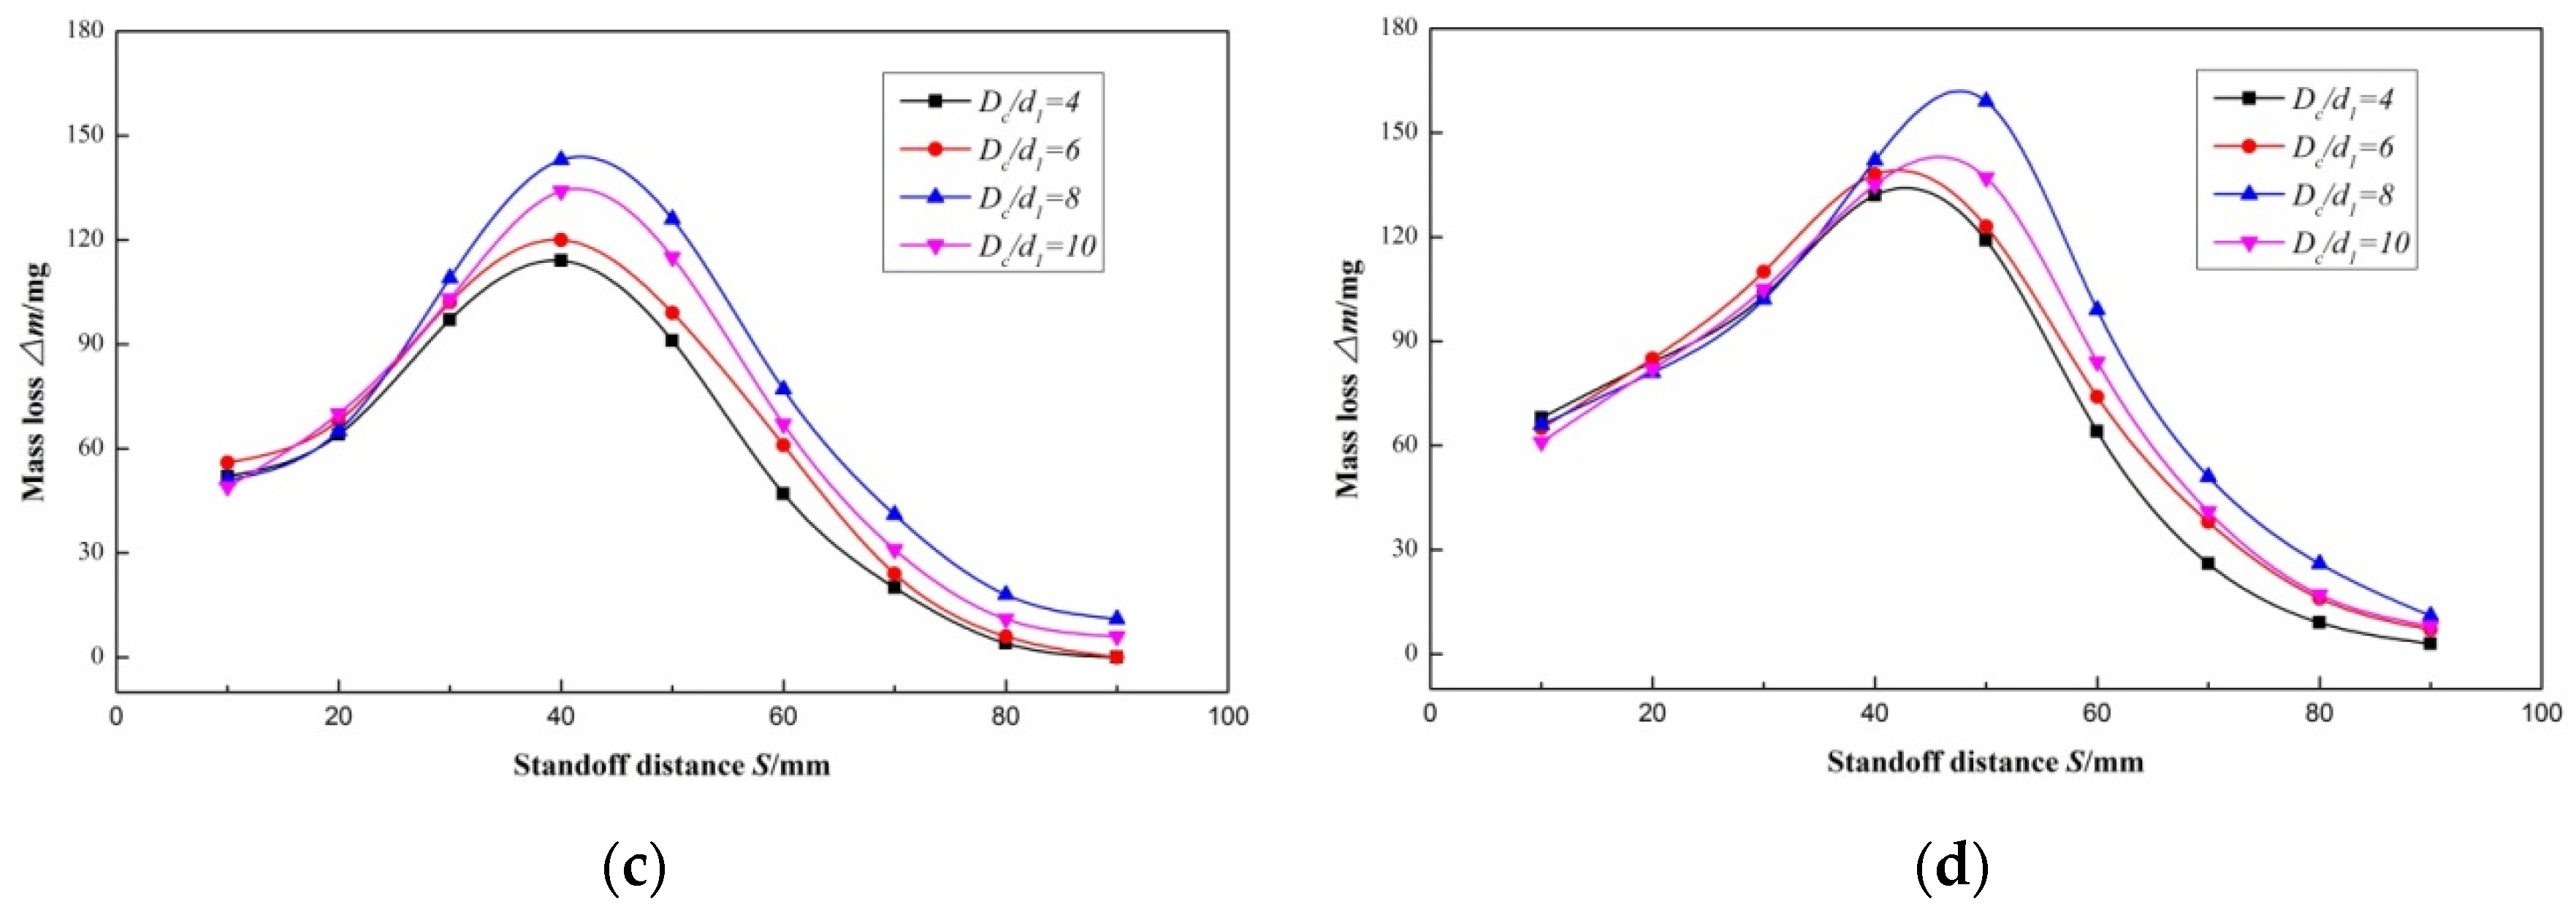
Figure 14 shows the mass loss of specimen against standoff distance under different operating pressure (Po = 10 MPa, 15 MPa, 20 MPa, 25 MPa), while the dimensionless cavity length remained constant Lc/d1 = 2, and the dimensionless cavity length varied from 4 to 10. The curve increased first and then decreased, and there was a maximum value, which was similar to Figure 13. Under the same operating pressure, Dc/d1 = 8 was the optimal cavity diameter, where the mass loss was at the highest point of parabola. The optimal standoff distance slightly decreased as the cavity length changed smaller which could be seen that the effect of cavity diameter on the optimal standoff distance was not as obvious as that of cavity length. When the dimensionless cavity diameter was 4 and 6, the chamber was dominated by energy dissipation and cannot effectively form pressure pulsation, so the optimal standoff distance and damage to the specimen was relatively low. When the dimensionless cavity diameter was 8, the jets which achieved the optimal cavity structure corresponding to the pulsation periodically acted on the specimen and formed fatigue failure.
With the variation of operating pressure from 10 MPa to 25 MPa, the optimal standoff distance of Dc/d1 = 8 changed from 36 mm to 50 mm, and the corresponding optimal standoff distance of each cavity diameter also increased. The length of the cavitation cloud increased as the pressure increased, and after the mass loss curve reached the highest point, there was still a relatively high erosion mass within a certain distance. In addition, when the operating pressure was 10 MPa, the declining trend of different cavity diameters was basically coincident after reaching the highest point. However, the curves corresponding to different cavity diameters were clearly distinguished at the operating pressure of 25 MPa, while the standoff distance was larger than the optimal standoff distance. Based on the previous studies, the optimal cavity length and diameter could be determined as Lc/d1 = 2, Dc/d1 = 8 within the scope of this paper.

3.3.3. Surface Roughness of the Erosion Specimen

To have a more intuitive understanding of the roughness and surface morphology of the erosion specimen, the specimen (Lc/d1 = 2, Dc/d1 = 8, Po = 20 MPa) was measured with a roughmeter, and the three-dimensional image is shown in Figure 15. The grooves formed by the pulsed jets were not entirely a uniform pit, instead, it was a large pit made up of many small pits, which was dense in the middle and the outward diffusion gradually became shallow and sparse. The deepest part was at a depth of 300 μm.
The high-energy region of the jet core formed a shockwave at the center of the specimen, while the jets impacted on the surface. It was squeezed by the wall surface, and the direction of jets changed from axial to radial direction. Shallow pits and radial cracks were formed on the surface due to jet impact force. After the first jet of the pulsed jets spread radially along the specimen, the following jet carried out a continuous impact on the surface, and the above process was repeated until fatigue failure of the specimen took place. An important feature of the pulsed jets is that cavitation bubbles were carried by jet flow, thus micro-jets formed by cavitation collapse enhanced damage capability. Moreover, the energy was intense near the axis of jets where the cavitation was severe and the pits were deeper than other places. Nevertheless, the pits became shallow and the energy became more and more dispersed as they diffused around, eventually forming the morphology shown in Figure 15.

4. Conclusions

In this paper, the impact performance produced by HSEOW nozzles were numerically and experimentally studied in order to better understand the erosion mechanism of HSEOW and obtain the optimal nozzle structure. The conclusions are described as follows:
(1)
The cavitation damage caused by the HSEOW nozzle on the specimen was mainly the jet cavitation cloud under submerged conditions. The energy was intense near the axis of jets where the cavitation was severe so that the pits were deeper than other places. The density of holes and the damage intensity weakened with the increase of radial distance.
(2)
Under the same operating conditions, the cavitation produced by the HSEOW nozzle had a greater impact capacity than that of a conical nozzle, which indicated that cavitation was the major factor of destructive mechanism.
(3)
As the cavity length increased, the corresponding optimal standoff distance decreased, while the effect of cavity diameter was not as obvious as that of cavity length. A dimensionless cavity length of 2 and a dimensionless cavity diameter of 8 led to the maximum mass loss while the structure was favorable to the formation of a pulse jet.
(4)
HSEOW nozzles have a great advantage of material removal. In this paper, the influence of cavitation was further studied, which illuminated the main failure mechanism of HSEOW; the change law of material removal at different cavity lengths and diameters was obtained. The results will provide theoretical and nozzle selection basis in underground mining.

Author Contributions

Conceptualization, Z.F. and P.J.; Formal analysis, X.G.; Investigation, X.G.; Data curation, M.Z.; Writing—original draft preparation, Z.F.; Writing—review and editing, X.T. and D.L.; Supervision, P.J.; Project administration, P.J. and T.X.; Funding acquisition, Z.F., T.X.

Funding

This research was funded by the National Natural Science Foundation of China (nos. 51706161, 51709210, 51679178).

Acknowledgments

We would like to acknowledge the support of Prof. Shijing Wu from Wuhan University for providing roughness testing.

Conflicts of Interest

The authors declare no conflict of interest.

Abbreviations

xAxial direction
yRadial direction
d1Upstream nozzle diameter
d2Downstream nozzle diameter
αImpinge wall angle
LcCavity length
DcCavity diameter
ρMedium density
uMedium velocity
pMedium pressure
P0Inlet pressure
SStandoff distance
u0Average velocity at nozzle inlet
uavAverage velocity at nozzle outlet
uxX velocity
uyY velocity
ΔtTime interval
tTransient time
t0Initial time
m ˙ Mass transfer rate
RbBubble radius
NbBubble number density
pbBubble surface pressure
αvVapor volume fraction
pvSaturation vapor pressure
ρlLiquid density
σLiquid surface tension coefficient
ΔmMass loss

References

  1. Dehkhoda, S.; Hood, M. An Experimental Study of Surface and Sub-Surface Damage in Pulsed Water-Jet Breakage of Rocks. Int. J. Rock Mech. Min. 2013, 63, 138–147. [Google Scholar] [CrossRef]
  2. McLean, R.H. Crossflow and Impact under Jet Bit. J. Pet. Technol. 1964, 16, 1299–1306. [Google Scholar] [CrossRef]
  3. Shen, Z.H.; Sun, Q. Study of Pressure Attenuation of a Submerged, Nonfree jet and a Method of Calculation for Bottomhole Hydraulic parameters. SPE Dril. Eng. 1988, 3, 69–76. [Google Scholar] [CrossRef]
  4. Taherdangkoo, R.; Taherdangkoo, M. Modified Stem Cells Algorithm-based Neural Network Applied to Bottomhole Circulating Pressure in Underbalanced Drilling. Int. J. Pet. Eng. 2015, 1, 178–188. [Google Scholar] [CrossRef]
  5. Wen, J.W.; Chen, C. Optimizing the Structure of the Straight Cone Nozzle and the Parameters of Borehole Hydraulic Mining for Huadian Oil Shale Based on Experimental Research. Energies 2017, 10, 2021. [Google Scholar] [CrossRef]
  6. Ge, Z.L.; Deng, K.; Lu, Y.Y.; Cheng, L.; Zuo, S.J.; Tian, X.D. A Novel Method for Borehole Blockage Removal and Experimental Study on a Hydraulic Self-Propelled Nozzle in Underground Coal Mines. Energies 2016, 9, 698. [Google Scholar] [CrossRef]
  7. Lu, Y.Y.; Zhou, Z.; Ge, Z.L.; Zhang, X.W.; Li, Q. Research on and Design of a Self-Propelled Nozzle for the Tree-Type Drilling Technique in Underground Coal Mines. Energies 2015, 8, 14260–14271. [Google Scholar] [CrossRef] [Green Version]
  8. Li, G.; Shen, Z.H.; Zhou, C.; Zhang, D.; Chen, H. Investigation and Application of Self-Resonating Cavitation Water Jet in Petroleum Engineering. Pet. Sci. Technol. 2005, 1, 1–15. [Google Scholar]
  9. Li, G.; Shi, H.; Liao, H.; Shen, Z.; Niu, J.; Huang, Z.; Luo, H. Hydraulic Pulsed Cavitating Jet-Assisted Drilling. Pet. Sci. Technol. 2009, 27, 197–207. [Google Scholar] [CrossRef]
  10. Morel, T. Experimental Study of a Jet-Driven Helmholtz Oscillator. J. Fluid Eng. Trans. ASME 1979, 101, 383–390. [Google Scholar] [CrossRef]
  11. Rockwell, D.; Naudascher, E. Review—Self-Sustaining Oscillations of Flow Past Cavities. J. Fluid Eng. Trans. ASME 1978, 100, 152–165. [Google Scholar] [CrossRef]
  12. Rockwell, D.; Naudascher, E. Self-Sustained Oscillations of Impinging Free Shear Layers. Annu. Rev. Fluid Mech. 1979, 11, 67–94. [Google Scholar] [CrossRef]
  13. Hu, D.; Li, X.H.; Tang, C.L.; Kang, Y. Analytical and Experimental Investigations of the Pulsed Air-water Jet. J. Fluid Struct. 2015, 54, 88–102. [Google Scholar] [CrossRef]
  14. Lu, Y.; Li, X.; Yang, L. Effects of Gas Content in Fluid on Oscillating Frequencies of Self-Excited Oscillation Water Jets. J. Fluid Eng. Trans. ASME 2004, 126, 1058–1061. [Google Scholar] [CrossRef]
  15. Li, D.; Kang, Y.; Wang, X.C.; Ding, X.L.; Fang, Z.L. Effects of Nozzle Inner Surface Roughness on the Cavitation Erosion Characteristics of High Speed Submerged Jets. Exp. Therm. Fluid Sci. 2016, 74, 444–452. [Google Scholar] [CrossRef]
  16. Li, D.; Kang, Y.; Ding, X.L.; Wang, X.C.; Fang, Z.L. Effects of Area Discontinuity at Nozzle Inlet on the Characteristics of High Speed Self-Excited Oscillation Pulsed Waterjets. Exp. Therm. Fluid Sci. 2016, 79, 254–265. [Google Scholar] [CrossRef]
  17. Li, D.; Kang, Y.; Ding, X.L.; Wang, X.C.; Liu, W.C. Effects of Feeding Pipe Diameter on the Performance of a Jet-Driven Helmholtz Oscillator Generating Pulsed Waterjets. J. Mech. Sci. Technol. 2017, 31, 1–10. [Google Scholar] [CrossRef]
  18. Wang, X.L.; Kang, Y.; Zhang, M.D.; Yuan, M.; Li, D. The Effects of the Downstream Contraction Ratio of Organ-Pipe Nozzle on the Pressure Oscillations of Self-Resonating Waterjets. Energies 2018, 11, 3137. [Google Scholar] [CrossRef]
  19. Liu, W.C.; Kang, Y.; Zhang, M.X.; Wang, X.C.; Li, D. Self-Sustained Oscillation and Cavitation Characteristics of a Jet in a Helmholtz Resonator. Int. J. Heat Fluid Flow 2017, 68, 158–172. [Google Scholar] [CrossRef]
  20. Liu, W.C.; Kang, Y.; Zhang, M.X.; Wang, X.C.; Li, D.; Xie, L. Experimental and Theoretical Analysis on Chamber Pressure of a Self-Resonating Cavitation Waterjet. Ocean Eng. 2018, 151, 33–45. [Google Scholar] [CrossRef]
  21. Huang, M.; Kang, Y.; Wang, X.C.; Hu, Y.; Liu, Y.W.; Chen, H. Experimental Investigation on the Rock Erosion Characteristics of a Self-Excited Oscillation Pulsed Supercritical CO2 Jet. Appl. Therm. Eng. 2018, 139, 445–455. [Google Scholar] [CrossRef]
  22. Stevens, J.; Webb, B.W. Measurements of flow structure in the stagnation zone of impinging free-surface liquid jets. Int. J. Heat Mass Transf. 1993, 36, 4283–4286. [Google Scholar] [CrossRef]
  23. Johnson, V.; Chahine, G.; Lindenmuth, W.; Conn, A.; Frederick, G.; Giacchino, G. Cavitating and Structured Jets for Mechanical Bits to Increase Drilling Rate—Part I: Theory and Concepts. J. Energy Resour. Technol. 1984, 106, 282–288. [Google Scholar] [CrossRef]
  24. Jungowski, W.M.; Grabitz, G. Self-Sustained Oscillation of a Jet Impinging upon a Helmholtz Resonator. J. Fluid Mech. 2006, 179, 77–103. [Google Scholar] [CrossRef]
  25. Li, L.K.B.; Juniper, M.P. Phase Trapping and Slipping in a Forced Hydrodynamically Self-Excited Jet. J. Fluid Mech. 2013, 735, R5. [Google Scholar] [CrossRef]
  26. Chahine, G.; Johnson, V. Mechanics and Applications of Self-Resonating Cavitating Jets. Proc. Int. Symp. Jets Cav. ASME 1985, 15, 21–33. [Google Scholar]
  27. Soyama, H.; Yamauchi, Y.; Adachi, Y.; Sato, K.; Shindo, T.; Oba, R. High-Speed Observations of the Cavitation Cloud around a High-Speed Submerged Water-Jet. T-JSME B 2008, 22, 1919–1924. [Google Scholar]
  28. Yang, M.; Xiao, S.; Kang, C.; Wang, Y. Effect of Geometrical Parameters on Submerged Cavitation Jet Discharged from Profiled Central-Body Nozzle. Chin. J. Mech. Eng. 2013, 26, 476–482. [Google Scholar] [CrossRef]
  29. Caupin, F.; Herbert, E. Cavitation in Water: A Review. Comptes Rendus Phys. 2006, 7, 1000–1017. [Google Scholar] [CrossRef]
  30. Li, Z. Criteria for Jet Cavitation and Cavitation Jet Drilling. Int. J. Rock Mech. Min. Sci. 2014, 71, 204–207. [Google Scholar] [CrossRef]
  31. Hall, J.W.; Ewing, D. On the Dynamics of the Large-Scale Structures in Round Impinging Jets. J. Fluid Mech. 2006, 555, 439–458. [Google Scholar] [CrossRef]
  32. Liu, W.C.; Kang, Y.; Zhang, M.X.; Zhou, Y.X.; Wang, X.C.; Li, D. Frequency Modulation and Erosion Performance of a Self-Resonating Jet. Appl. Sci. 2017, 7, 932. [Google Scholar] [Green Version]
  33. Huang, M.; Kang, Y.; Wang, X.C.; Hu, Y.; Li, D.; Cai, C.; Chen, F. Effects of Nozzle Configuration on Rock Erosion under a Supercritical Carbon Dioxide Jet at Various Pressures and Temperatures. Appl. Sci. 2017, 7, 606. [Google Scholar] [CrossRef]
  34. Hallberg, M.P.; Strykowski, P.J. Open-Loop Control of Fully Nonlinear Self-Excited Oscillations. Phys. Fluids 2008, 20, 041703. [Google Scholar] [CrossRef]
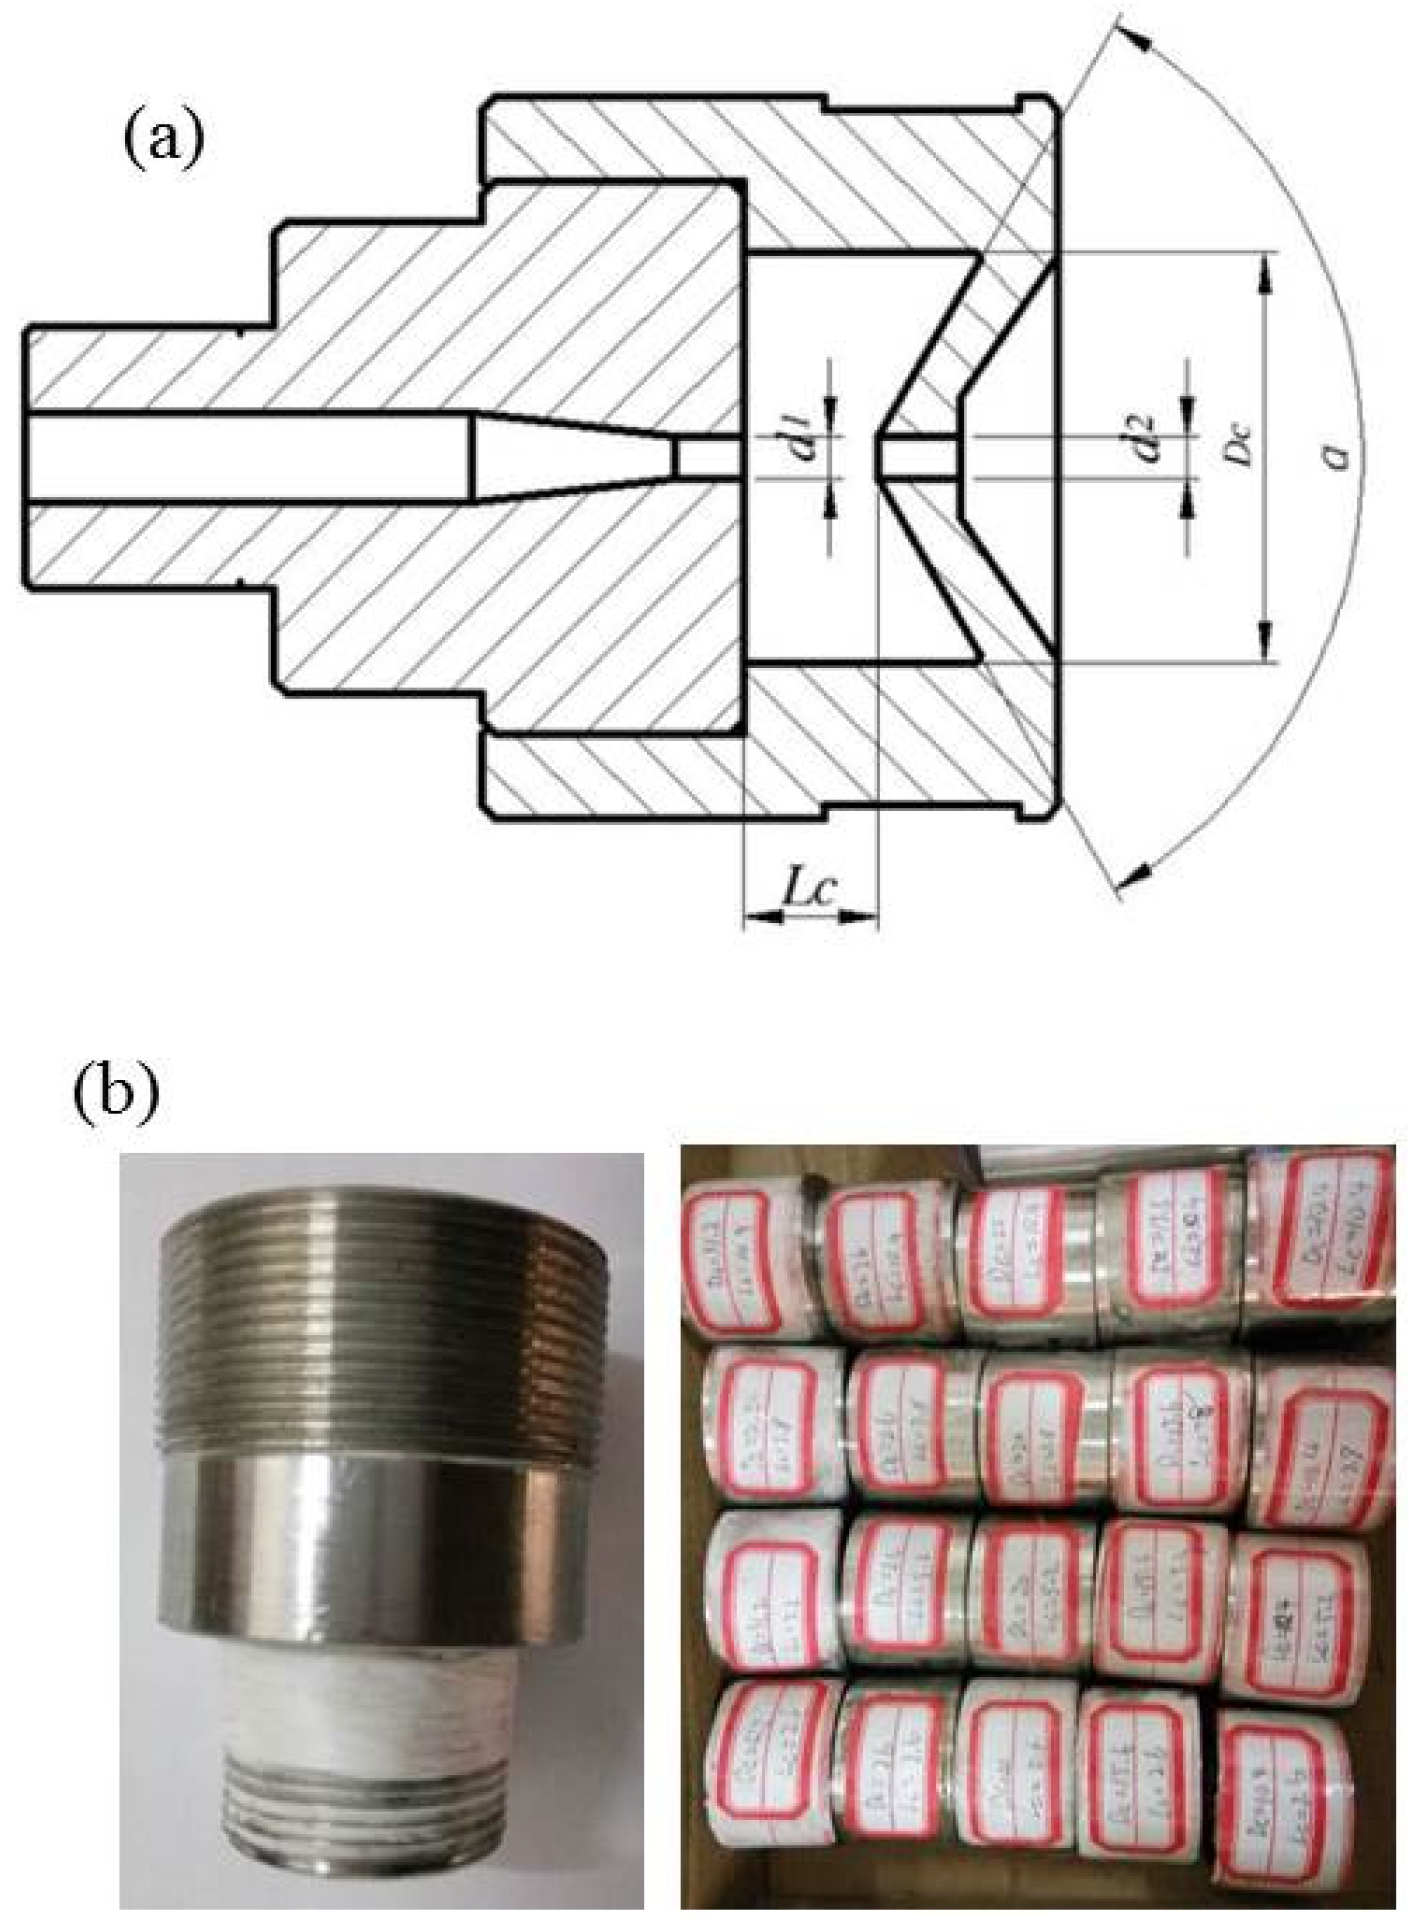
Figure 1. (a) Profile and (b) photo of HSEOW nozzles.
Applsci 09 03235 g001
Figure 2. Schematic diagram of experimental apparatus.
Applsci 09 03235 g002
Figure 3. Mass loss as a function of erosion time (Lc/d1 = 2, Dc/d1 = 8, α = 120°, Po = 20 MPa).
Applsci 09 03235 g003
Figure 4. Schematic of computational domain.
Applsci 09 03235 g004
Figure 5. Computational mesh.
Applsci 09 03235 g005
Figure 6. Validation.
Applsci 09 03235 g006
Figure 7. Time evolution of velocity contour. (a) t = t0 + 0 ms; (b) t = t0 + 10 ms; (c) t = t0 + 20 ms; (d) t = t0 + 30 ms; (e) t = t0 + 40 ms; (f) t = t0 + 50 ms.
Applsci 09 03235 g007aApplsci 09 03235 g007b
Figure 8. (a) Non-dimensional velocity magnitude at different axial locations (b) Non-dimensional velocity magnitude at different radial locations.
Applsci 09 03235 g008
Figure 9. Macroscopic appearance of eroded specimen (Lc/d1 = 3, Dc/d1 = 10, α = 120°, Po = 10 MPa).
Applsci 09 03235 g009
Figure 10. Comparison of erosion results between conical nozzle and HSEOW nozzle. (a) Conical nozzle (400-times magnification); (b) HSEOW nozzle (400-times magnification).
Applsci 09 03235 g010
Figure 11. Time evolution of water vapor volume fraction. (a) t = t0 + 0 ms; (b) t = t0 + 10 ms; (c) t = t0 + 20 ms; (d) t = t0 + 30 ms; (e) t = t0 + 40 ms; (f) t = t0 + 50 ms.
Applsci 09 03235 g011aApplsci 09 03235 g011b
Figure 12. The collapse process of a single spherical bubble.
Applsci 09 03235 g012
Figure 13. Mass loss as a function of standoff distance under different cavity length. (a) Po = 10 MPa; (b) Po = 15 MPa; (c) Po = 20 MPa; (d) Po = 25 MPa.
Applsci 09 03235 g013
Figure 14. Mass loss as a function of standoff distance under different cavity diameter. (a) Po = 10 MPa; (b) Po = 15 MPa; (c) Po = 20 MPa; (d) Po = 25 MPa.
Applsci 09 03235 g014aApplsci 09 03235 g014b
Figure 15. Three-dimensional image of surface roughness.
Applsci 09 03235 g015
Table 1. Structure parameters of nozzles.
d1/mmd2/d1Lc/d1Dc/d1α
2.61.21, 2, 3, 44, 6, 8, 10120
Table 2. Chemical compositions of specimen (%).
MaterialChinese Industry StandardAlSiCuMgZnMnTiVFe
Aluminum1060A99.60.250.050.030.050.030.030.050.35
Table 3. Physical properties of specimen.
MaterialChinese Industry StandardDensity ρ (×103 kg/m3)Elasticity Modulus E (GPa)Tensile Strength σb (MPa)Yield Strength σ0.2 (MPa)Vickers Hardness Hv (GPa)
Aluminum1060A2.70701055024
Table 4. Results of the mesh independence.
MeshNodesuav/u0
Case 1 (Coarse)62,0000.9417
Case 2 (Medium)91,0000.9372
Case 3 (Fine)127,0000.9371