Article

Effects of an Inclined Blade on the Performance of a Sirocco Fan

1
National-Provincial Joint Engineering Laboratory for Fluid Transmission System Technology, Zhejiang Sci-Tech University, Hangzhou 310018, China
2
Zhejiang Yilida Ventilator Co., Ltd., Taizhou 318056, China
*
Author to whom correspondence should be addressed.
Appl. Sci. 2019, 9(15), 3154; https://doi.org/10.3390/app9153154
Submission received: 8 July 2019 / Revised: 25 July 2019 / Accepted: 30 July 2019 / Published: 2 August 2019
(This article belongs to the Section Mechanical Engineering)

Abstract

:

Featured Application

Fluid machinery, e.g., indoor air ventilation.

Abstract

The impeller is the primary working component of centrifugal fans, whose internal flow directly determines the performance of the whole system. This work presents a numerical investigation by using ANSYS-Fluent on the internal flow of a Sirocco fan to investigate the effects of the inclination angle of the blades on the fan performance. The orientation of the blade for the baseline model is strictly along the axial direction, while three inclination angles, i.e., 3.5°, 7.0°, and 10.5°, are chosen for the inclined blades of the modified impeller to improve the aerodynamic performance of the fan. The effects of the inclined blade are demonstrated by the variations in static pressure, efficiency, and pressure and velocity distributions at various inclination angles. The computed results reveal that there is an optimum inclination angle, which produces the best aerodynamic performance.

1. Introduction

Centrifugal fans are key equipment widely applied in a variety of civil and industrial applications related to ventilation and air transportation circumstances. Sirocco fans, with forward multi-blades, are characterized by their high loads but low efficiency, thus the rise of static pressure and efficiency are significant in design and optimization procedures [1]. Due to the complex characteristics of the internal flow, such as flow separation and vortex interaction, the flow in the rotating impeller and stationary volute is inherently unsteady. Therefore, a thorough understanding of the characteristics of internal flow is necessary for improving the performance of centrifugal fans.
The unsteady internal flow within centrifugal fans has been investigated in a number of works. Madhwesh et al. [2,3] performed investigations on the effects of diffusers with non-parallel shrouds and circular shroud fences located on the front cover and the rear cover of the impeller for augmented performance; the inlet flow and the internal flow are affected by these modifications. Tamaki [4] experimentally studied the influence of the diffuser blade setting angle on the performance of centrifugal compressors. Wang et al. [5] proposed an inverse design method for calculating the meridian plane shape of centrifugal impellers. A novel geometry of meridian plane was designed by this method, which can produce uniform velocity distribution and improve the performance at the impeller entrance. Jiang et al. [6] studied the influence of the cut volute profile on the aerodynamic and acoustic performances of the fan by experiment, which is useful for causing a flow structure of the impeller across near the second clearance and re-organizing the circumference distribution of the impeller flow status. Lv et al. [7] proposed a design method for the volute radius with a flow-correcting coefficient and area factor—the volute is designed with or without area constraint. The results showed that the efficiency and static pressure of the two designed fans were improved. Li et al. [8] studied the effect of different impeller diameters in the same volute on the performance of a G4-73 centrifugal fan. Through numerical simulation, the internal flow characteristics of the fan were obtained, which showed that the volute loss for a larger impeller is larger, while the test results showed that the flow rate and total pressure increase and the efficiency decreases with the large impeller. Patil et al. [9] investigated the influence of the change of the volute tongue clearance on the performance of the centrifugal fan of a back-bend blade. The results showed that the clearance of the volute tongue has a remarkable effect on the performance of the centrifugal blower, and total pressure, efficiency, and flow rate increase with a decrease in the clearance of the volute tongue by the numerical analysis. Prezelj and Novakovic [10] numerically studied the influence of the triangular cross section formed by two opposite inclined blades in the flow channel on aerodynamic performance. Kim et al. [11] studied the annular plate used to separate the impeller to influence the efficiency of the forward-blade centrifugal fan when the height of the annular plate and the angle between the upper and lower impellers were treated as geometric parameters, and found that the properly setting of the impeller of the annular plate improves the aerodynamic performance of the fan. Wu et al. [12] investigated the effect of different attack angles on the performance of centrifugal fans. The increased performance was attributed to the reduced vortex flow in the impeller and the weakened jet-wake model at the outlet of the impeller. Zhang et al. [13] studied the comprehensive influence of the number of blades, the staggered angle of the blade outlet, and the width of the impeller outlet on the performance of a fan based on a genetic algorithm. Jung et al. [14] performed a numerical study to investigate the influence of the design parameters of the diffuser in a small high-speed centrifugal fan, and the optimized model was derived based on the results. The main reason for the decrease in performance was the increasing pressure loss due to the reduced cross-sectional area between the vanes and the vortex flow in the center of the trailing edge in the vanes. Chen et al. [15] investigated the performance of a centrifugal fan based on a flap-adjustment approach, compared with that based on leading-adjustment. Younsi et al. [16] studied the complex phenomenon of the interaction and instability caused by the motion of the rotating blades relative to the volute and their effect on the aeroacoustics behavior of the fan, based on the computational fluid dynamics (CFD) technique coupled with experimental investigation. Jeon [17] described the flow field of a centrifugal fan based on these assumptions, including the impeller rotating at a constant angular speed and the flow field in the impeller considered incompressible and inviscid. Wang et al. [18] performed a numerical simulation of the generation of entropy; the results showed that reduction of entropy generation which improves the performance is caused by the reduced secondary flow vortex, wake jet, and angle of attack. Yu et al. [19] performed a quantitative analysis on the influence of the inlet angle and the gap between the impeller and inlet on the performance of the fan. The results showed that the blade inlet angle and impeller clearance have an important impact on the performance of the fan. Rong et al. [20] studied the slotting technology of a centrifugal fan blade with lateral suction side along blade pressure; the modification can effectively reduce blade surface resistance and increase lift force under suitable parameters, and control the stall of the flow passage of the centrifugal fan. The fluid flow in a centrifugal or Sirocco fan was also studied in a number of works [21,22,23,24].
From the above review, it is concluded that the flow separation and complex vortex interaction in the impeller passage are the main sources affecting the aerodynamic performance of a fan. In this work, a numerical investigation is performed to modify the inclination angle of the blade to study the effect on the aerodynamic performance of a Sirocco fan. The reduction of flow separation the in impellers and the vortices evolved from the relatively low speed of the forward-curved blades are investigated.
The paper is formulated in the following sections. Section 2 briefly describes the numerical simulation scheme and numerical simulation method. In Section 3, the numerical results for the performance of the fan are presented and discussed. Some conclusions are addressed in Section 4.

2. Numerical Methods

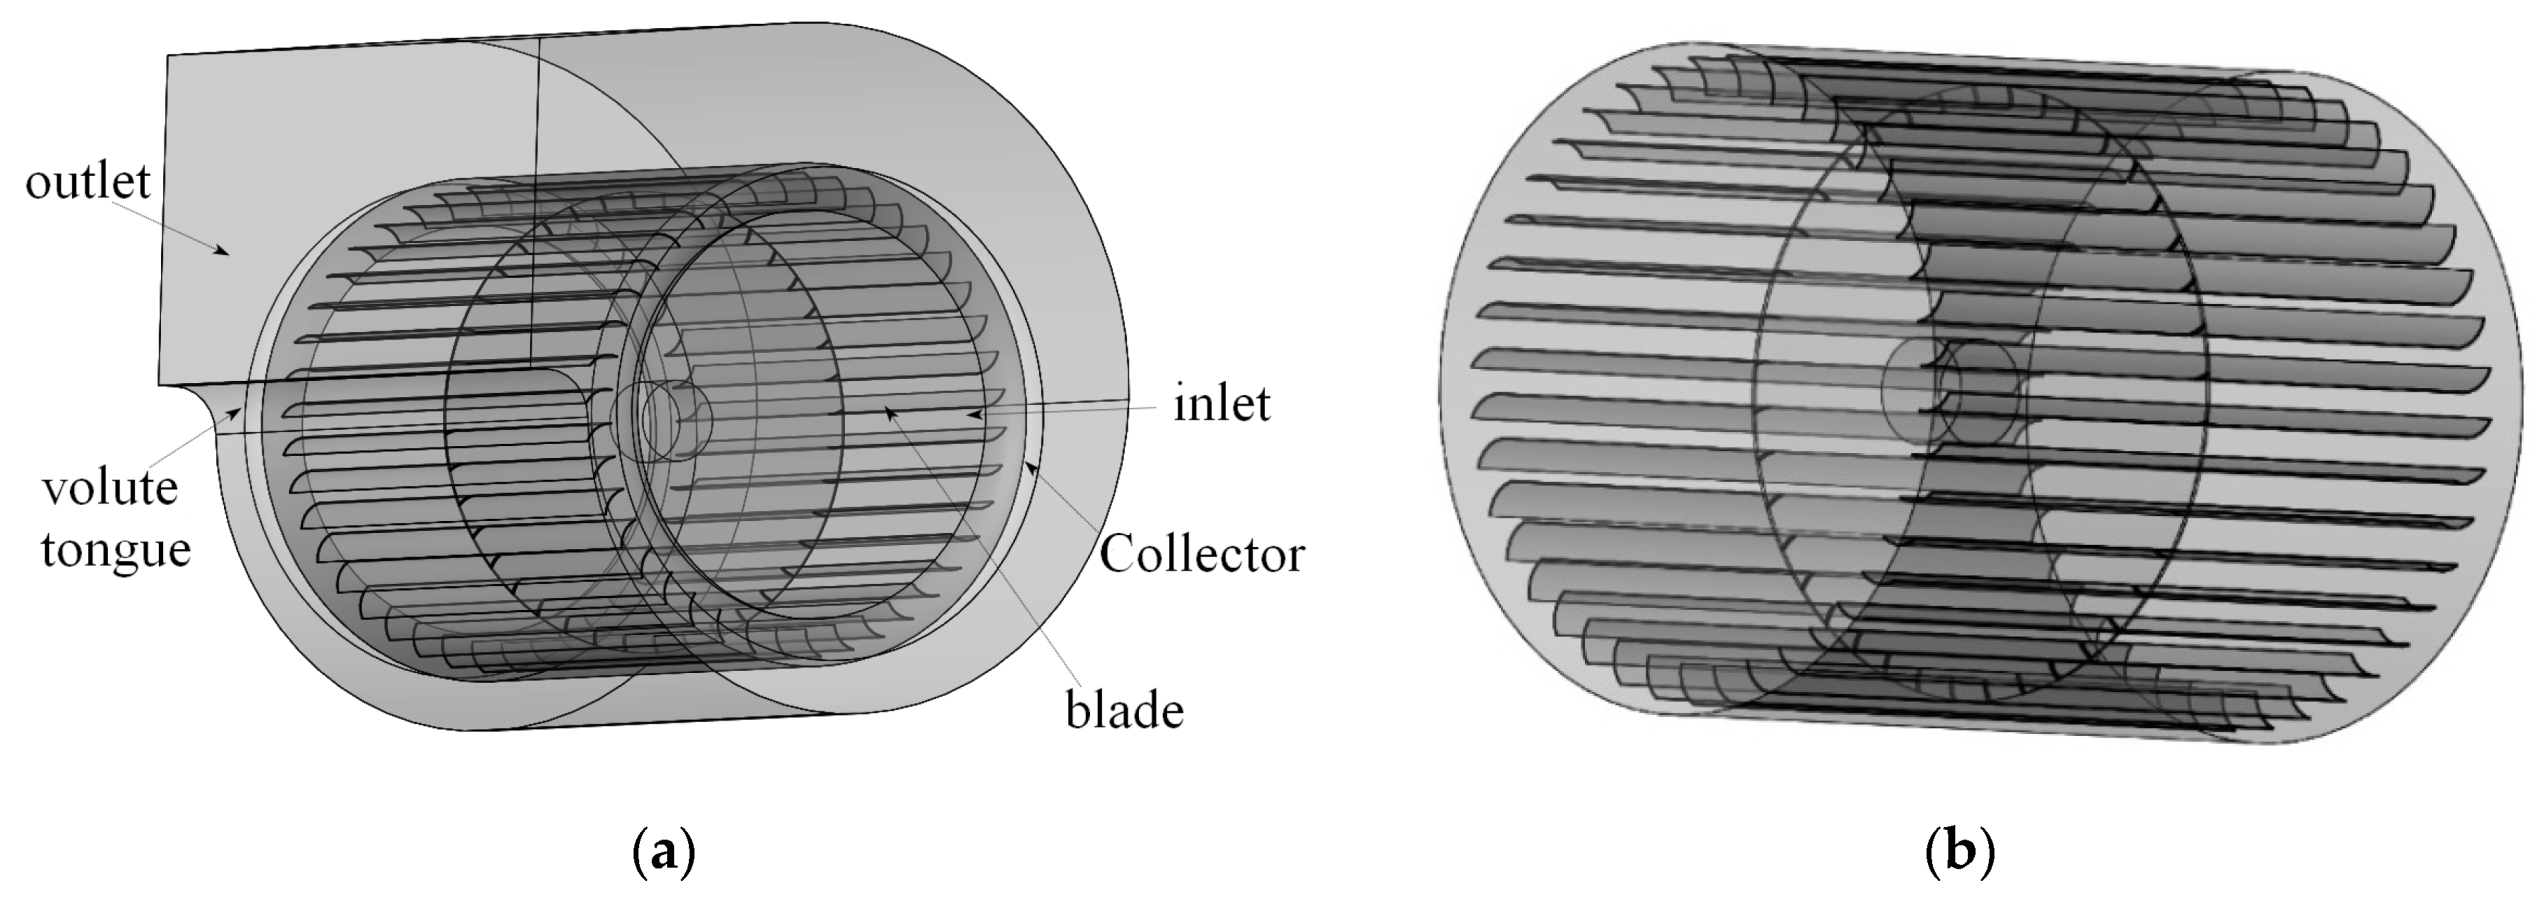
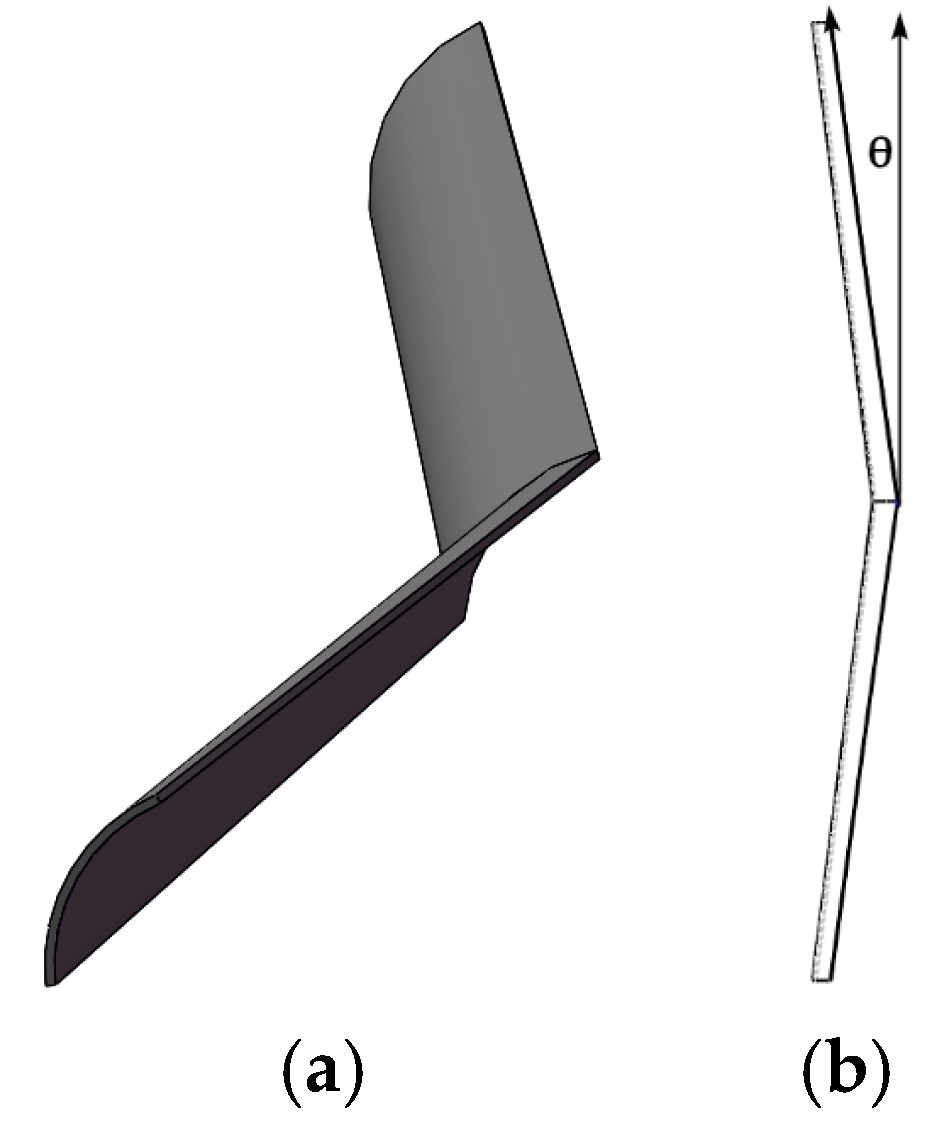
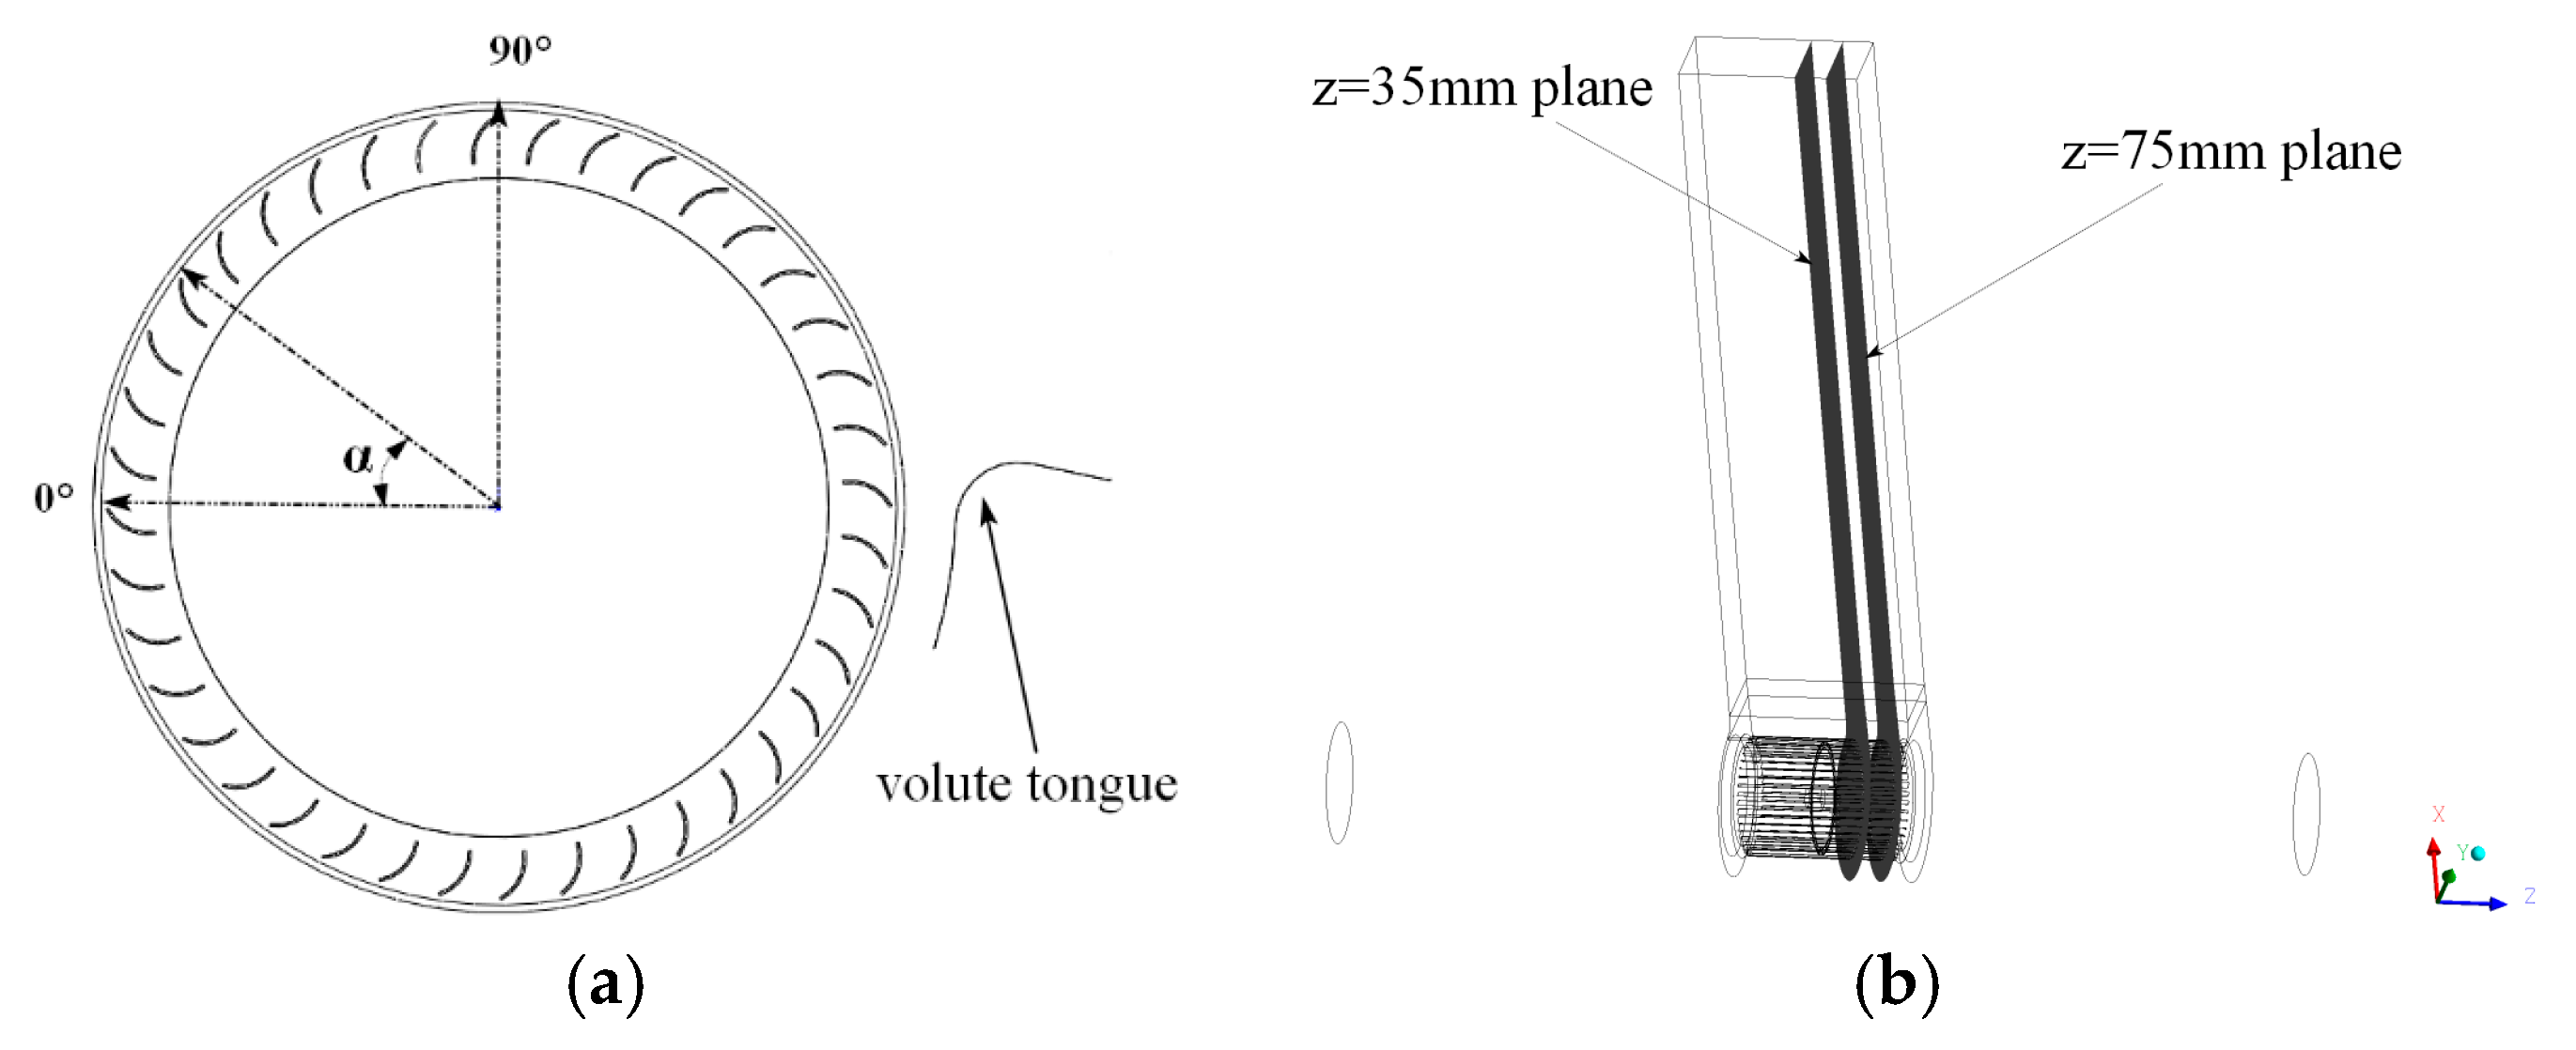
2.1. Baseline and Modified Models

Figure 1 shows the three-dimensional geometrical model of the baseline fan with forward curved blades, which included an impeller with 40 blades and the volute casing. The rotation speed of the impeller was specified at 1300 revolutions per minute, as driven by an electrical motor. The nominal length and diameter of the impeller were 200 mm and 150 mm, respectively, as listed in Table 1, along with other design specifications. The baseline model of the fan was characterized by the straight blades along the axial direction.
Figure 2 shows the geometry of the modified impeller with backward-inclined blades. The inclination angle (θ) was defined and represented by the angle between the inclined blade and the vertical plane, as shown in Figure 2. The length and diameter of the modified impeller were consistent with the baseline model. The other components of the fan remained unchanged.

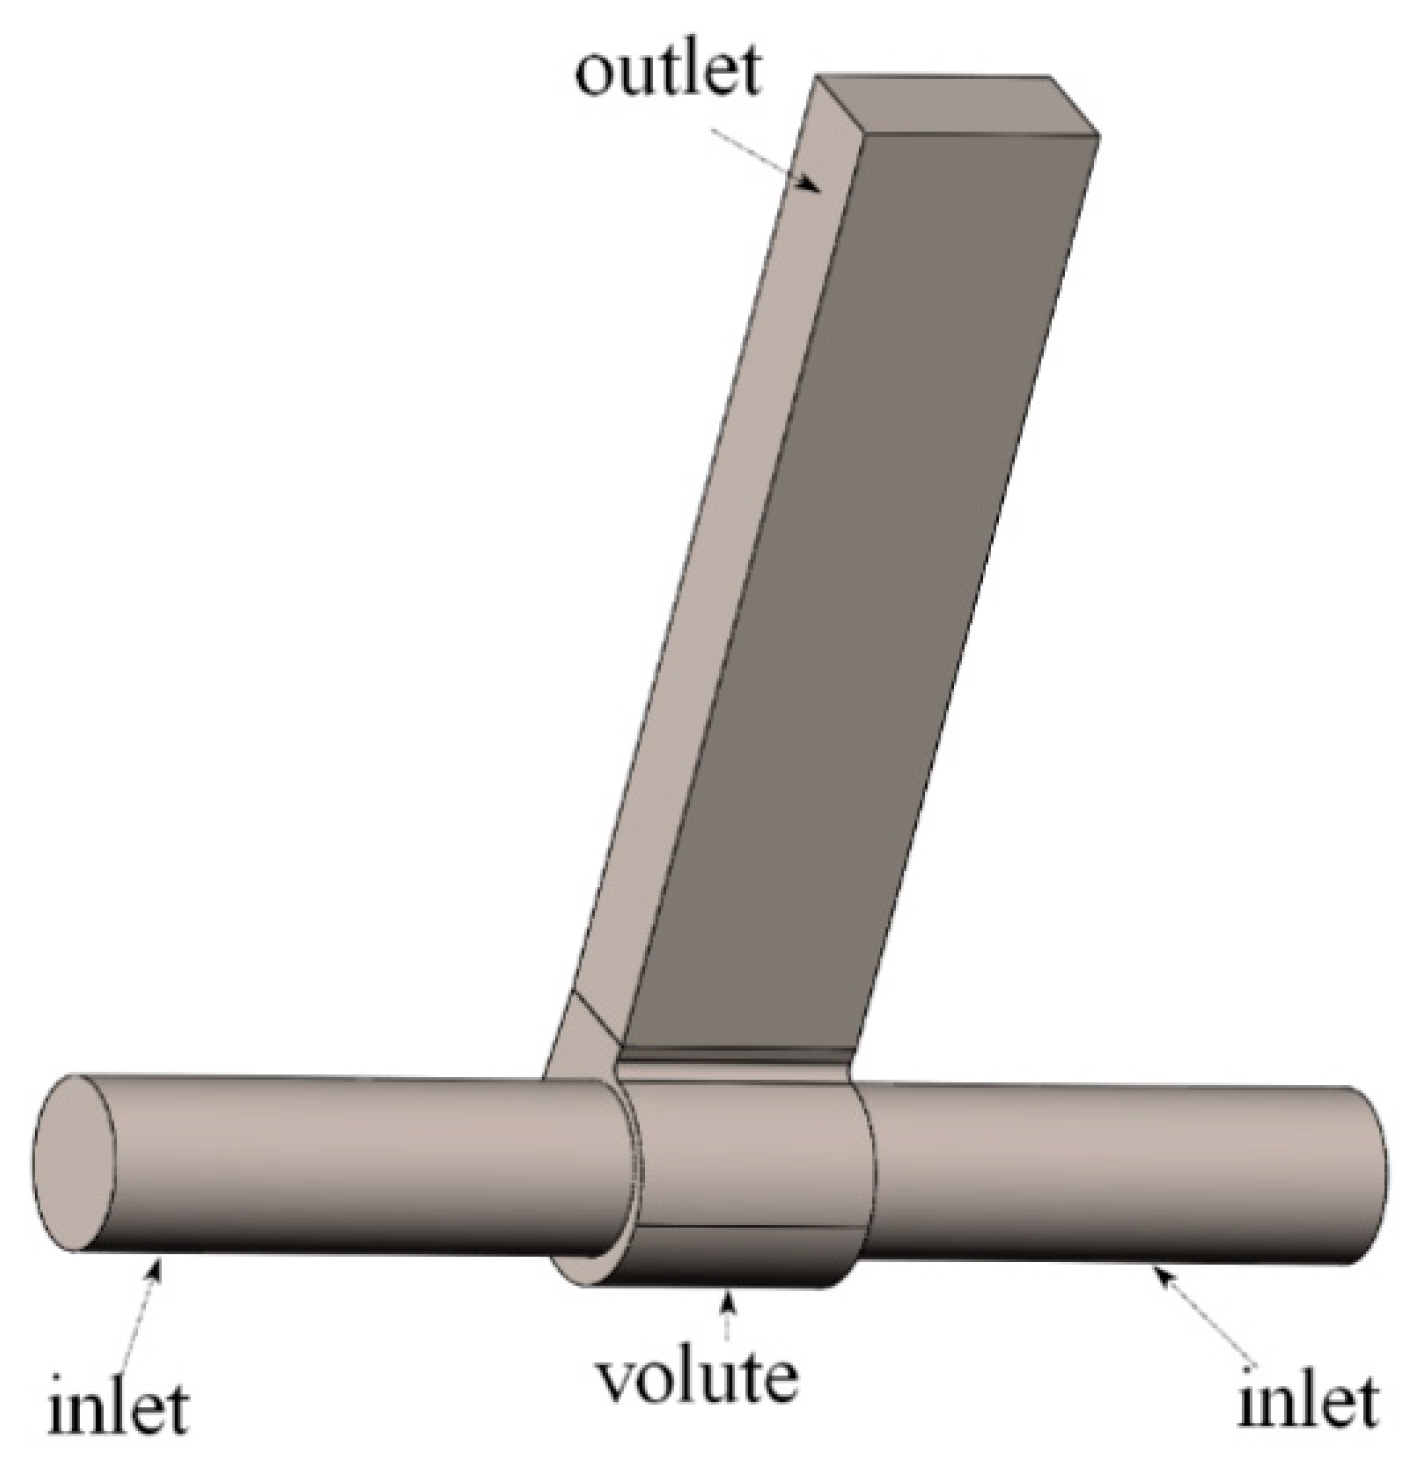
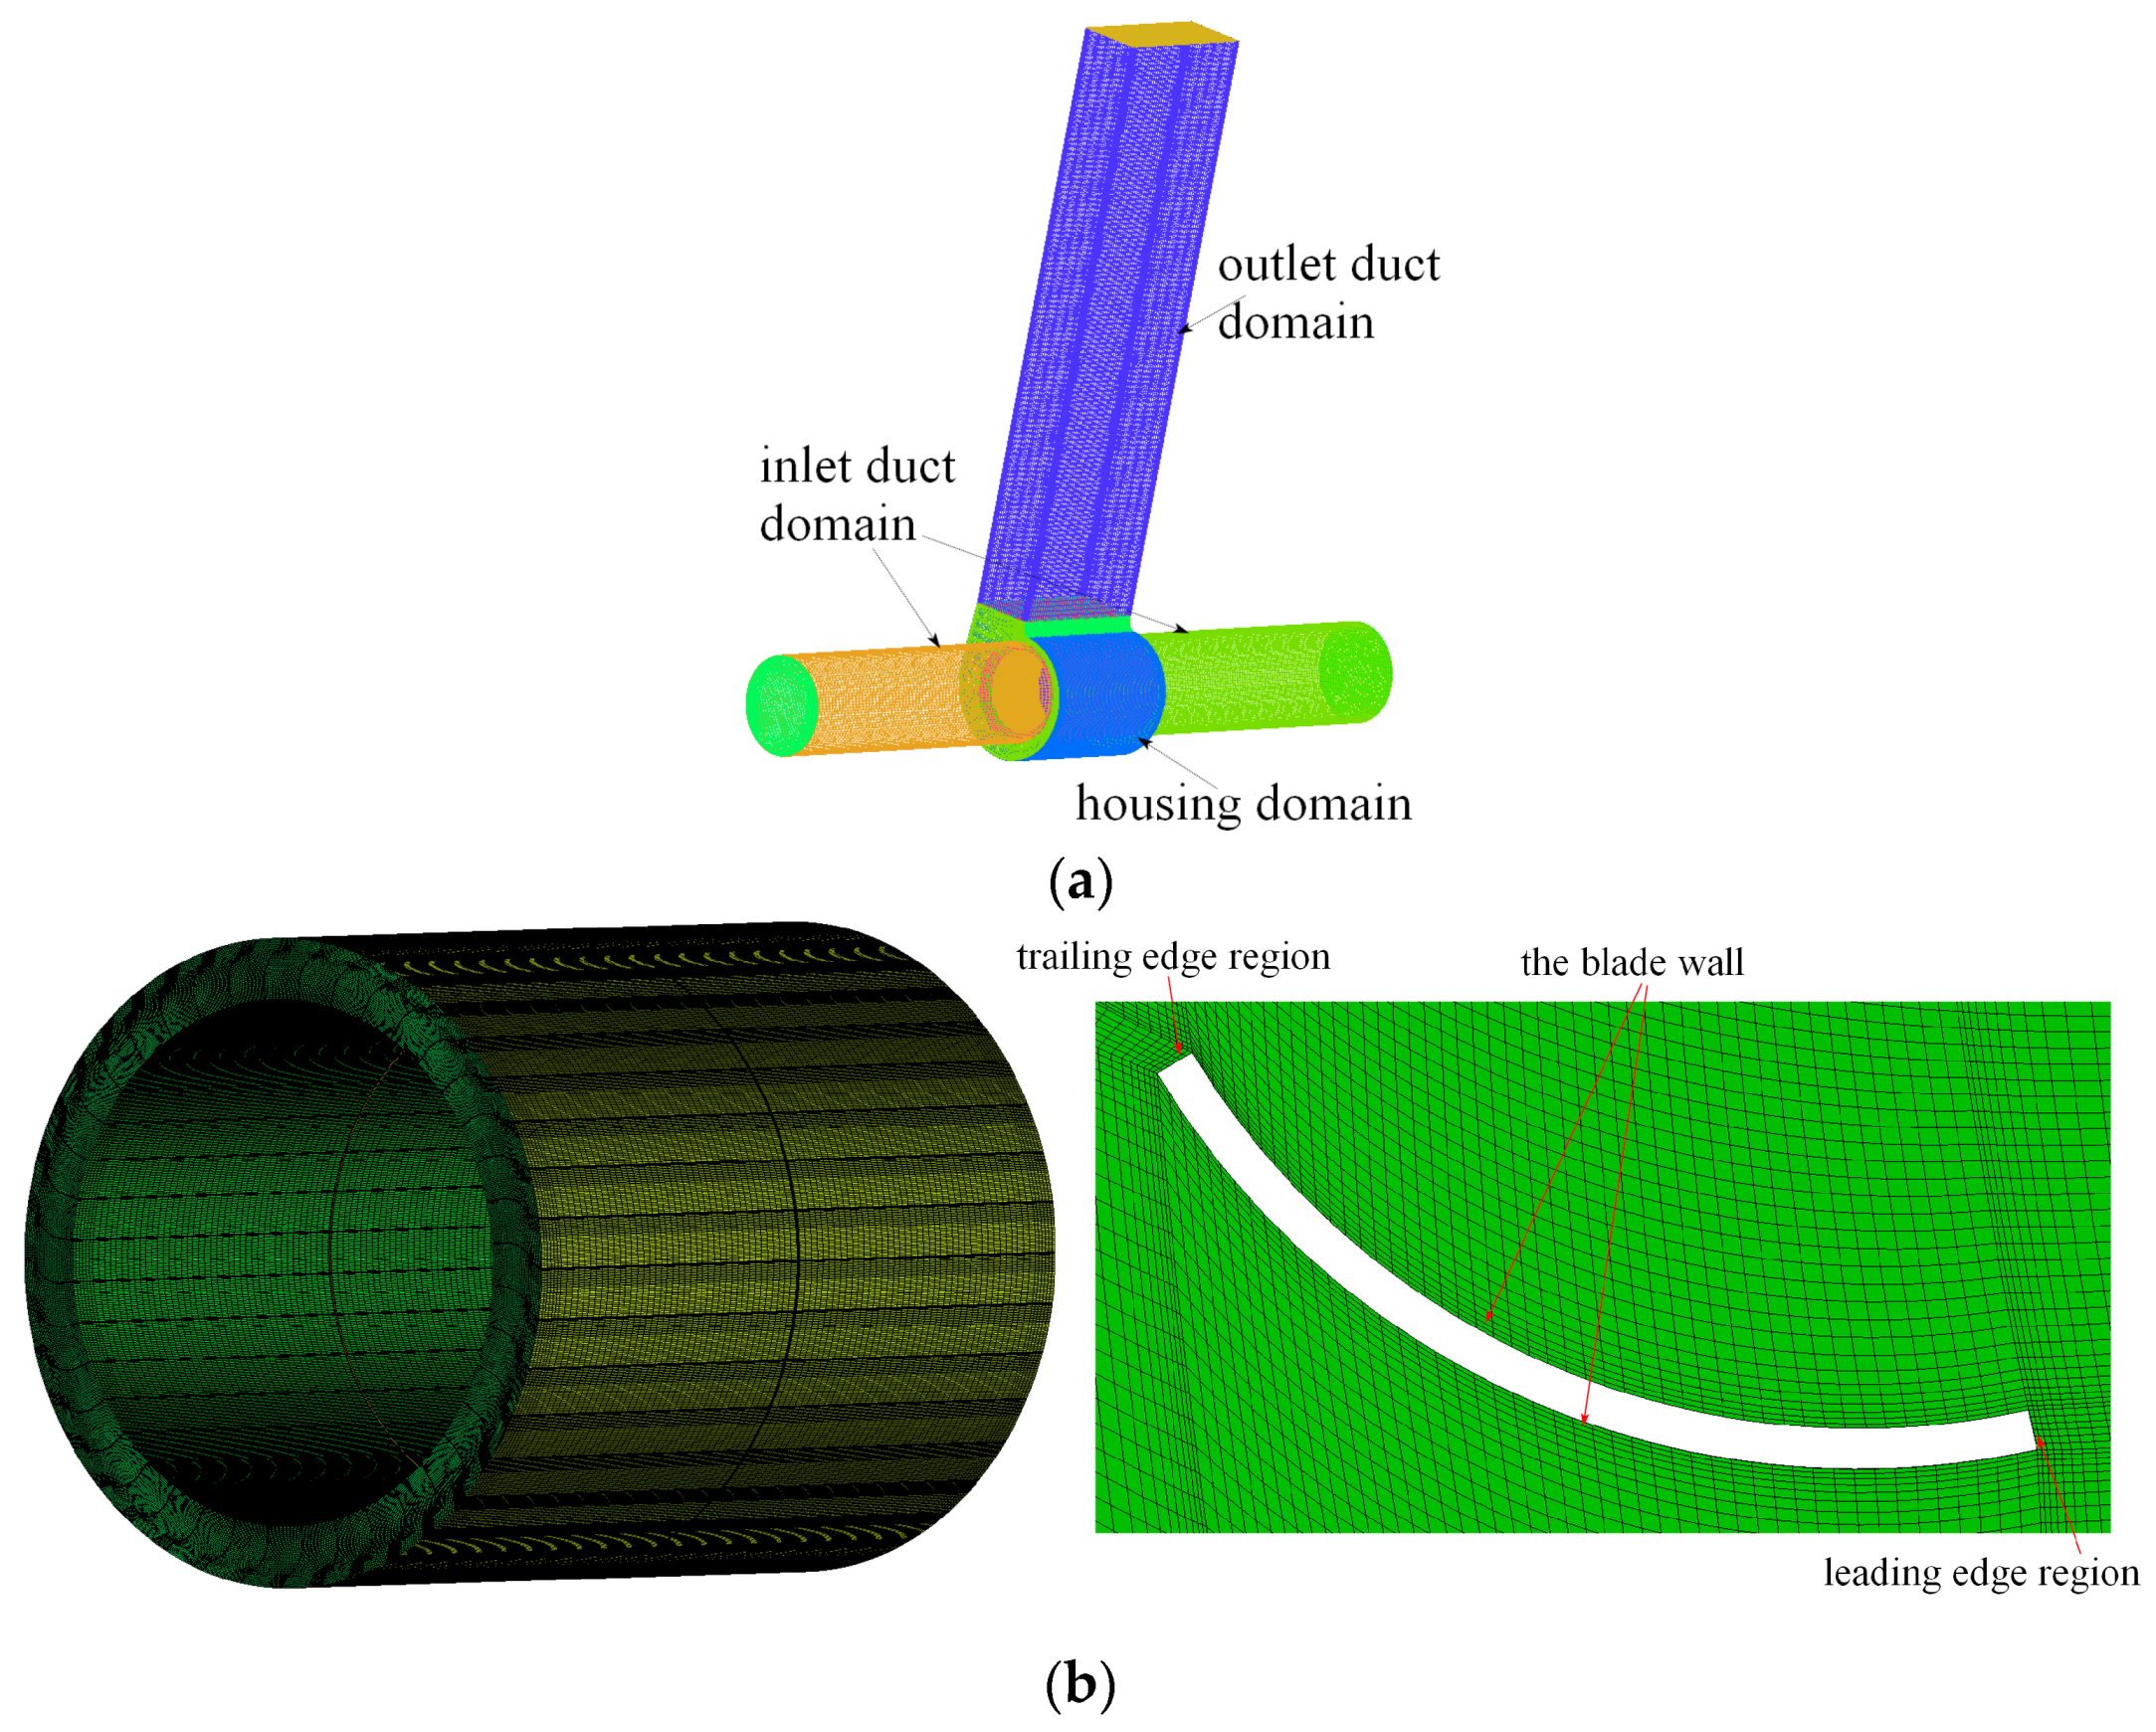
2.2. Numerical Simulation Method

The pattern of fluid flow in centrifugal fans is governed by the Navier–Stokes equation, expressed as:
( ρ u i ) x i = 0 ,
( ρ u j u i ) x j = f i P * x i + [ μ ε ( u i x j + u j x i ) ] x j ,
where xi and xj are the components of the Cartesian coordinate system in three directions x, y, and z; ui is the velocity component u, v, w; P* represents the conversion pressure (including turbulent energy and centrifugal force); the volume force component is fi; the effective viscosity coefficient is με. The RNG k-ε model was applied to consider the turbulent flow:
μ ε = μ + μ t
μ t = ρ C μ k 2 ε ,
in which the molecular viscosity coefficient is μ and turbulent eddy viscosity coefficient is μt. The RNG k-ε turbulence model includes equations for turbulent energy and dissipation:
t ( ρ k ) + x i ( ρ k u i ) = x j ( α k μ e f f k x j ) + G k + G b ρ ε Y M + S k ,
t ( ρ ε ) + x i ( ρ ε u i ) = x j ( α ε μ e f f ε x j ) + C 1 ε ε k ( G k + C 3 ε G b ) C 2 ε ρ ε 2 k R ε + S ε ,
R ε = C μ ρ η 3 ( 1 η / η 0 ) 1 + β η 3 ε 2 k ,
where Gk is the turbulent energy generated by the laminar velocity gradient; Gb is the turbulent flow energy generated by buoyancy; YM is fluctuations in transitions in compressible turbulence; C1ε, C2ε and C3ε are constant; αk is the turbulent Prandtl number of the k-equation; αε is the turbulent Prandtl number of the ε-equation; Sk and Sε are user-defined quantities.
A steady-state simulation adopting ANSYS-Fluent was performed for the fan. The mass flow rate and the pressure boundary conditions were separately set at the inlet and outlet boundary of the computational domain. Air at 25 °C was used as the working fluid. Therefore, the aerodynamic loads were the main sources of loading. The RNG k-ε model was used with the standard wall function adopted near the wall, which could provide a reliable prediction for the wall-bounded flow, and the wall distance y+ for the first layer node at the wall was around 15. The governing equations were discretized by the finite volume method; the convection term was treated by the second-order upwind scheme and the diffusion term by the second-order central difference scheme. No slip boundary condition was applied to the wall. The pressure and velocity coupling method was the SIMPLE algorithm. The multiple reference frame model (MRF) was set up to exchange of information between the rotating and the stationary domains. The residual of the iteration was set to 105 for the mass, momentum, and energy equations.

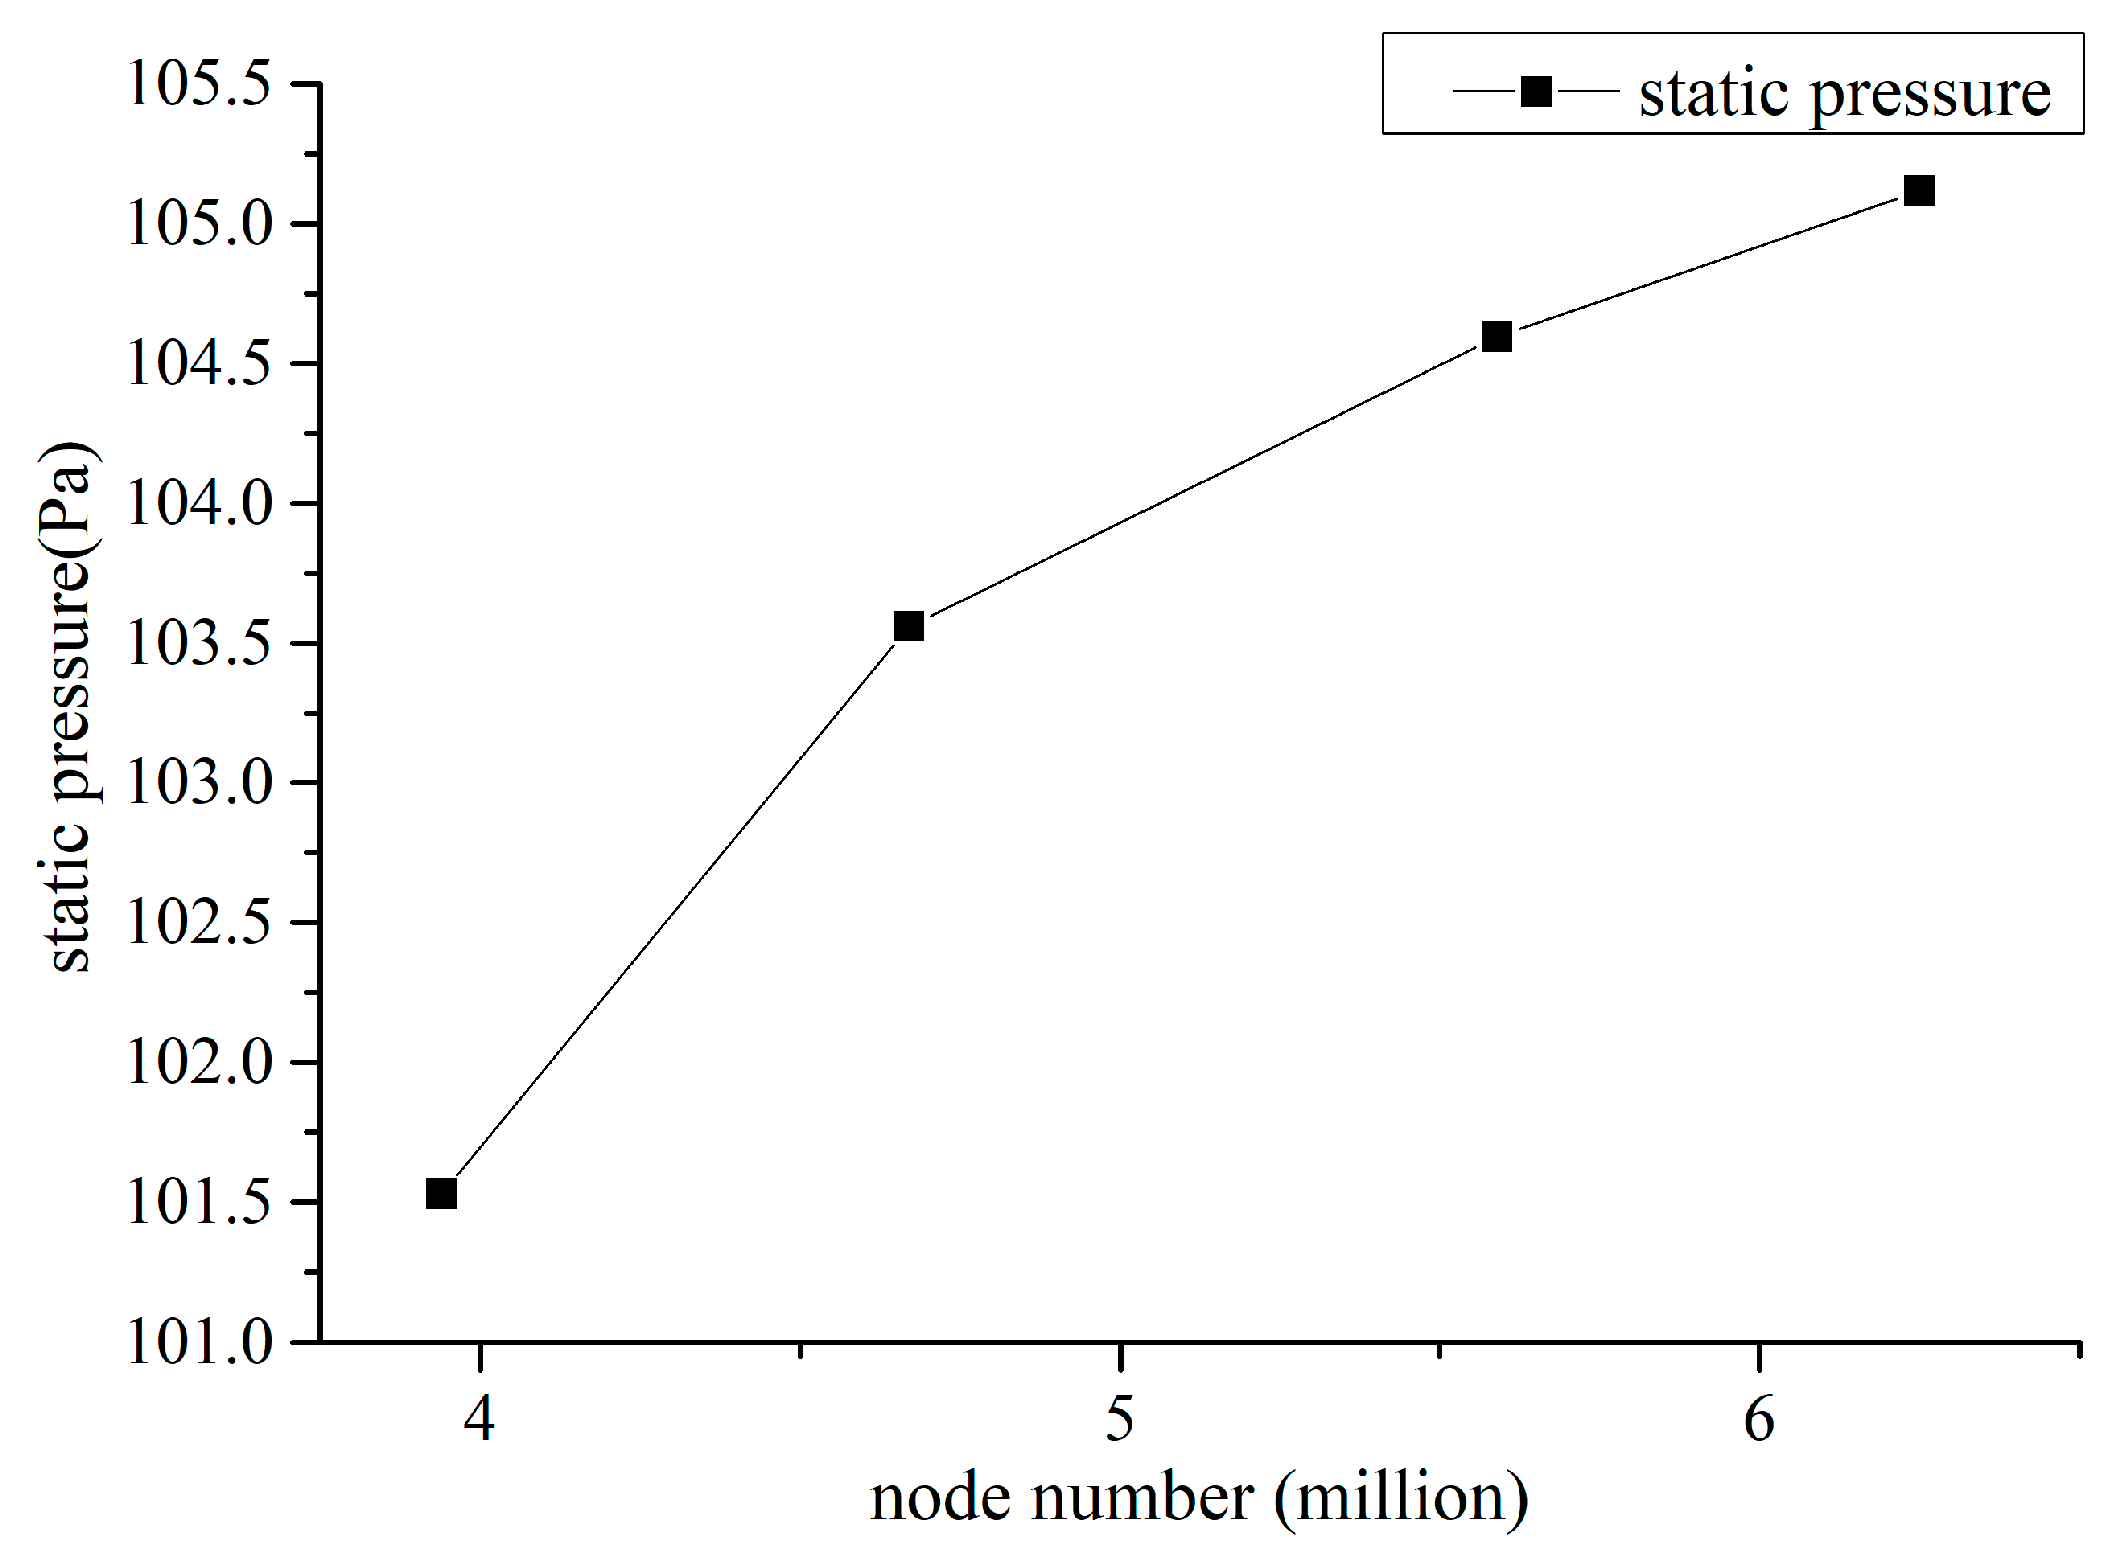
2.3. Node Independence Study

The computational domain for the model included the interior part of the centrifugal fan, as shown in Figure 3. There was one rotating domain for the impeller and four stationary domains, including two inlet ducts, a volute, and an outlet duct. The computational domain was spatially discretized using a structured grid [21]. The schematic of the nodes for the computational domain is shown in Figure 4. The impeller and volute were the key areas for analysis where the node density is larger than other regions. The node density of the surfaces of impeller was larger than that in the interior of the volute. The node in the computational domain was refined in the boundary regions; the node was refined at the surface of the impeller and volute. The number of nodes of computational domain used in the simulations is listed in Table 2.
In order to guarantee that the current number of nodes was sufficient to obtain accurate results, the node independence analysis was further carried out to assess the impact of node number on the numerical simulation results. The node was varied mainly for the impeller. Four nodes were used at flow rate Q = 321.6 m3/h and speed n = 1300 rpm, with 3.94 million, 4.72 million, 5.64 million, and 6.31 million nodes. Figure 5 presents the variation in the static pressure of the fan with the node number. The static pressure obtained using 5.64 million nodes was only 0.6% lower than that of 6.31 million nodes, thus it was deemed sufficient and was used in the following simulations. The total number of nodes was around 7.5 million, including those for the stationary domains. And the grid quality was good enough to predict the internal flow structure and external characteristics of the centrifugal fan.

3. Results and Discussion

3.1. Validation against Experimental Results

In this section, we compare the numerical results for the baseline model with those obtained by the experiment to validate the accuracy of the numerical simulation. The variations in static pressure and efficiency with flow rate are shown in Figure 6. For the static pressure, there was a certain deviation between the numerical and experimental results at small (Q/Qn = 0.483) and rated flow rates (Q/Qn = 1.000), while the two values were quite in consistent under high flow rate conditions. For the static pressure efficiency, there was a certain deviation between the computed and the experimental results at rated and high flow rates (Q/Qn = 1.760); however, the results of the simulation and experiment were quite consistent at other flow rates, and the variation trends of both results were the same. The results show that the maximum deviation between numerical and experimental results was less than 6.9% for the static pressure and was less than 4.6% for the efficiency. It is concluded that the steady simulation results were generally in agreement with the experimental results, and the computed results can provide a useful reference for the design of the actual fan.
The efficiency describes the performance of the fan η, which is defined as:
η = 30000 P Q 3600 × 10 3 π T n ,
in which P, Q, T, and n represent static pressure (Pa), flow rate (m3/h), torque (N*m), and rotation speed of the impeller (rpm), respectively.
The impellers with blade inclination angles of 3.5°, 7.0°, and 10.5° were denoted as model-A, model-B, and model-C, respectively. Through numerical simulation and analysis, the aerodynamic performances of fans with the three types of impellers were obtained. Figure 7 shows the effect of inclination angle on the static pressure and efficiency. The curves of the static pressure of model-A (θ = 3.5°) and model-C (θ = 10.5°) were close to that of baseline fan for the majority of the whole range of flow rate, which reflects that the static pressure of the fan was only increased slightly. However, model-B (θ = 7.0°) is preferred for increasing the static pressure for both medium and high flow rates, whereas the values were less than that of the baseline fan for low flow rates. In particular, the static pressure of model-B increased significantly under high flow rates. Compared with the static pressure of the baseline model, it can be seen that under the high flow rate, the static pressure of model-B increased by 14.01 Pa. Figure 7b shows the effect of inclination angle on the static pressure efficiency (the efficiency of the motor is removed). It can be seen that for both medium and high flow rates, model-B produced increasing static pressure efficiency. However, the values were consistent with the baseline fan under low flow rates. Meanwhile, the static pressure efficiencies of model-A and model-C were slightly higher than that of the baseline fan for the majority of the working range. It was further found that under the rated flow rate, the improvement of the static pressure efficiency of model-B was up to 2.7%, and the improved static pressure efficiency of model-B rose as much as 9.35% at high flow rates compared with that of the baseline model.

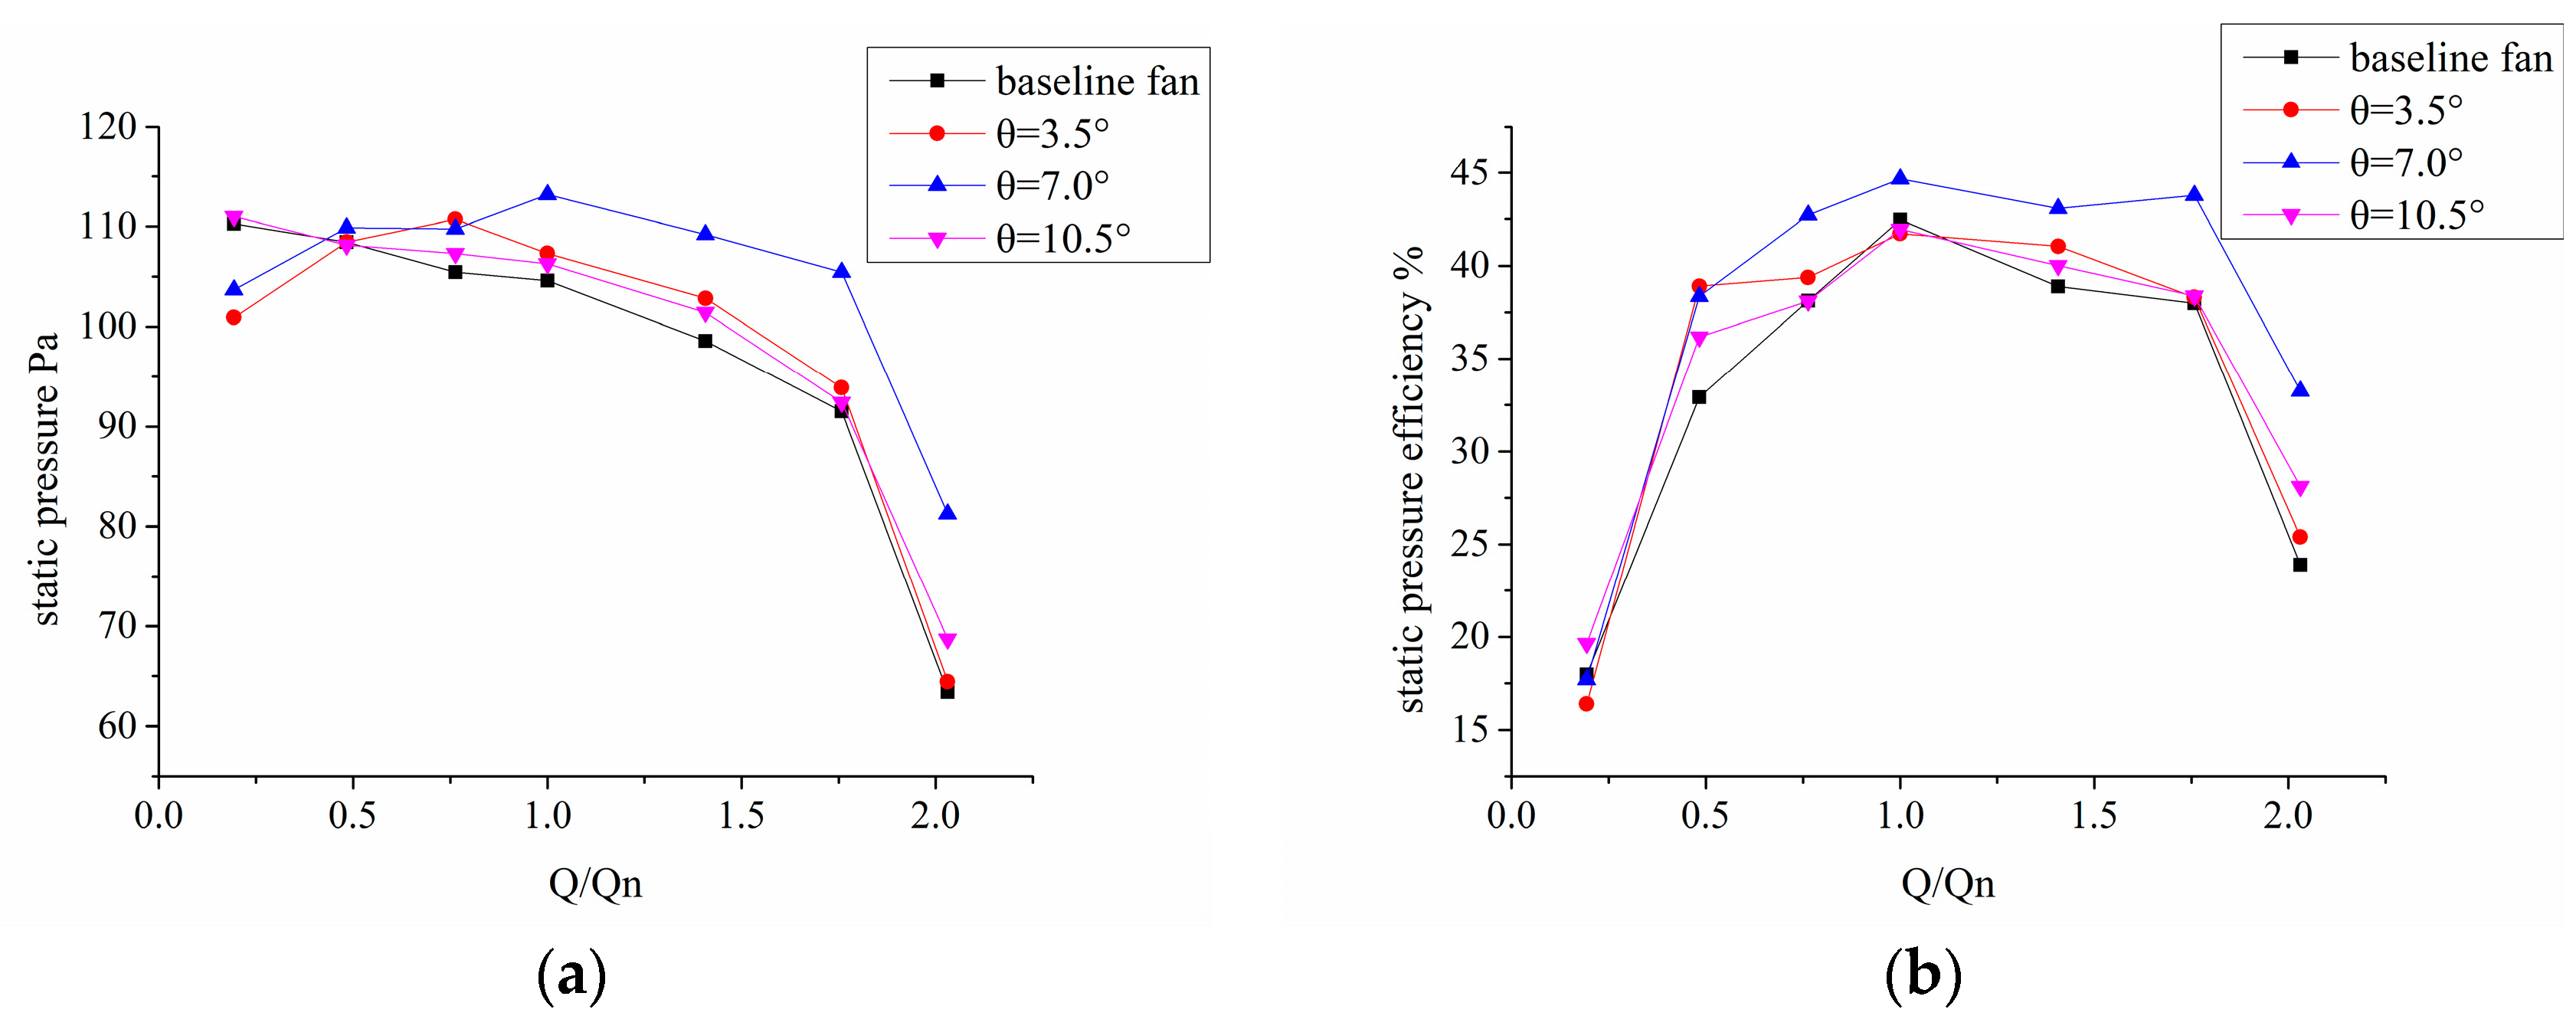
3.2. Qualitative and Quantitative Results

The numerical simulation results of the baseline and modified models were analyzed to reveal how the inclination angle of the blades affected the performance of the fans. The results of three sections of each fan under the condition of low flow rate Q/Qn = 0.483, rated flow rate Q/Qn = 1.000, and high flow rate Q/Qn = 1.760 were analyzed.

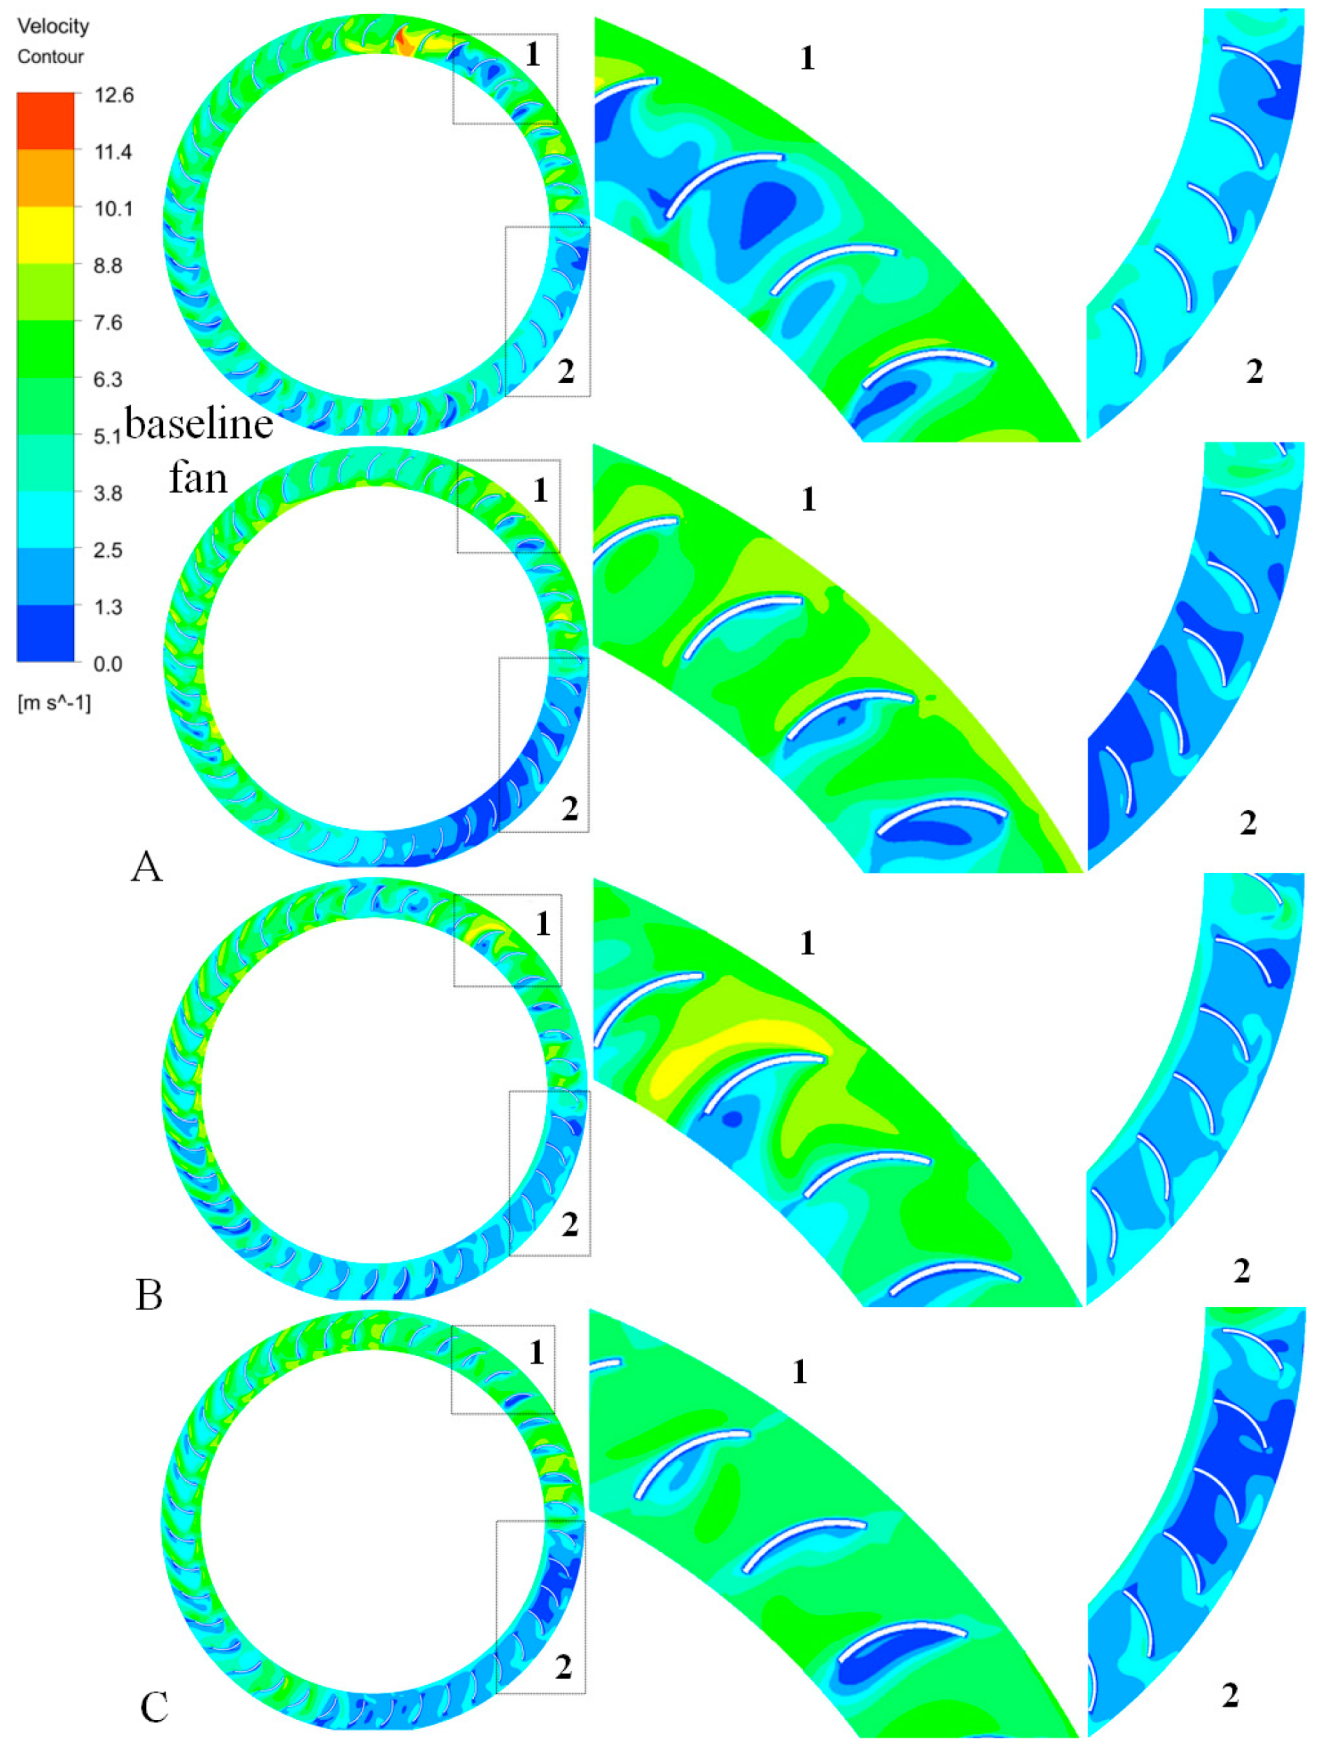
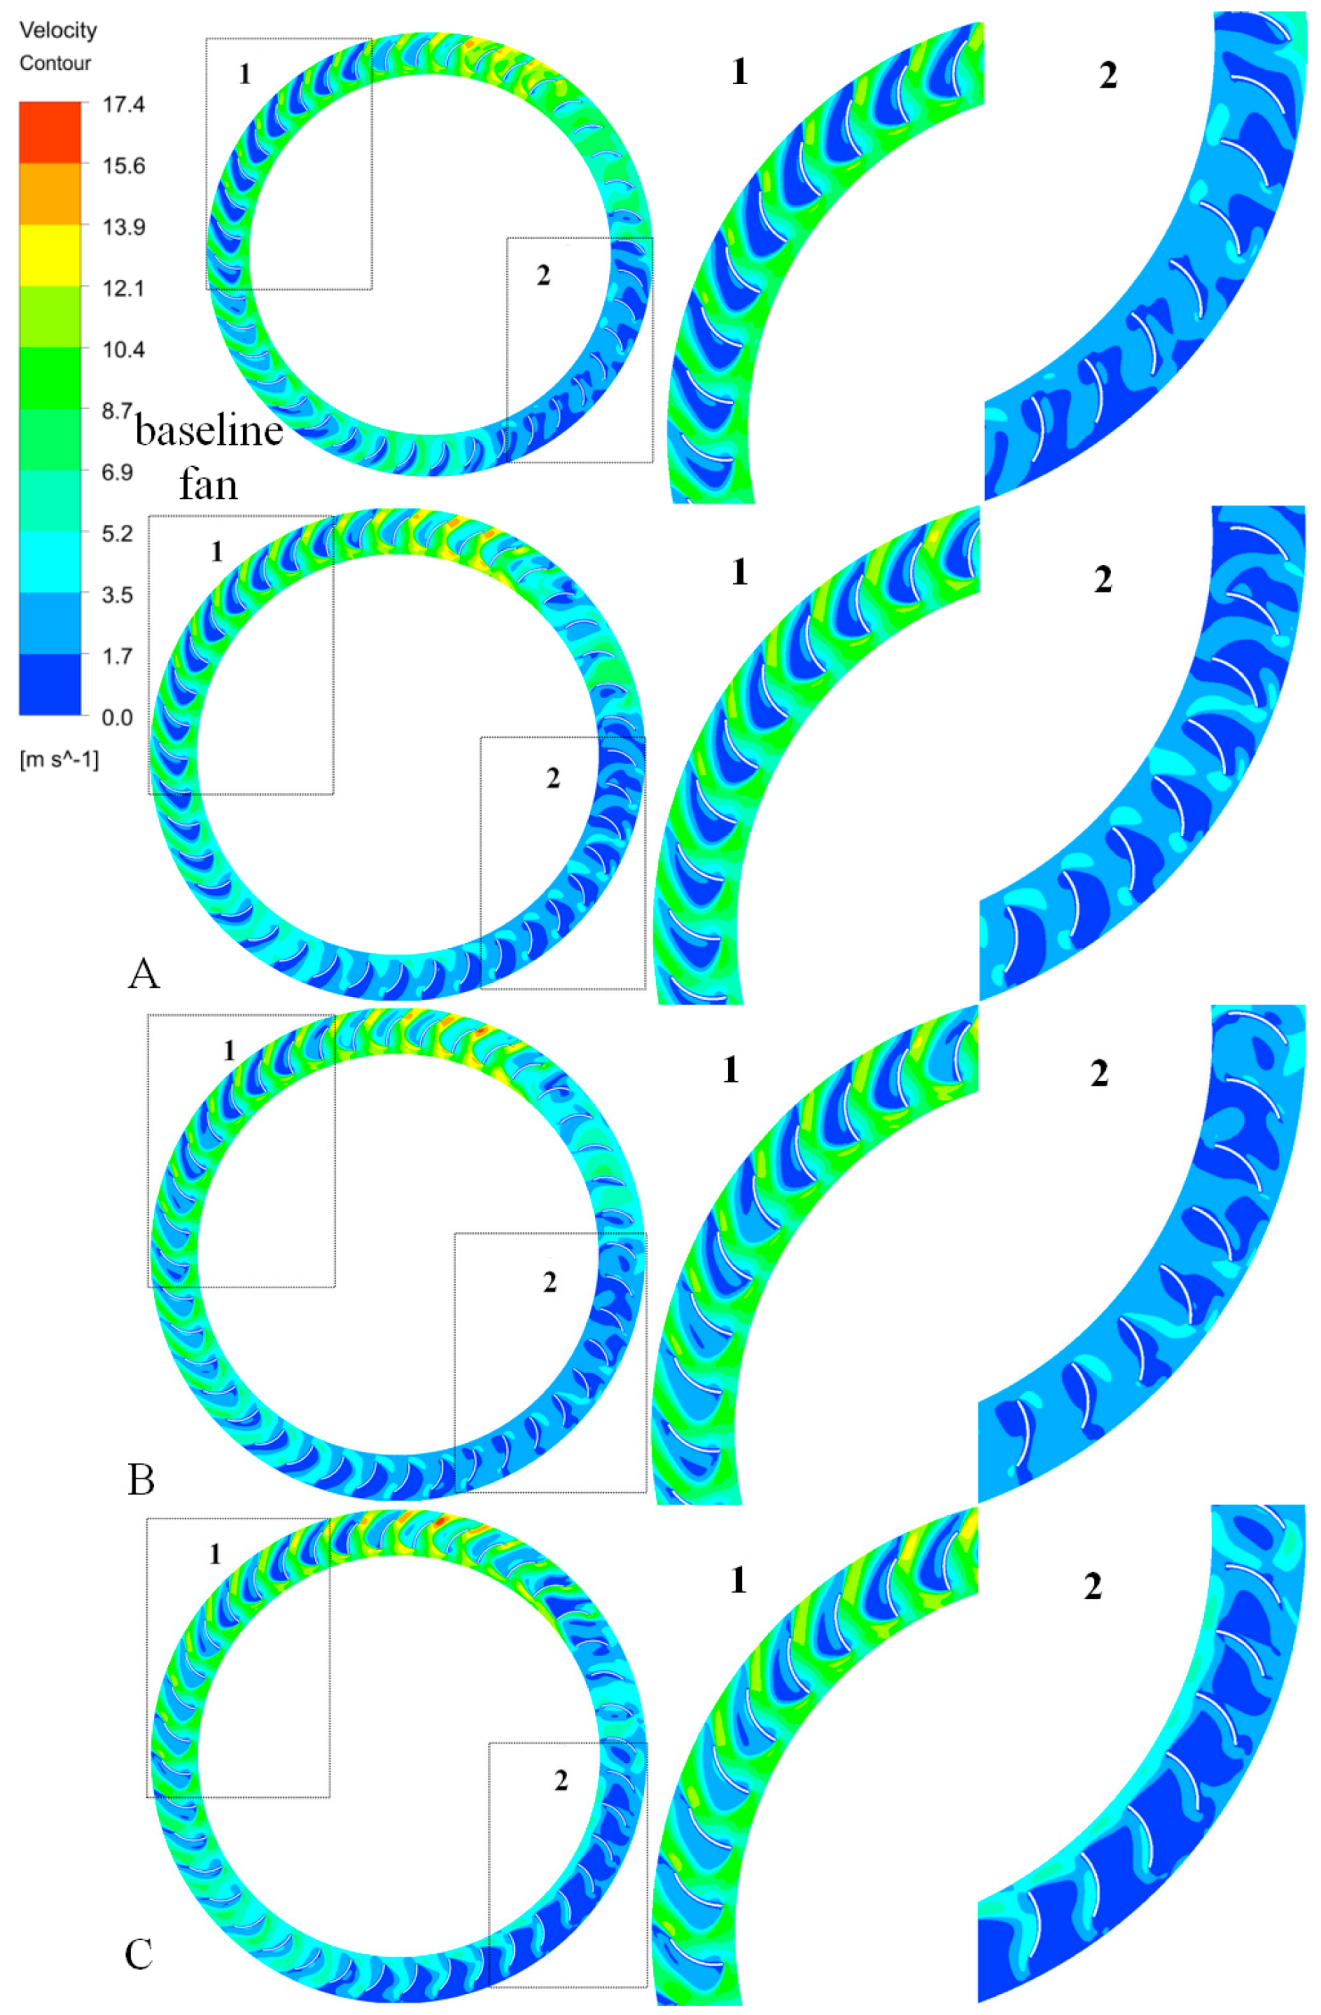
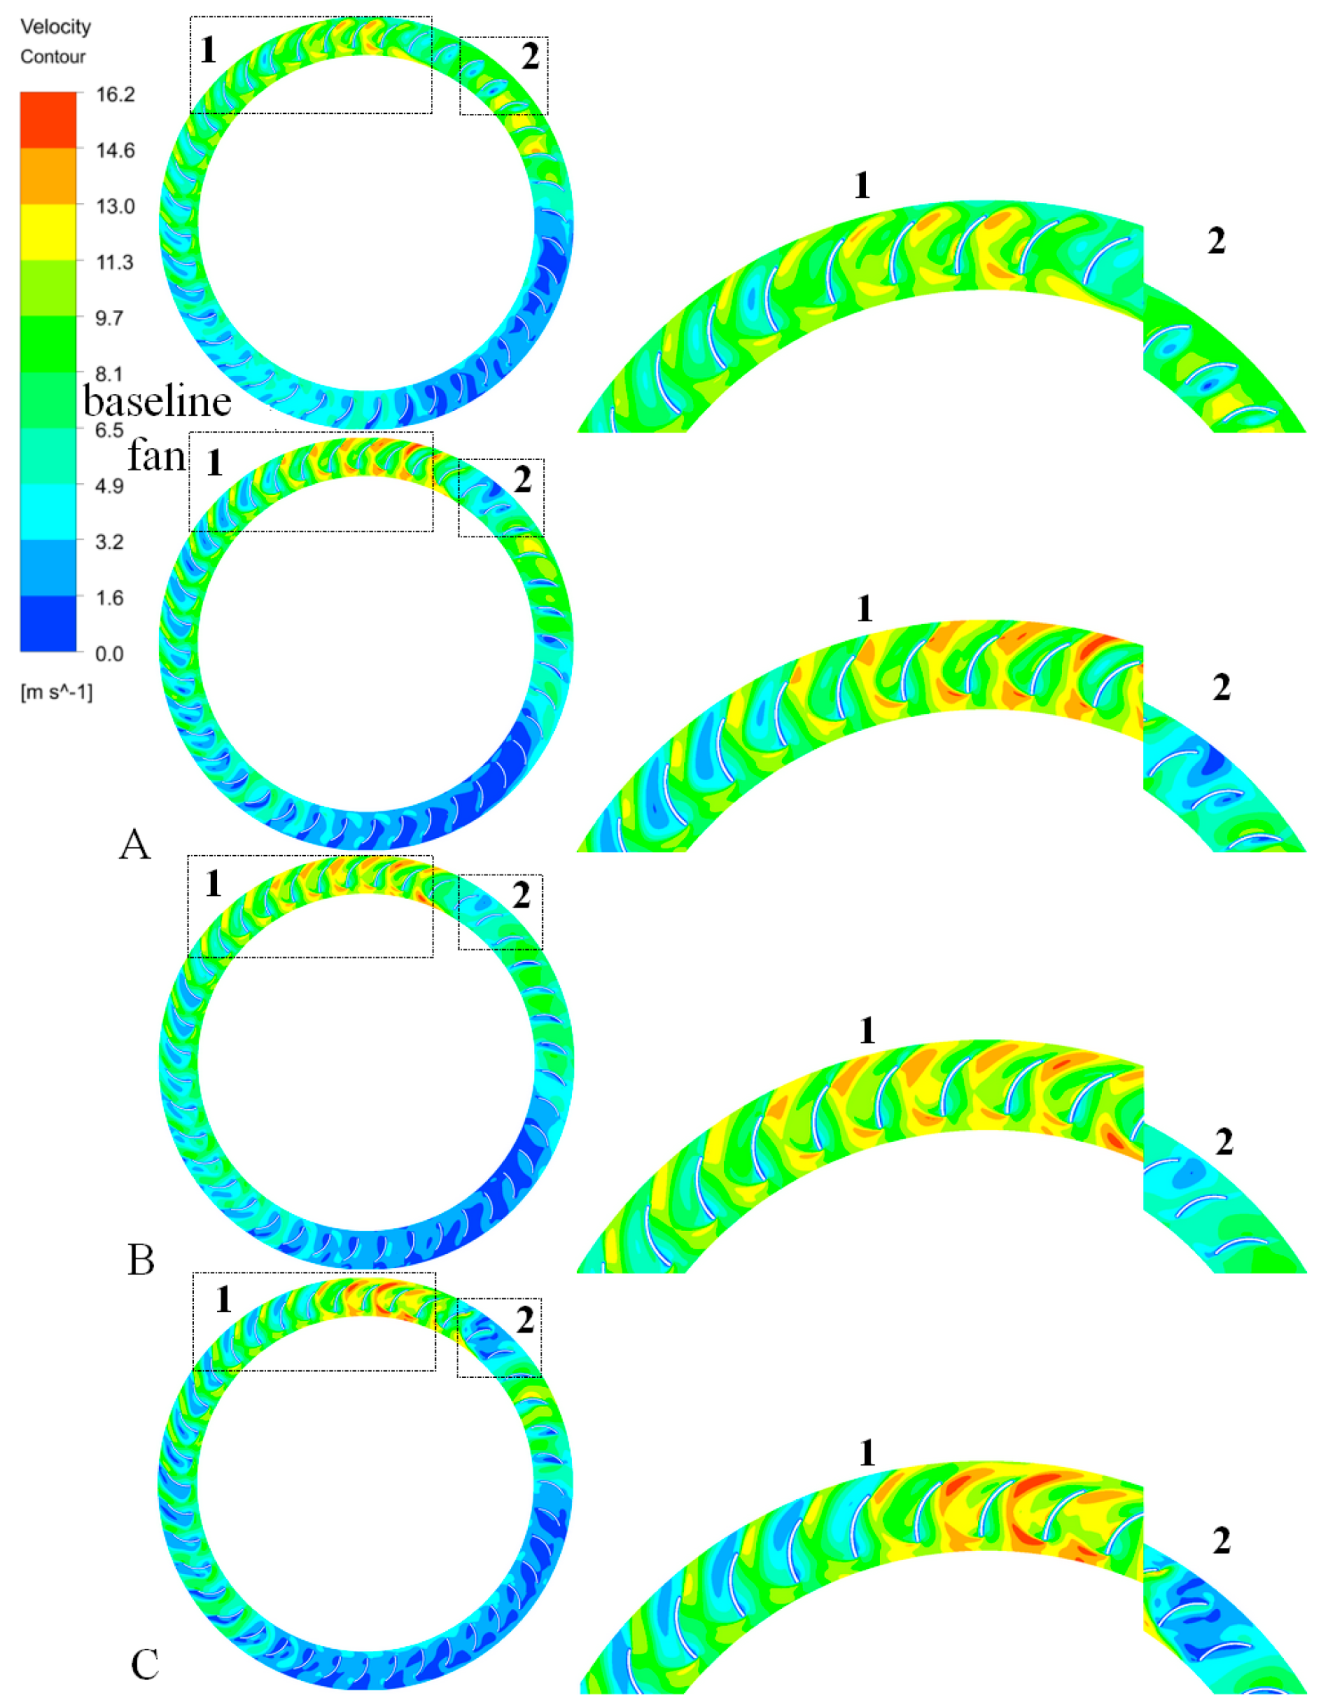
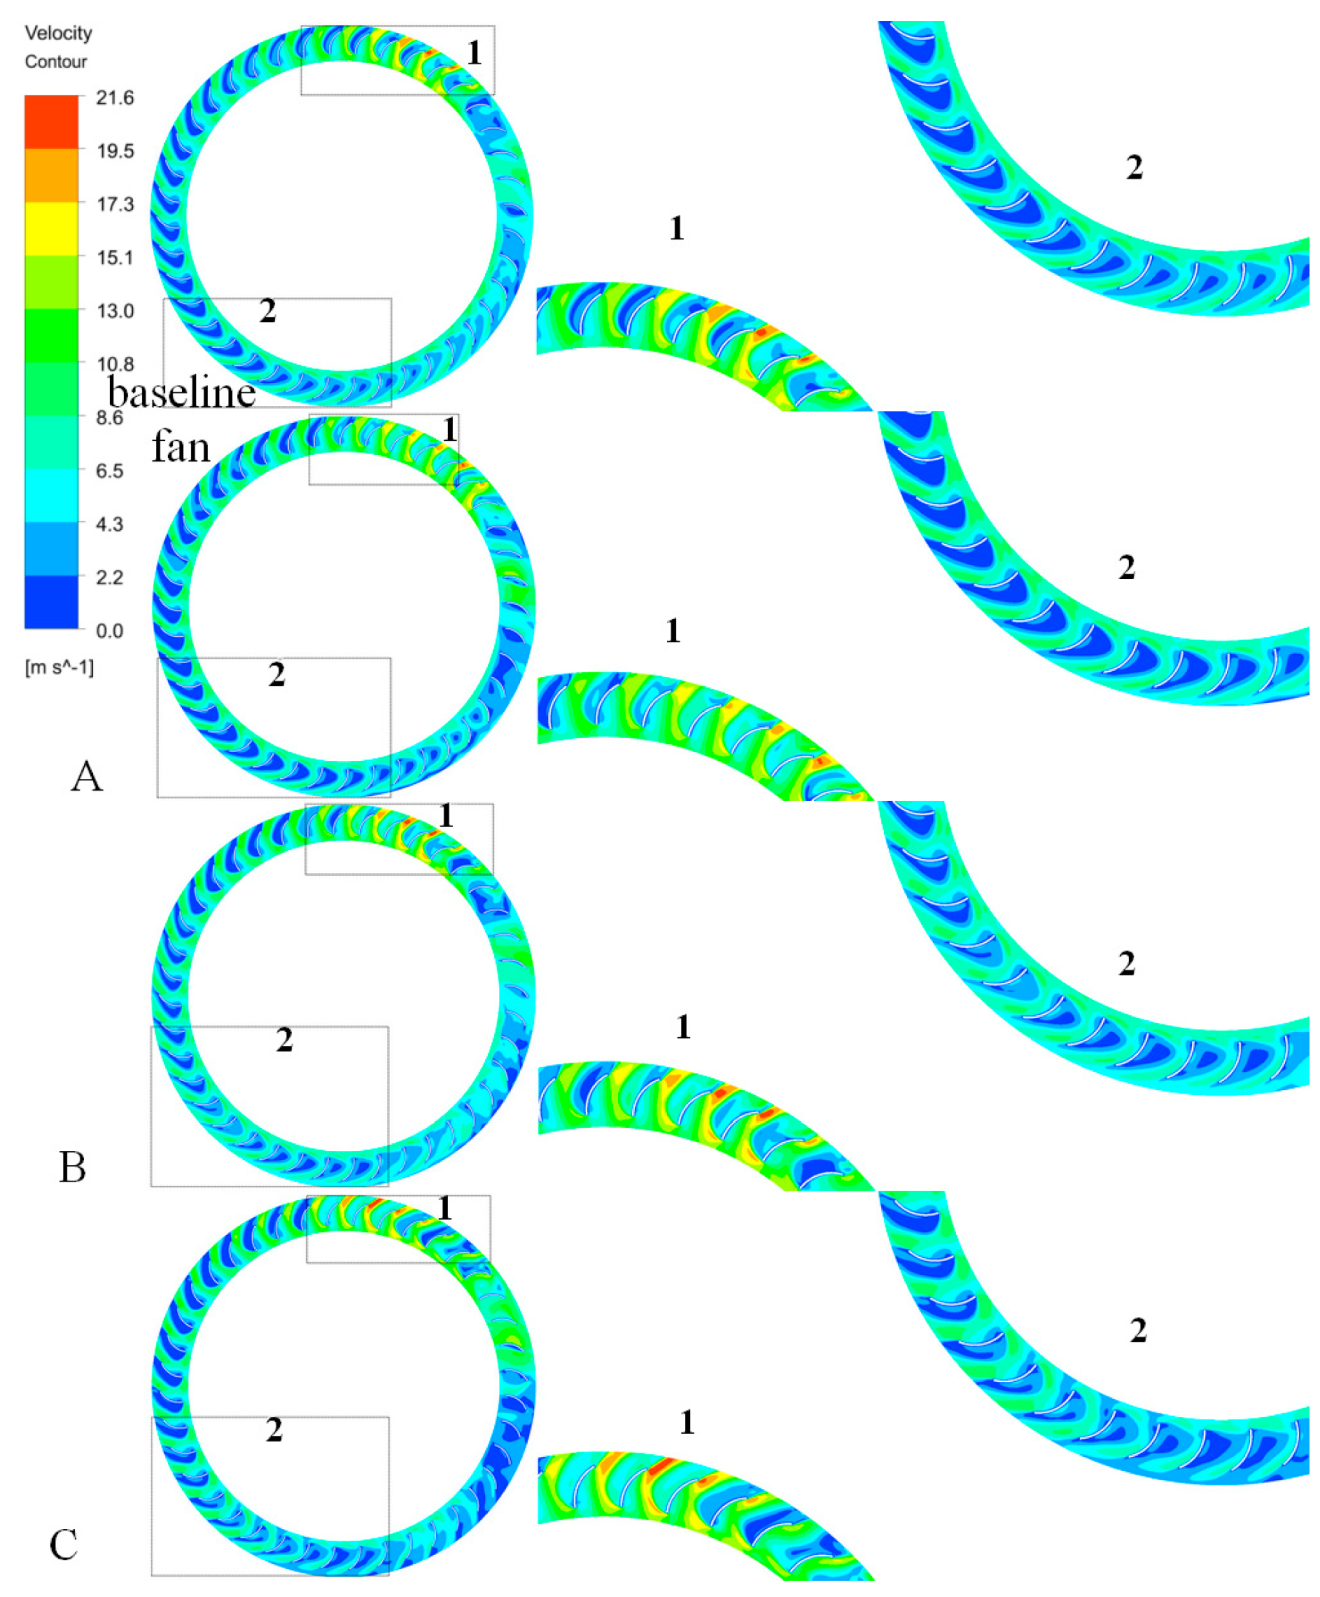
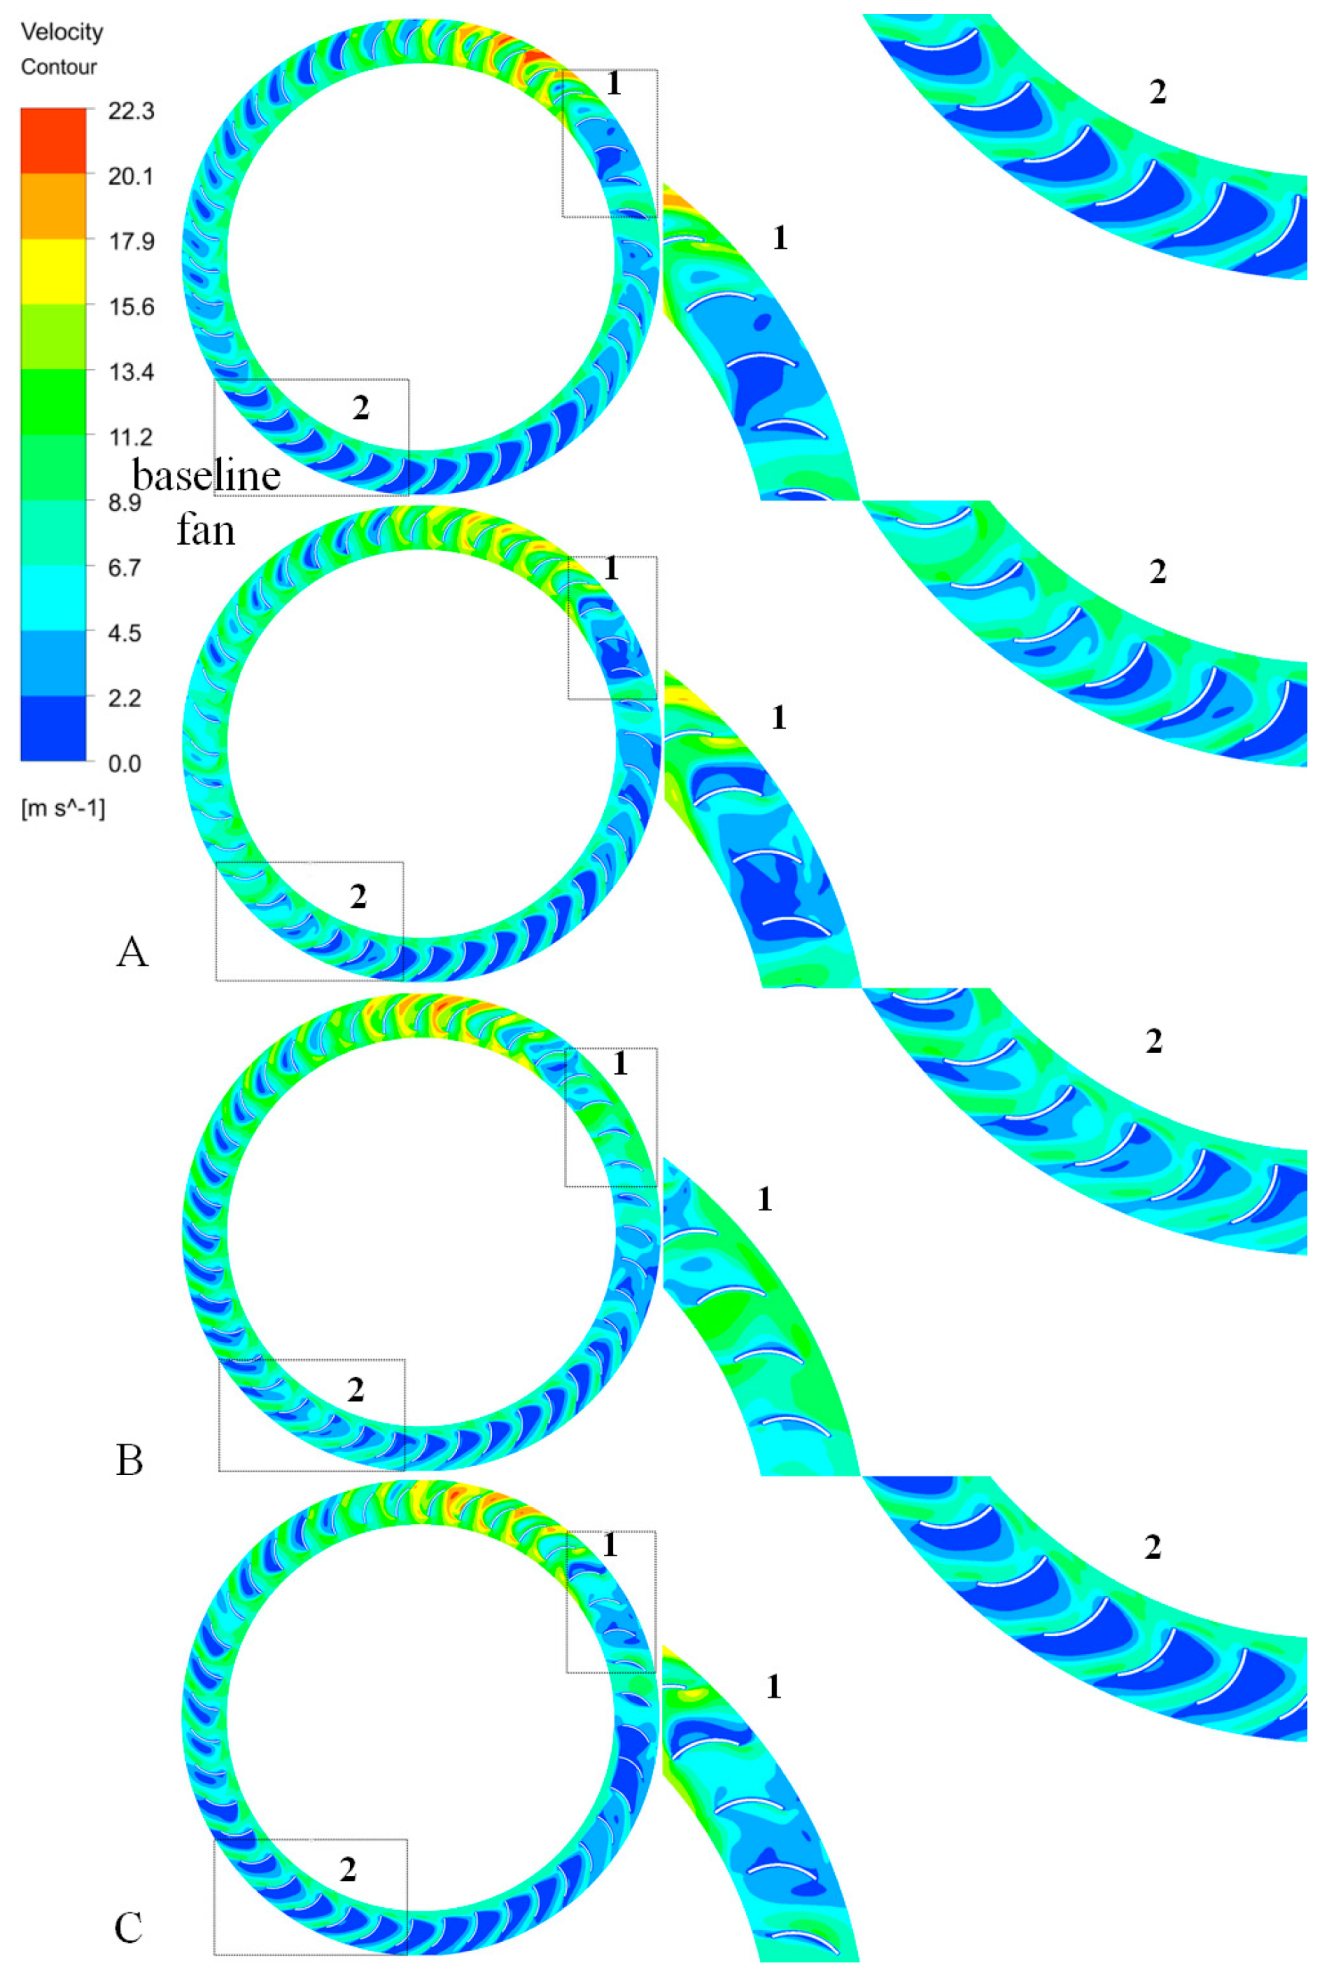
3.2.1. Velocity Distribution in the Impeller Passage

The definition of the angle α and the locations of the z = 35 mm and z = 75 mm planes are shown in Figure 8.
Figure 9 and Figure 10 show the distribution of absolute velocity for the impeller at the z = 35 mm and z = 75 mm planes for the baseline fan and model-A, model-B, and model-C under low flow rate Q/Qn = 0.483, respectively. In Figure 9, the velocity distribution of the baseline fan is given. The velocity distribution in the impeller passages was non-uniform along the circumference. From the velocity magnitude, the maximum velocity appeared at the circumferential position of α = 90°, and the velocity decreased with the increase in inclination angle in the range 90° < α < 150°. There was a great degree of flow separation in the lowest velocity region (as shown in the dotted line rectangle 1). Within the range of 180° < α < 270°, the flow separation was intensified, and vortices and recirculation appeared on the pressure surface of the blade. A distinct wake separation appeared on the suction surface trailing edge (as shown in the rectangular dotted line 2). For the region 270° < α < 360°, the vortices on the pressure surface of the blade gradually reduced and disappeared with the increase in inclination angle. The velocity distribution trend of the improved model was approximately the same as that of the baseline fan. Model-A shows that in the rectangular region-1, the vortices on the pressure surface decreased and flow separation occurred at the front edge of the suction surface; in the rectangular region-2, the flow separation mainly occurred at the front edge of the pressure surface, and the wake separation at the trailing edge of the suction surface decreased. Model-B shows that in region-1, the flow separation on the pressure surface disappeared, but there was still flow separation on the trailing edge of the suction surface; in region-2, the flow separation on the pressure surface of the impeller passages decreased obviously, and the wake separation on the suction surface trailing edge also disappeared. The flow separation of model-C disappeared in region-1; the flow separation disappeared in the front and middle of the pressure surface, and the flow separation occurred in the trailing edge of the pressure and suction surfaces in region-2. Compared with the impeller velocity distributions of the baseline fan, the distributions of model-A, model-B, and model-C were more uniform, which shows that the flow of the best performing model was smoother and the loss of fluid flow was reduced. As shown in Figure 10, flow separation occurred at the leading edge of the pressure surface and vortices appeared in the impeller passages for the baseline fan in region-1, and flow separation occurred at the trailing edge of the blade in region-2. Model-A reduced the flow separation in region-1, where the velocity was more uniformly distributed; in region-2, the flow separation mainly appeared in the front and middle of the suction surface. Compared with the flow separation range of the baseline fan, model-A enlarged the separation area and confined the flow, and there were vortices in the impeller passage. The velocity distribution of model-B was uniform in region-1, and the flow separation appeared on the leading edge of pressure surface, whose range was very small. In region-2, a small wake separation occurred at the trailing edge of the suction surface of the blade, which was much smaller than that of the baseline fan. The flow separation of model-C in region-1 was greatly reduced, and only a small range of flow separation occurred on the pressure surface. However, in region-2, the flow separation was deteriorated and there were vortices in the impeller passages.
Figure 11 and Figure 12 give the velocity distribution at the z = 35 mm and z = 75 mm planes of the baseline fan, model-A, model-B, and model-C, respectively, under the rated flow rate (Q/Qn = 1.000), where the highest aerodynamic efficiency was anticipated. In Figure 11, for region-1, the velocity distribution of model-A was approximately the same as that of the baseline fan, while the low velocity region of model-B and model-C was obviously reduced. In region-2, the low velocity region of model-A and model-C was larger, and the situation of model-C was more serious, while the low velocity region of model-B decreased and the velocity distribution was better organized. For the baseline and modified models, the velocity distribution in the impeller passages was generally the same, while there were obvious differences between region-1 and region-2 in Figure 12. For region-1, the local velocity of the modified model was higher than that of the baseline fan; for region-2, the velocity distribution of model-A and model-C was disordered, while the velocity distribution of model-B was uniform and the flow was smooth.
Figure 13 and Figure 14 show the velocity distribution of the impeller under the condition of a high flow rate (Q/Qn = 1.760) at the z = 35 mm and z = 75 mm plane, respectively. As shown in Figure 13, the low velocity region of the impeller passages of model-A, model-B, and model-C reduced in the region between 90° and 120°, especially in region-1. In the range of −90° < α < 0°, especially in region-2, the low-velocity region in the impeller passages of model-B and model-C decreased, while the low-velocity region of model-A increased, and the vortex of the blade passage became larger. As shown in Figure 14, in region-1, the flow separation in the impeller passages of model-B and model-C decreased, and that of model-B almost disappeared. However, the flow separation reduced effectively in region-2 of model-A and model-B.
The vorticity equation describes the evolution of the vorticity ω, which is expressed as:
D ω D t = ω t + ( u · ) ω = ( ω · ) u ω ( · u ) + 1 ρ 2 × ρ × p + × ( · τ ρ ) + × ( B ρ ) ,
where u is the velocity vector, ρ is the local fluid density, p is the local pressure, τ is the viscous stress tensor, and B represents the sum of the external body forces. The equation is simplified to the vorticity transport equation:
D ω D t = ( ω · ) u + υ 2 ω .
In the case of incompressible (i.e., low Mach number) and isotropic fluids with conservative body forces, the equation simplifies to the vorticity transport equation, where υ is the kinematic viscosity and 2 is the Laplace operator.

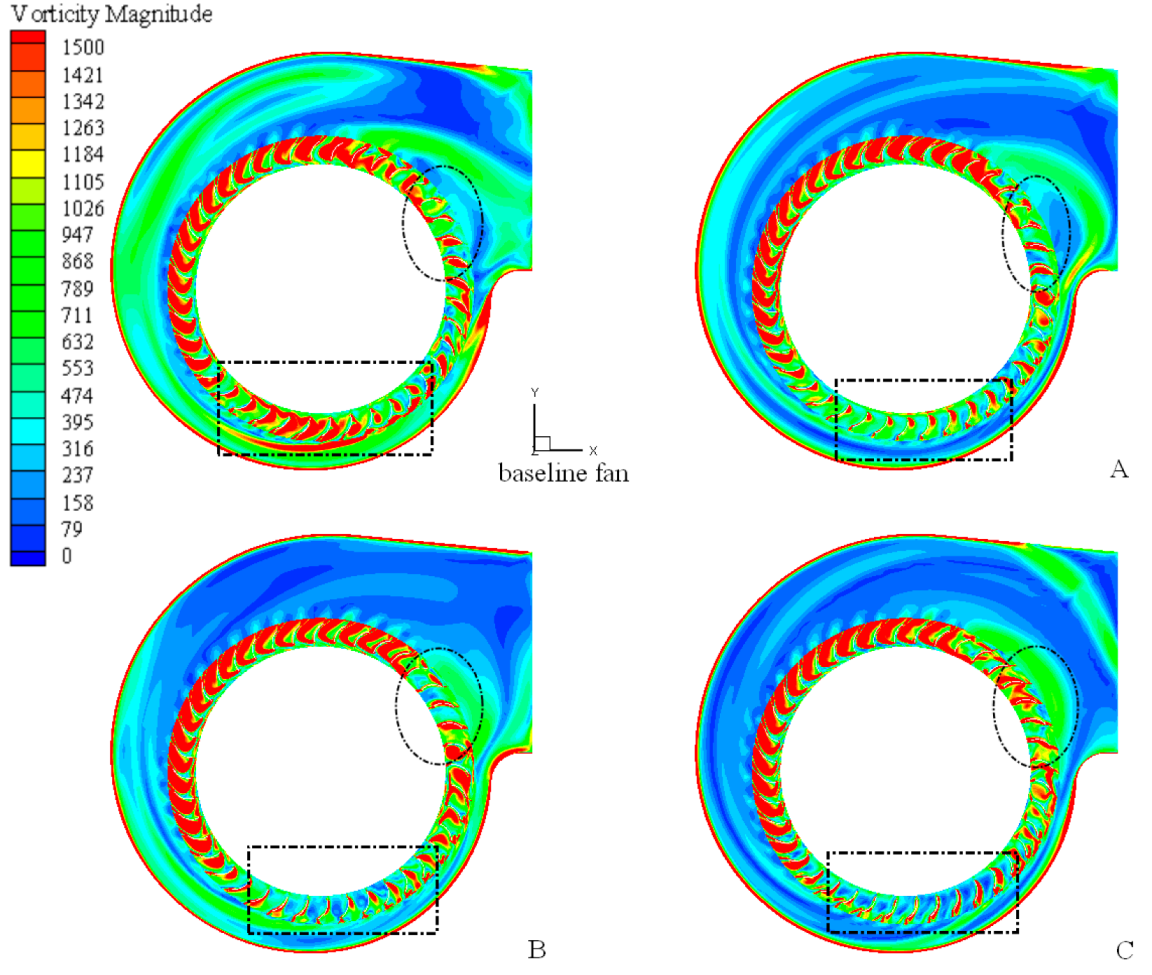
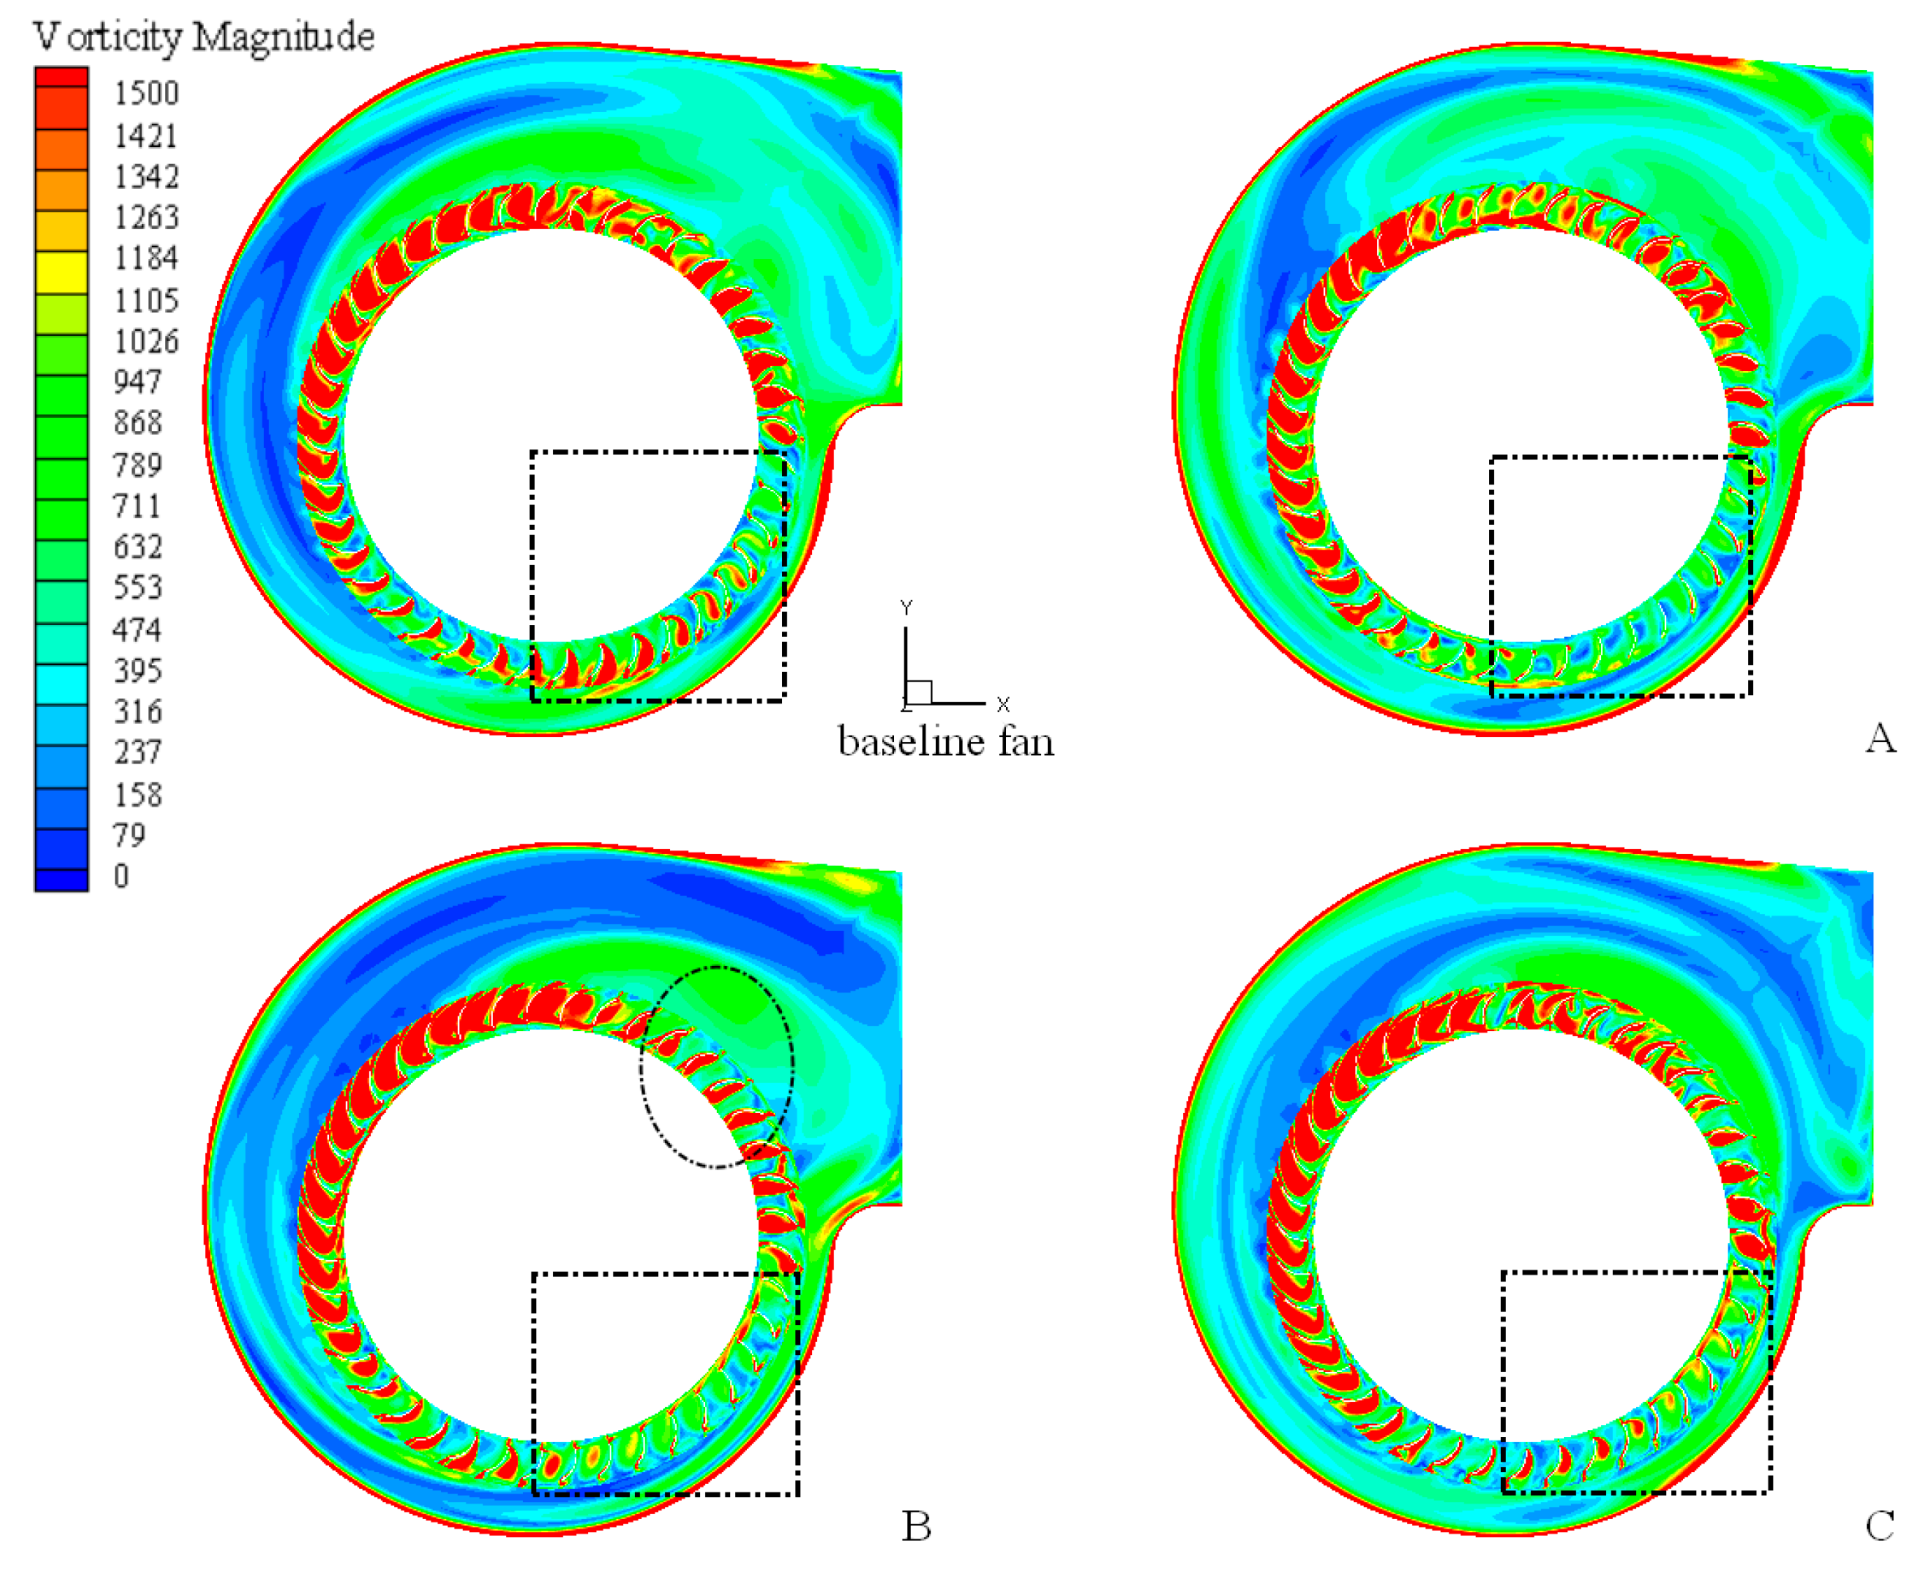
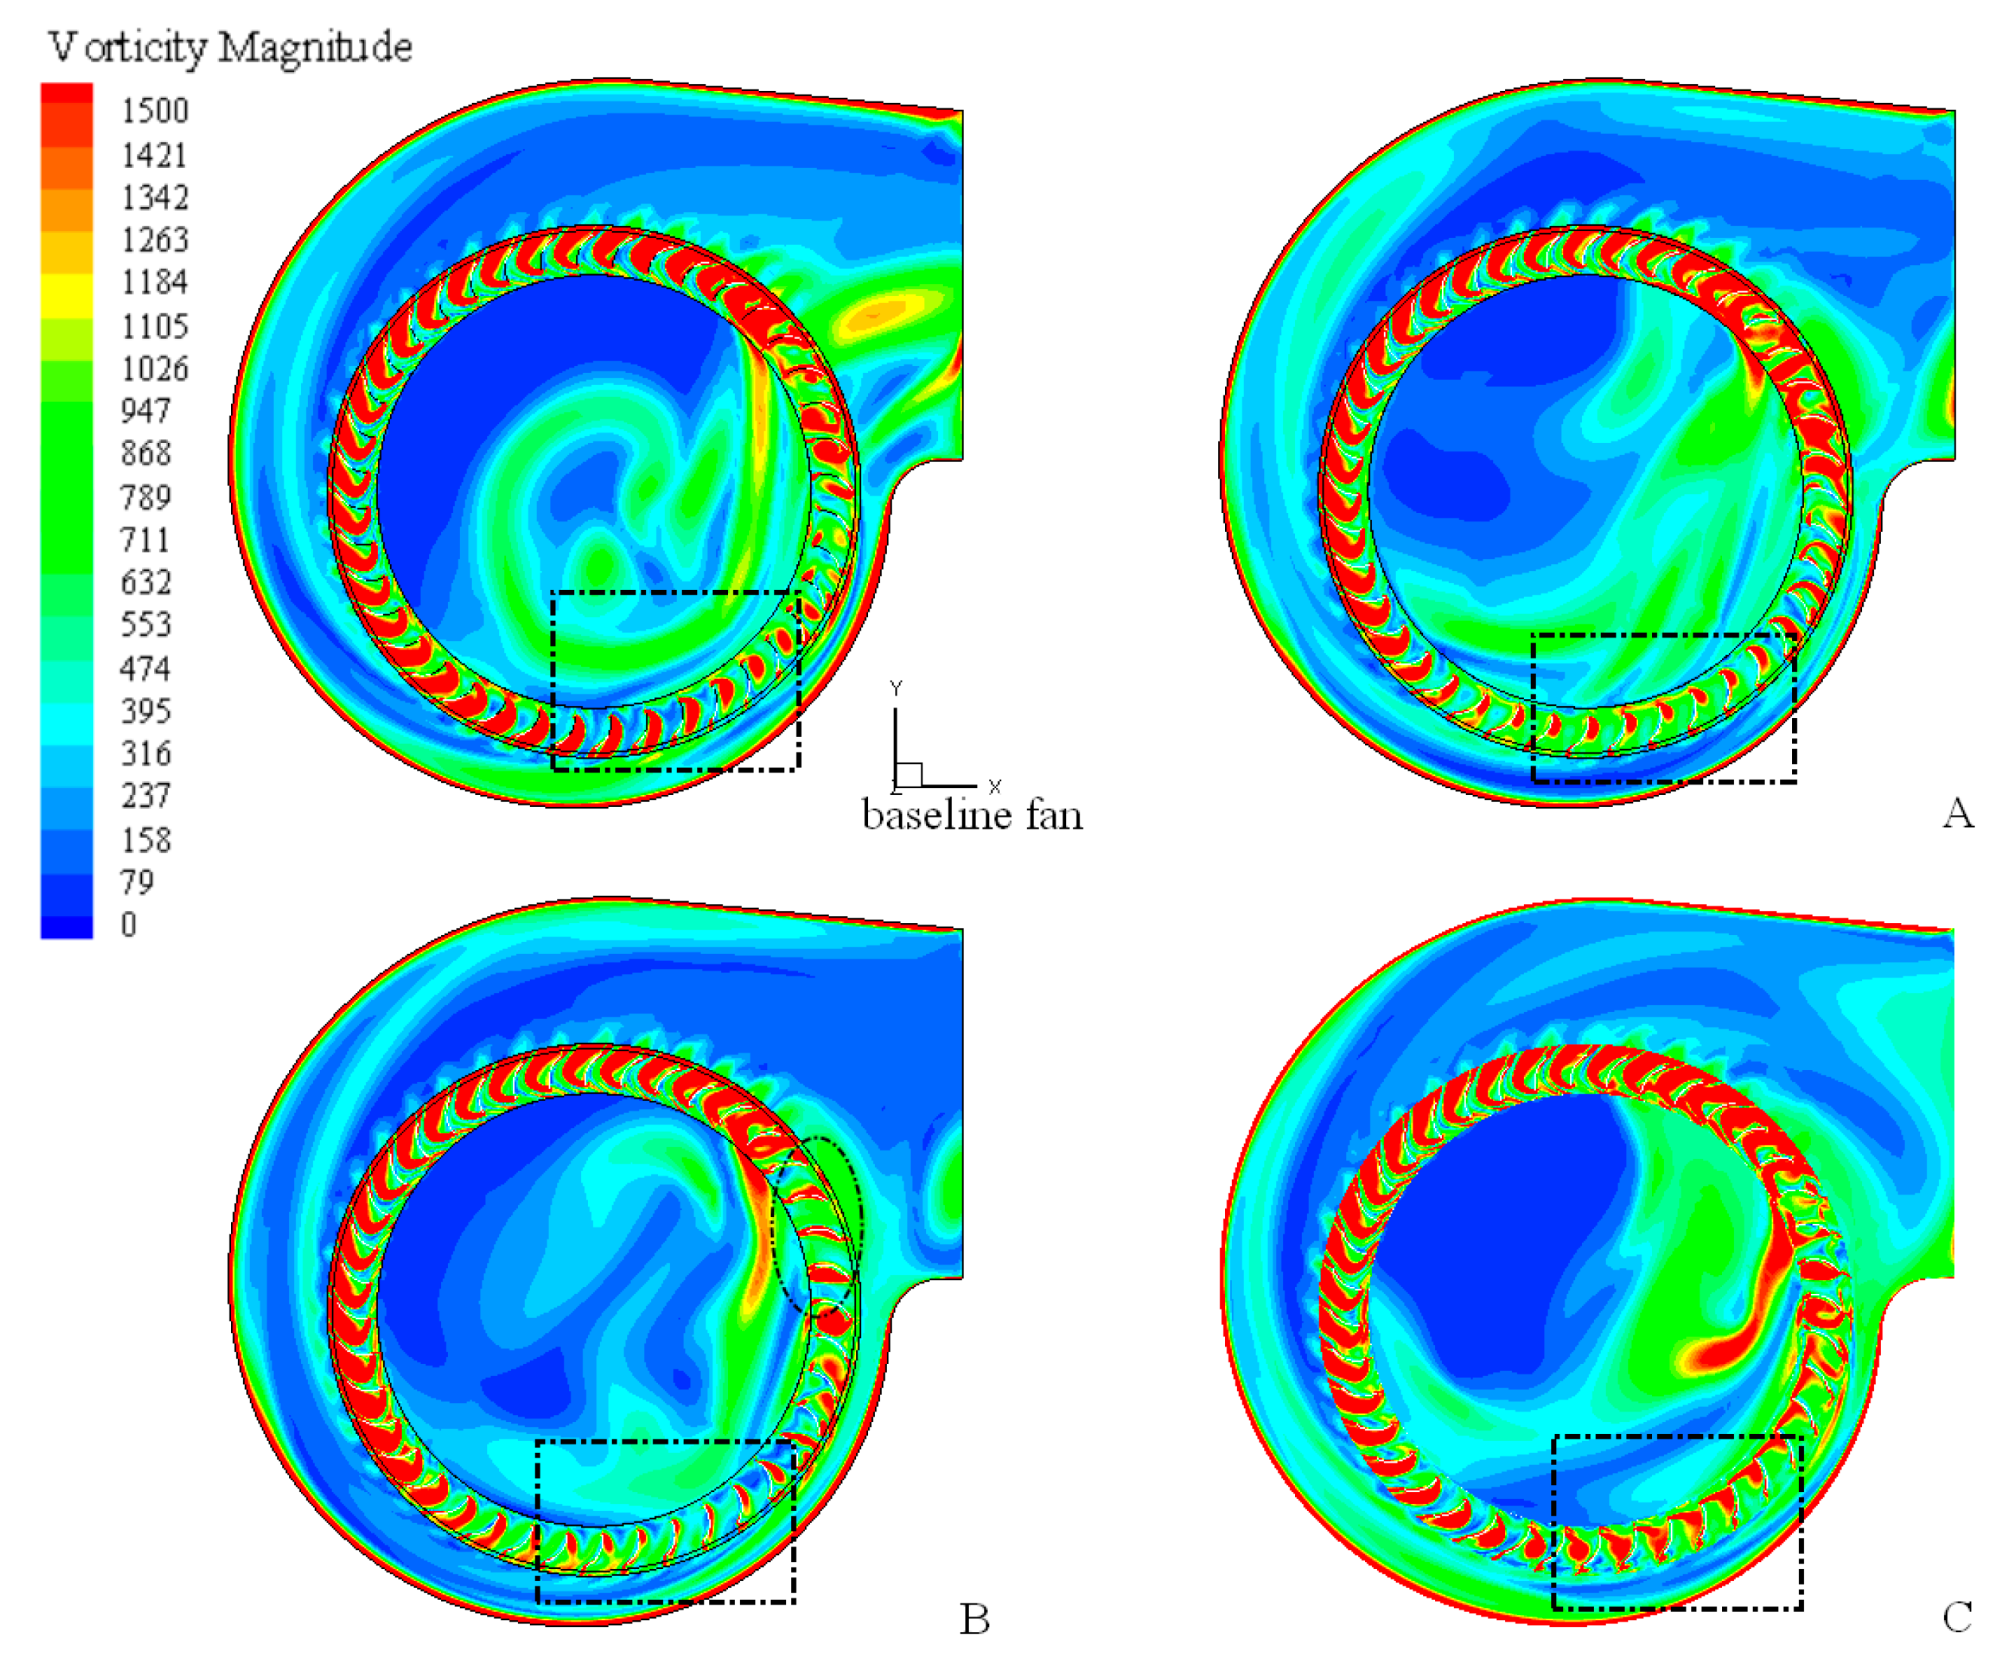
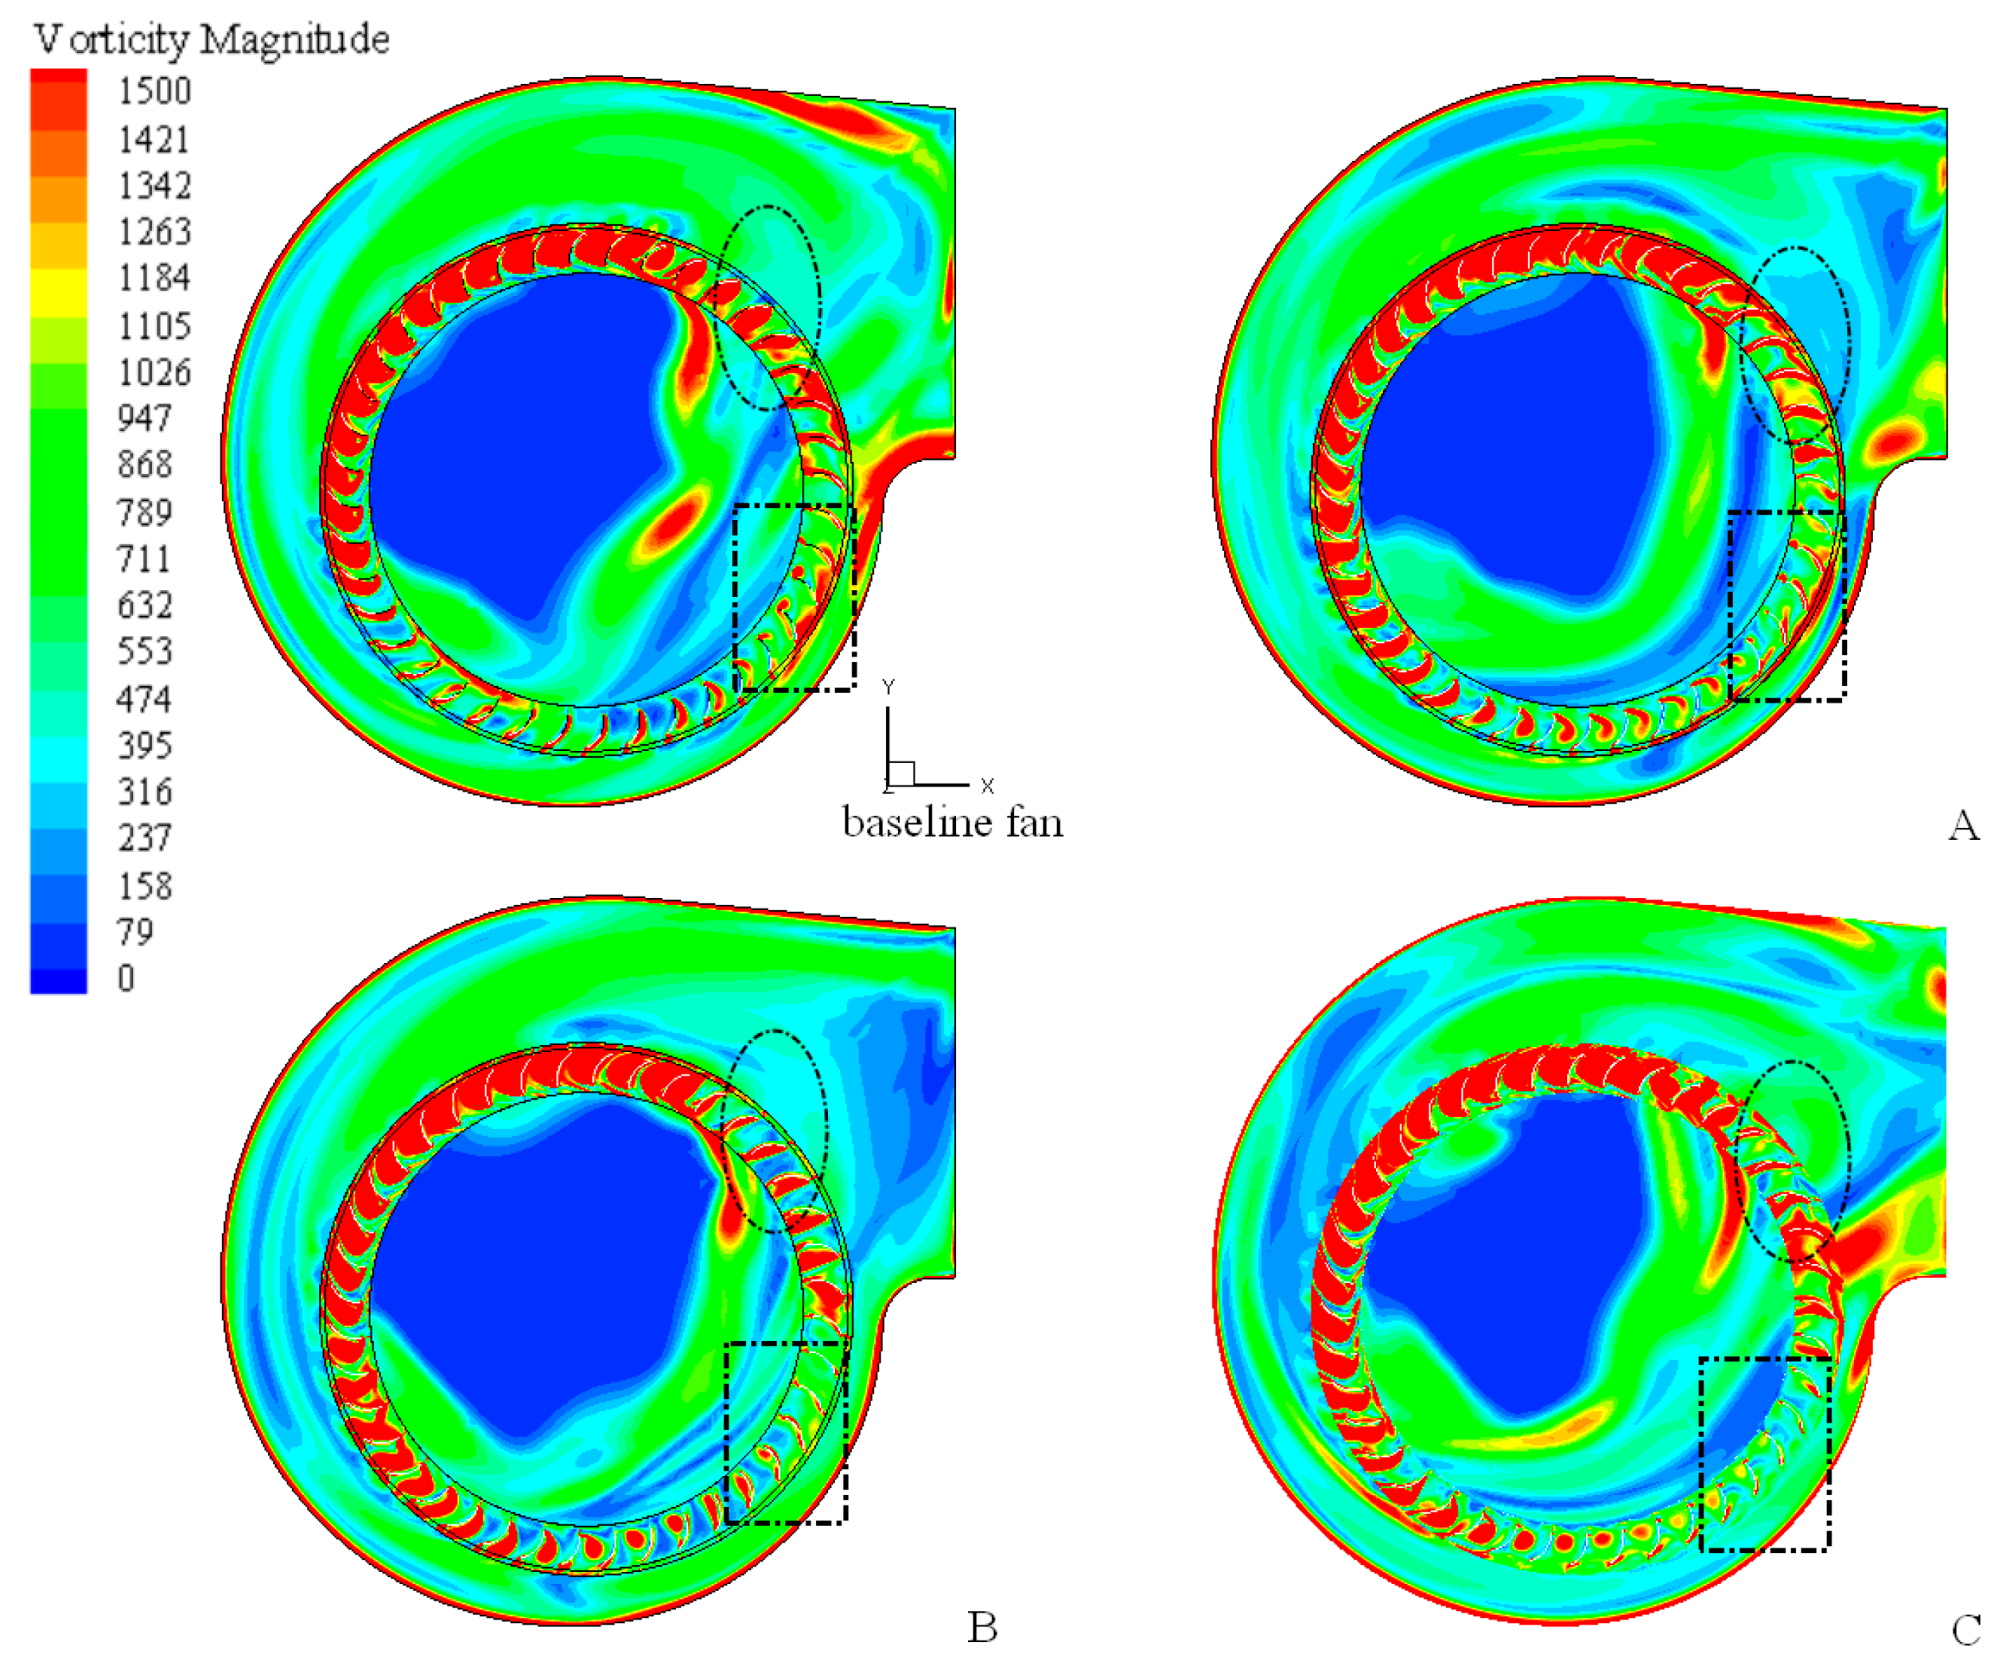
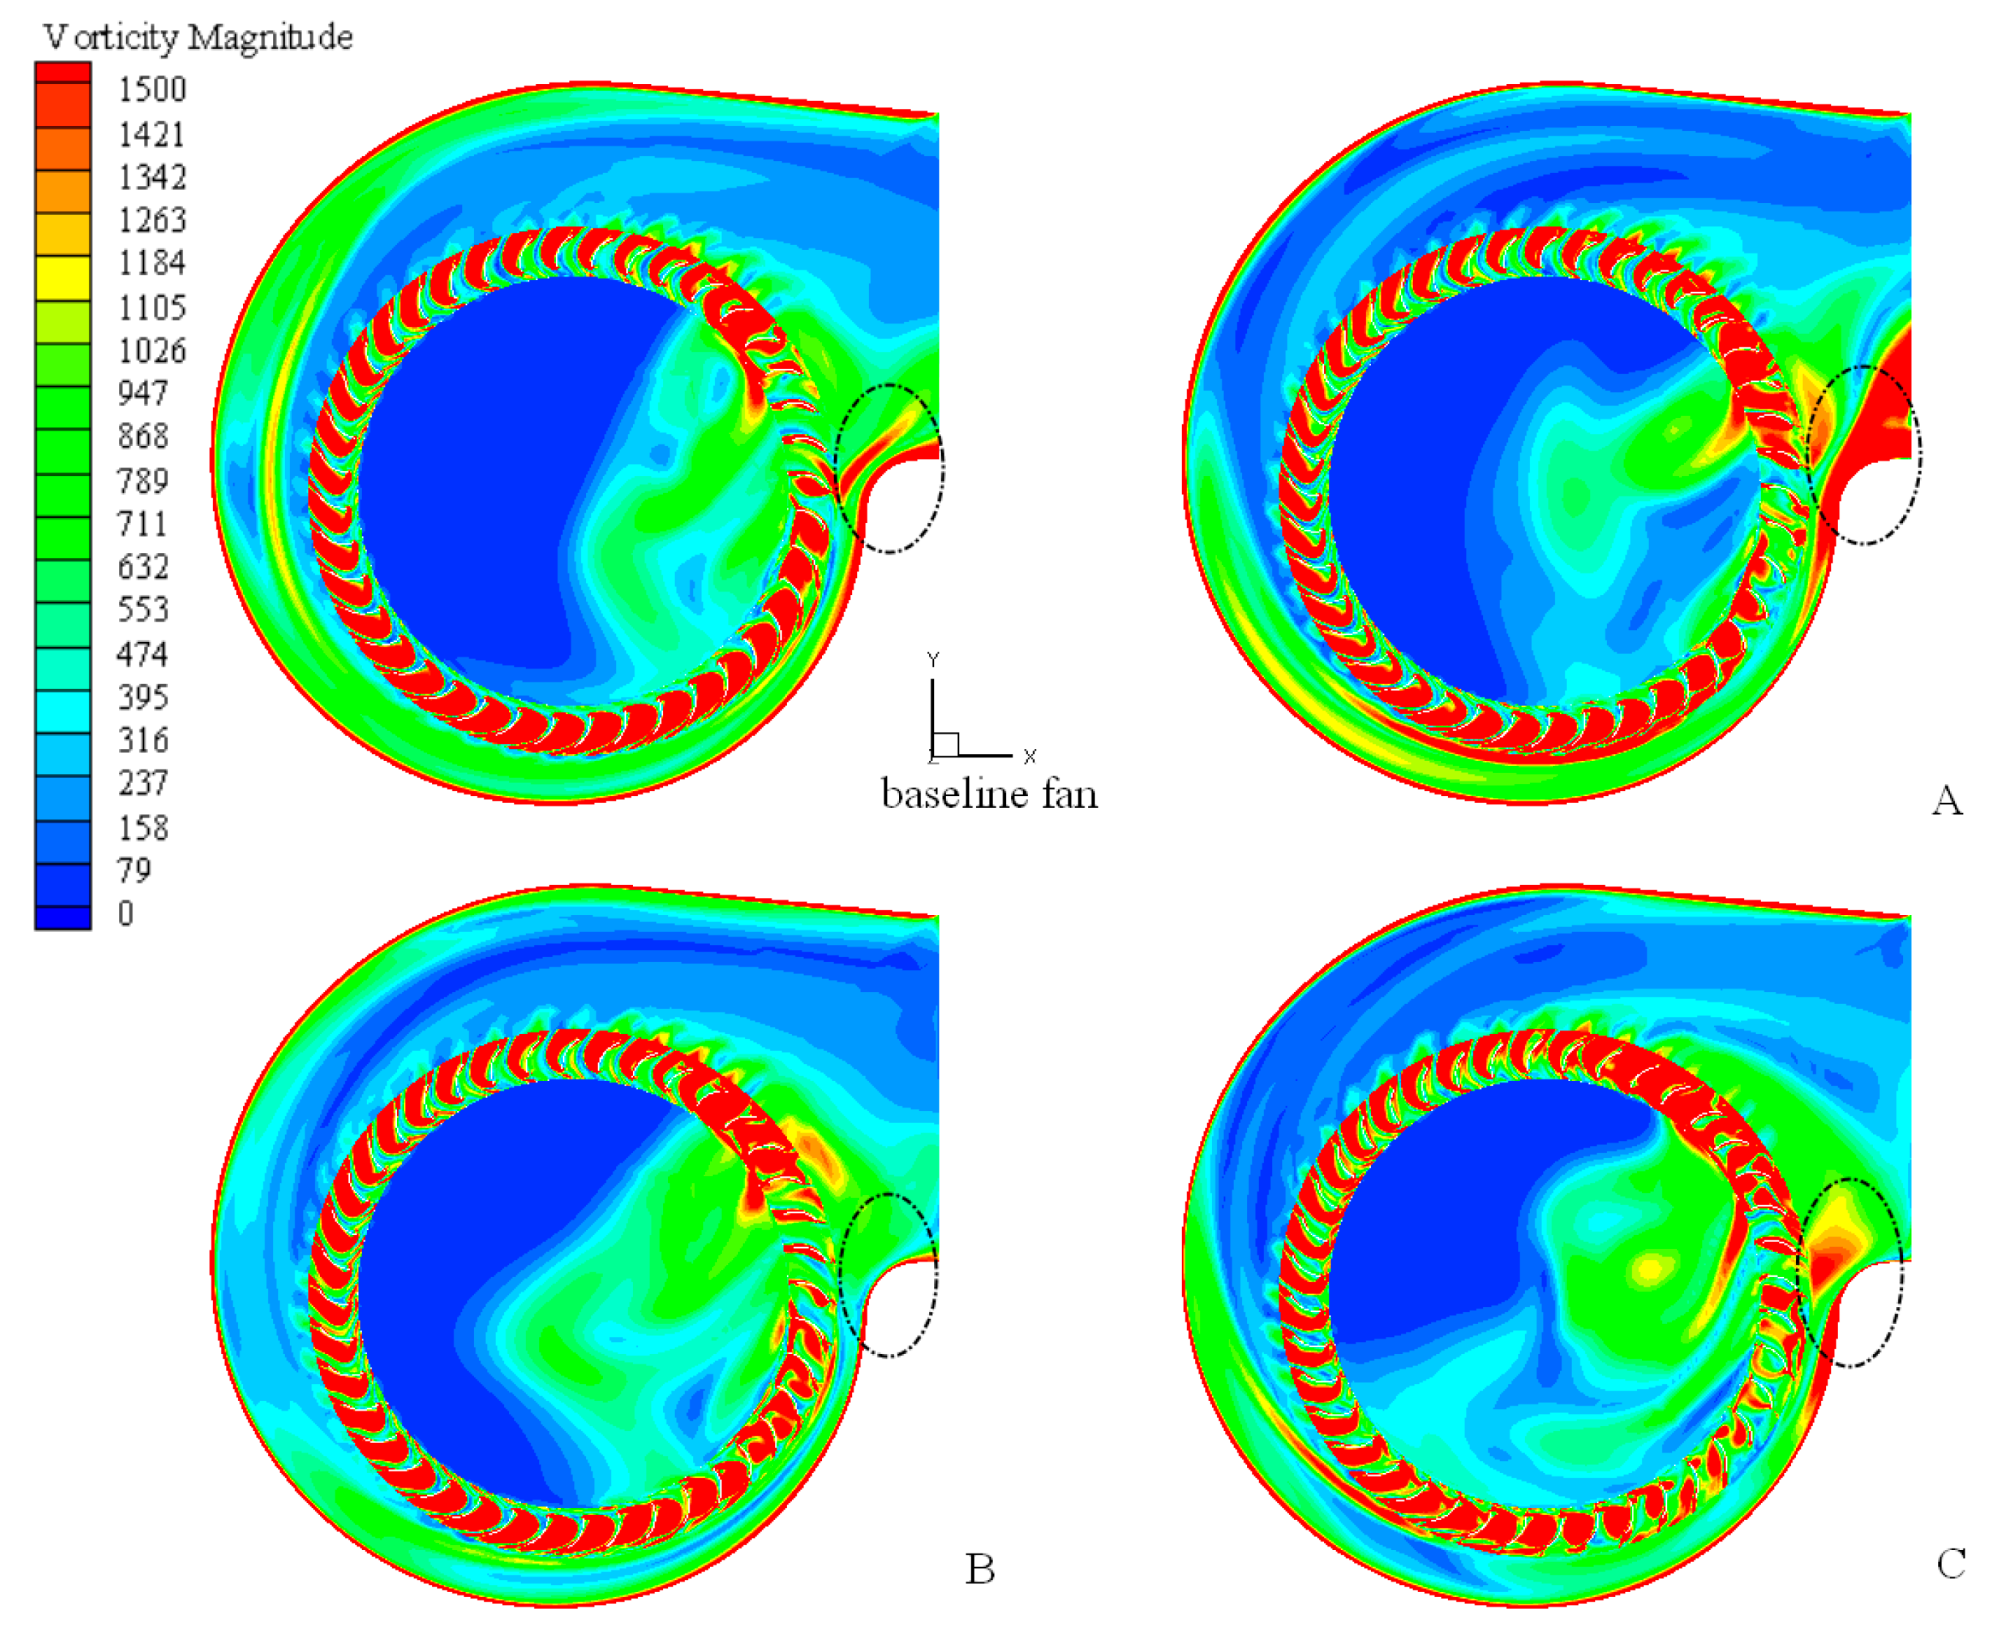
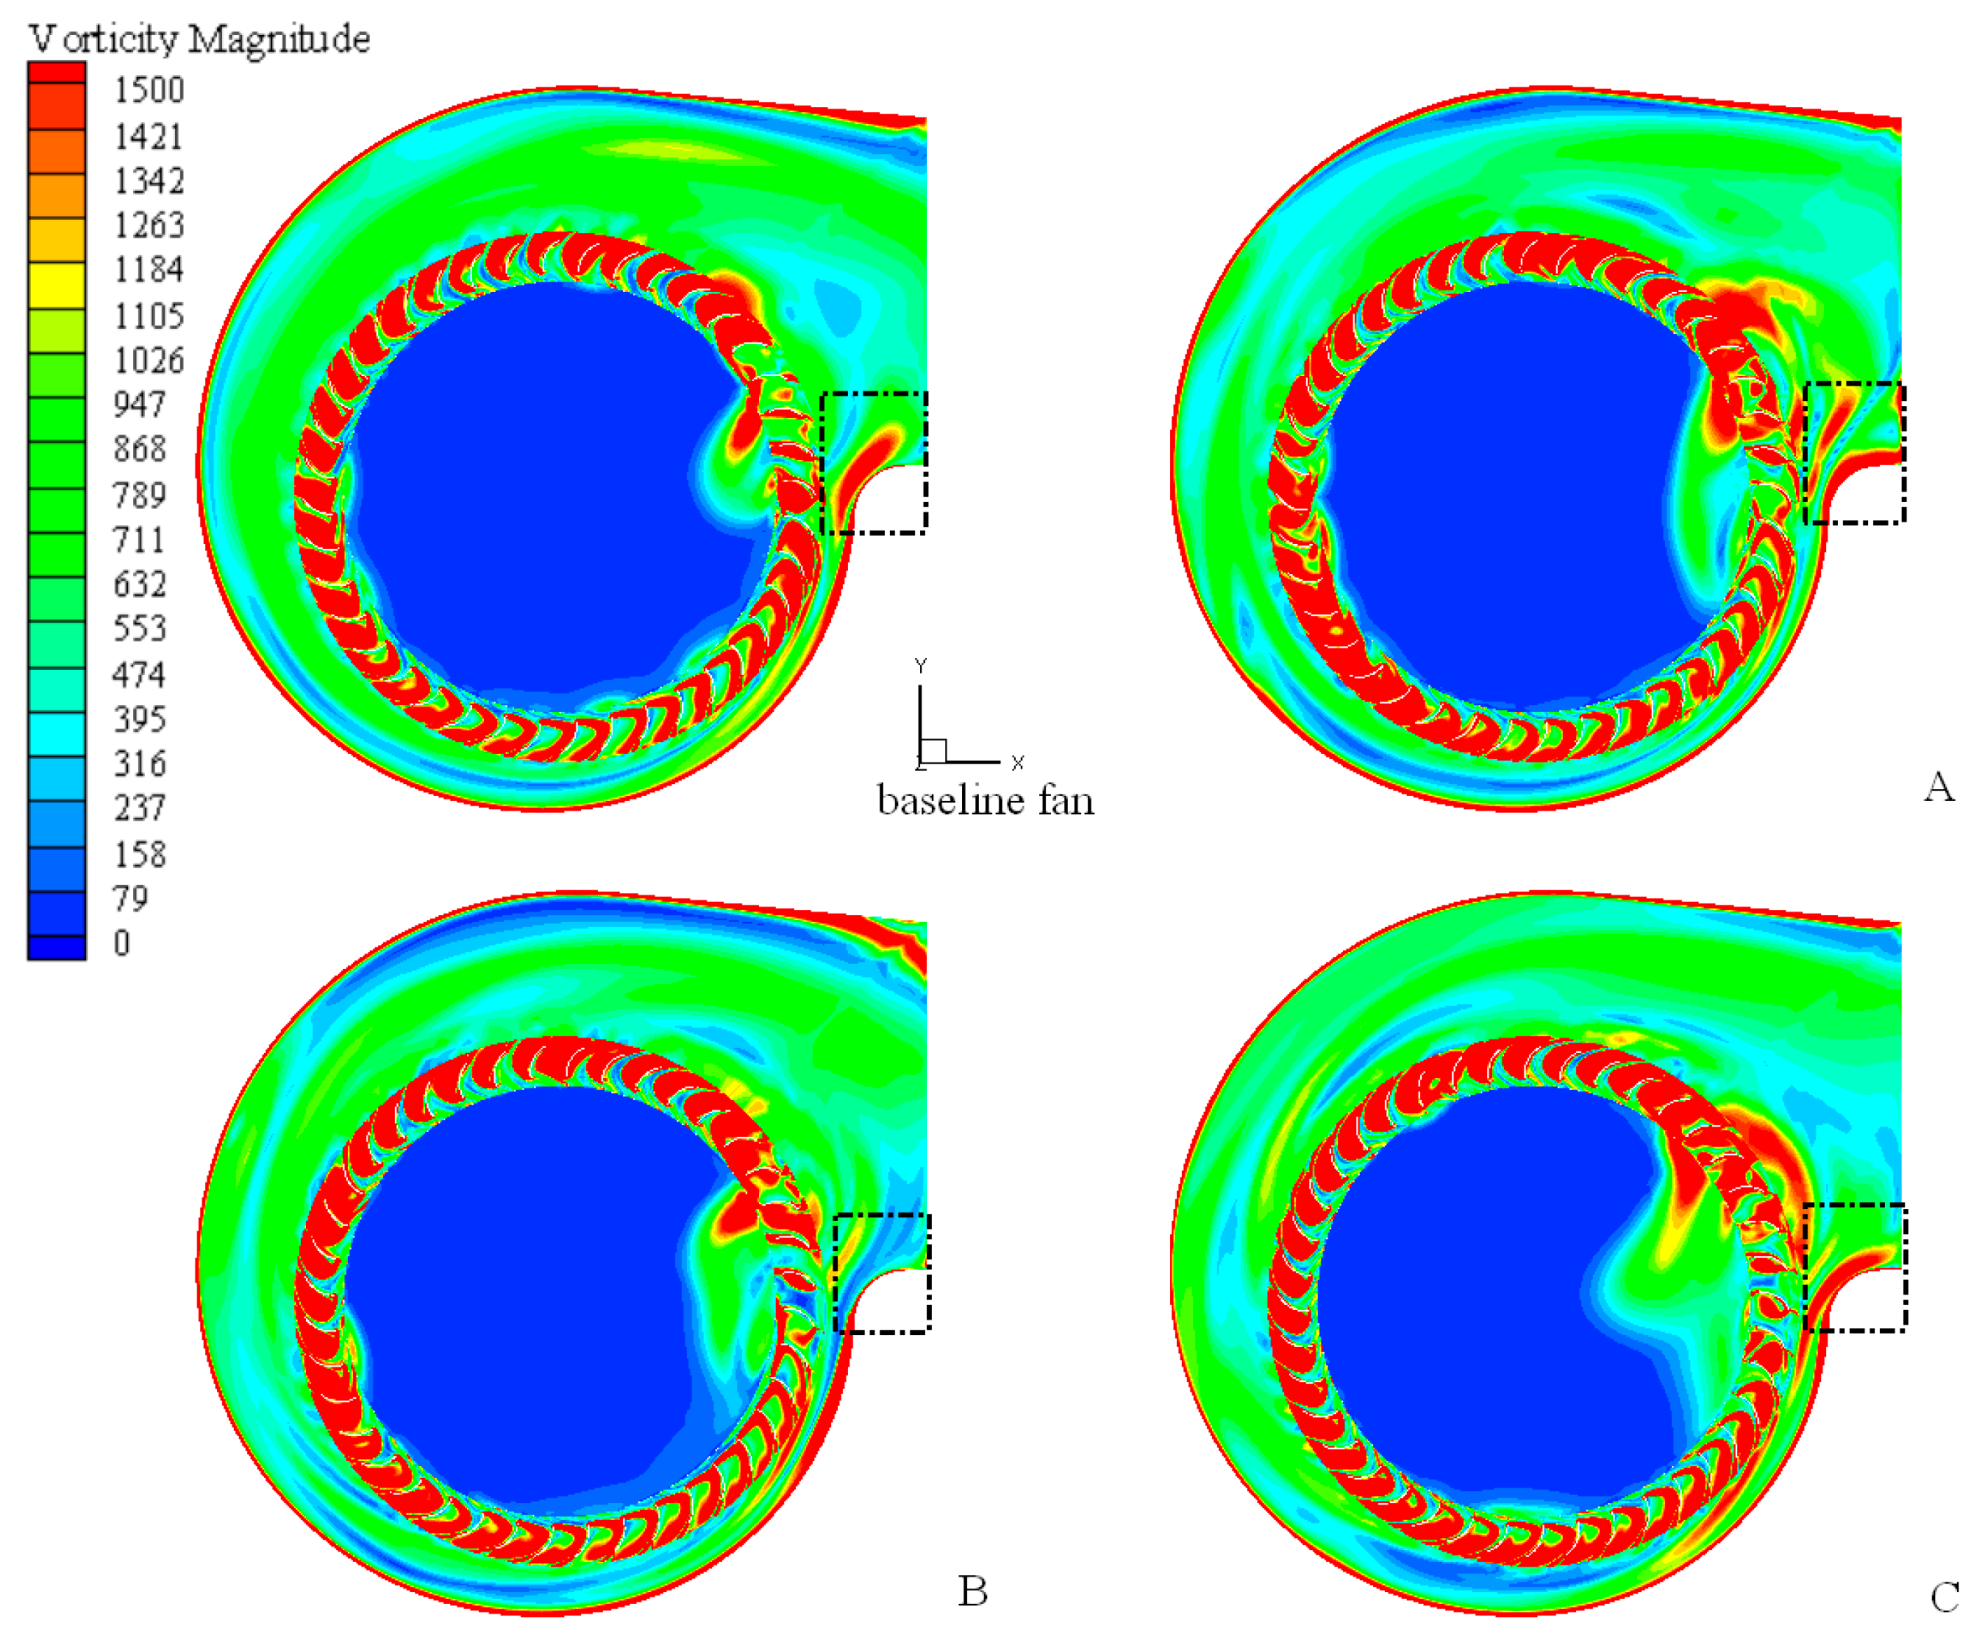
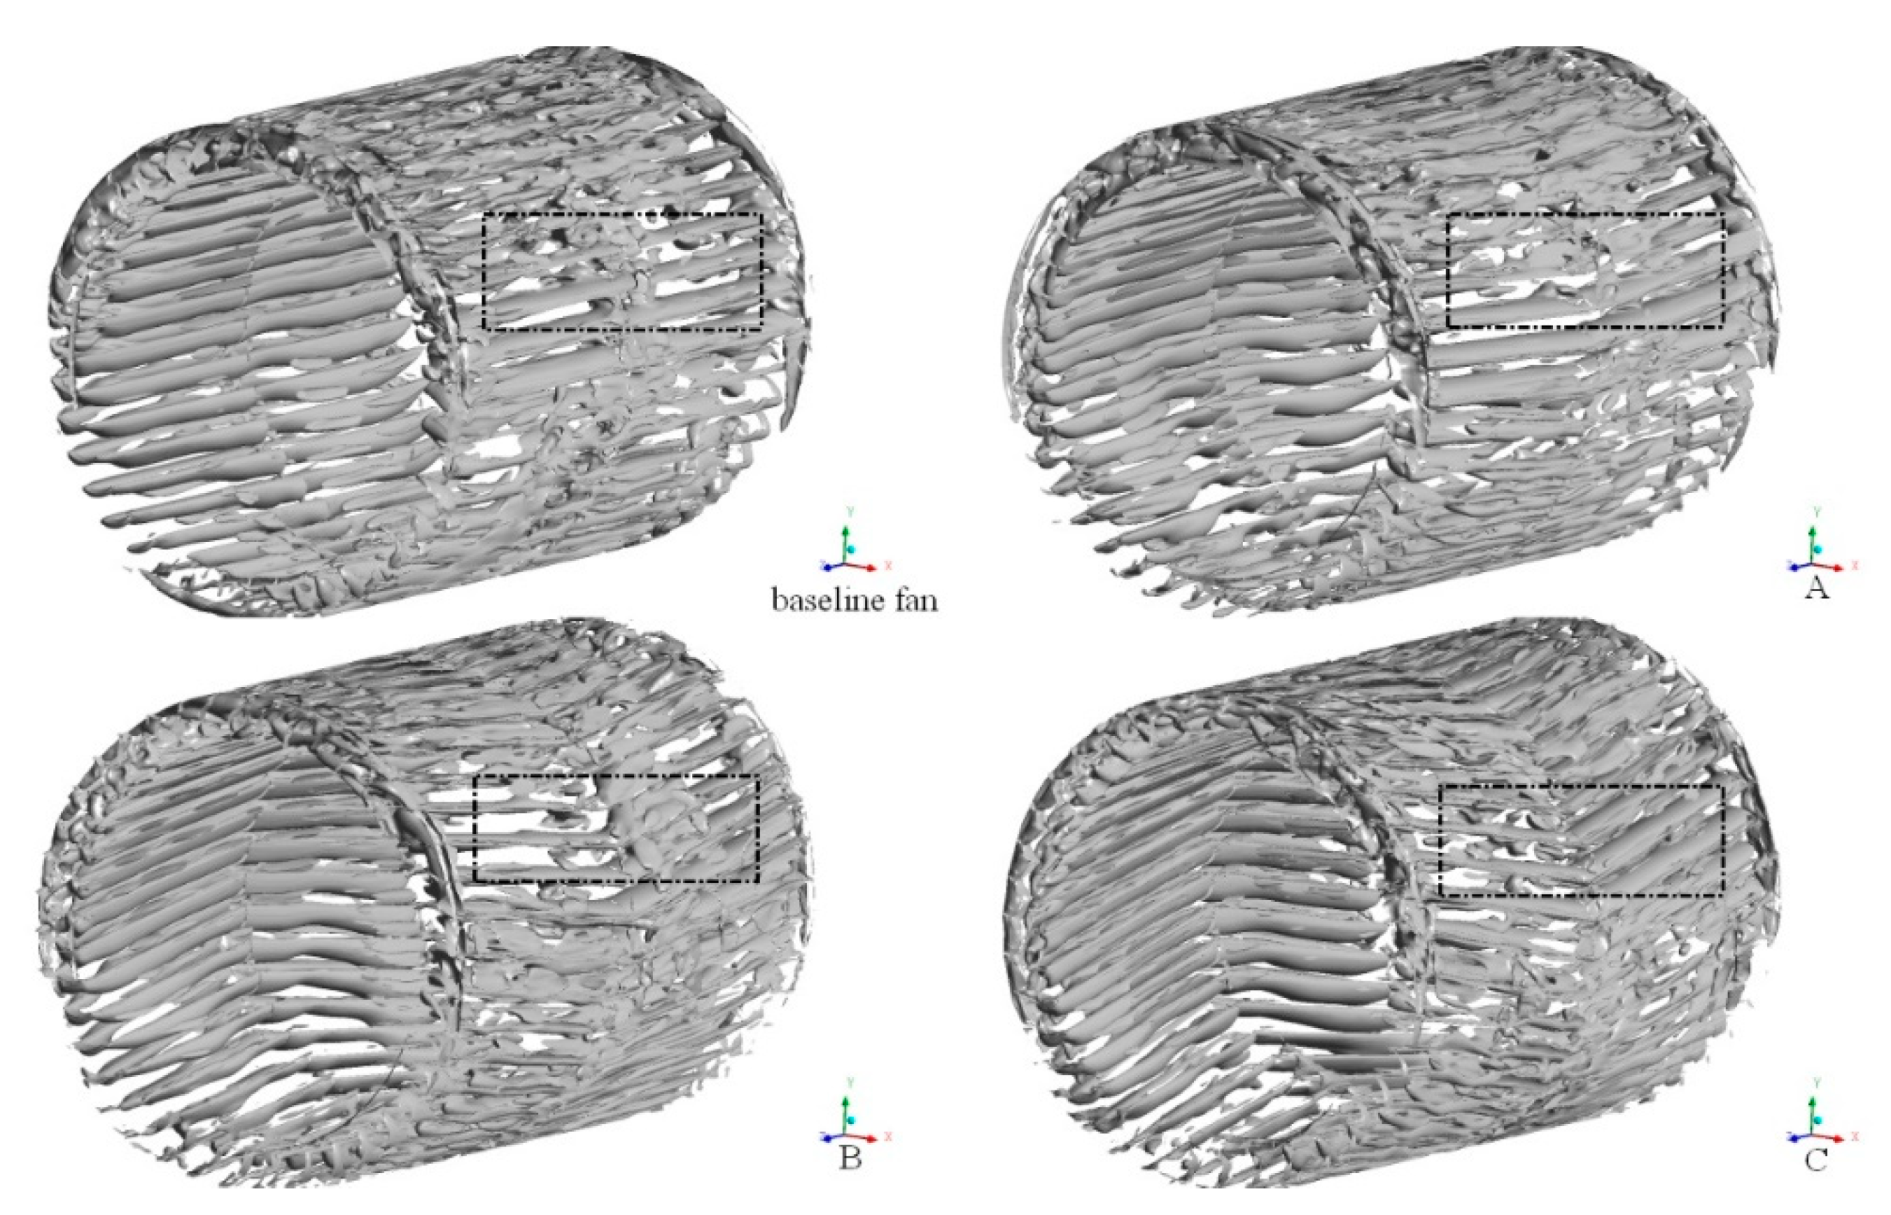
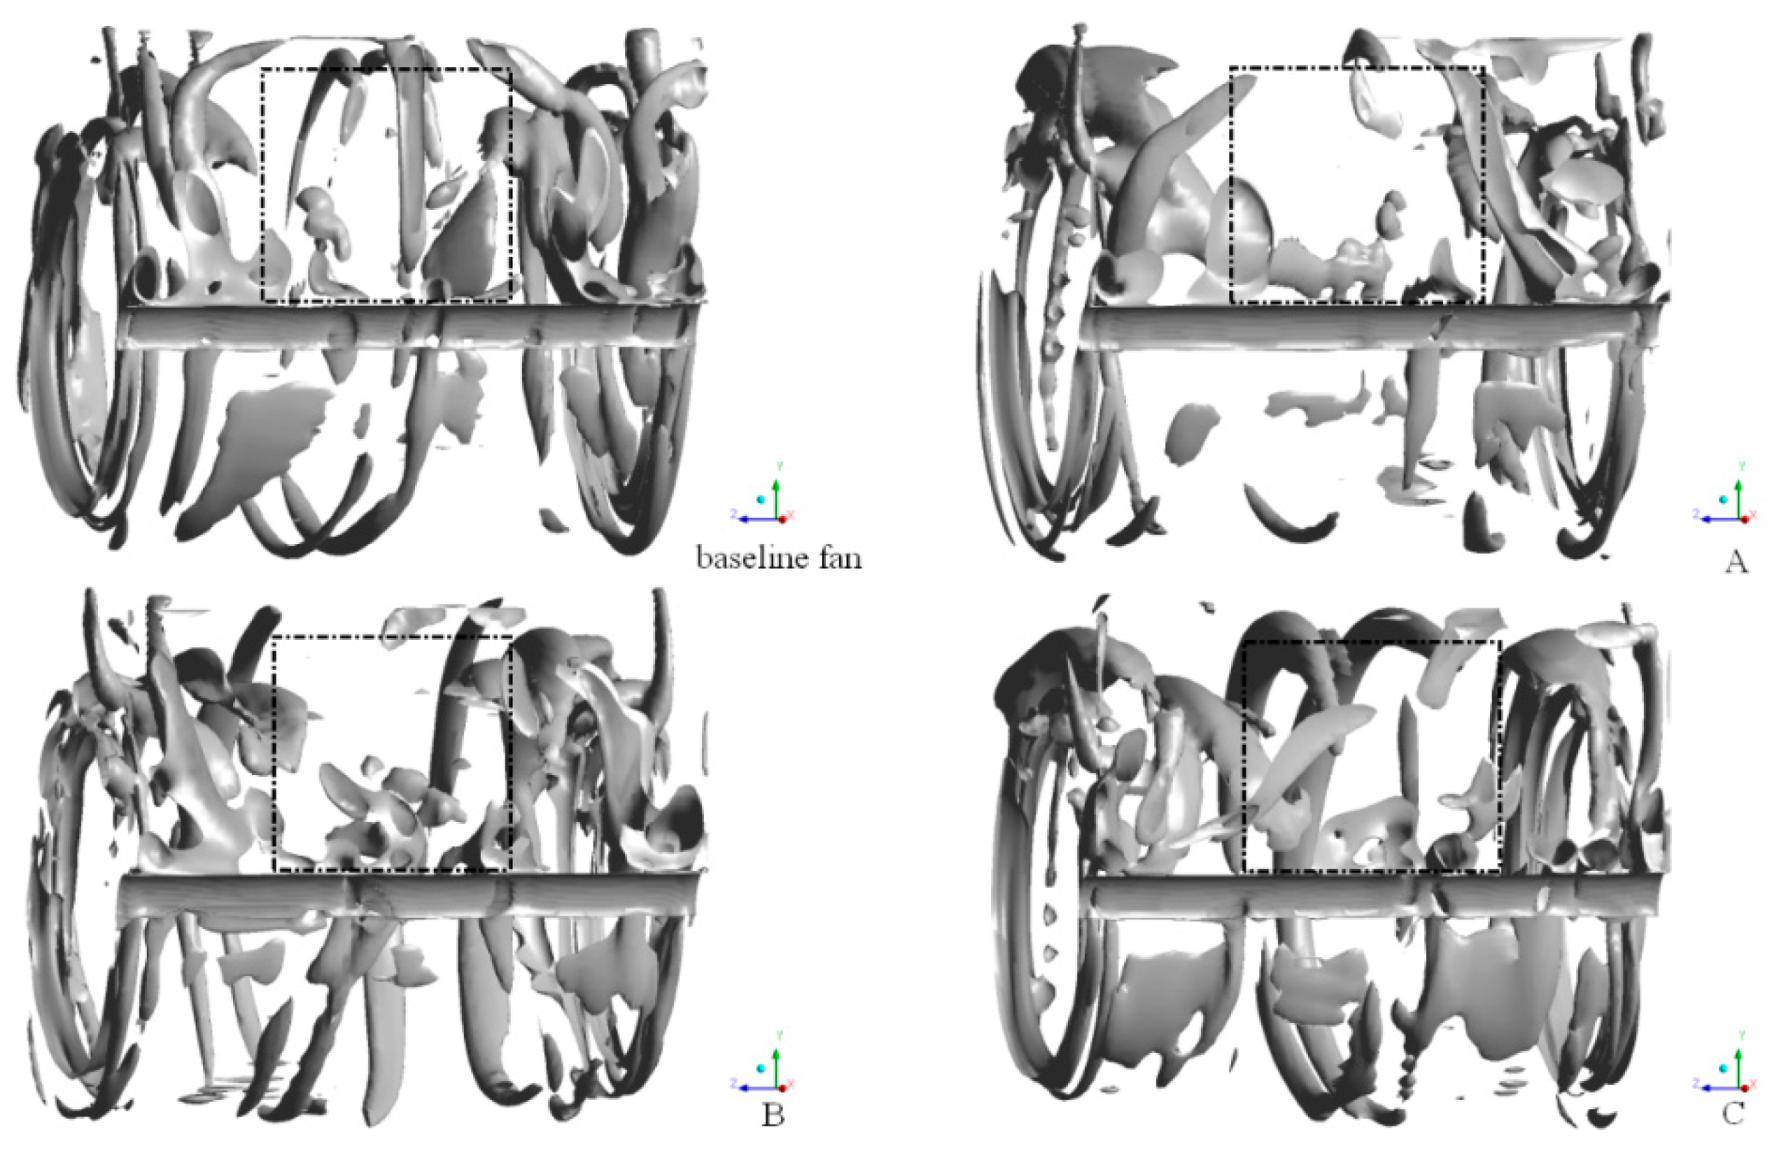
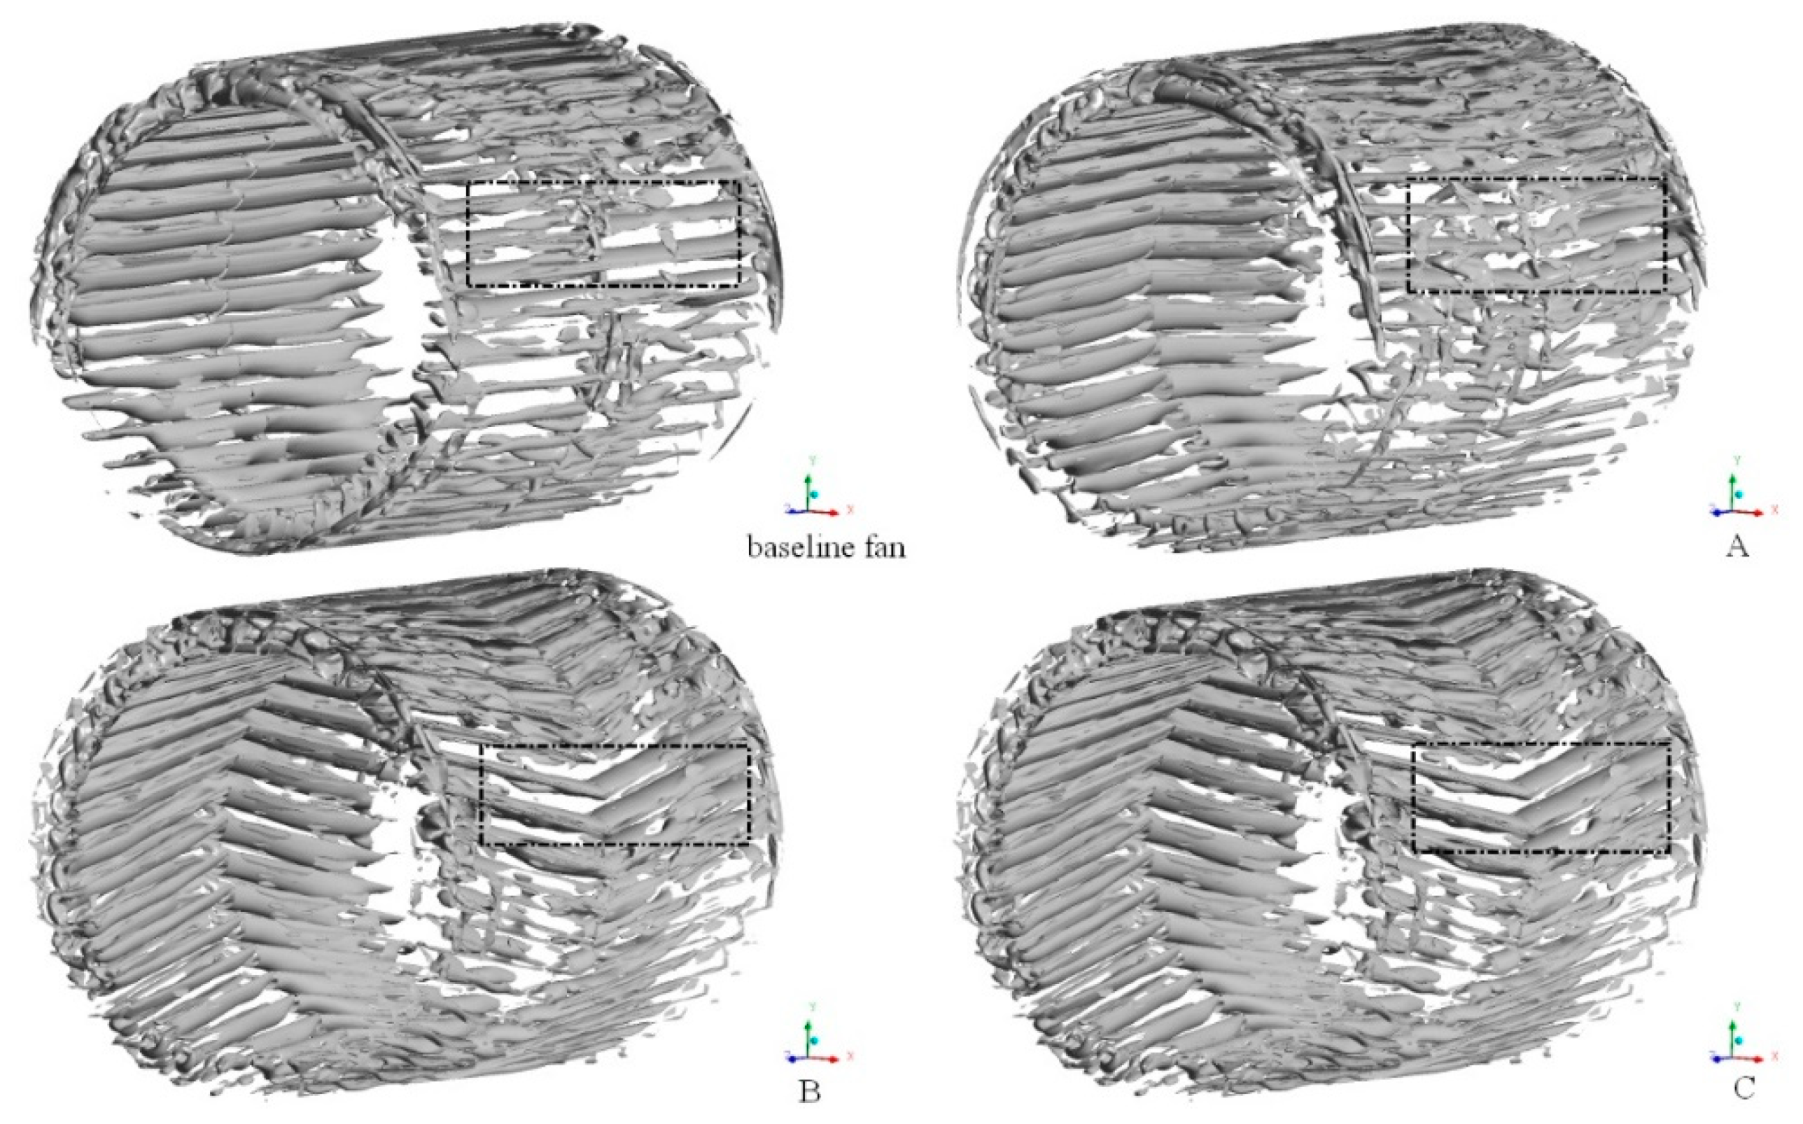
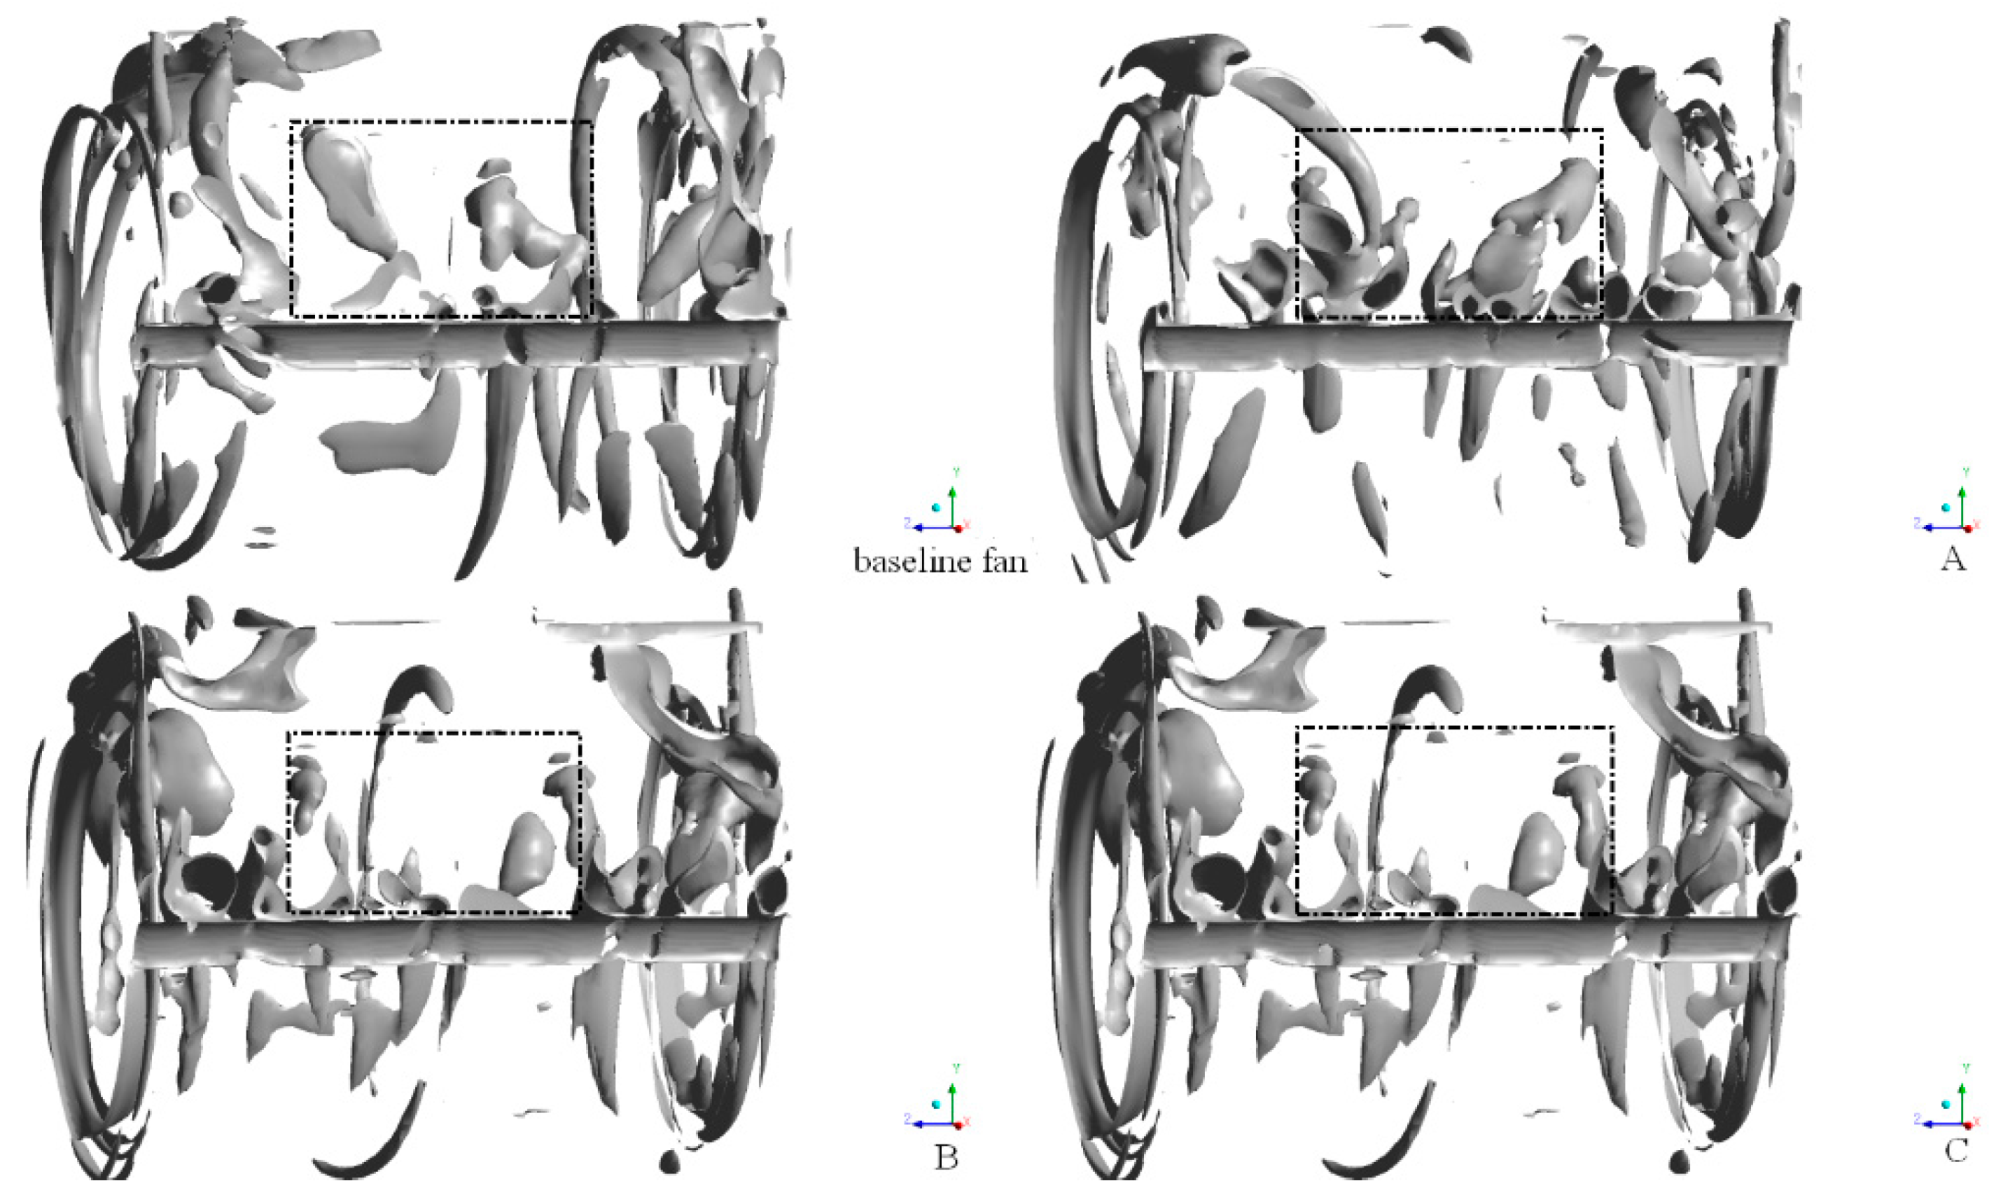
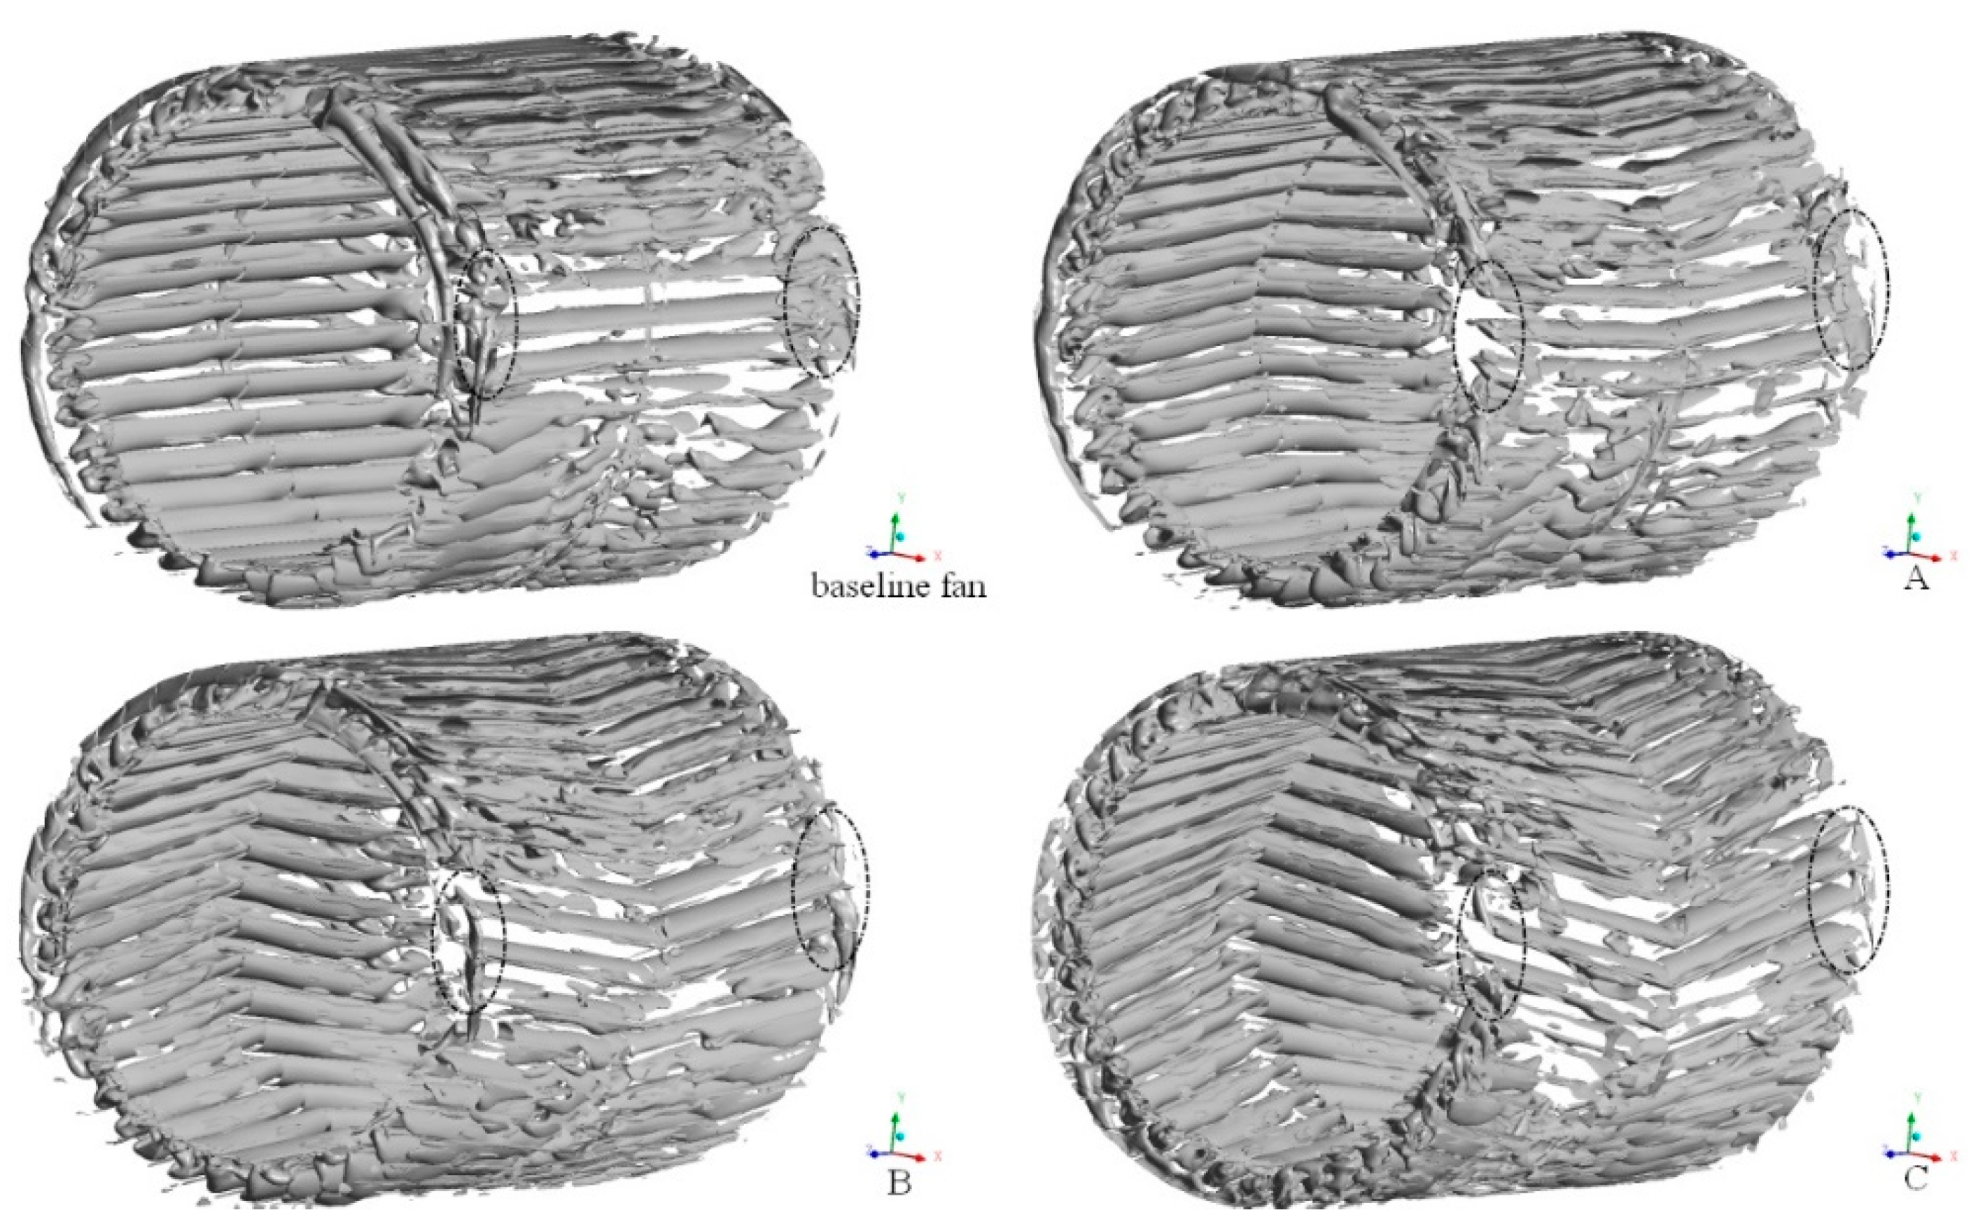
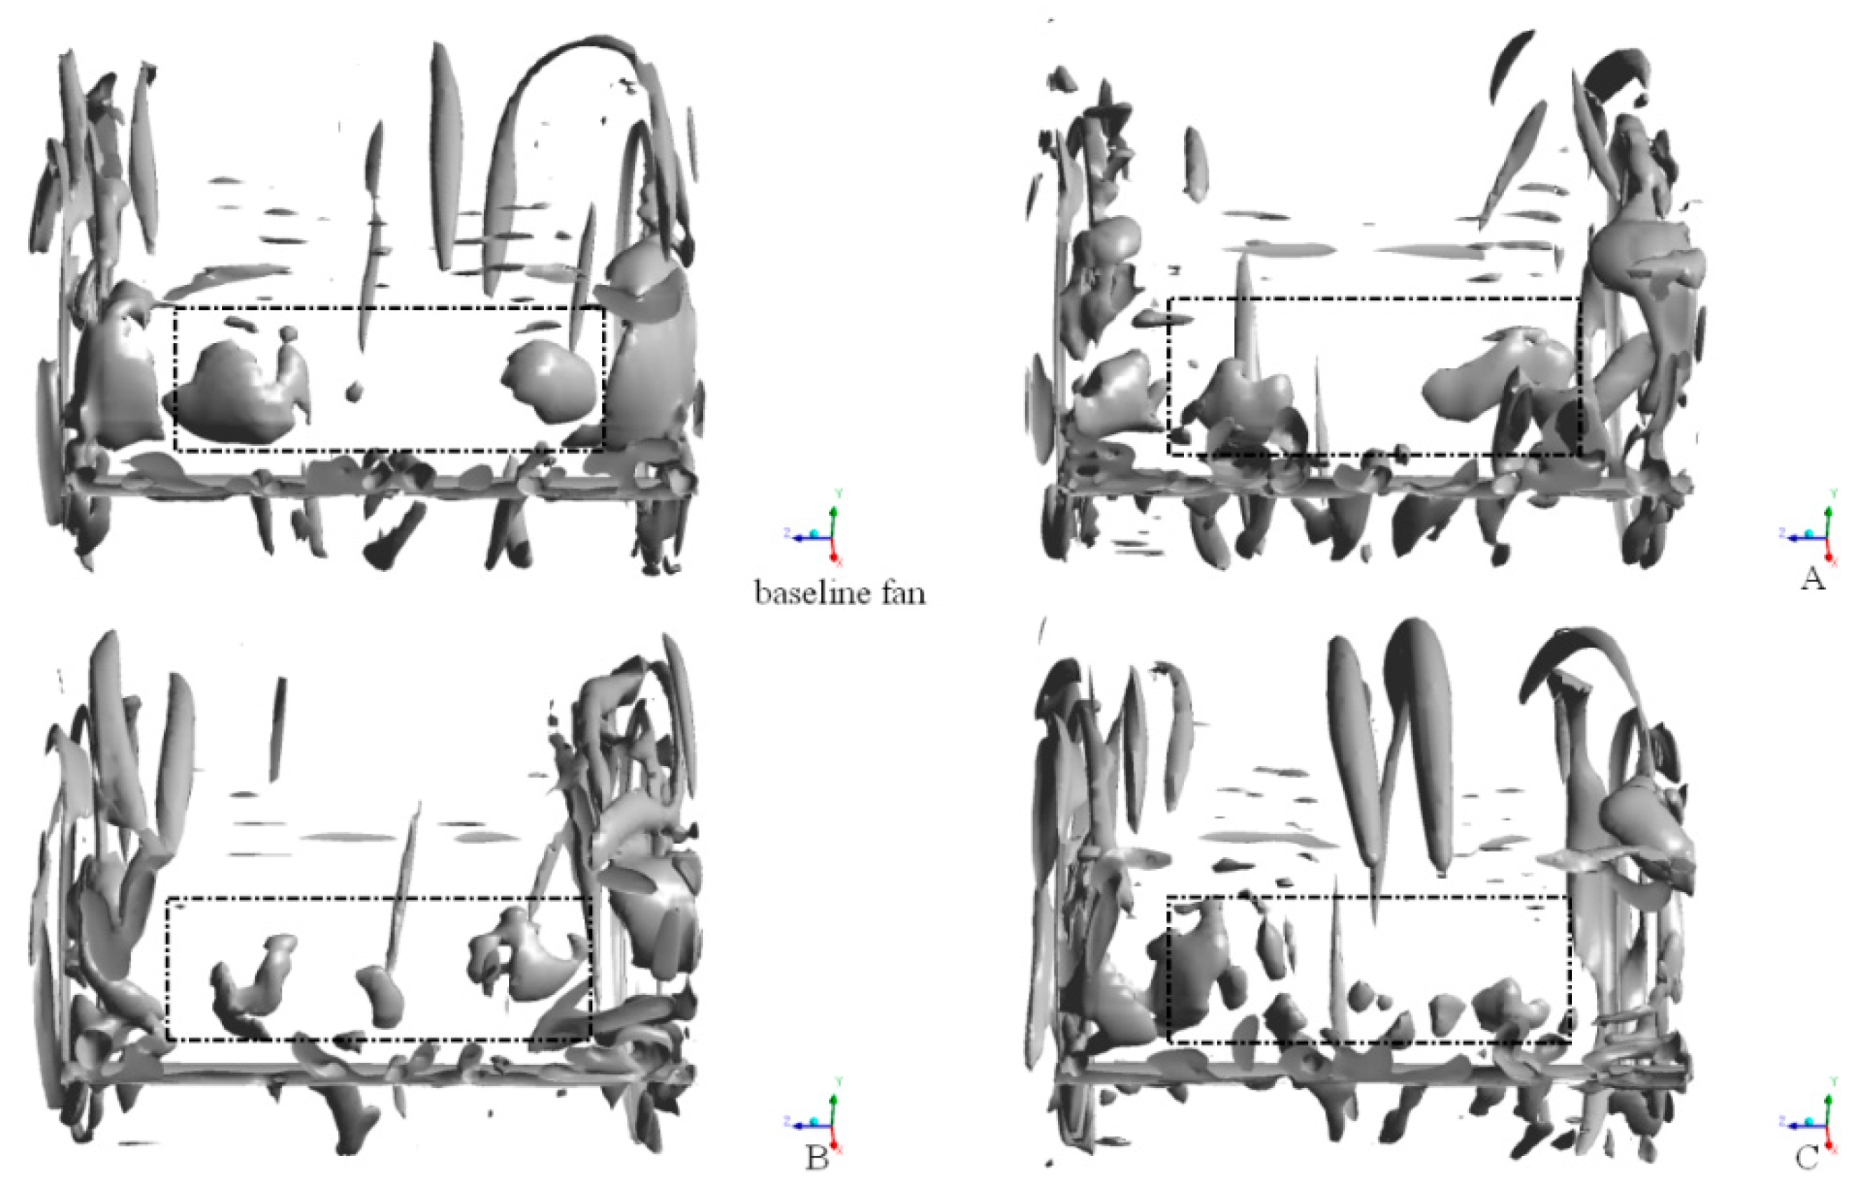
3.2.2. Vorticity Distribution within the Fan

This section mainly discusses vorticity distribution within the fan at different flow rates. Figure 15 and Figure 16 show the vorticity distribution under low flow rate conditions (Q/Qn = 0.483) at the z = 35 mm and z = 75 mm planes, respectively. The vorticity is the curl of the fluid velocity vector, and it is related to the magnitude and direction of the fluid velocity. Comparing the vorticity distributions of different axial positions in Figure 15 and Figure 16, it can be found that the high vorticity region in the z = 35 mm plane was mainly concentrated in the fan impeller passages region (−60° < α < 120°), while in the z = 75 mm plane, the vorticity of the impeller passages near the volute outlet (120° < α < 180°) increased. It is shown that flow separation existed near the suction surface for most of the impeller passages of z = 75 mm plane. As shown in Figure 15, the high vorticity region of impeller passages decreased near the volute outlet (dotted ellipse region) in model-A and model-B, and the vorticity of the impeller passages of the optimized models decreased significantly (dotted rectangular region). This indicates that the flow separation phenomenon in the optimized models was weakened, and the flow separation region was reduced. In Figure 16, compared with the high vorticity region in the baseline fan, the area of separation region in the impeller flow passages of the modified models was significantly reduced (the dotted rectangular region), while the high vorticity region of model-B was reduced (the dotted ellipse region). It can also be seen from Figure 15 and Figure 16 that the vorticity of the circumferentially inclined impeller flow passages of the modified models and the vorticity of the inner portion of the volute were significantly reduced over the entire plane.
From Figure 17, we can see that for the flow condition with maximum static pressure efficiency, the high vorticity region of the baseline fan was almost in the entire impeller flow passages. However, the distribution was non-uniform, and the high vorticity region in area (−180° < α < −90°) was small. The high vorticity region of the impeller flow passages of the optimized models was reduced (the dotted rectangular region). The reduction is especially obvious for model-B, and it also played an effective role in other parts (the dotted elliptical region).
In Figure 18, it can be seen that the high vorticity region in the impeller passages of the baseline fan in the z = 75 mm plane was larger than that in the z = 35 mm plane. The optimized models played an obvious role in reducing the high vorticity region. The high vorticity region of the impeller passages of optimized models decreased (the dotted elliptical region), which reduced the flow separation of the fluid in the impeller passages. Furthermore, the high vorticity region near the volute tongue of model-B was greatly reduced, and the flow separation phenomenon near the volute tongue was weakened.
In Figure 19, there are many high vorticity regions in the impeller passages of the baseline fan, and high vorticity also exists in the deflection region near the volute tongue. The modified models had no obvious improvement in the high vorticity region of the impeller passages, and the vorticity decreased significantly in the inner region of the volute. For model-B, the vorticity near the volute tongue decreased greatly, while the high vorticity region near the volute tongue of model-A and model-C increased. In Figure 20, we can see that the distribution of high vorticity in the impeller passages of the fan is approximately the same as that in Figure 19, but the region of high vorticity increases. The modified models played an important role in reducing the high vorticity region near the volute tongue, and model-B was the most effective. The vorticity distribution of the baseline fan and the optimization models was basically the same in the volute.
The three-dimensional distribution of vortices in the impeller and volute is further represented by the Q-criterion:
Q = 1 2 ( S 2 Ω 2 ) = 1 2 ( ( μ x ) 2 + ( ν y ) 2 + ( ω z ) 2 ) μ y ν x μ z ω x ν z ω y .
The tensor of strain rate and vorticity is:
S i j = 1 2 ( μ i x j μ j x i ) ,
Ω i j = 1 2 ( μ i x j + μ j x i ) ,
in which μ, v, and w are the velocities in the x, y, and z directions, respectively. As shown in Figure 21, there are vortices on the surface of the blade at low flow rate. The vortices of the optimized models decreased in size obviously in the impeller passages near the outlet of the volute (the dotted rectangular region), while there was no obvious change in other regions of the impeller. In Figure 22, it can be found that the volume of the vortices in the exit of the volute of model-A and model-B was diminished and it was enlarged for model-C, which prohibited the flow out of the volute (the dotted rectangular region).
Similarly, for flow conditions of maximum static pressure efficiency, the vortices of model-B and model-C were reduced in the impeller flow passages near the volute outlet (dotted rectangular region), as given in Figure 23, whereas the vortices of model-A were increased. At the exit of the volute, as given in Figure 24, the vortices of model-A in the vicinity of the volute tongue increased, and the volume of the vortices at the intermediate position of the model-B and model-C at the exit of the volute decreased (the dotted rectangular region). In the case of high flow rate (Q/Qn = 1.760), as shown in Figure 25, the vortices on both sides of the flow passages of the modified models were reduced. In Figure 26, the volume of the vortices at the exit of the volute of the model-B was reduced, while it increased for model-A; the volume of the vortices of the model-C was decreased, but the number of vortices was increased (the dotted rectangular region).

4. Conclusions

The influence of the inclination angle of the blade on the aerodynamic performance of a Sirocco fan was investigated by numerical simulation. The investigation was carried out on the baseline model and three modified models to obtain the performance of the fan. Generally, the modified models could effectively improve the performance of the fan by changing the inclination angle of the blades within a certain range.
The optimized models produced an increase in static pressure at rated flow rates and large flow rates, while it was slightly lower than the baseline fan at low flow rates. In particular, the increase in static pressure was the most obvious for model-B under rated and high flow rates. The increased static pressure and static pressure efficiency of model-B could reach as much as 14.01 Pa and 9.35%, compared with the baseline fan, at Q/Qn = 1.760. It was further found that at large flow rates (Q/Qn = 1.760), the flow separation in the impeller flow passages in the model-B was decreased, the vorticity of the impeller flow passages near the volute outlet was reduced, as well as the vortex volume, at the volute outlet.
In conclusion, the modification of the inclination angle of the blade can improve the aerodynamic performance of a fan and increase the static pressure. For the condition of high flow rate, the improved static pressure of the fan is more obvious, while the effect is gradually weakened by further increasing the angle.

Author Contributions

Conceptualization, S.N. and W.Z.; methodology, S.N. and W.Z.; software, S.N.; validation, S.N. and W.Z.; formal analysis, S.N. and W.Z.; investigation, W.C.; resources, W.C., J.X. and Y.W.; data curation, S.N.; writing-original draft preparation, S.N.; writing-review and editing, W.Z.; visualization, S.N., W.C. and J.X.; supervision, W.Z.; project administration, J.X. and W.Z.; funding acquisition, W.Z.

Funding

This work was supported by National Natural Science Foundation of China (51706205 and 11872337) and Natural Science Foundation of Zhejiang Province (LY18A020010).

Conflicts of Interest

The authors declare no conflict of interest.

References

  1. Bhope, D.V.; Padole, P.M. Experimental and theoretical analysis of stresses, noise and flow in centrifugal fan impeller. Mech Mach. Theory 2004, 39, 1257–1271. [Google Scholar] [CrossRef]
  2. Madhwesh, N.; Karanth, K.V.; Sharma, N.Y. Investigations into the flow behavior in a nonparallel shrouded diffuser of a centrifugal fan for augmented performance. J. Fluids Eng. 2018, 140, 081103. [Google Scholar] [CrossRef]
  3. Madhwesh, N.; Karanth, K.V.; Sharma, N.Y. Effect of innovative circular shroud fences on a centrifugal fan for augmented performance—A numerical analysis. J. Mech. Sci. Technol. 2018, 32, 185–197. [Google Scholar] [CrossRef]
  4. Tamaki, H. Experimental study on the effect of diffuser vane setting angle on centrifugal compressor performance. J. Turbomach. 2017, 139, 061001. [Google Scholar] [CrossRef]
  5. Wang, Y.; Dong, Q.L.; Zhang, Y.L. Meridional shape design and the internal flow investigation of centrifugal impeller. Proc. Inst. Mech. Eng. Part C J. Mech. Eng. Sci. 2017, 231, 4319–4330. [Google Scholar] [CrossRef]
  6. Jiang, B.Y.; Liu, H.; Li, B.; Wang, J. Effects of cut volute profile on squirrel cage fan performance and flow field. Adv. Mech. Eng. 2018, 10, 1–14. [Google Scholar] [CrossRef]
  7. Lv, Y.K.; Lv, Z.W.; Li, H.Y.; Song, B.J.; Cheng, B.; Zhang, B. Design of volute shape of centrifugal fans. Proc. Inst. Mech. Eng. Part A J. Power Energy 2016, 230, 141–153. [Google Scholar] [CrossRef]
  8. Li, C.X.; Wang, S.L.; Jia, Y.K. The performance of a centrifugal fan with enlarged impeller. Energy Convers. Manag. 2011, 52, 2902–2910. [Google Scholar] [CrossRef]
  9. Patil, S.R.; Chavan, S.T.; Jadhav, N.S.; Vadgeri, S.S. Effect of volute tongue clearance variation on performance of centrifugal blower by numerical and experimental analysis. Mater. Today Proc. 2018, 5, 3883–3894. [Google Scholar] [CrossRef]
  10. Prezelj, J.; Novakovic, T. Centrifugal fan with inclined blades for vacuum cleaner motor. Appl. Acoust. 2018, 140, 13–23. [Google Scholar] [CrossRef]
  11. Kim, J.H.; Cha, K.H.; Kim, K.Y. Parametric study on a forward-curved blades centrifugal fan with an impeller separated by an annular plate. J. Mech. Sci. Technol. 2013, 27, 1589–1595. [Google Scholar] [CrossRef]
  12. Wu, Y.; Dou, H.S.; Wei, Y.K.; Chen, X.P.; Chen, Y.N.; Cao, W.B. Effect of attack angle on flow characteristic of centrifugal fan. Mater. Sci. Eng. 2016, 129, 012059. [Google Scholar] [CrossRef]
  13. Zhang, L.; Wang, S.L.; Hu, C.X.; Zhang, Q. Multi-objective optimization design and experimental investigation of centrifugal fan performance. Chin. J. Mech. Eng. 2013, 26, 1267–1276. [Google Scholar] [CrossRef]
  14. Jung, U.H.; Kim, J.H.; Kim, J.H.; Park, C.H.; Jun, S.O.; Choi, Y.S. Optimum design of diffuser in a small high-speed centrifugal fan using CFD & DOE. J. Mech. Sci. Technol. 2016, 30, 1171–1184. [Google Scholar] [CrossRef]
  15. Chen, G.L.; Xu, W.; Zhao, J.Y.; Zhang, H.P. Energy-saving performance of flap-adjustment-based centrifugal fan. Energies 2018, 11, 162. [Google Scholar] [CrossRef]
  16. Younsi, M.; Bakir, F.; Kouidri, S.; Rey, R. Numerical and experimental study of unsteady flow in a centrifugal fan. Proc. Inst. Mech. Eng. Part A J. Power Energy 2007, 221, 1025–1036. [Google Scholar] [CrossRef]
  17. Jeon, W.H. A numerical study on the effects of design parameters on the performance and noise of a centrifugal fan. J. Sound Vib. 2003, 265, 221–230. [Google Scholar] [CrossRef]
  18. Wang, S.L.; Zhang, L.; Zhang, Q.; Ye, X.M. Numerical investigation of entropy generation and optimization on a centrifugal fan. Adv. Sci. Lett. 2011, 4, 2240–2245. [Google Scholar] [CrossRef]
  19. Yu, Z.; Li, S.; He, W.Q.; Wang, W.X. Numerical simulation of flow field for a whole centrifugal fan and analysis of the effects of blade inlet angle and impeller gap. HVAC R Res. 2005, 11, 263–283. [Google Scholar] [CrossRef]
  20. Rong, R.; Cui, K.; Wu, Z.R. Numerical study of centrifugal fan with slots in blade surface. Procedia Eng. 2015, 126, 588–591. [Google Scholar] [CrossRef]
  21. Zhang, J.; Chu, W.; Zhang, J.; Lv, Y. Vibroacoustic optimization study for the volute casing of a centrifugal fan. Appl. Sci. 2019, 9, 859. [Google Scholar] [CrossRef]
  22. Zhang, W.; Chen, X.; Yang, H.; Liang, H.; Wei, Y. Forced convection for flow across two tandem cylinders with rounded corners in a channel. Int. J. Heat Mass Trans. 2019, 130, 1053. [Google Scholar] [CrossRef]
  23. Wei, Y.; Yang, H.; Dou, H.-S.; Lin, Z.; Wang, Z.; Qian, Y. A novel two-dimensional coupled lattice Boltzmann model for thermal incompressible flows. Appl. Math. Comput. 2018, 339, 556. [Google Scholar] [CrossRef]
  24. Lun, Y.; Lin, L.; He, H.; Ye, X.; Zhu, Z.; Wei, Y. Effects of vortex structure on performance characteristics of a multiblade fan with inclined tongue. J. Power Energy 2019. [Google Scholar] [CrossRef]
Figure 1. Three-dimensional model of the baseline centrifugal fan: (a) whole fan; (b) impeller.
Applsci 09 03154 g001
Figure 2. Definition of inclination angle of the blade: (a) the 3D model; (b) definition of the inclination angle.
Applsci 09 03154 g002
Figure 3. Geometrical model of the centrifugal fan.
Applsci 09 03154 g003
Figure 4. Computational domain of the baseline centrifugal fan: (a) whole computational domain; (b) domain for the rotating impeller and the blades.
Applsci 09 03154 g004
Figure 5. Validation of static pressure rise with node number.
Applsci 09 03154 g005
Figure 6. Comparison of characteristic quantities for steady flow simulation: (a) static pressure–flow rate curve; (b) static pressure efficiency–flow rate curve.
Applsci 09 03154 g006
Figure 7. Performance curve for baseline model and fans with modified impellers: (a) static pressure–flow rate curve; (b) static pressure efficiency–flow rate curve.
Applsci 09 03154 g007
Figure 8. Definitions of the xy-plane (α is in clockwise direction) and z-plane: (a) xy-plane; (b) z-plane.
Applsci 09 03154 g008
Figure 9. Magnitude of absolute velocity of the impeller for the z = 35 mm plane at a low flow rate Q/Qn = 0.483: (A) model-A; (B) model-B; (C) model-C.
Applsci 09 03154 g009
Figure 10. Magnitude of absolute velocity of the impeller for the z = 75 mm plane at a low flow rate Q/Qn = 0.483: (A) model-A; (B) model-B; (C) model-C.
Applsci 09 03154 g010
Figure 11. Magnitude of absolute velocity of the impeller for the z = 35 mm plane at a rated flow rate Q/Qn = 1.000. (A) model-A; (B) model-B; (C) model-C.
Applsci 09 03154 g011
Figure 12. Magnitude of absolute velocity of the impeller for the z = 75 mm plane at a rated flow rate Q/Qn = 1.000. (A) model-A; (B) model-B; (C) model-C.
Applsci 09 03154 g012
Figure 13. Magnitude of absolute velocity of the impeller for the z = 35 mm plane at a high flow rate Q/Qn = 1.760. (A) model-A; (B) model-B; (C) model-C.
Applsci 09 03154 g013
Figure 14. Magnitude of absolute velocity of the impeller for the z = 75 mm plane at a high flow rate Q/Qn = 1.760. (A) model-A; (B) model-B; (C) model-C.
Applsci 09 03154 g014
Figure 15. Contour of vorticity magnitude for the z = 35 mm plane at a low flow rate Q/Qn = 0.483. (A) model-A; (B) model-B; (C) model-C.
Applsci 09 03154 g015
Figure 16. Contour of vorticity magnitude for the z = 75 mm plane at a low flow rate Q/Qn = 0.483: (A) model-A; (B) model-B; (C) model-C.
Applsci 09 03154 g016
Figure 17. Contour of vorticity magnitude for the z = 35 mm plane at a rated flow rate Q/Qn = 1.000: (A) model-A; (B) model-B; (C) model-C.
Applsci 09 03154 g017
Figure 18. Contour of vorticity magnitude for the z = 75 mm plane at a rated flow rate Q/Qn = 1.000: (A) model-A; (B) model-B; (C) model-C.
Applsci 09 03154 g018
Figure 19. Contour of vorticity magnitude for the z = 35 mm plane at a high flow rate Q/Qn = 1.760: (A) model-A; (B) model-B; (C) model-C.
Applsci 09 03154 g019
Figure 20. Contour of vorticity magnitude for the z = 75 mm plane at a high flow rate Q/Qn = 1.760: (A) model-A; (B) model-B; (C) model-C.
Applsci 09 03154 g020
Figure 21. Three-dimensional distribution of vortices in impeller passages at Q/Qn = 0.483: (A) model-A; (B) model-B; (C) model-C.
Applsci 09 03154 g021
Figure 22. Three-dimensional distribution of vortices in volutes at Q/Qn = 0.483: (A) model-A; (B) model-B; (C) model-C.
Applsci 09 03154 g022
Figure 23. Three-dimensional distribution of vortices in impeller passages at Q/Qn = 1.000: (A) model-A; (B) model-B; (C) model-C.
Applsci 09 03154 g023
Figure 24. Three-dimensional distribution of vortices in volutes at Q/Qn = 1.000: (A) model-A; (B) model-B; (C) model-C.
Applsci 09 03154 g024
Figure 25. Three-dimensional distribution of vortices in impeller passages at Q/Qn = 1.760: (A) model-A; (B) model-B; (C) model-C.
Applsci 09 03154 g025
Figure 26. Three-dimensional distribution of vortices in volutes at Q/Qn = 1.760: (A) model-A; (B) model-B; (C) model-C.
Applsci 09 03154 g026
Table 1. Specifications for the centrifugal fan.
SpecificationValue
Flow volume (m3·s−1)0.0893
Impeller length(mm)200
Exit area of volute (mm2)23,139
Rotation speed of impeller (rpm)1300
Outlet diameter of impeller (mm)150
Inlet diameter of impeller (mm)131.6
Number of blades40
Table 2. Number of nodes of the computational domain.
ComponentNumber of Nodes/103
Rotating wheel domain5640
Inlet duct domain1120
Outlet duct domain300
Volute domain420
All7480

