Abstract
Electrical network frequency (ENF) is a signature of a power distribution grid. It represents the deviation from the nominal frequency (50 or 60 Hz) of a power system network. The variations in ENF sequences within a grid are subject to load fluctuations within that particular grid. These ENF variations are inherently located in a multimedia signal, which is recorded close to the grid or directly from the mains power line. Thus, the specific location of a recording can be identified by analyzing the ENF sequences of the multimedia signal in absence of the concurrent power signal. In this article, a novel approach to location-stamp authentication based on ENF sequences of digital recordings is presented. ENF patterns are extracted from a number of power and audio signals recorded in different grid locations across the world. The extracted ENF signals are decomposed into low outliers and high outliers frequency segments and potential feature vectors are determined for these ENF segments by statistical and signal processing analysis. Then, a multi-class support vector machine (SVM) classification model is developed to verify the location-stamp information of the recordings. The performance evaluations corroborate the efficacy of the proposed framework.
1. Introduction
Power system frequency yields to instantaneous changes in accordance with load variations and control methodologies. Electrical network frequency (ENF) is the base frequency (50 or 60 Hz) of a power distribution network and ENF sequences are generated due to the fluctuations in frequency from the nominal ENF value. These ENF sequences contain recognizable patterns of a power grid, since the ENF variations are considered to be uniform for a particular grid and are separable from grid-to-grid observation. When a multimedia signal like an audio signal is recorded close to a grid or directly from the power supply line, power signatures of that specific grid location are embedded into the audio recording due to the electromagnetic interference (EMI). Thereby, the audio recording can be applied for location forensic analysis in the situation when the concurrent power recording is absent.
Since ENF sequences carry the power signatures of a distribution grid, audio authenticity can be tested for location-stamp verification by extracting and analyzing the ENF signals of the recordings. Location-stamp investigation yields to a significant tool for anti-terrorist drives and for preventing and prosecuting cyber crimes.
In this article, ENF signals are extracted from a number of digital recordings of power and audio signals captured in different grid locations and then a classification model is developed based on some potential feature vectors of the estimated ENF patterns. A comprehensive ENF analysis of digital audio recordings for forensics and security applications is articulated in Reference [1]. A thorough study on the factors affecting the capture of ENF sequences in audio recordings is documented in Reference [2]. However, a number of novel methodologies in regard to ENF extraction from power and multimedia (audio or video) signals are reported in References [3,4,5,6,7,8,9,10,11,12]. In this framework, Root MUSIC algorithm [5] is applied to extract ENF sequences from the digital recordings. Root MUSIC algorithm provides quite a high precision with a moderate computational cost to determine ENF signals.
As an intrinsic investigation of ENF signals, these sequences are analyzed based on the fluctuation trends with respect to the nominal ENF values. In this follow-up, the extracted ENF signals are decomposed into low outliers and high outliers frequency segments, where low outliers segments show less fluctuations in frequency value from the nominal ENF than the high outliers segments. Then, applying statistics and signal processing methods a number of potential feature components are determined separately from the low outliers and high outliers ENF signals. A multi-class support vector machine (SVM) classifier is developed to locate the sources of recordings. However, a number of ENF based location forensics analyses are proposed in References [13,14,15,16,17,18,19,20,21,22].
The reported ENF based location-stamp verification framework presents a decomposition of ENF sequences of digital power and audio signals considering fluctuation trends. Then potential features are experimentally extracted from the decomposed ENF sequences and to verify the quality of the features, Euclidean distance matrices are applied. The power and multimedia signals localization methods reported in the previous works do not consider the implicit analysis based on decomposition of the extracted ENF sequences in terms of frequency fluctuation trends. The presented outliers determination and potential features extraction from the decomposed ENF signals yield better understanding of frequency behavior of power and multimedia recordings collected from different grid locations around the world. In addition, an intrinsic experimental approach is carried out to extract potential feature vectors, which can be the basis for an efficient classification model. The quality of the proposed features is ensured as well. Thereby, the features extraction process represents a unique premise of the presented work. Moreover, based on the extracted feature vectors, a novel multi-class SVM classification model is developed, which incorporates custom and efficient training and testing algorithms and decision making structures to classify the grid locations accurately. The classification models and decision making structures represent another novel premise of the framework. For performance analysis, power and audio recordings are localized separately. Also, the system consisting of both types of recordings is tested for location authenticity. The proposed system yields to a very efficacious location-stamp verification framework, which presents location authenticities of both power and audio recordings comparable with and in most of cases superior to those reported in the earlier works. Moreover, along with reliability for location forensics analysis the proposed system yields to a computationally cost-effective framework for cyber-security applications.
The proposed location forensic application system is developed and tested in MATLAB® and the training and testing accuracies to locate the regions of the digital (power + audio) recordings are obtained as 97.42% and 92.00% respectively.
2. Enf Extraction and Database Formation Based on Location Specific Recordings
The training dataset contains power and audio recordings collected from 9 different grids [23]. The recordings in the training dataset are sampled at 1 kHz. Three grids operate at 60 Hz ENF, whereas six grids operate at 50 Hz ENF. Table 1 shows the grid locations and the associated grid names of the training dataset. In this section, separation of the recordings in terms of power and audio type, extraction of ENF signals and formation of the ENF database are articulated.

Table 1.
Grid Location-Stamp Information of the Training Dataset.
2.1. Separation of Power and Audio Recordings
The sequential approaches to separate the digital recordings as power and audio signals are described as follows:
Step-1: Initially a raw power or audio recording is segmented into a number of time frames. The window length of each time frame is empirically taken as 5 min. The dominant or center frequency of each signal component is determined using short time Fourier Transform (STFT).
Step-2: Then, the signal to noise ratios (SNRs) are evaluated considering [, ] as the power band of each signal. Here Hz is the step size of variation from the base frequency. Except this one, other bands are considered as noisy segments. The band power values are estimated using Welch power spectrum method. From the obtained SNR values, it is decided whether the recording is a power signal or an audio one. The underlying consideration is that at the nominal frequency or harmonics, the SNR values of power signals are greater than those of the audio signals.
2.2. Extraction of Enf Sequences
After separating the power and audio signals, ENF sequences are extracted from the recorded signals as follows:
2.2.1. Enf Sequences of Power Recordings
Step-1: Each 5 min long power signal is processed through a 2nd order Butterworth band-pass filter designed with a frequency band of [40, 70] Hz. The filtered signal is then segmented into a number of time frames for ENF estimation. In this work, each ENF time frame is set as 5 s long empirically.
Step-2: Root MUSIC algorithm is applied to extract the ENF sequence of each 5 s long signal segment. Thus, the power signatures embedded in a power recording are estimated.
2.2.2. Enf Sequences of Audio Recordings
Step-1: Each 5 min long audio signal is processed through a 2nd order Butterworth band-pass filter designed with a frequency band of [, ] Hz. The filtered signal is segmented into 15 s long time frames, which overlap with each of the corresponding previous frames for 10 s. Thereby, It can be implied that the overlapping of a time frame with its previous frame is about 66.67%.
Step-2: Root MUSIC algorithm is applied to extract the ENF sequence of each 5 s long signal segment. Thus, the power signatures embedded in an audio recording are estimated.
Figure 1, Figure 2, Figure 3 and Figure 4 present the sample ENF sequences extracted from power and audio recordings from different grid locations. The variations in frequency depend on the load fluctuations and power system control methodologies. Loads change from time to time during operation and thus the system frequency experiences variations accordingly. If the control techniques are effective and reliable, there are less fluctuations in frequency and less instabilities are observed in a power system network. Thus the ENF patterns can be viewed as a stability index of a particular power distribution grid. From Figure 1 it can be implied that the approximated maximum ENF variations from the nominal 60 Hz value for power recordings collected from Texas, Eastern U.S. and Western U.S. lie within the boundaries of [+0.02, −0.04] Hz, [+0.024, −0.03] Hz and [+0.025, −0.01] Hz respectively. However, from Figure 2 it can be observed that the approximated maximum ENF fluctuations from the nominal 60 Hz value for audio recordings collected from Texas, Eastern U.S. and Western U.S. lie within the boundaries of [+0.05, −0.05] Hz, [+0.05, −0.058] Hz and [+0.1, −0.2] Hz respectively. From Figure 3 it can be observed from this particular recorded power sample that the grid frequency in Lebanon is not stabilized at the desired 50 Hz value and the ENF fluctuations are quite high, whereas the approximated maximum ENF variations in Turkey, Ireland, France, Tenerife and India lie within the boundaries of [+0.03, −0.04] Hz, [+0.051, −0.03] Hz, [+0.018, −0.02] Hz, [+0.13, −0.04] Hz and [+0.15, −0.25] Hz respectively. From Figure 4 it can be observed from this particular recorded audio sample that the nominal frequency in Ireland is not stabilized at the desired 50 Hz value and the peak fluctuation in ENF is almost 0.15 Hz, whereas the approximated maximum ranges of ENF variations in Lebanon, Turkey, France, Tenerife and India are [+0.37, −0.04] Hz, [+0.07, −0.052] Hz, [+0.04, −0.08] Hz, [0, −0.16] Hz and [+0.26, −0.05] Hz respectively. From the above analysis based on ENF variations it can be yielded that the 60 Hz grids have better controlled and stable power systems to mitigate frequency fluctuations in comparison with the 50 Hz grids. However, the three 60 Hz grid locations are mainly in United States of America. Among the six 50 Hz power grids, France has the least ENF variations.
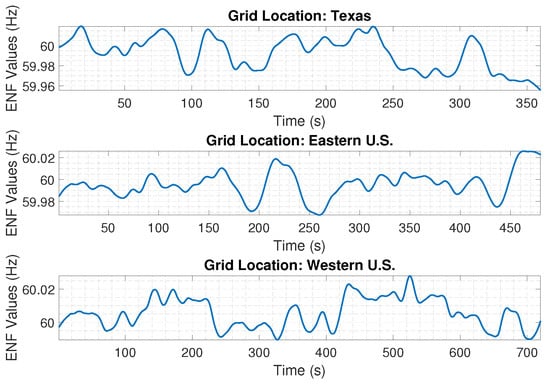
Figure 1.
Sample electrical network frequency (ENF) sequences extracted from power recordings from different 60 Hz grid locations.
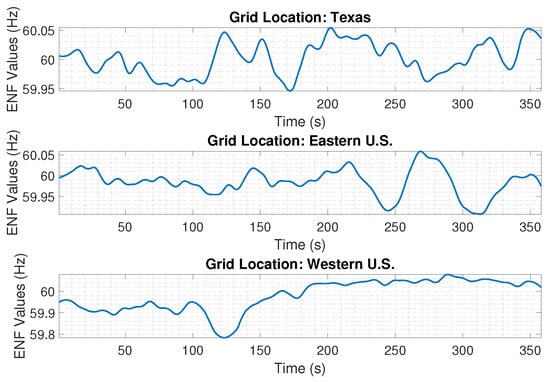
Figure 2.
Sample ENF sequences extracted from audio recordings from different 60 Hz grid locations.
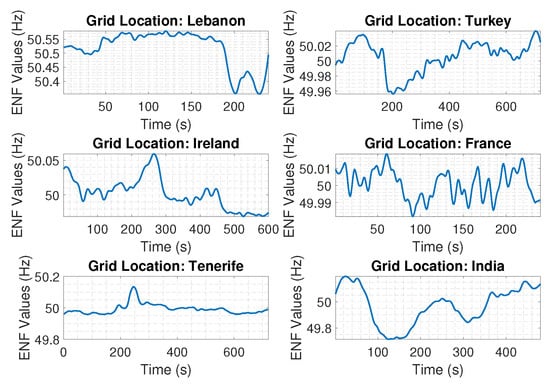
Figure 3.
Sample ENF sequences extracted from power recordings from different 50 Hz grid locations.
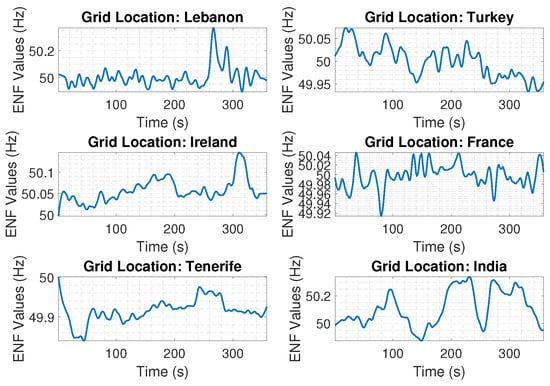
Figure 4.
Sample ENF sequences extracted from audio recordings from different 50 Hz grid locations.
2.3. Formation of Enf Database
After estimating the ENF signals, a database containing the extracted values is developed following a sequential process:
Step-1: After extracting the ENF sequences from the power and audio recordings, 50 Hz and 60 Hz ENF components are separated by measuring the mean values. Thus, for each power and audio recording 50 Hz and 60 Hz ENF sequences are recognized separately.
Step-2: Each ENF pattern can be segmented into two sequences—low outliers frequency (LOF) and high outliers frequency (HOF), where LOF sequences show less fluctuations in frequency than HOF sequences. For each case, LOF sequence is determined by passing the original ENF signal through a smoothening filter and HOF sequence is determined by subtracting the LOF sequence from the ENF signal [5]. HOF sequence can be determined as:
Here is the ENF value at sample n, is the HOF value, is the LOF value, and M are the smoothening filter coefficient and order respectively. Thus, for 50 Hz and 60 Hz power and audio recordings separate databases containing LOF and HOF ENF sequences are developed.
3. Features Extraction, Classification Model and Performance Analysis
This section describes the extracted feature vectors, developed multi-class classification model and its performance analysis for the proposed ENF based location forensic application.
3.1. Analysis of Extracted Feature Vectors
Statistics and signal processing techniques are applied to extract potential feature vectors from the ENF sequences. Table 2 presents the extracted feature vectors from the HOF and LOF segments of 60 Hz and 50 Hz power and audio ENF signals. From analysis, mean and median are proved to be good candidates for potential feature functions. Waveform length is another good candidate to extract a potential feature vector , which is measured as

Table 2.
Extracted Feature Vectors from the high outliers frequency (HOF) and low outliers frequency (LOF) Segments of the Original 60 Hz and 50 Hz ENF Sequences.
Here is an ENF sequence and N is the sequence length.
However, from analysis, crest factor (CF) and interquartile range (IQR) are found to be potential feature functions. For an ENF signal, CF is measured as the ratio of the peak value to the root mean square (rms) value. IQR refers to the difference between the ENF value below which lie 25% of the entire sequence data and that below which lie 75% of the entire sequence data. IQR analyzes the ENF sequence in terms of quartiles. Quartiles divide the data into four equal parts. The values that divide each part are called the first (), second () and third () quartiles. is the middle value of the first half of the sequence. is the median value and is the middle value of the second half of the sequence. IQR is equal to .
Another potential feature vector is derived from the modified mean absolute value function. It is defined as
Welch power spectrum method is used to measure the power spectral density of an ENF sequence, which is proved to be a good feature component. However, 4th order autoregressive AR(4) model of an ENF sequence can be expressed as
Here – are the AR coefficients and H is the final prediction error (the variance estimate of the white noise input to the AR model). In this work, AR parameters are estimated using Burg method, where and log of H are analyzed as potential feature vectors. However, no potential feature component is extracted from LOF 50 Hz power, HOF 60 Hz audio and LOF 50 Hz audio ENF segments.
Experiments are conducted for extracting feature vectors from the ENF signals. Then the most promising candidates for final features are selected by analyzing the Euclidean distance between each pair of features. The higher distance value of a particular feature from other features makes it a better feature to be selected. The concept and properties of Euclidean distance matrices are reported in Reference [24]. The Euclidean distance matrices of the selected features for 60 Hz power, 60 Hz audio, 50 Hz power and 50 Hz audio ENF sequences are presented in Table 3, Table 4, Table 5 and Table 6 respectively. All other features those are extracted in the experimental analysis such as 1st and 3rd coefficients of AR(4) model, kurtosis, mode, average amplitude change, r.m.s. shape factor, impulse factor, 5th and 6th order moments, entropy and so forth have very small and inconsiderable Euclidean distances with respect to the selected features. Therefore, those are not considered for final features selection. Thereby, Table 3, Table 4, Table 5 and Table 6 present the quality assurance of the selected feature components for classifying the digital recordings in terms of calculated Euclidean distance values between each pair of the features for 60 Hz and 50 Hz power and audio ENF sequences, respectively.

Table 3.
Euclidean Distance Matrix Calculated for Selected Features (Table 2) for 60 Hz Power ENF Signals.

Table 4.
Euclidean Distance Matrix Calculated for Selected Features (Table 2) for 60 Hz Audio ENF Signals.

Table 5.
Euclidean Distance Matrix Calculated for Selected Features (Table 2) for 50 Hz Power ENF Signals.

Table 6.
Euclidean Distance Matrix Calculated for Selected Features (Table 2) for 50 Hz Audio ENF Signals.
3.2. Classification Model
Based on the extracted feature components, a multi-class SVM classification model is developed. In this work, radial basis function (RBF) kernel is used and the classification technique follows a “one-versus-one” approach. Algorithm 1 describes the training algorithm, whereas Algorithm 2 describes the testing algorithm.
| Algorithm 1 Training Algorithm of the SVM Classifier |
|

Table 7.
Trained support vector machine (SVM) Models for 60 Hz and 50 Hz Power and Audio Recordings.
Table 7.
Trained support vector machine (SVM) Models for 60 Hz and 50 Hz Power and Audio Recordings.
| Power | Audio | ||
|---|---|---|---|
| Hz | Hz | Hz | Hz |
| 1. | 1. | 1. | 1. |
| 2. | 2. | 2. | 2. |
| 3. | 3. | 3. | 3. |
| - | 4. | - | - |
| - | 5. | - | - |
A, B, C, D, E, F, G, H and I are the 9 grids used for training SVM models. There are 14 trained SVM models in total.
| Algorithm 2 Testing Algorithm of the SVM Classifier |
|
However, for 50 Hz power dataset, there are six classes corresponding to six grids. Binary SVM classifier is applied in three ways to employ a multiclass classification method. Firstly, six classes are trained and tested following one versus all classification approach. Secondly, all possible combinations of the six classes are used taking two at a time. Then, all fifteen trained models are used for predicting new instances by means of the maximum vote as the decision making criterion. Both the techniques are implemented and the respective training and testing accuracies 50 Hz power and audio data are reported in Table 8. After experimenting with the fifteen trained models individually, it is found that classes B, H, E, D and G are strongly separable from class F. Therefore, five models named as , , , and are used as a subset of the all fifteen trained models in a hierarchical structure to make the decision making system for 50 Hz power signals. Figure 5 presents the hierarchical structure for 50 Hz power signals. This hierarchical classification structure provides better results than the two conventional ways of multiclass SVM classifier. Table 8 presents the performance comparisons of the classification techniques for 50 Hz power data. A similar hierarchical classification technique is developed and employed for 50 Hz audio data. Table 9 presents the performance comparisons of the classification methods for 50 Hz audio data and Figure 6 presents the hierarchical structure for decision making purpose. However, for three 60 Hz grids, the trained models are developed using possible combinations of the three classes taking two at a time.

Table 8.
Comparison of Different Classification Techniques for 50 Hz Power Data.
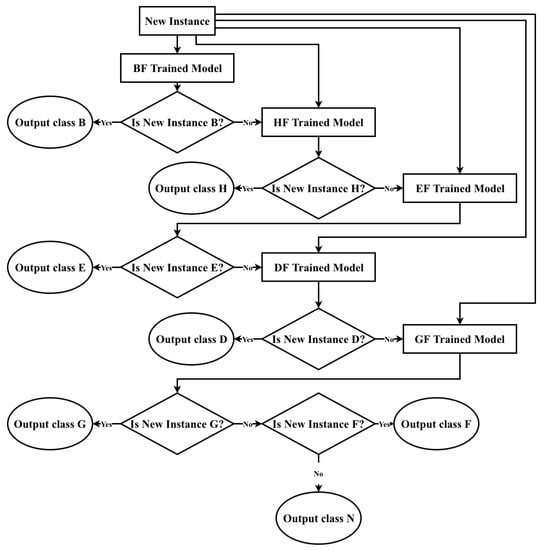
Figure 5.
Proposed hierarchical structure for classifying 50 Hz power data.

Table 9.
Comparison of Different Classification Techniques for 50 Hz Audio Data.
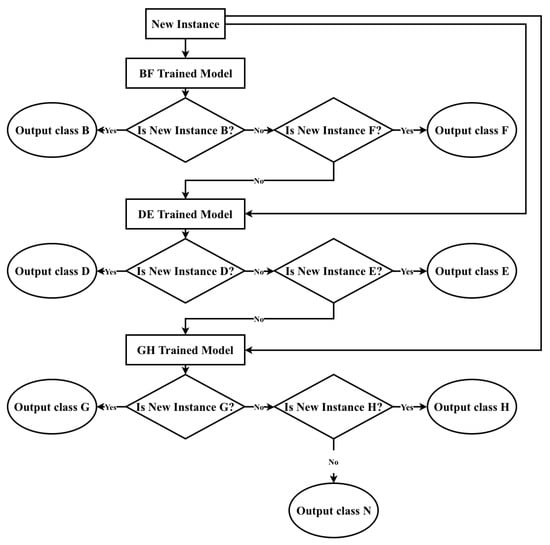
Figure 6.
Proposed hierarchical structure for classifying 50 Hz audio data.
3.3. Performance Analysis
The ground truths of the testing dataset are available in Reference [23]. Table 10 presents the classification accuracies (%) for different systems. From the results it can be observed that all the grids are identified correctly in training for only power signals. In case of testing for only power signals, all 3 grids of 60 Hz are identified correctly with 100% accuracy, whereas for 50 Hz power testing, approximately 95% accuracy is obtained for 6 grids. However, in case of only audio training, approximately 96% accuracy is obtained for 60 Hz grids and more than 89% accuracy is achieved for 50 Hz grids. In case of only audio testing, the correctness of the authenticity for 60 Hz grids is found to be more than 87% and for 50 Hz grids it is more than 83%. For the overall (power + audio) training data, the system is 97.42% accurate, whereas for the overall (power + audio) testing data, the system is 92.00% accurate. Table 11 presents the confusion matrix considering the power and audio ENF testing data. The confusion matrix is computed in terms of testing accuracies (%) of grid classification. The performance evaluations underscore the efficacy and reliability of the proposed ENF based location-stamp authentication system.

Table 10.
Training and Testing Accuracies (%) for 60 Hz and 50 Hz Power and Audio Recordings.

Table 11.
Confusion Matrix Calculated for Power + Audio ENF Testing Data–Accuracies (%).
4. Conclusions
Location forensics analysis is an important tool for security applications in the modern world. Different types of criminal and anti-social activities can be prevented and prosecuted by using location-stamp information of digital recordings. Therefore, novel and reliable location authenticity verification methods to investigate power and multimedia signals are significant.
In this article, a novel and efficacious location-stamp verification method based on ENF signals of power and audio recordings captured in different grid locations is presented. The extracted ENF signals are analyzed and decomposed into two segments based on the fluctuation trends from the base ENF values. The decomposed ENF segments are referred to as low outliers frequency (LOF) and high outliers frequency (HOF) signals. Potential feature components are extracted from these segments of the ENF sequences. Then a multi-class SVM classifier is applied using the extracted features to locate the regions of recordings. Custom training and testing algorithms for the SVM classifier are developed in this work. However, the obtained locations are verified with ground truths of the testing samples and the performance assessments affirm the efficiency of the proposed work.
Author Contributions
M.S. extracted the ENF sequences, developed the classification model and revised the manuscript. D.C. determined the feature vectors, tested the classification model and documented the manuscript. C.S. analyzed the ENF signals and edited the manuscript. S.A.F. conceptualized and supervised the work.
Funding
This research received no external funding.
Conflicts of Interest
The authors declare no conflict of interest.
References
- Grigoras, C. Digital audio recording analysis the electric network frequency criterion. Int. J. Speech Lang. Law 2005, 12, 63–76. [Google Scholar] [CrossRef]
- Hajj-Ahmad, A.; Wong, C.-W.; Gambino, S.; Zhu, Q.; Yu, M.; Wu, M. Factors affecting ENF capture in audio. IEEE Trans. Inf. Forensics Secur. 2018, 14, 277–288. [Google Scholar] [CrossRef]
- Cooper, A.J. An automated approach to the electric network frequency (ENF) criterion: Theory and practice. Int. J. Speech Lang. Law 2009, 16, 193–218. [Google Scholar] [CrossRef]
- Ojowu, O., Jr.; Karlsson, J.; Li, J.; Liu, Y. ENF extraction from digital recordings using adaptive techniques and frequency tracking. IEEE Trans. Inf. Forensics Secur. 2012, 7, 1330–1338. [Google Scholar] [CrossRef]
- Hajj-Ahmad, A.; Garg, R.; Wu, M. Instantaneous frequency estimation and localization for ENF signals. In Proceedings of the 2012 Asia Pacific Signal and Information Processing Association Annual Summit and Conference, Hollywood, CA, USA, 3–6 December 2012; pp. 1–10. [Google Scholar]
- Su, H.; Garg, R.; Hajj-Ahmad, A.; Wu, M. ENF analysis on recaptured audio recordings. In Proceedings of the 2013 IEEE International Conference on Acoustics, Speech and Signal Processing, Vancouver, BC, Canada, 26–31 May 2013; pp. 3018–3022. [Google Scholar]
- Bykhovsky, D.; Cohen, A. Electrical network frequency (ENF) maximum-likelihood estimation via a multitone harmonic model. IEEE Trans. Inf. Forensics Secur. 2013, 8, 744–753. [Google Scholar] [CrossRef]
- Fu, L.; Markham, P.N.; Conners, R.W.; Liu, Y. An improved discrete Fourier transform-based algorithm for electric network frequency extraction. IEEE Trans. Inf. Forensics Secur. 2013, 8, 1173–1181. [Google Scholar]
- Dosiek, L. Extracting electrical network frequency from digital recordings using frequency demodulation. IEEE Signal Process. Lett. 2015, 22, 691–695. [Google Scholar] [CrossRef]
- Hajj-Ahmad, A.; Garg, R.; Wu, M. Spectrum combining for ENF signal estimation. IEEE Signal Process. Lett. 2013, 20, 885–888. [Google Scholar] [CrossRef]
- Su, H.; Hajj-Ahmad, A.; Garg, R.; Wu, M. Exploiting rolling shutter for ENF signal extraction from video. In Proceedings of the 2014 IEEE International Conference on Image Processing (ICIP), Paris, France, 27–30 October 2014; pp. 5367–5371. [Google Scholar]
- Vatansever, S.; Dirik, A.E.; Memon, N. Detecting the presence of ENF signal in digital videos: A superpixel-based approach. IEEE Signal Process. Lett. 2017, 24, 1463–1467. [Google Scholar] [CrossRef]
- Liu, Y.; Yuan, Z.; Markham, P.N.; Conners, R.W.; Liu, Y. Application of power system frequency for digital audio authentication. IEEE Trans. Power Deliv. 2012, 27, 1820–1828. [Google Scholar] [CrossRef]
- Rodríguez, D.P.N.; Apolinário, J.A., Jr.; Biscainho, L.W.P. Audio authenticity: Detecting ENF discontinuity with high precision phase analysis. IEEE Trans. Inf. Forensics Secur. 2010, 5, 534–543. [Google Scholar] [CrossRef]
- Garg, R.; Hajj-Ahmad, A.; Wu, M. Geo-location estimation from electrical network frequency signals. In Proceedings of the 2013 IEEE International Conference on Acoustics, Speech and Signal Processing, Vancouver, BC, Canada, 26–31 May 2013; pp. 2862–2866. [Google Scholar]
- Hajj-Ahmad, A.; Garg, R.; Wu, M. ENF based location classification of sensor recordings. In Proceedings of the 2013 IEEE International Workshop on Information Forensics and Security (WIFS), Guangzhou, China, 18–21 November 2013; pp. 138–143. [Google Scholar]
- Hajj-Ahmad, A.; Garg, R.; Wu, M. ENF-Based Region-of-recording identification for media signals. IEEE Trans. Inf. Forensics Secur. 2015, 10, 1125–1136. [Google Scholar] [CrossRef]
- Hua, G.; Zhang, Y.; Goh, Y.; Thing, V.L.L. Audio authentication by exploring the absolute-error-map of ENF signals. IEEE Trans. Inf. Forensics Secur. 2016, 11, 1003–1016. [Google Scholar] [CrossRef]
- Yao, W.; Zhao, J.; Till, M.J.; You, S.; Cui, Y.; Liu, Y. Source location identification of distribution-level electric network frequency signals at multiple geographic scales. IEEE Access 2017, 5, 11166–11175. [Google Scholar] [CrossRef]
- Chakma, S.; Chowdhury, D.; Sarkar, M.; Haider, M.Z.; Fattah, S.A. Power line data based grid identification using signal processing. In Proceedings of the 2016 IEEE International WIE Conference on Electrical and Computer Engineering (WIECON-ECE), Pune, India, 19–21 December 2016; pp. 147–150. [Google Scholar]
- Wu, M.; Hajj-Ahmad, A.; Kirchner, M.; Ren, Y.; Zhang, C.; Campisi, P. Location signatures that you don’t see: Highlights from the IEEE signal processing cup 2016 student competition [SP education]. IEEE Signal Process. Mag. 2016, 33, 149–156. [Google Scholar] [CrossRef]
- Chowdhury, D.; Chakma, S.; Haque, M.R.; Sarkar, M.; Haider, M.Z.; Biswas, A.; Fattah, S.A.; Shahnaz, C. Location forensic application: Power grid signature analysis for location-stamp verification of recorded power and audio signals. In Proceedings of the 2017 IEEE Power & Energy Society (PES) General Meeting, Chicago, IL, USA, 16–20 July 2017; p. 1. [Google Scholar]
- IEEE SigPort. Information on the mAST ENF Power Signature Dataset. 2016. Available online: http://sigport.org/1108 (accessed on 24 October 2016).
- Gower, J.C. Properties of Euclidean and non-Euclidean distance matrices. Linear Algebra Appl. 1985, 67, 81–97. [Google Scholar] [CrossRef]
© 2019 by the authors. Licensee MDPI, Basel, Switzerland. This article is an open access article distributed under the terms and conditions of the Creative Commons Attribution (CC BY) license (http://creativecommons.org/licenses/by/4.0/).
