Abstract
Ion selective electrodes (ISE) were evaluated for use in a flue gas desulfurization (FGD) wastewater monitoring system. Calcium, chloride, nitrate, and nitrite ISE’s were calibrated in a broad range of concentrations that were designed to model an actual FGD wastewater sample that was obtained from an industrial partner. Ideal Nernst, Modified Nernst, and a multiparameter regression analysis was performed for each electrode and evaluated on general fit and sensitivity at anticipated operating conditions. The Ideal Nernst equation, even with correction for ionic strength, was not able to properly model actual electrode performance. The multiparameter regression was able to model the electrode performance with relative errors of 10–25% when ionic strengths were below 0.1 M. Through the evaluation of real-time sensor usage at real conditions, a methodology of washing and sampling rate is suggested to minimize error in the readings.
1. Introduction
The current USA Environmental Protection Agency (EPA) effluent limitations guidelines and standards for the Steam Electric Power Generating Point Source Category’s rule published in November 2015 mandates the limitation of toxic metals and other chemical compounds from coal-fired power plants [1]. On an annual basis, the rule incrementally reduces the amount of toxic metals, nutrients, and other pollutants that steam electric power plants are allowed to discharge (no more than 1.4 billion pounds or 635 million kg per year) and reduces water withdrawal by 57 billion gallons or 216 billion liters per year [1].
Currently, a Flue Gas Desulfurization (FGD) system is used to remove sulfur dioxide (SO2) from flue gas produced from coal-fired power plants. In the FGD system, limestone reacts with SO2 and produces gypsum. The process also removes mercury (Hg), selenium (Se), arsenic (As) and other elements and compounds. An FGD-wastewater treatment (WWT) system also uses various chemicals, such as organosulfides for mercury, to remove solids (e.g., CaSO4, Se, Hg, As, etc.,) from FGD wastewater. Chemicals required for the FGD wastewater treatment are stoichiometrically based on coal and limestone chemistry, various operational variables (e.g., cycle of absorber concentration, competing reactions, etc.,) and the numerical discharge limit regulated by the EPA. The plant operators periodically collect samples at various stages of the FGD wastewater process and measure numerous chemical species with hand-held kits that are later sent to commercial laboratory for further analysis. This entire process can be considered time consuming, costly, and tedious. Despite these factors, the level of detection and precision needed to detect contaminants at the designated limits require analysis by a commercial lab. The turnaround time on this analysis method may be weeks, making it difficult to control the process in a timely and efficient manner. This monitoring methodology is not acceptable for ensuring that discharge from the wastewater treatment plant is within current guidelines.
An alternate option which utilities may elect in the projected EPA rule for 2023 is even stricter, where the allowable discharges of mercury, selenium, nitrates, and nitrites are significantly lower [1]. The state-of-the-art FGD wastewater treatment technologies (e.g., CH2M Hill’s FGD wastewater treatment) will need to adapt new technologies to meet the discharge limits. Overall, real-time sensing of FGD wastewater during processing is needed to enable operators to make process adjustments in a timely manner for an acceptable, consistent discharge quality.
Therefore, a real-time robust sensor module that detects water quality at various stages in the FGD wastewater treatment plant units is necessary to keep in compliance with the regulatory discharge limits. Ion selective electrode-based sensor-arrays provide a convenient solution to these problems as they target the species of interest in the FGD wastewater treatment process and provide real-time monitoring.
This study evaluated several commercially available ion selective electrodes for their use in FGD wastewater systems. The goal of this study was to determine if ion selective electrodes (ISEs) were compatible with the general composition of FGD wastewater and if an accurate analytical methodology for FGD wastewater characterization could be constructed from both model solutions and actual FGD wastewater samples.
As of 2015, more than 66 companies are manufacturing water related sensors in the world, but only a handful of them market ISE, which utilize special membranes that allow for the measurement of specific ions. An ISE (with its own internal reference electrode) is immersed in an aqueous solution containing the ions to be measured, together with a separate, external reference electrode. The external reference can be separate or incorporated in the body of the ISE to form a Combination Electrode. The electrochemical circuit is completed by connecting the electrodes to a sensitive voltmeter using special low-noise cables and connectors. A potential difference is developed as the selected ions diffuse onto the ISE membrane surface and interact with the molecules imbedded in the membrane. Most ISEs use a polyvinylchloride (PVC) based membrane, but crystalline and other special membranes do exist.
Sensor distributors such as NexSens Technology (Fairborn, OH, USA), Thermo Fisher Scientific (Waltham, MA, USA), Fondriest Environmental (Fairborn, OH, USA), NICO2000 (London, UK), etc., market ISE electrodes for various metals and ions e.g., nitrates, chlorides, mercury, etc. The ISE electrodes can be calibrated for high-to-low concentration. The main advantage of the ISE is the flexibility to calibrate and monitor very high (mg/L) to very low concentration (ng/L). However, ISE are sensitive to the environment, especially operating temperature and pH. In some cases, a one-degree Celsius increase of water temperature may lead towards 1.5% detection error. Most of the ISE are calibrated with individual water solution and not tested with different atmospheres. FGD wastewater quality varies dramatically in different locations in the same FGD wastewater treatment plant. Off-the-shelf made ISE sensors are suitable for clean, room temperature water, whereas the FGD water is contaminated with various chemicals and temperature can be much higher than room temperature (76–125 °F/24–52 °C).
Previous studies have investigated the use and suitability of ISEs with various media, and have found that ISEs are typically cheaper and quicker for mass data acquisition compared to traditional methods such as inductively coupled plasma (ICP) analysis [2,3]. However, certain complications have occurred, such as the ionic strength of the undiluted solution either damaging the electrode membranes or causing poor quality in readings. Therefore, ISEs must be evaluated for use with FGD wastewater to determine if they would be a more viable option than standard procedures currently in use.
2. Materials and Methods
2.1. Equipment and Reagents
A Thermo Fisher Scientific Orion™ VersaStarPro™ 40b2 (Thermo Fisher, Waltham, MA, USA) was used for potential difference and temperature measurements. All electrodes are from NICO2000 (London, UK). Nitrate (ELIT 8021), nitrite (ELIT 8071), calcium (ELIT 8041) and chloride (ELIT 8261) ISEs were used with a lithium acetate reference electrode. The nitrate, nitrite, and calcium electrodes use a PVC based membrane, while the chloride electrode has a crystalline membrane. Sodium nitrite and sodium nitrate of granular reagent grade (Fisher Scientific, >98% pure) and anhydrous reagent grade calcium chloride (Fisher Scientific, >96% pure) was used for all experiments.
2.2. FGD Wastewater Samples
Samples of FGD wastewater were provided by American Electric Power (AEP). The samples were taken from five locations in the FGD wastewater treatment process. Two, 1-gallon (4 L) samples were taken from each location (the inlet purge tank, primary clarifier, equalization tank, secondary clarifier, and effluent stream). These samples were stored at 20 °C in polytetrafluoroethylene (PTFE) lined containers.
2.3. Induced Coupled Plasma-Optical Emission Spectroscopy (ICP-OES)
Cations in the liquid phase of the samples were analyzed using a Thermo iCAP 6000 ICP (Thermo Fisher, Waltham, MA, USA). Solid products were prepared using microwave acid digestion (Mars 6 microwave) with nitric acid (1 mg solids per 10 mL 85% nitric acid) at 200 °C followed by analysis on the same ICP. Both types of samples were filtered using Whatman 0.45-micron filters. Samples were analyzed at multiple factors of dilution (typically 10, 100, 1000, and 10,000). Data points that fell within the prepared calibration curve were averaged.
2.4. Uv-Vis Measurement Methdology for Determination of Nitrate and Nitrite Concentrations
Nitrate and Nitrite concentrations were determined using Hach test kits. Each sample was completed in triplicate to ensure accurate readings. Ion chromatography, the ideal option for measuring anions at high precision, was not used due to the high levels of contaminants in the FGDWW samples.
2.5. Experimental Methods
Experiments where created to determine the relationship between the potential difference of the electrodes and the concentration of nitrate, nitrite, calcium and chloride in an aqueous solution. A starting solution of 250 mL deionized (DI) water and a concentrated solution (ranging from 0.001 to 1 molar to target different concentration ranges) of preferred molarity for one of the selected ions was prepared for each test. The solutions were stirred and heated when necessary. Tests where preformed at 20, 30, and 50 °C. 1 mL of the concentrated solution was added into the DI water and mixed for 5 min to create the starting solution. The ISE of the selected ion, reference electrode and thermocouple were rinsed with DI water before being placed in the starting solution. After 5–10 min (to allow for the electrodes to stabilize) 5 measurements of the electrodes were taken, to increase reliability of the results. Next, 1 mL of the concentrated solution was added to the starting solution. This was repeated every 5 min until there was a minimal change in the measurements, this typically resulted after 25 or so additions, which is expected for this semi-batch style additive process. The final concentration of test solutions would be approximately 1/10th that of the concentrated solution. While the wait time for measurements is far greater than the response time, it ensured that accurate measurements were being taken.
A similar method was used to evaluate the effect of ion strength on electrode measurements. A starting solution was prepared using the methods previously described. A non-interfering ion was then added to the solution and the change in measurement was recorded after the system gave a constant measurement. Sodium chloride, calcium chloride, and sodium nitrate were used to increase the ionic strength of the solution. This method of interference evaluation is similar to those done in studies evaluating novel membranes for use in future analytical techniques [4,5]. The range of experimental values are shown in Table 1.

Table 1.
Experimental Range for Ion selective electrodes (ISE) Evaluation.
The electrodes were calibrated using standard solutions of calcum chloride for the calcium and chloride ISE’s, and sodium nitrate and sodium nitrite for the nitrate and nitrite electrodes respectively. These standard solutions were verified using the previously described ICP methods. For verification of accurate measurements, standard soltuions were used that spanned the intended test range. For example, a test of the calcium ISE that ranged from 0.0001 to 0.001 M would be calibrated at 0.00001, 0.0005, and 0.002 M before the experiments. These values were checked to previous measurements to ensure that the elctrodes were not damaged and had not experieneced significant performance degradation since the previous experiments. Two reference electrodes were used during this calibration process to verify that the reference electrode was functioning properly as well.
For the determining drift over time, measurements for calcium, chloride, nitrate, and nitrite ISEs were taken in a continuous flow-through system using Nico2000 ELIT 6-Channel Flow-through Monitor (MCC-MON-6f) for 8, 16, and 24 h. Figure 1 shows the set-up of this experimental system. The purpose of this set-up was to determine what corrections are needed to account for electrode drift over time. Additionally, different methods of electrode restorations were evaluated to determine how often cleaning is needed, and how it should be done.
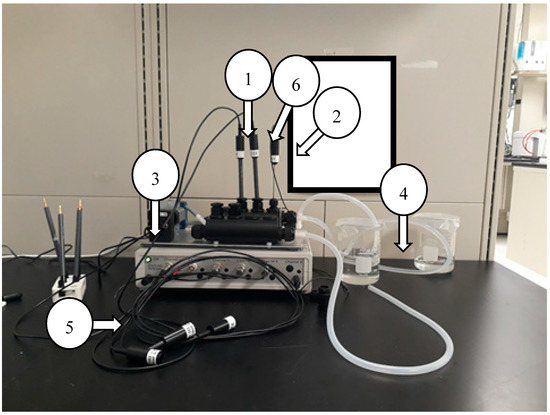
Figure 1.
Experimental set-up of Nico2000 ELIT 6-Channel Flow-through Monitor used for drift over time measurements; (1) ISE (2) Thermocouple (3) Peristatic Pump (4) Test Solution (5) Communication Channel (6) Reference Electrode.
3. Results and Discussion
3.1. Standard Characterization of FGD Wastewater
FGD wastewater samples were analyzed for pH and the concentrations of calcium, chloride, nitrate, nitrite, as well as select species that have been identified as interfering ions for any of the electrodes. Concentrations are shown in Table 2.
Table 2.
Concentration of Select Species in flue gas desulfurization (FGD) Wastewater in parts per million by mass (PPM).
The FGD wastewater samples had a consistent pH between 7 and 8.1. This measurement was taken by AEP at the time of collection and verified using a Thermo Scientific Orion multimeter and pH probe before each experiment. This is expected as a basic pH is necessary to maximize the solubility of sulfur compounds and is consistent with previous studies characterizing FGD wastewater [6]. Numerous interfering ions were tested for, but only iron and strontium were found at detectable levels (greater than 0.5 PPM).
Of the target species, nitrite and nitrate were found at the lowest levels at less than 2 ppm for all measurements. These values are significantly lower than those given in the EPA Final Rule 2015 data set, which is 96 ppm of N as nitrate and nitrite combined. More recent revisions have these targets lower at 4.4 mg/L over a 30-day average [1]. Target species calcium and chloride were found in relatively high concentrations of 0.028 and 0.15 M respectively. Combining all measured species, while accounting for the possibility of monovalent and divalent counter ions, gives an average ionic strength of solution of about 0.3 M. This ionic strength is well beyond the threshold that is normally considered acceptable for assuming idealized activity coefficients for electrochemical systems, which is typically around 0.01–0.1 M [6,7].
The determined amount of sulfur, assumed to be sulfate, is much higher than the average determined in the EPA Final Rule 2015 data set, 1770–2200 ppm S (5300–6600 ppm sulfate) compared to 420 ppm S (1260 ppm sulfate) [1]. This is particularly significant in regard to the use of the chloride electrode, which has a crystalline membrane that can be damaged by exposure to excessive amounts of sulfur (the exact quantities of which are not described by the manufacturer) [8]. During experimental trials, exposure of the chloride electrode to sulfate concentrations of less than 100 ppm caused no permanent damage or measurement deviations in the chloride electrode.
3.2. Nernst Parameters
For determination of the concentration of a select ion, the Nernst Equation (1) was used. Where E is potential in mV, E0 is standard potential in mV, α is the Nernst slope, and is the effective activity of the ion of interest. Interferences can be caused by either other ionic species impacting the activity of the ion of interest, species interfering with the membrane itself, or physical degradation of the ISE membrane. Interferences are broadly grouped in the term , is excluded as it is the ion of interest.
For ions with a charge magnitude of 1 an ideal α value is ±25.6 mV/decade, and an ion with a charge magnitude of 2 will have an α value of ±12.8 mV/decade. Decade in this definition is a change of an order of magnitude in the activity of the ion of interest in the natural log scale (i.e., from an effective 0.01 M to 0.001 M would be a decade in the base 10 scale, or 2.3 decades in the natural log scale).
Nernst parameters were found for the ions nitrate, nitrite, calcium, and chloride using the respective ISE’s. These parameters are shown in Table 3 and are fit to Equation (1). These values deviate severely from the expected values for monovalent and divalent ions, but this was expected for ion selective electrodes. These regressions were found to be accurate for ionic strengths below 0.1 M, after which the activity and concentration of each ion began deviating severely. Additional correlations with new experimental data were made using the Nernst equation to account for changes in temperature, as the FGD wastewater treatment system has varying temperatures throughout the process. The modified Nernst parameters are shown in Table 4.
Table 3.
Experimentally Determined Nernst Parameters for selective ions.
Table 4.
Modified Nernst Parameters for selective ions.
Modified Nernst parameters were derived by regression of linearized functions describing the slope and intercept. These linearizing functions were considered as constants, exponential, and logarithmic, which are expected behaviors for these systems [9]. These Nernst based relationships show that the calcium ISE is the most sensitive to temperature, as its slope changes drastically from 7.2 to 12 mV/decade at 25 and 50 °C, respectively. The other ISEs are only slightly affected with temperature. While there are corrections readily available (such as Nikolsky-Eisenman style equations) to account for factors such as ionic strength of solution, these factors were found to not accurately describe the composition of the actual FGD wastewater, and thus are not included in detail here [9]. Additional experiments were conducted to display the failures of this model to properly account for ionic strength interference. Residuals of the predicted versus the actual signal are compared to concentration of the target ions in Figure 2. The experimental sets with only varying ionic strength are encircled.
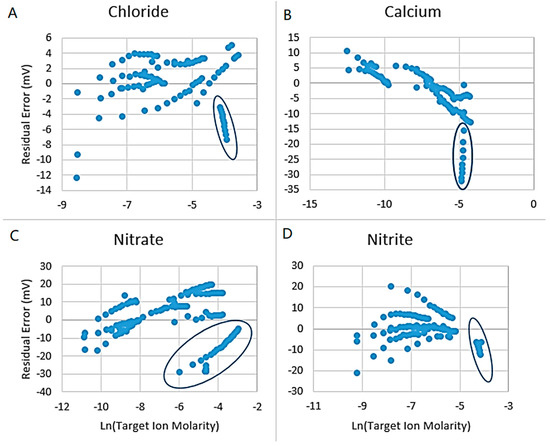
Figure 2.
Supplementary Control Experiments Demonstrating Error in The Modified Nernst Equation for (A) Chloride; (B) Calcium; (C) Nitrate; (D) Nitrite. Encircled data sets have only variation in ionic strength. This error is directly from assuming direct proportionality of activity and concentration.
3.3. Linear Regression Measurement Corrections
Evaluation of the ISEs has been tested using AEP samples. A small amount of sample (0.25–1.0 mL) was diluted with 250–500 mL of deionized water. The ISEs were submerged in this solution and several readings were taken. This process was done with several additions and the average concentration was calculated. However, this process had inconsistent results, with determined concentration varying within an order of magnitude of molarity.
The chloride ISE showed the ideal behavior, while the calcium ISE did not. This error was a result of the decreasing activity (compared to concentration) as additions were made. This model failed to properly address measurement interference that results from other ions being in solution (as is expected in any real measurement). With this problem identified, a full regression was completed using numerical methods in MATLAB by adding activity as an independent variable when deriving an equation to describe the relationship between concentration, temperature, and ISE reading. This numerical method replaced the Nernst parameters with a relationship that was fully developed from experimental data. This new regression method was justified as the ISEs had shown highly non-ideal behavior, whereas the Nernst equation is most applicable for ideal or close to ideal electrochemical solutions. Standard Error in Table 5 and Table 6 refer to the average discrepancy of experimental values with regressed values and can be viewed as the error of any concentration calculated with these equations.
Table 5.
Linear Regression Parameters and Terms for Calcium and Chloride ISE.
Table 6.
Linear Regression Parameters and Terms for Nitrate and Nitrite ISE.
A multilinear regression considering variables of temperature, concentration of target species, ionic strength of solution, and all interactions of these variables was used with MATLAB to regress an empirical model to describe the performance of each electrode. The generalized equation is shown below in Equations (2) and (3). Variables and labeling corresponds to Table 5 and Table 6 respectively, which also have the main results of the regression. Ci denotes a constant and Xi denotes an experimental parameter. Each regression was completed with a 95% confidence interval.
The chloride and calcium electrodes showed serious deviations when subjected to solutions with high ionic strength (in this case high is considered values above 0.1 M). This same level of interference was also not able to be corrected for in the nitrate and nitrate electrodes. Though the two equations use different parameters, the observed inaccuracies in measurements are still below 0.001 M for every electrode. This is comparable to previous studies that have used similar methodologies [7,10].
A sensitivity analysis was performed on the regression model for each electrode. Standard conditions for comparison were considered at an ionic strength of 0.01 M, concentration of 0.001 M, and temperature of 40 °C. The sensitivity analysis results are shown in Table 7. At standard and lower ionic strength, each electrode had a significant response to change in concentration, which was desired. Temperature changes had a small impact on every electrode, but this was expected and was accounted for in the regression with the concentration temperature interaction term. This indicates that the regression model could properly handle the expected variations in concentrations and temperatures that may occur in various FGD process units. However, significant error occurs when ionic concentrations were above 0.01 M. For electropotential measurement systems, this change in activity compared to concentration will be the limiting factor when the assumption of constant activity is made (such as in this case). So long as ionic strength is below 0.1 M, and target ion concentration is significantly (factor of 10 or more) above the standard error measurements shown in Table 5 and Table 6, the error can be assumed to be constant for all ISE’s.
Table 7.
Sensitivity analysis of Linear Regression Model.
3.4. Permanent and Temporary Drift Quantification and Correction
Measurements for calcium, chloride, nitrate, and nitrite ISEs were taken in a continuous flow-through system using Nico2000 ELIT 6-Channel Flow-through Monitor (MCC-MON-6f) for 8, 16, and 24 h. Figure 1 shows the set-up of this experimental system. The purpose of this set-up was to determine what corrections are needed to account for electrode drift over time. Additionally, different methods of electrode restorations were evaluated to determine how often cleaning is needed, and how it should be done.
During the usage of ISE electrodes, it was expected that the electrode potential would drift over time. For this reason, experiments were first kept short intentionally. This allowed for the electrodes to be washed and the drift ‘reset’. However, this would not be practical for long-term use in a wastewater treatment system. If the drift of the ISEs being used can be quantified, then washing can be delayed until it may avoid permanent damage to the electrode membrane. Figure 3 shows the reading of a calcium and chloride ISE over an 8 h period at relatively benign conditions (ionic strength below 0.001 M and at 20 °C). During this time the drift experienced is mostly linear with respect to time with spikes occurring randomly. Longer experimental trials (up to 24 h) did not give consistent or quantifiable trends.
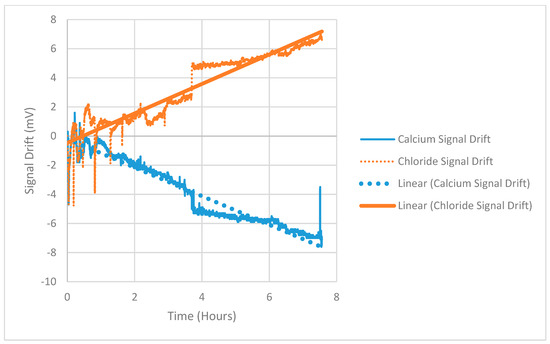
Figure 3.
Unfiltered Readings of Calcium and Chloride ion selective electrodes (ISE’s) for Drift Quantification; showing generally linear drift over an 8 h period.
A possible time dependent correction factor could be as simple as the one presented in Equation (4).
where, and are simple functions of time. refers to permanent damage that occurs to the membrane. This can be found by comparing the signal in a standard solution to that predicted by the empirical model. refers to drift that occurs over time as the electrode is being used. Once the electrode is removed from solution and cleaned, value will be set back to zero.
While keeping track of the permanent damage will increase the accuracy of measurements, it is still desirable to mitigate any damage. Several methods were tested to evaluate the best ways of restoring sensitivity to the electrode membrane including washing with deionized water, washing with 10% (by volume) ethanol (only for PVC membranes), and conditioning in concentrate of 1000 ppm target ion. The conditioning in high concentrate had shown the most promise in restoring sensitivity to the membrane, while washing with DI water had shown to be effective at resetting the short-term effects of drift. For example, two calcium electrodes were observed to have a 30-mV difference at the same test conditions. One electrode had been used heavily and the other was unused but conditioned previously and was ready to use. The old electrode was allowed to soak in a 1000 ppm Ca+ solution for 4 h. This reduced the difference between the electrodes to 9 mV. This routine type of care could increase the viability of using ISE’s in FGDWWT systems by extending electrode lifetime and increasing the reliability of readings.
3.5. Linear Regression Modeling for Drift Correction
Quantification and correction for drift during an 8 h exposure period should only require a linear correcting factor based on the aforementioned drift experiments. Equation (5) shows the full multilinear regression, with corresponding constants being found in Table 8. The results are extremely accurate when compared with experimental trials, with an order of magnitude higher resolution than the previously presented calibrations. Based off of these calibrations it is recommended that the electrodes be washed and reset every 8 h. This will ensure accurate results within ±1 mV for most readings with these electrodes.
Table 8.
Calibration Equations for Calcium and Chloride ISE’s.
3.6. Future Application of ISEs in FGD Processes
Nitrite and nitrate are of particular concern with the tested FGD wastewater samples. The existing concentrations are an order of magnitude below the lower limit of the electrodes. Furthermore, without dilution the error due to activity would be significant. Chloride and calcium concentrations in the FGD wastewater are high enough that dilution by a factor of 10,100 would still allow for useful measurements. Moreover, there is a relatively low concentration of interfering ions when considering the chloride and calcium ISEs. Further improvements can be made by incorporating developing technologies such as the recent work by Wang et al., but this still requires a description of the ISE behavior over a large range of conditions [11].
One additional consideration is the form of calcium present. FGD wastewater contains calcium primarily as gypsum, which can precipitate from water easily. Previous research has shown that the activity of calcium as gypsum is not exactly a linear function of ionic strength, but rather has a local minimum at relatively high concentrations (approximately 22,000 PPM) [12]. While this does not restrict the applications of the tested ISEs in this specific FGD wastewater treatment process, processes with higher concentrations of calcium may need more complex models.
4. Discussion
The sampled FGD wastewater system had lower nitrate and higher sulfate concentrations compared with compiled data on other FGD wastewater treatment systems. This could be due to the type of coal, concentration, and other factors. However, the lower concentration of calcium, and relatively low ionic strength is still too difficult for direct use with ISEs. Dilution by a factor of 10,100 is therefore required to achieve acceptable accuracy of measurements in the chloride and calcium ISEs. Dilution by any degree puts the nitrate and nitrite concentrations below the lower limit of detection for their respective ISEs. The higher accuracy of lab-based sensors would still be required for incremental and regulatory testing, but ISEs can provide instantaneous capability to detect large anomalies and perform continuous monitoring.
Author Contributions
K.M. was responsible for project administration, data collection, formal analysis, writing of the original draft and data visualization. M.T.R. was responsible for the project conceptualization, funding acquisition, supervision, project administration, and revision and editing of the writing. J.P.W. was responsible for project conceptualization, funding acquisition, and data validation.
Funding
This study has been funded by the Ohio Coal Development Office (project number OCDO-16-01).
Acknowledgments
Thomas L. Hart and Matthew Usher from American Electric Power (AEP) are acknowledged for providing guidance from the study. The FGD water samples for this project have also been provided by AEP. Bob Brown and Robert Statnick from OCDO are acknowledged for their guidance throughout this study. Graduate students Shanta Mazumder and Jeremy Browne and undergraduate students Tessa Berger, Rowan Grebeck, Erin Kelly, Alex Flamm, and John Morain are also acknowledged for their assistance on the laboratory research. Staff members at the Institute of Sustainable Energy and the Environment at the Ohio University are also acknowledged for providing analytical supports.
Conflicts of Interest
The authors declare no conflict of Interest.
References
- US EPA, O. Steam Electric Power Generating Effluent Guidelines—2015 Final Rule. Available online: https://www.epa.gov/eg/steam-electric-power-generating-effluent-guidelines-2015-final-rule (accessed on 28 December 2017).
- Yang, F.; Zhang, C.; Liu, Q.; Xu, C.; Xiong, Y.L. Ca2+-Selective Electrode: A Simple Method to Measure the Phytase-Aided Release of Bound Calcium in Soymilk. J. Food Compos. Anal. 2015, 39, 43–47. [Google Scholar] [CrossRef]
- Park, J.; Meissner, R.; Ducloux, O.; Renaud, P.; Fujita, H. A calcium ion-selective electrode array for monitoring the activity of HepG2/C3As in a microchannel. Sens. Actuators B Chem. 2012, 174, 473–477. [Google Scholar] [CrossRef]
- Bojdi, M.K.; Behbahani, M.; Sahragard, A.; Amin, B.G.; Fakhari, A.; Bagheri, A. A palladium imprinted polymer for highly selective and sensitive electrochemical determination of ultra-trace of palladium ions. Electrochim. Acta 2014, 149, 108–116. [Google Scholar] [CrossRef]
- Bojdi, M.K.; Mashhadizadeh, M.H.; Behbahani, M.; Farahani, A.; Davarani, S.S.H.; Bagheri, A. Synthesis, characterization and application of novel lead imprinted polymer nanoparticles as a high selective electrochemical sensor for ultra-trace determination of lead ions in complex matrixes. Electrochim. Acta 2014, 136, 59–65. [Google Scholar] [CrossRef]
- Coday, B.D.; Luxbacher, T.; Childress, A.E.; Almaraz, N.; Xu, P.; Cath, T.Y. Indirect determination of zeta potential at high ionic strength: Specific application to semipermeable polymeric membranes. J. Membr. Sci. 2015, 478, 58–64. [Google Scholar] [CrossRef]
- Lindner, E.; Pendley, B.D. A tutorial on the application of ion-selective electrode potentiometry: An analytical method with unique qualities, unexplored opportunities and potential pitfalls; Tutorial. Anal. Chim. Acta 2013, 762, 1–13. [Google Scholar] [CrossRef] [PubMed]
- Pungor, E.; Pungor, E. Ion-selective electrodes—Analogies and conclusions. Electroanalysis 1996, 8, 348–352. [Google Scholar] [CrossRef]
- Prentice, G. Electrochemical Engineering Principles; Prentice Hall: Upper Saddle River, NJ, USA, 1991. [Google Scholar]
- Ceresa, A.; Sokalski, T.; Pretsch, E. Influence of key parameters on the lower detection limit and response function of solvent polymeric membrane ion-selective electrodes. J. Electroanal. Chem. 2001, 501, 70–76. [Google Scholar] [CrossRef]
- Wang, C.; Yuan, H.; Duan, Z.; Xiao, D. Integrated multi-ISE arrays with improved sensitivity, accuracy and precision. Sci. Rep. 2017, 7, 44771. [Google Scholar] [CrossRef] [PubMed]
- Haghtalab, A.; Badizad, M.H. Solubility of Gypsum in Aqueous NaCl + K2SO4 Solution Using Calcium Ion Selective Electrode-Investigation of Ionic Interactions. Fluid Phase Equilibria 2016, 409, 341–353. [Google Scholar] [CrossRef]
© 2019 by the authors. Licensee MDPI, Basel, Switzerland. This article is an open access article distributed under the terms and conditions of the Creative Commons Attribution (CC BY) license (http://creativecommons.org/licenses/by/4.0/).