1. Introduction
Textile cutting pieces [
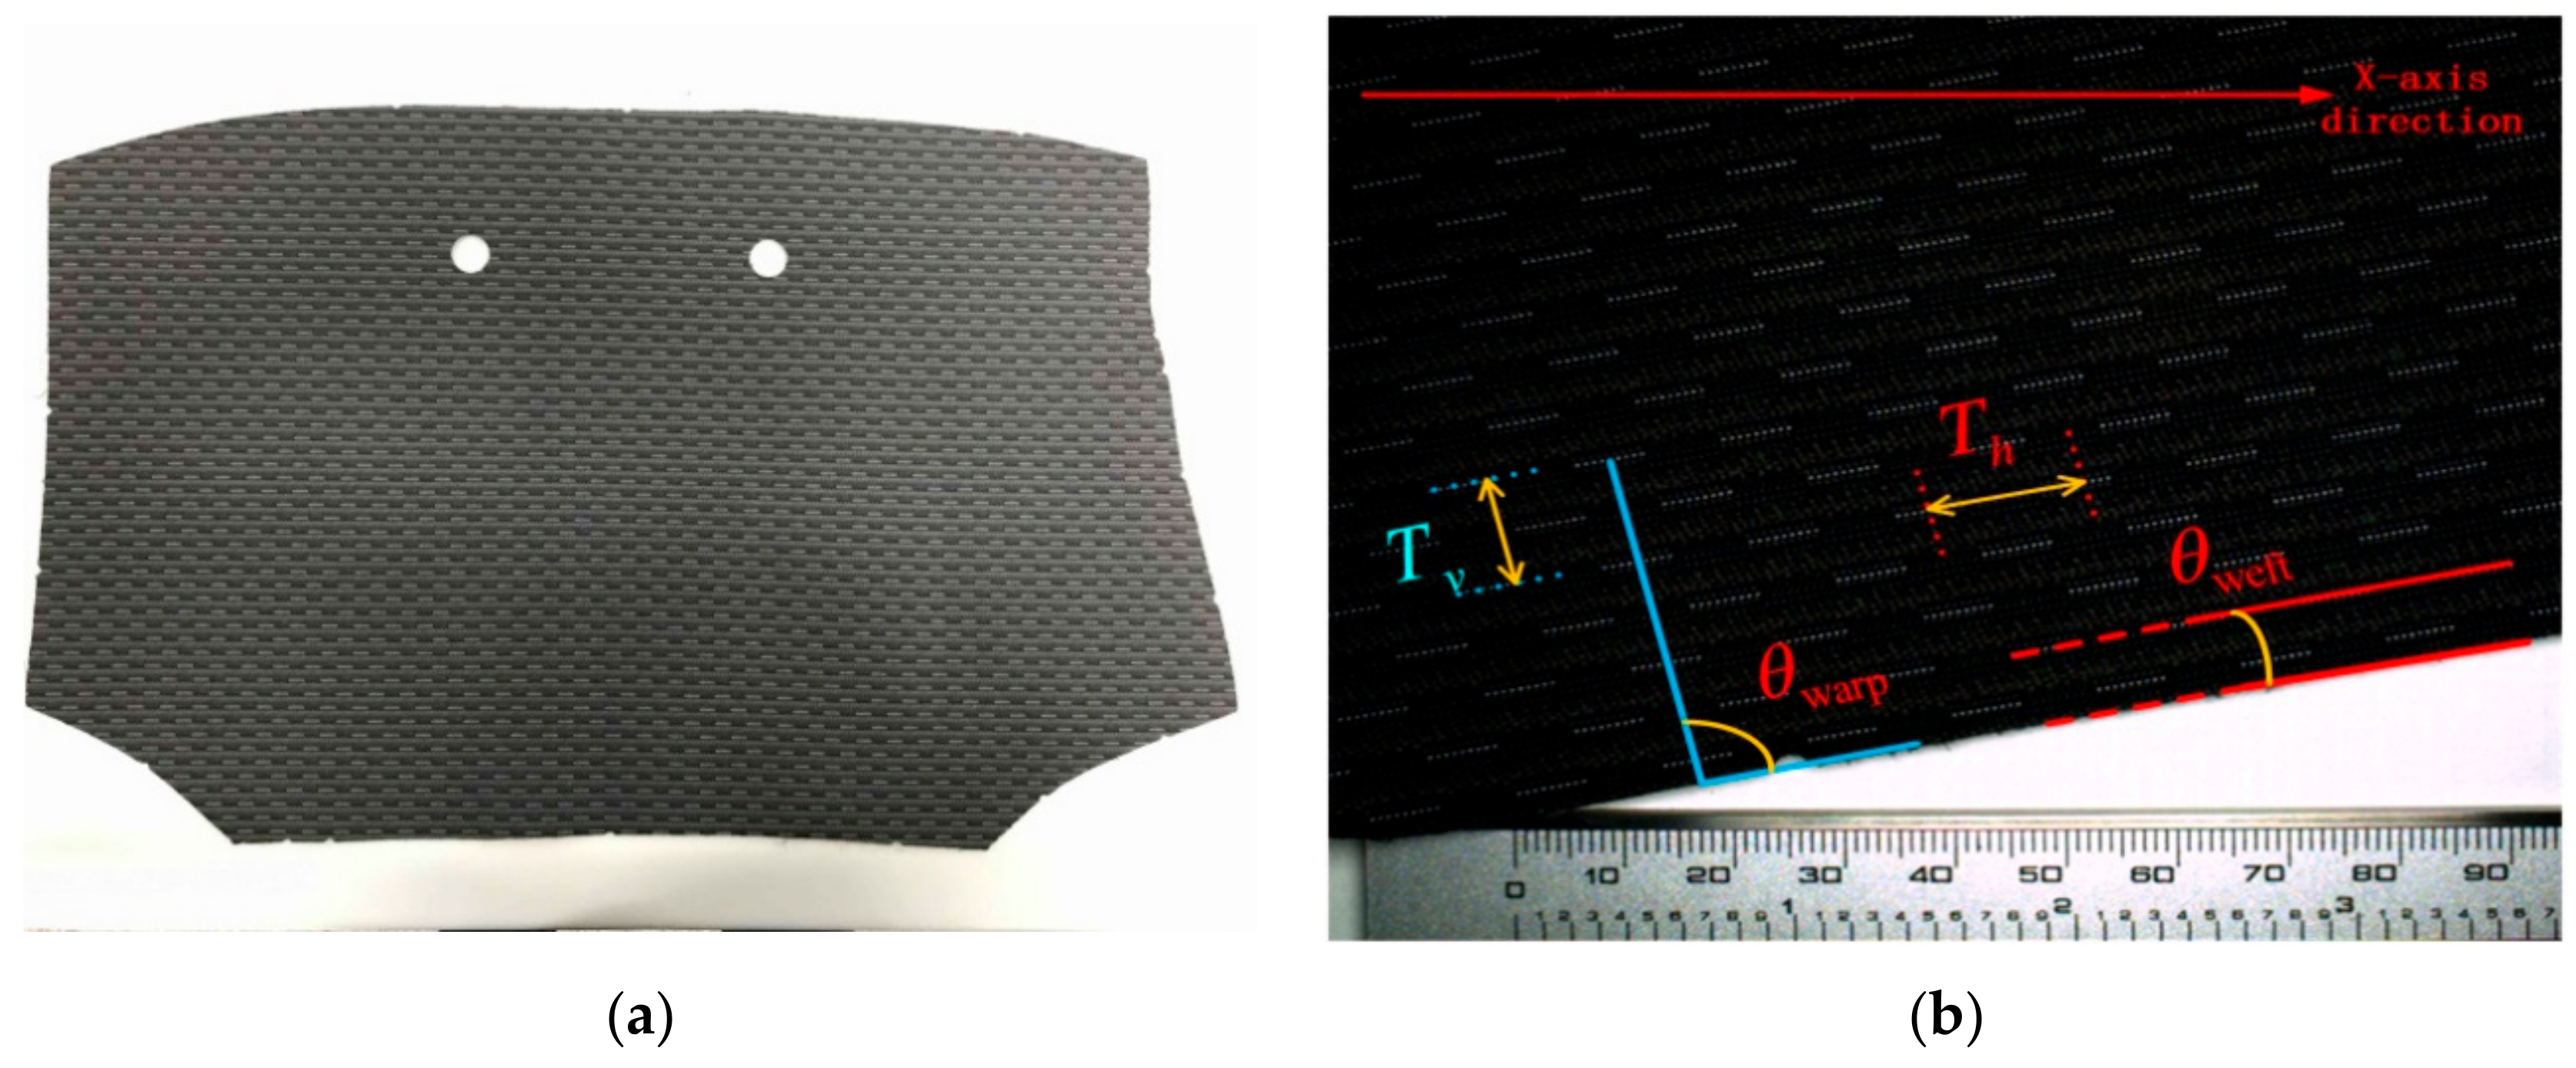
1], as semi-finished products, have been widely used in car seats and garments areas. Most of the finished products are stitched from these pieces, and the performance of the pieces (see
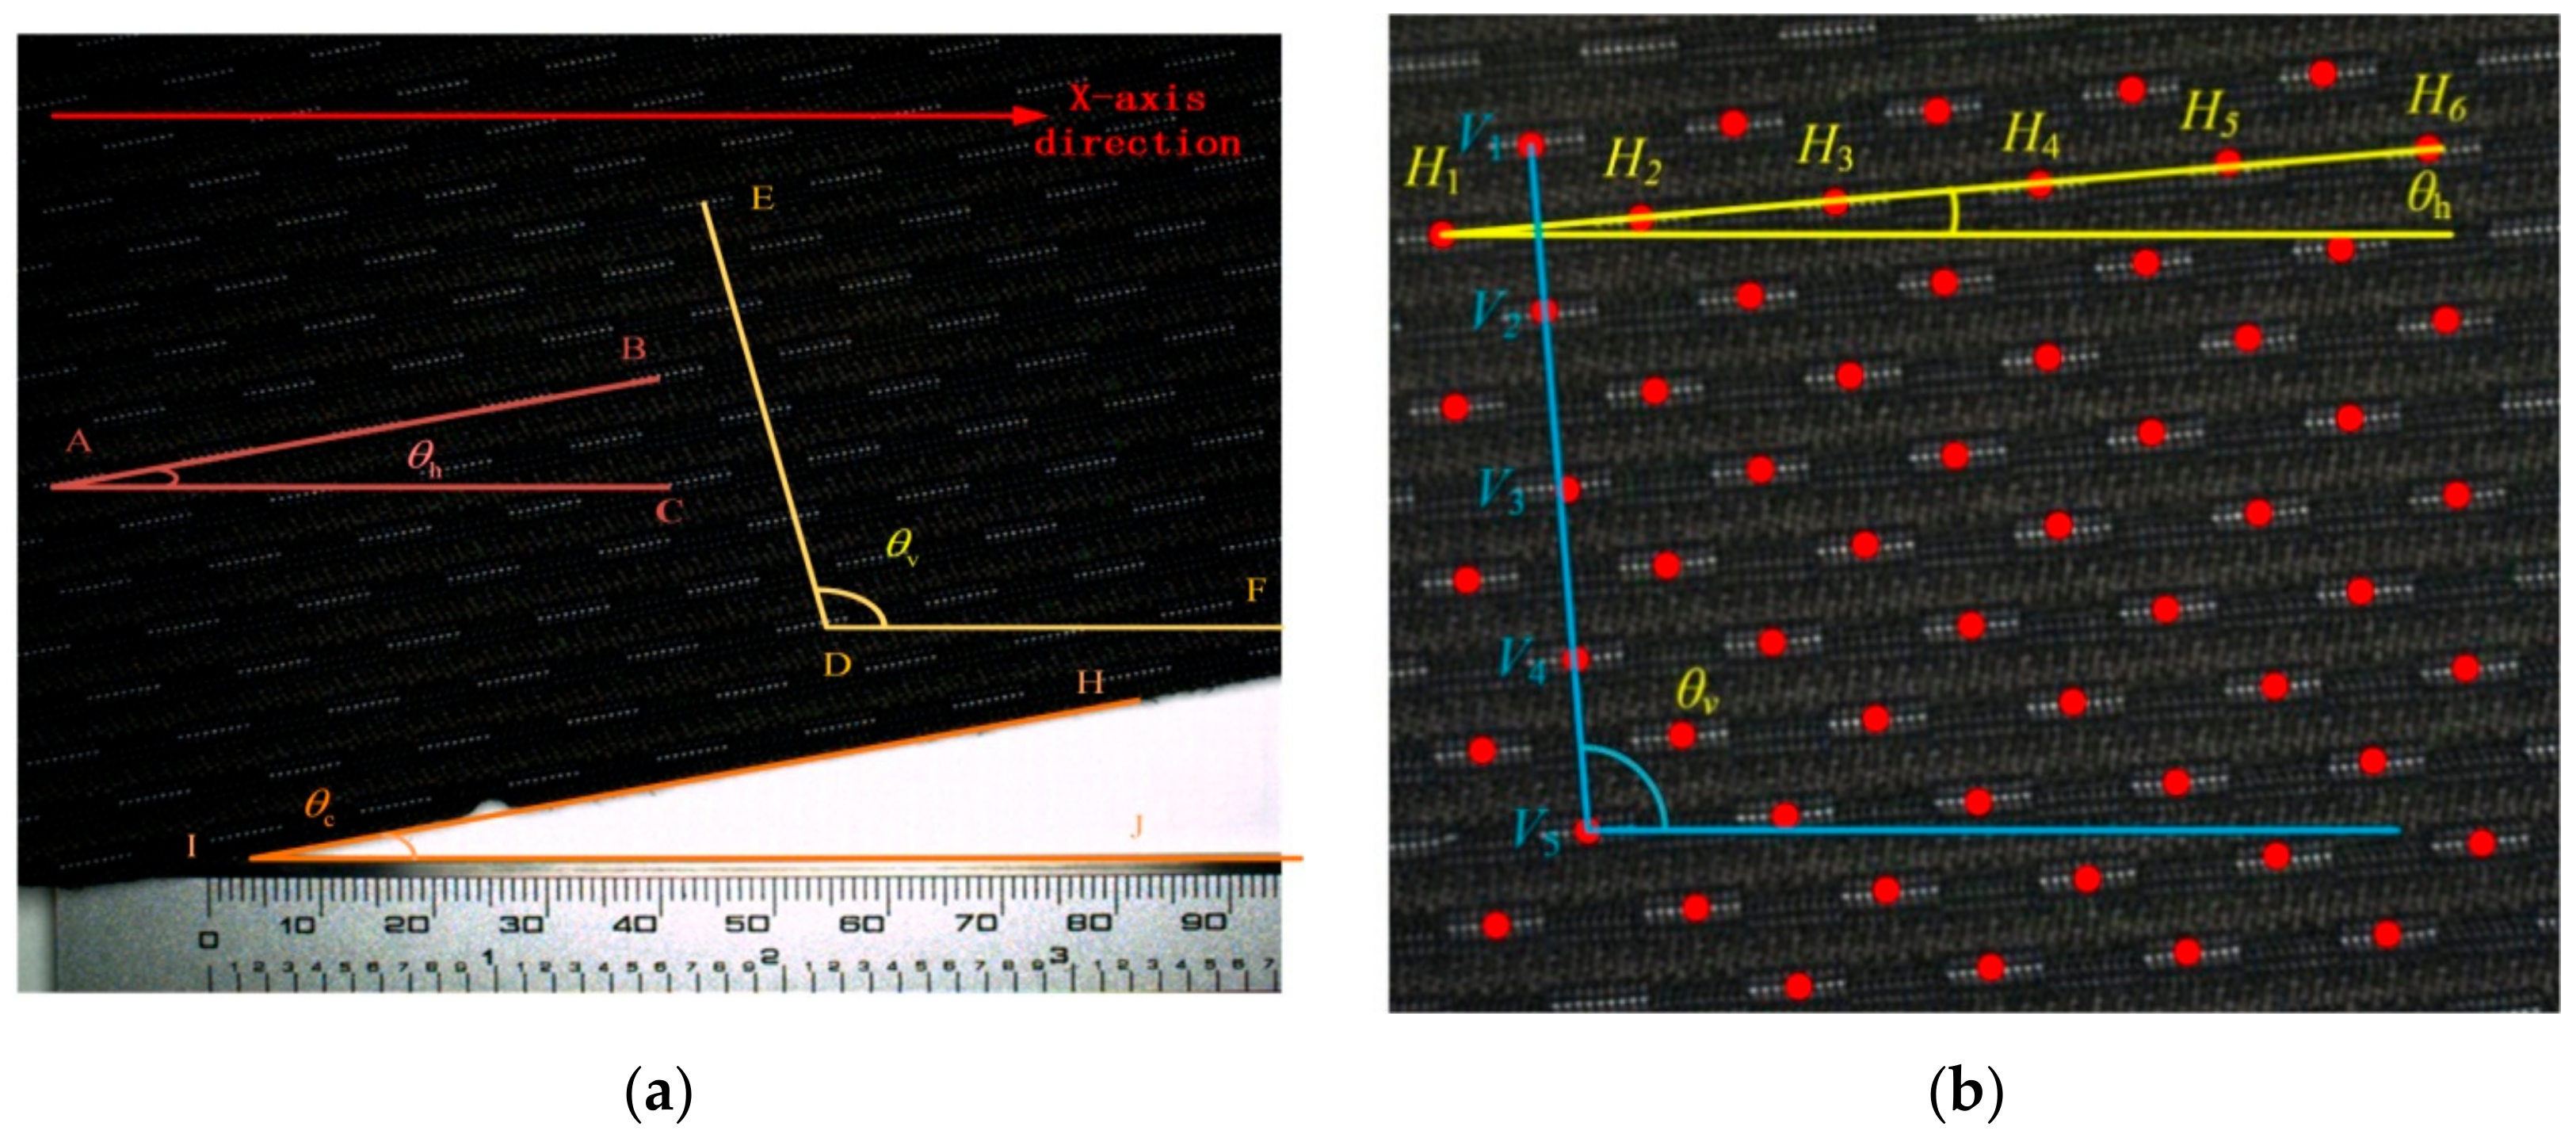
Figure 1a) is a key to determining the quality of the finished product. The quality of the textile pieces depends largely on their preformed geometry structure, such as the period length and skew angle of the pattern. The skew angles
θweft and
θwarp are defined as the angle between the line along the horizontal or vertical period direction of the pattern and the overall contour of the piece (see
Figure 1b). The skew angle is a critical parameter of multi-period pattern pieces, for it can affect the overall regularity of the pattern. The period length
Thi and
Tvi (
i = 1, 2…) are defined as the length of one complete pattern period distance in the horizontal and vertical directions, can be used to infer the local regularity of the pattern (see
Figure 1b). These two parameters can reflect the design difference between the pattern sample and the standard template, so they can be used as a criterion for judging the quality of the pattern.
The two parameters are used to check whether the cutting pieces are qualified or not in the industrial area. At present, the manual method is still the main measurement way, which is time and manpower-consuming, and due to the large amount of pattern types, only limited numbers of cutting pieces are sampled. In addition, a cutting piece with complicated patterns cannot be effectively detected by the human eyes, and this phenomenon often causes quality problems.
The periodicity of the pattern has great research significance for the pattern fabric, and is the basis for measuring the skew angle and period length of the multi-period pattern. Therefore, the period extraction of the pattern becomes the key and difficult point in measuring the parameters of a pattern. In recent years, with the rapid development of image processing technology, many approaches have been proposed for fabric periodic research. In general, these approaches can be classified into three groups: grey level co-occurrence matrix-based (GLCM) [
2]; distance matching function-based (DMF) [
3]; and image autocorrelation function-based [
4]. The method based on GLCM is a common technique in statistical image analysis that is used to estimate image properties related to second-order statistics. Li [
5] and his colleagues research the variation of the eigenvalues of four grey level co-occurrence matrices to determine the period characteristics of texture, and achieved relatively good results. Xiao, et al. [
6] calculated the correlation coefficient between different regions enclosed by fabric yarns based on the grey level co-occurrence matrix method to complete the segmentation of a striped fabric. The features calculated by the co-occurrence matrix can be used for periodic detection of finite-size pattern images and the computation speed is relatively fast. However, since the quantization angle and distance are frequently used to reduce the computation time when calculating the co-occurrence matrix features, the accuracy of texture cycle extraction is significantly reduced. The method based on DMF can directly use the grey value of the texture to find the texture period and requires less computation time than the traditional co-occurrence matrix approach. Jing [
7] determined the period of the printed fabrics by calculating the maximum value of the second forward difference of the two-dimensional DMF. Zhou [
8] implemented an automatic measurement of the texture period of woven fabric images by combining frequency domain analysis with a distance matching function and improved the stability and computational efficiency of cycle measurement. The distance matching function is an effective method for extracting pattern period. For images of any size, the distance matching function has a faster calculation speed than the traditional co-occurrence matrix method. It is suitable for patterns of finite size. However, when the brightness and shape of the periodic pattern are inconsistent, the distance matching function cannot effectively extract the pattern period. The method based on an autocorrelation function calculates the correlation coefficient of the texture by the autocorrelation function of the image to analyze the periodicity of the texture. Wu [
9] calculated the autocorrelation function of the texture edge to determine the matrix of the autocorrelation function, and then extracted the periodic and directional features of the texture. The image autocorrelation function method is easy to implement and has strong adaptability. However, the pattern period detection method based on the autocorrelation function can only reflect the periodic features of the pattern and has no other features. Moreover, it cannot efficiently acquire periodic information of a periodic pattern that has a sparsely distributed and large size in the image. Similarly, the measurement of the surface braiding angle and pitch length of the three-dimensional braided composite was realized by the corner detection-based method [
10,
11,
12]. However, this algorithm based on corner detection is not suitable for the measurement of multi-period pattern parameters. When faced with complicated patterns, the corner points detected by the corner detection algorithm are disordered and the pseudo corner points are too many, and the center point of the pattern cannot be accurately found, so that the pattern period cannot be effectively extracted.
In this paper, a new measurement method based on Faster region convolutional neural network (R-CNN) [
13] was proposed to measure the parameters of the multi-period pattern. At present, Faster R-CNN has been applied in many fields, such as license plate detection [
14], scene text detection [
15] and optical image detection [
16], and achieved excellent results with its powerful performance. As Faster R-CNN has the advantages of high object detection accuracy, fast speed and strong adaptability, we used Faster R-CNN as the pattern detector to locate the pattern and extract the pattern period. The contributions of this paper are as follows:
We have established the first multi-period pattern dataset. This dataset contains 5000 pattern images with size of 512 × 640 pixels and contains a total of six types of patterns. Moreover, each pattern in the image was annotated as an object in VOC 2007 format.
We have proposed to use the object detection network in deep learning to locate the pattern. We selected the training model of Faster R-CNN as the pattern detector and generated the bounding boxes enclosing the patterns to achieve the approximate positioning of the pattern.
We have proposed an automatic threshold method to extract the contour of the pattern and calculated the center points to obtain the precise positioning of the pattern. The four-neighbor-method was used to fill the missing center points to acquire the center point map that reflects the periodic characteristics of the pattern.
2. Methods
In this section, the period length and pattern skew angles of textile cutting pieces were measured based on Faster R-CNN. Firstly, original images were acquired and the pattern dataset were created. Then, the patterns were detected by a model trained by Faster R-CNN net. Secondly, the approximate location of the pattern (the position of the whole patterns) were obtained based on the detected pattern. Thirdly, the precise positions of the pattern (geometric center points of pattern) were detected based on the approximate position results using the automatic threshold segmentation method. Missing center points were filled based on the four-neighbor-method to obtain a complete center point map. Finally, the skew angle and period length were measured based on the detected center points.
2.1. Image Acquisition and Pattern Dataset Creation
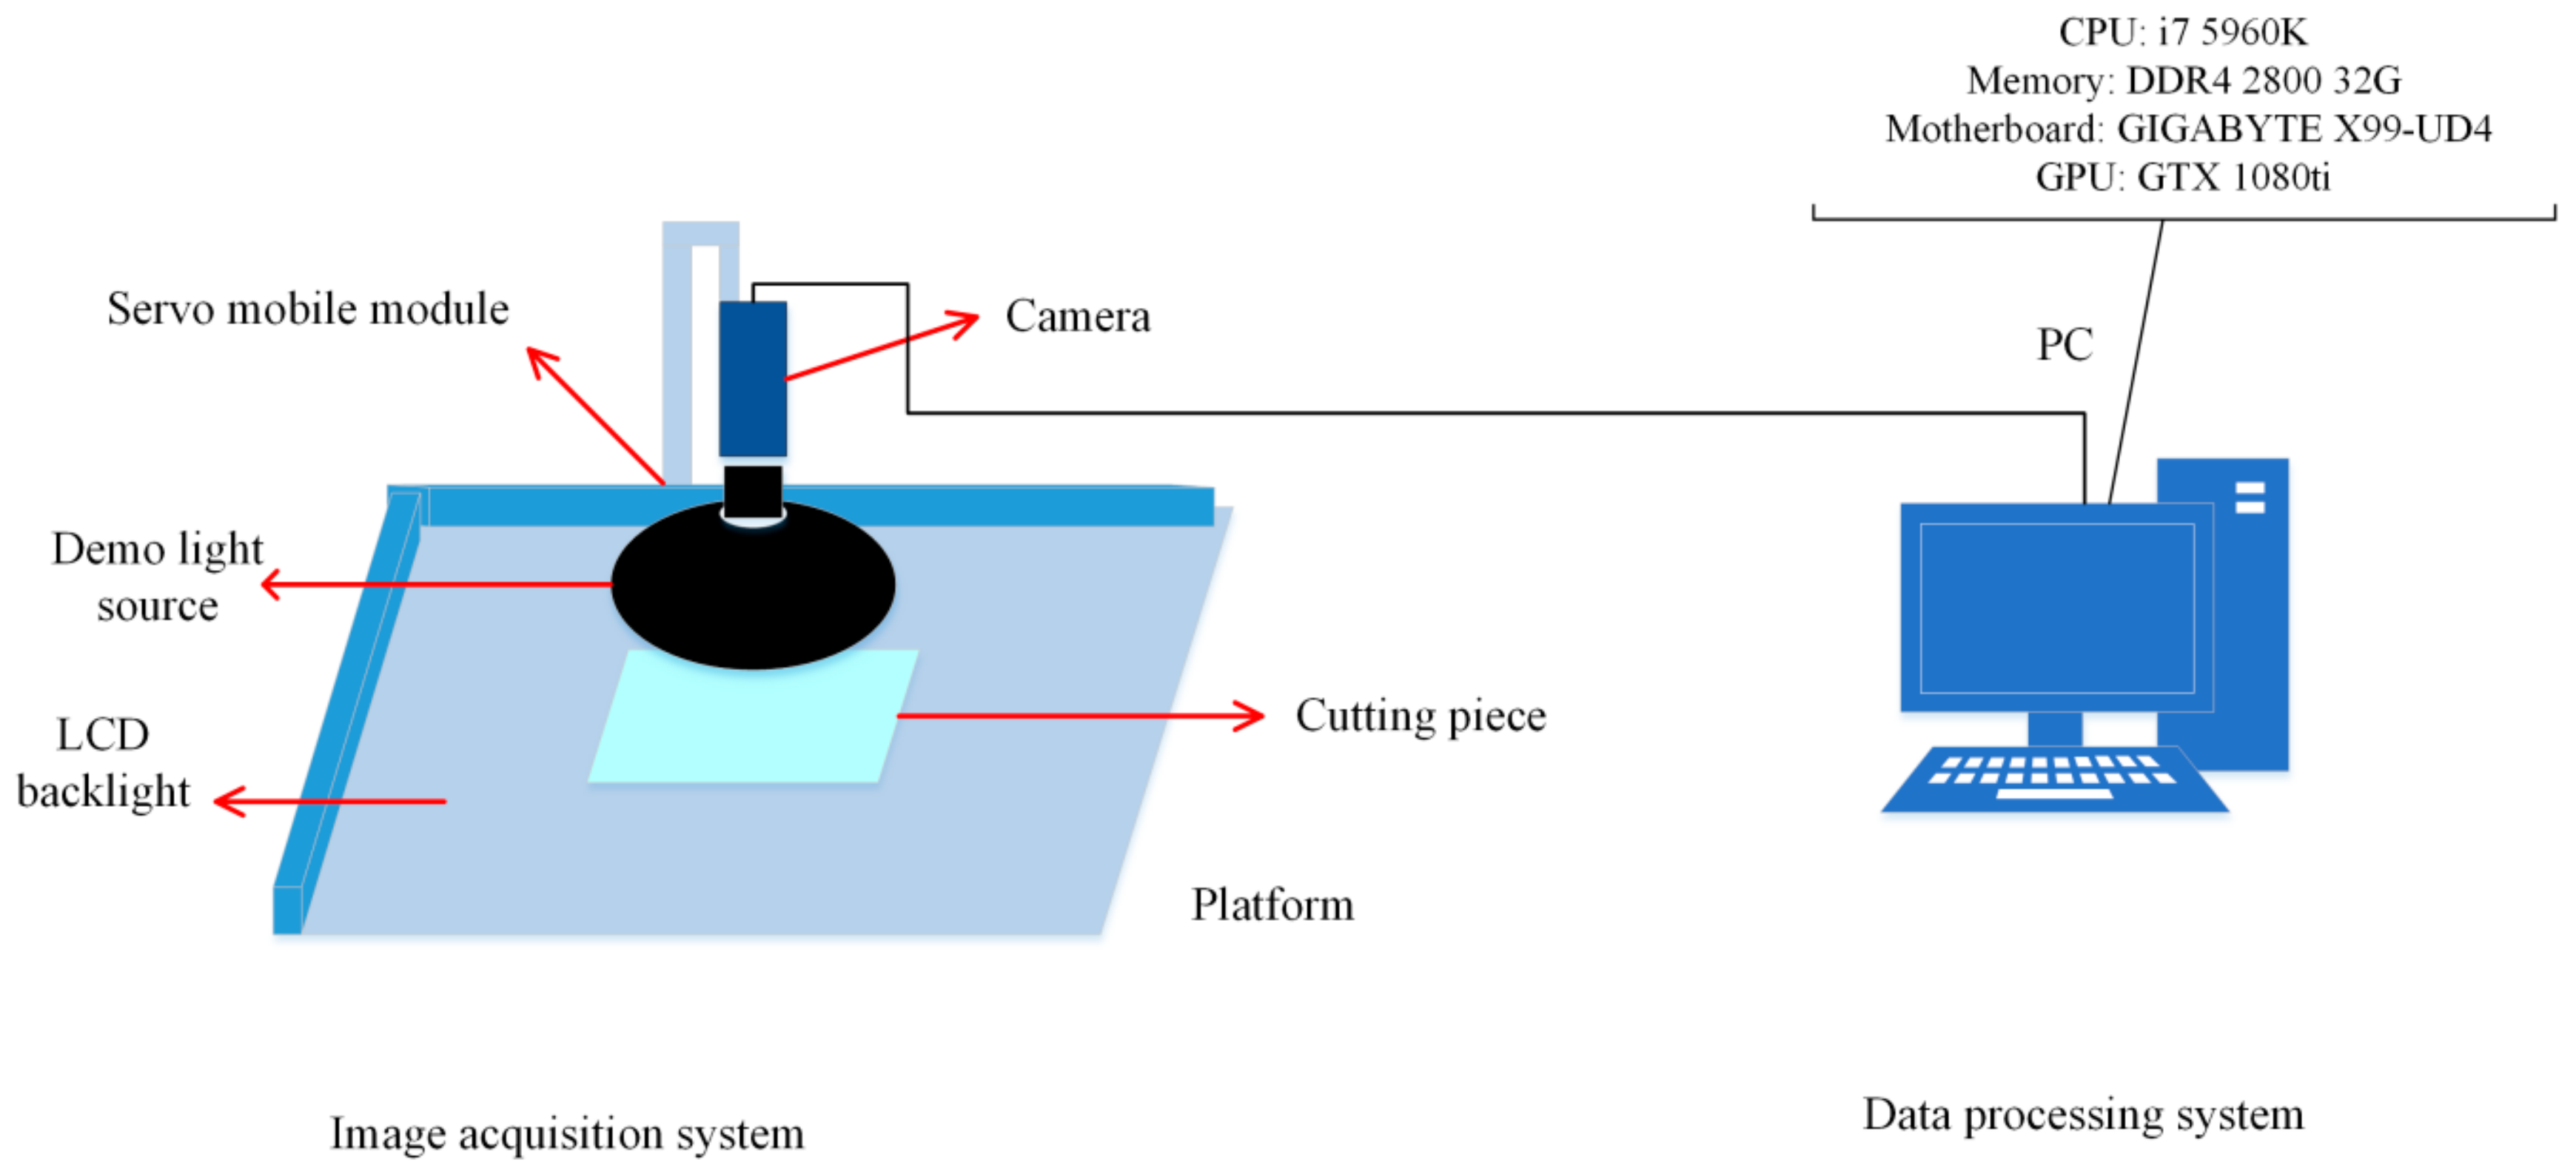
In this study, the image acquisition system was composed of a dome light source, a 1.3 megapixel color industrial camera, an LCD backlight and a servo motor module (see
Figure 2). A vertically installed industrial camera with a camera lens overlooked the fabric. The dome light source that illuminated the fabric surface uniformly wasplaced in front of the fabric. In order to sample multiple parts of the piece, the system contained a servo mobile module that could move industrial cameras in a flat range.
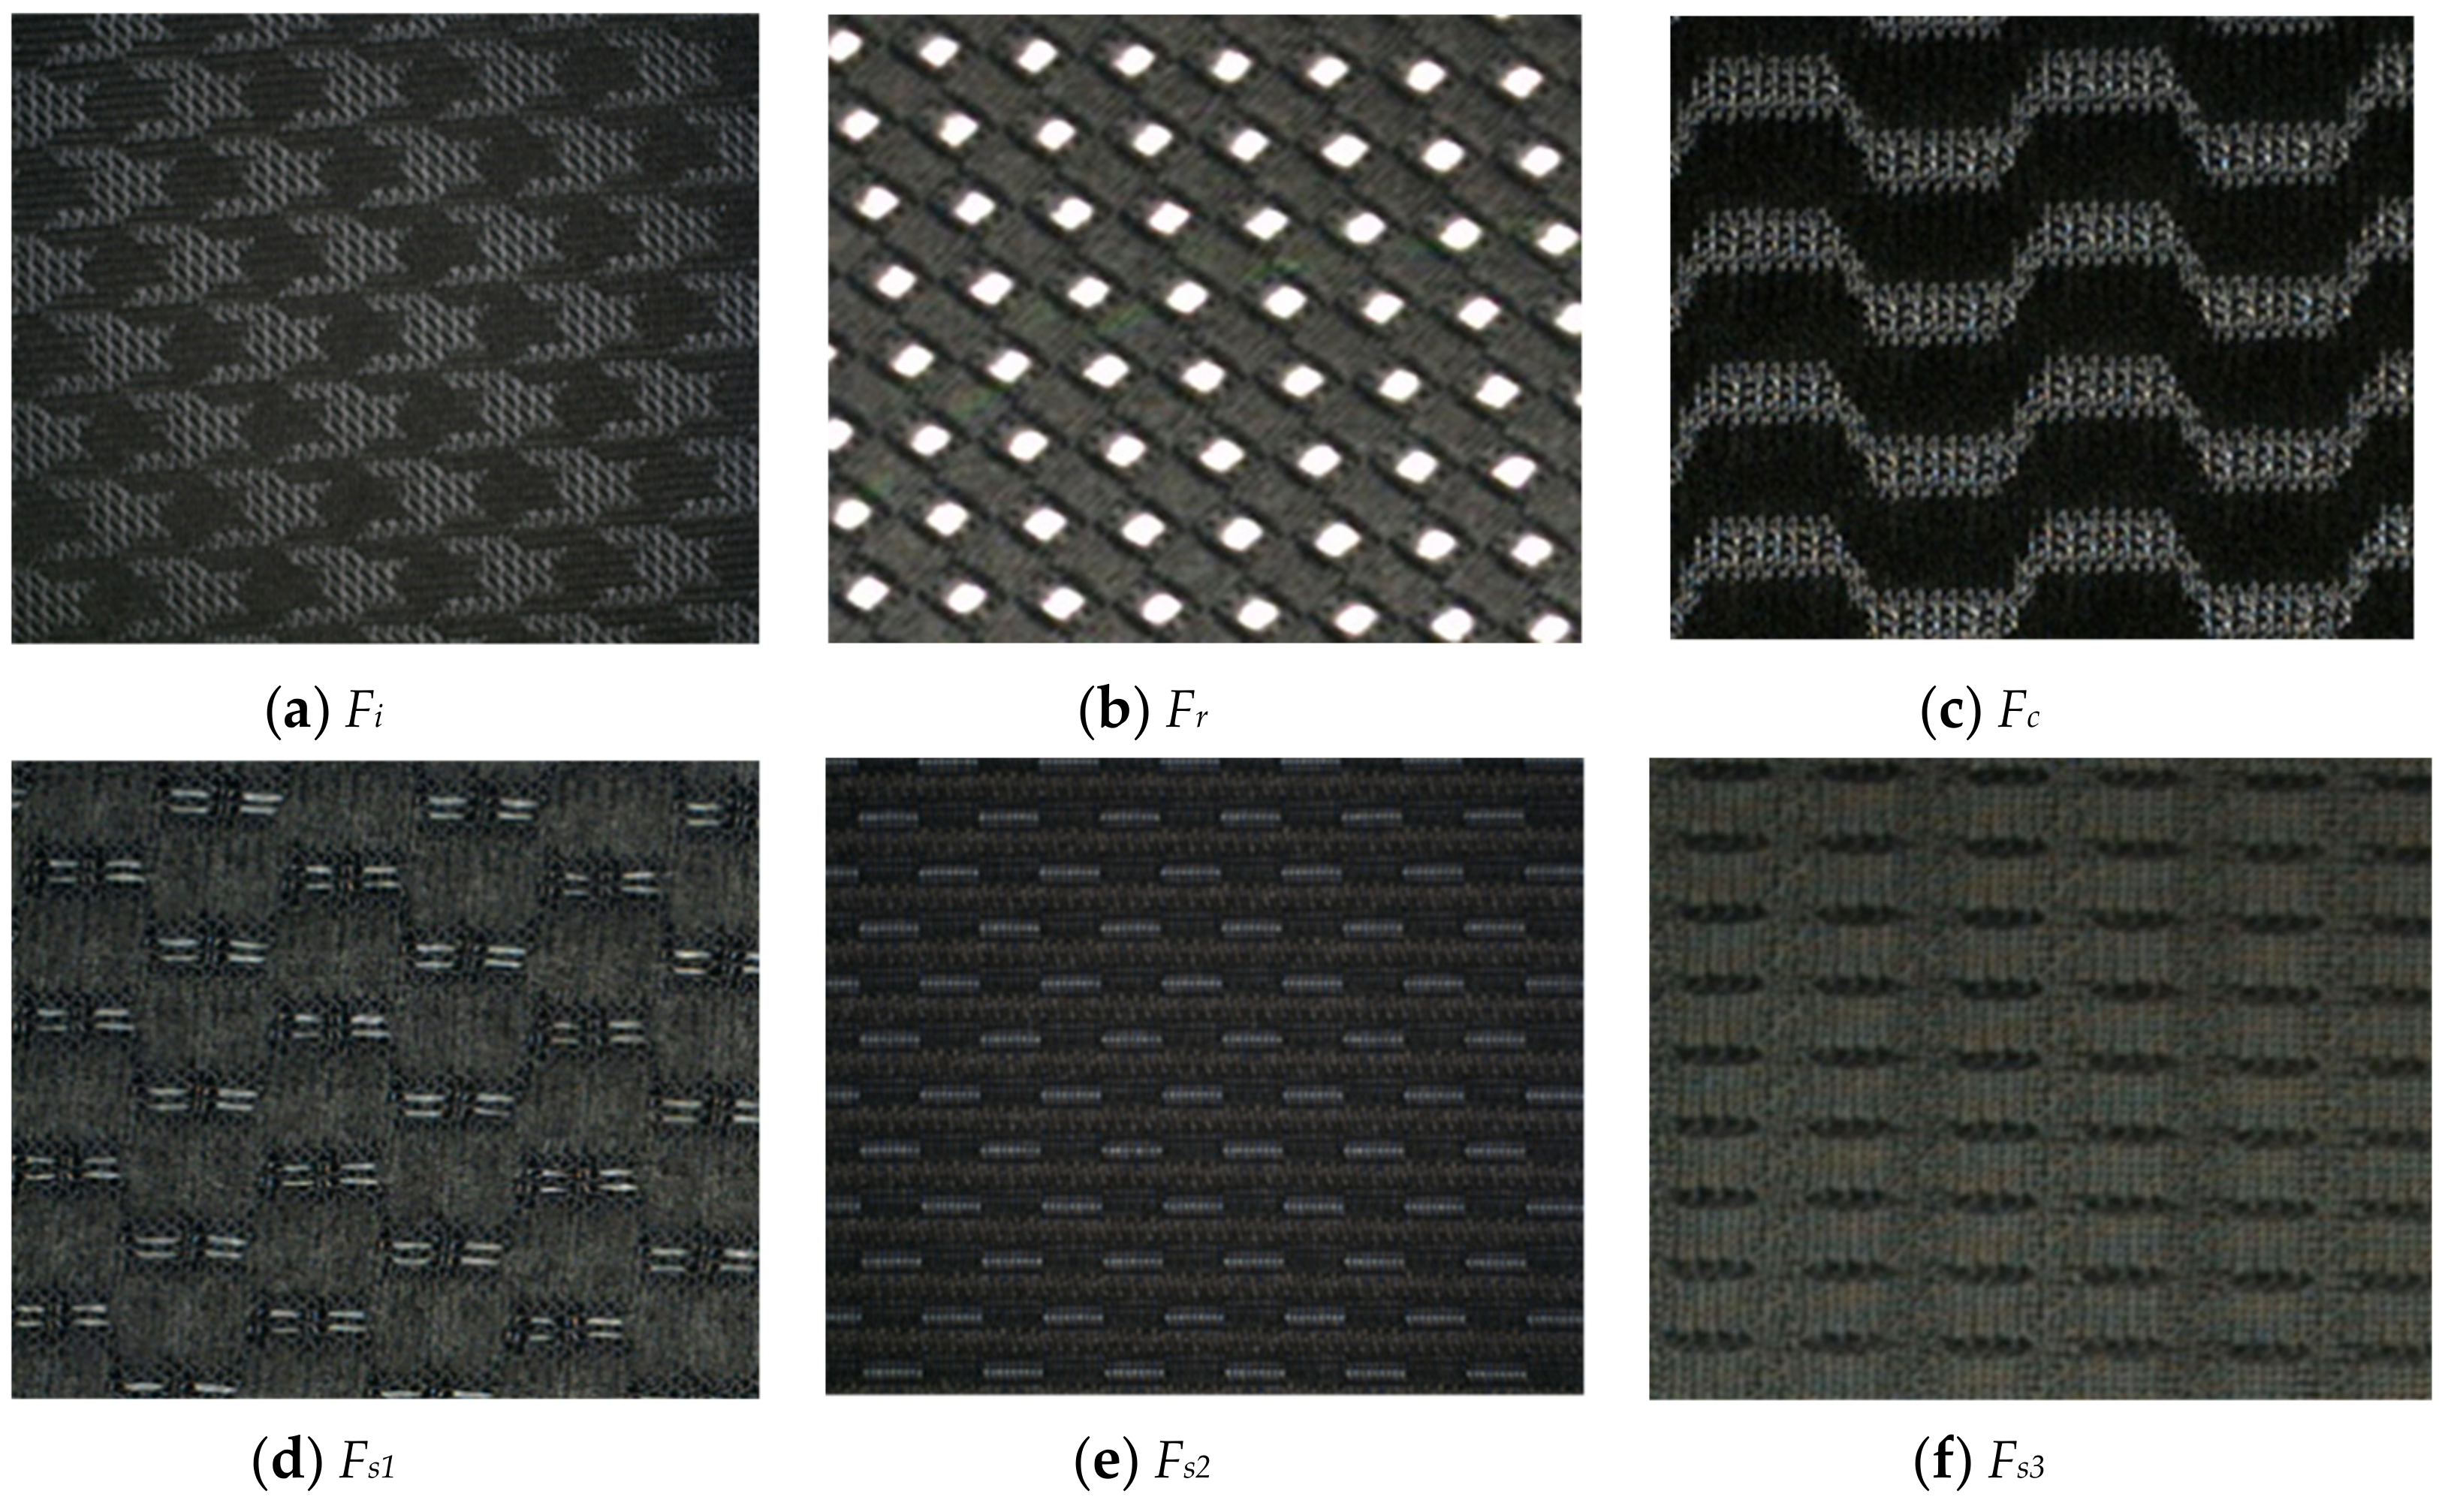
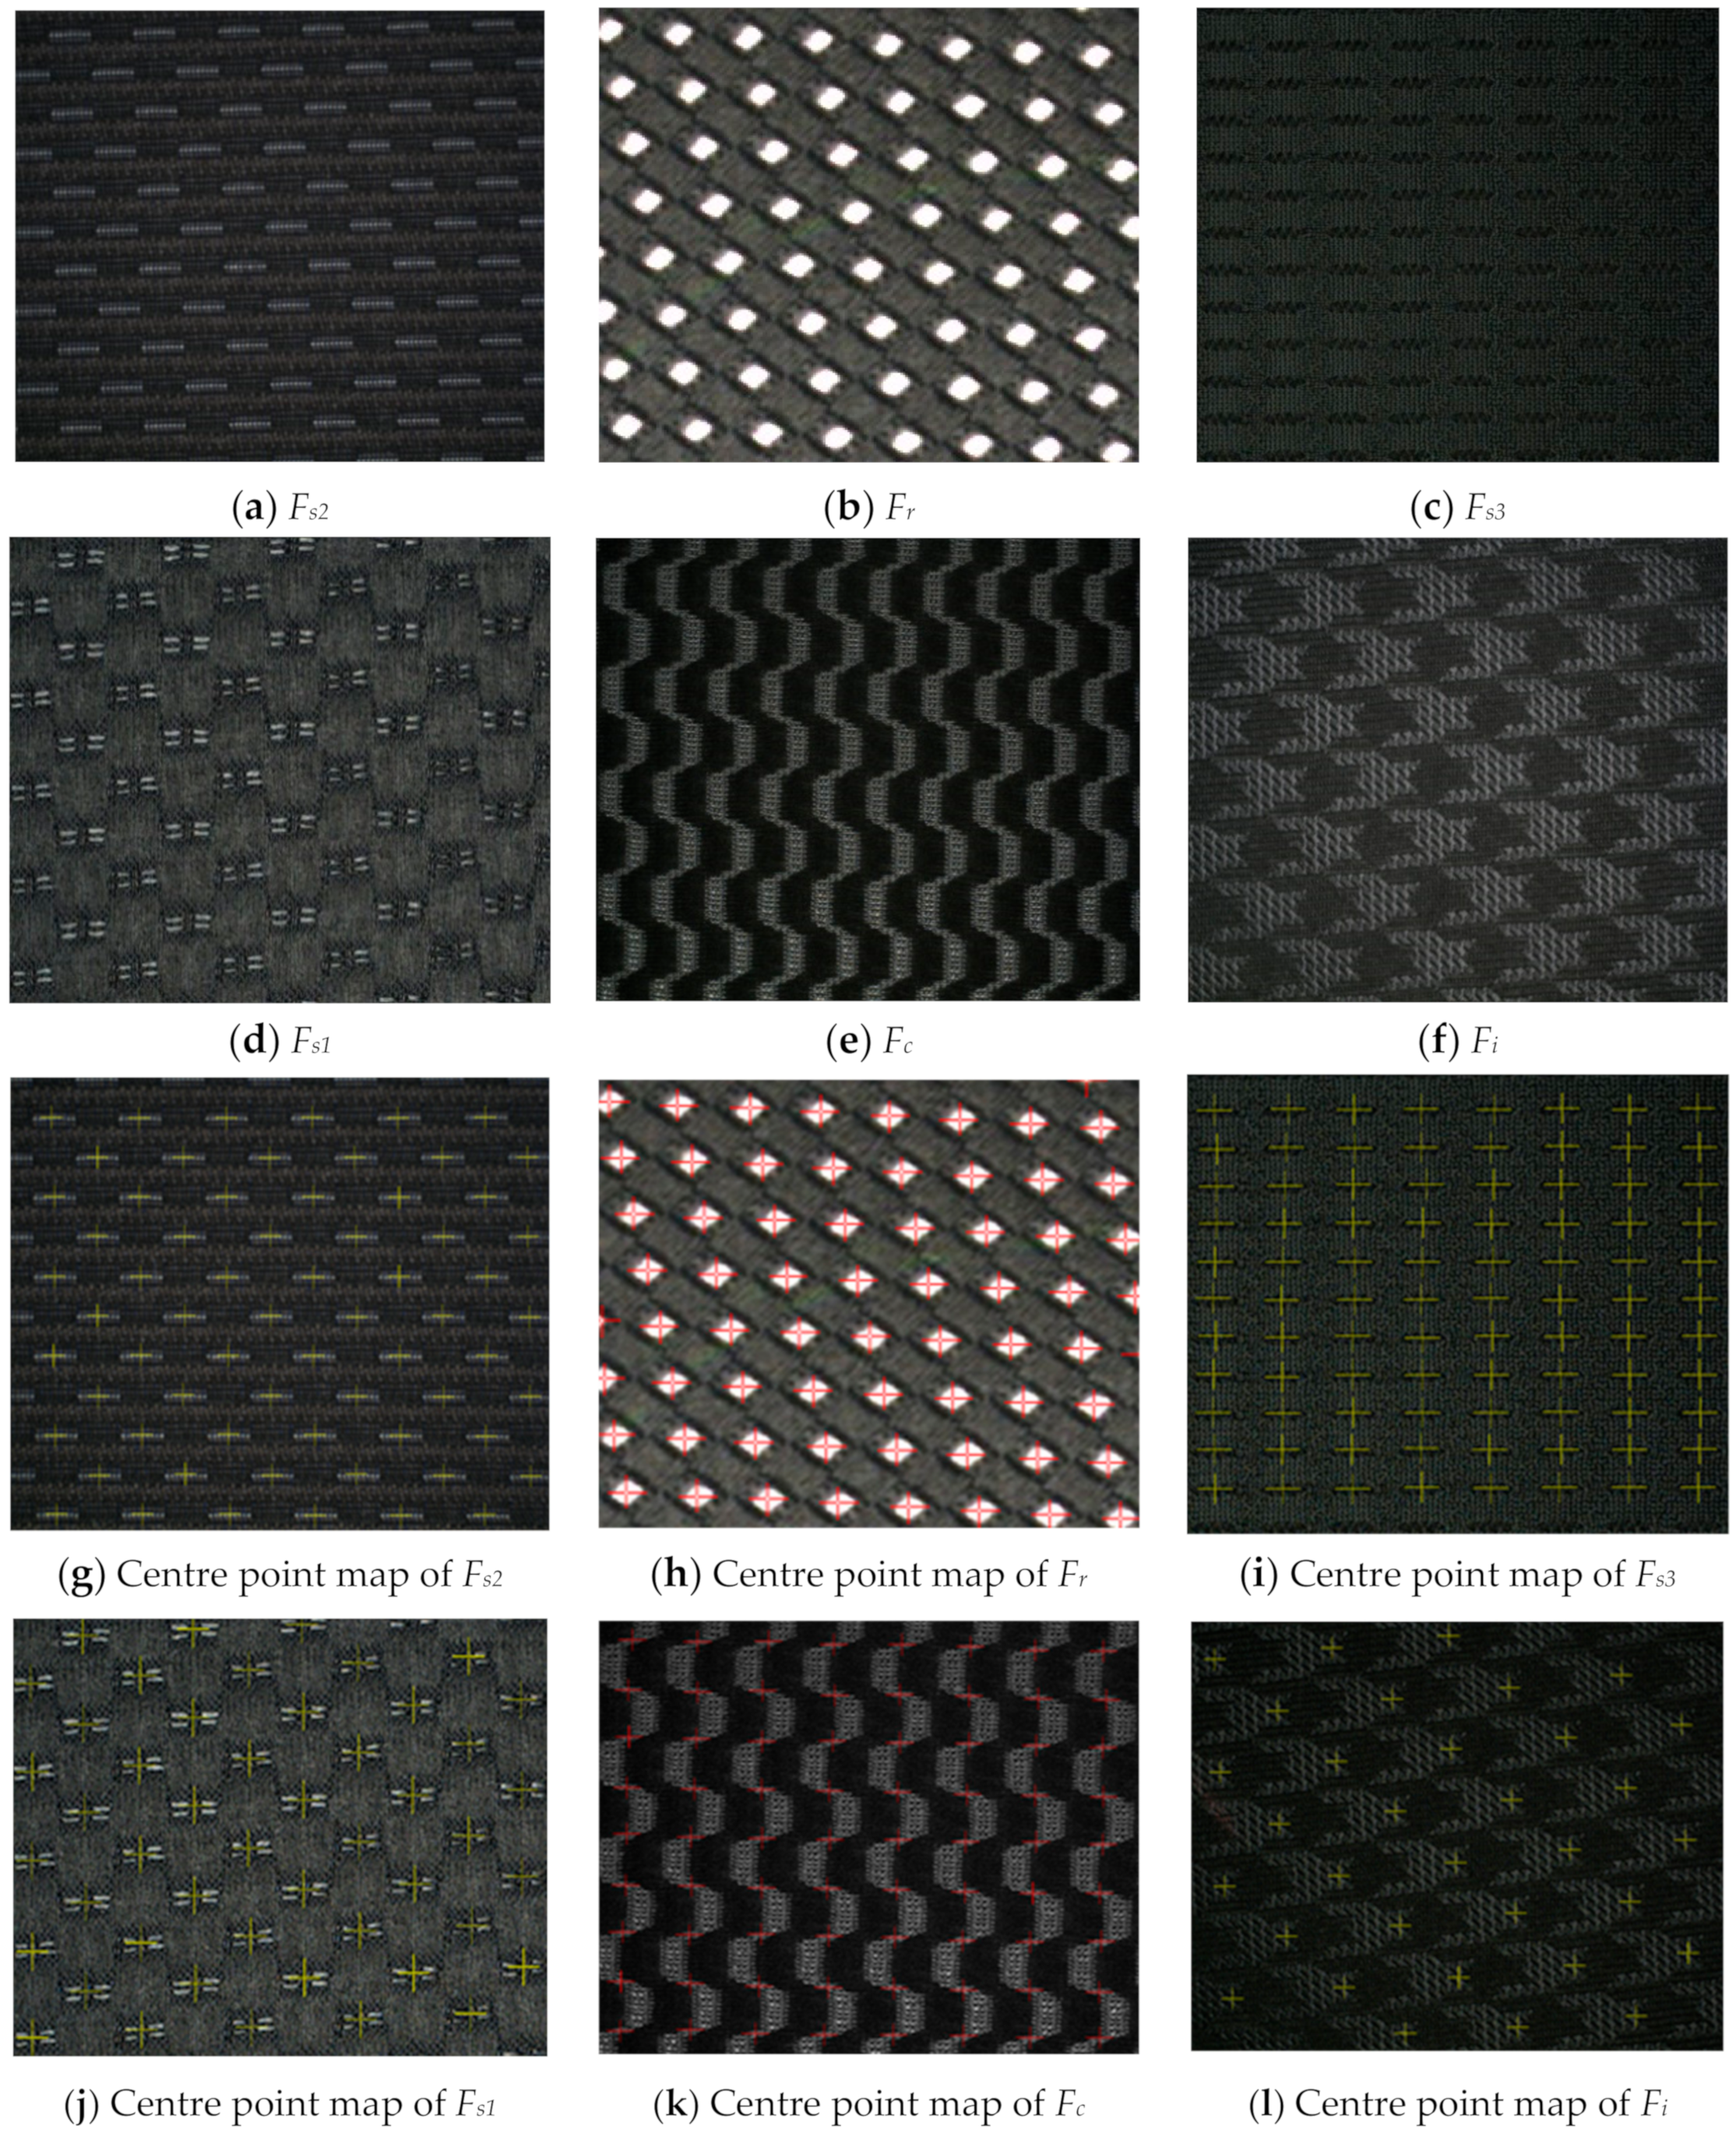
Figure 3 shows the six types of pattern images
Fi,
Fr,
Fc,
Fs1,
Fs2 and
Fs3 (the size was 1024 × 1280 pixels) acquired by the image acquisition system, where:
Fi is the pattern with irregular shape.
Fr is the pattern with circular shape.
Fw is the pattern with the wavy shape.
Fs1,
Fs2,
Fs3 are patterns with a strip shape. The acquired images were transmitted to the data processing system (see
Figure 2) to be processed by the Faster R-CNN based algorithm. The image data processing is shown in
Section 2.3.
In this paper, 5000 unique images with size of 640 × 512 × 3 pixels were contained in the pattern dataset, and each image contained approximately 20 to 50 patterns. These images were cropped from approximately 400 original images with size of 1280 × 1024 × 3 pixels. To obtain the best training effect, each image was labeled in detail. The key details for labeling each image were as follows:
In order to avoid image over-fitting problems, each image contained 20–50 patterns, which were a critical metric for detection and recognition.
The bounding box completely enclosed the pattern and kept the center coordinates of the pattern the same as the center coordinates of the bounding box.
There are no overlapping regions between the bounding boxes and the dimensions of each bounding box remain the constant.
2.2. Training of Pattern Detection Model
In recent years, object detection technology has achieved rapid development, and the object detection network based on deep learning has greatly improved the ability of object detection. At present, there are two main methods: one depends on region proposal, such as R-CNN (region convolutional neural network) [
17], Fast R-CNN [
18], Faster R-CNN [
13] and R-FCN [
19]; the other does not rely on region proposal and directly estimates candidate object recommendations, such as SSD [
20] and YOLO [
21,
22,
23] family.
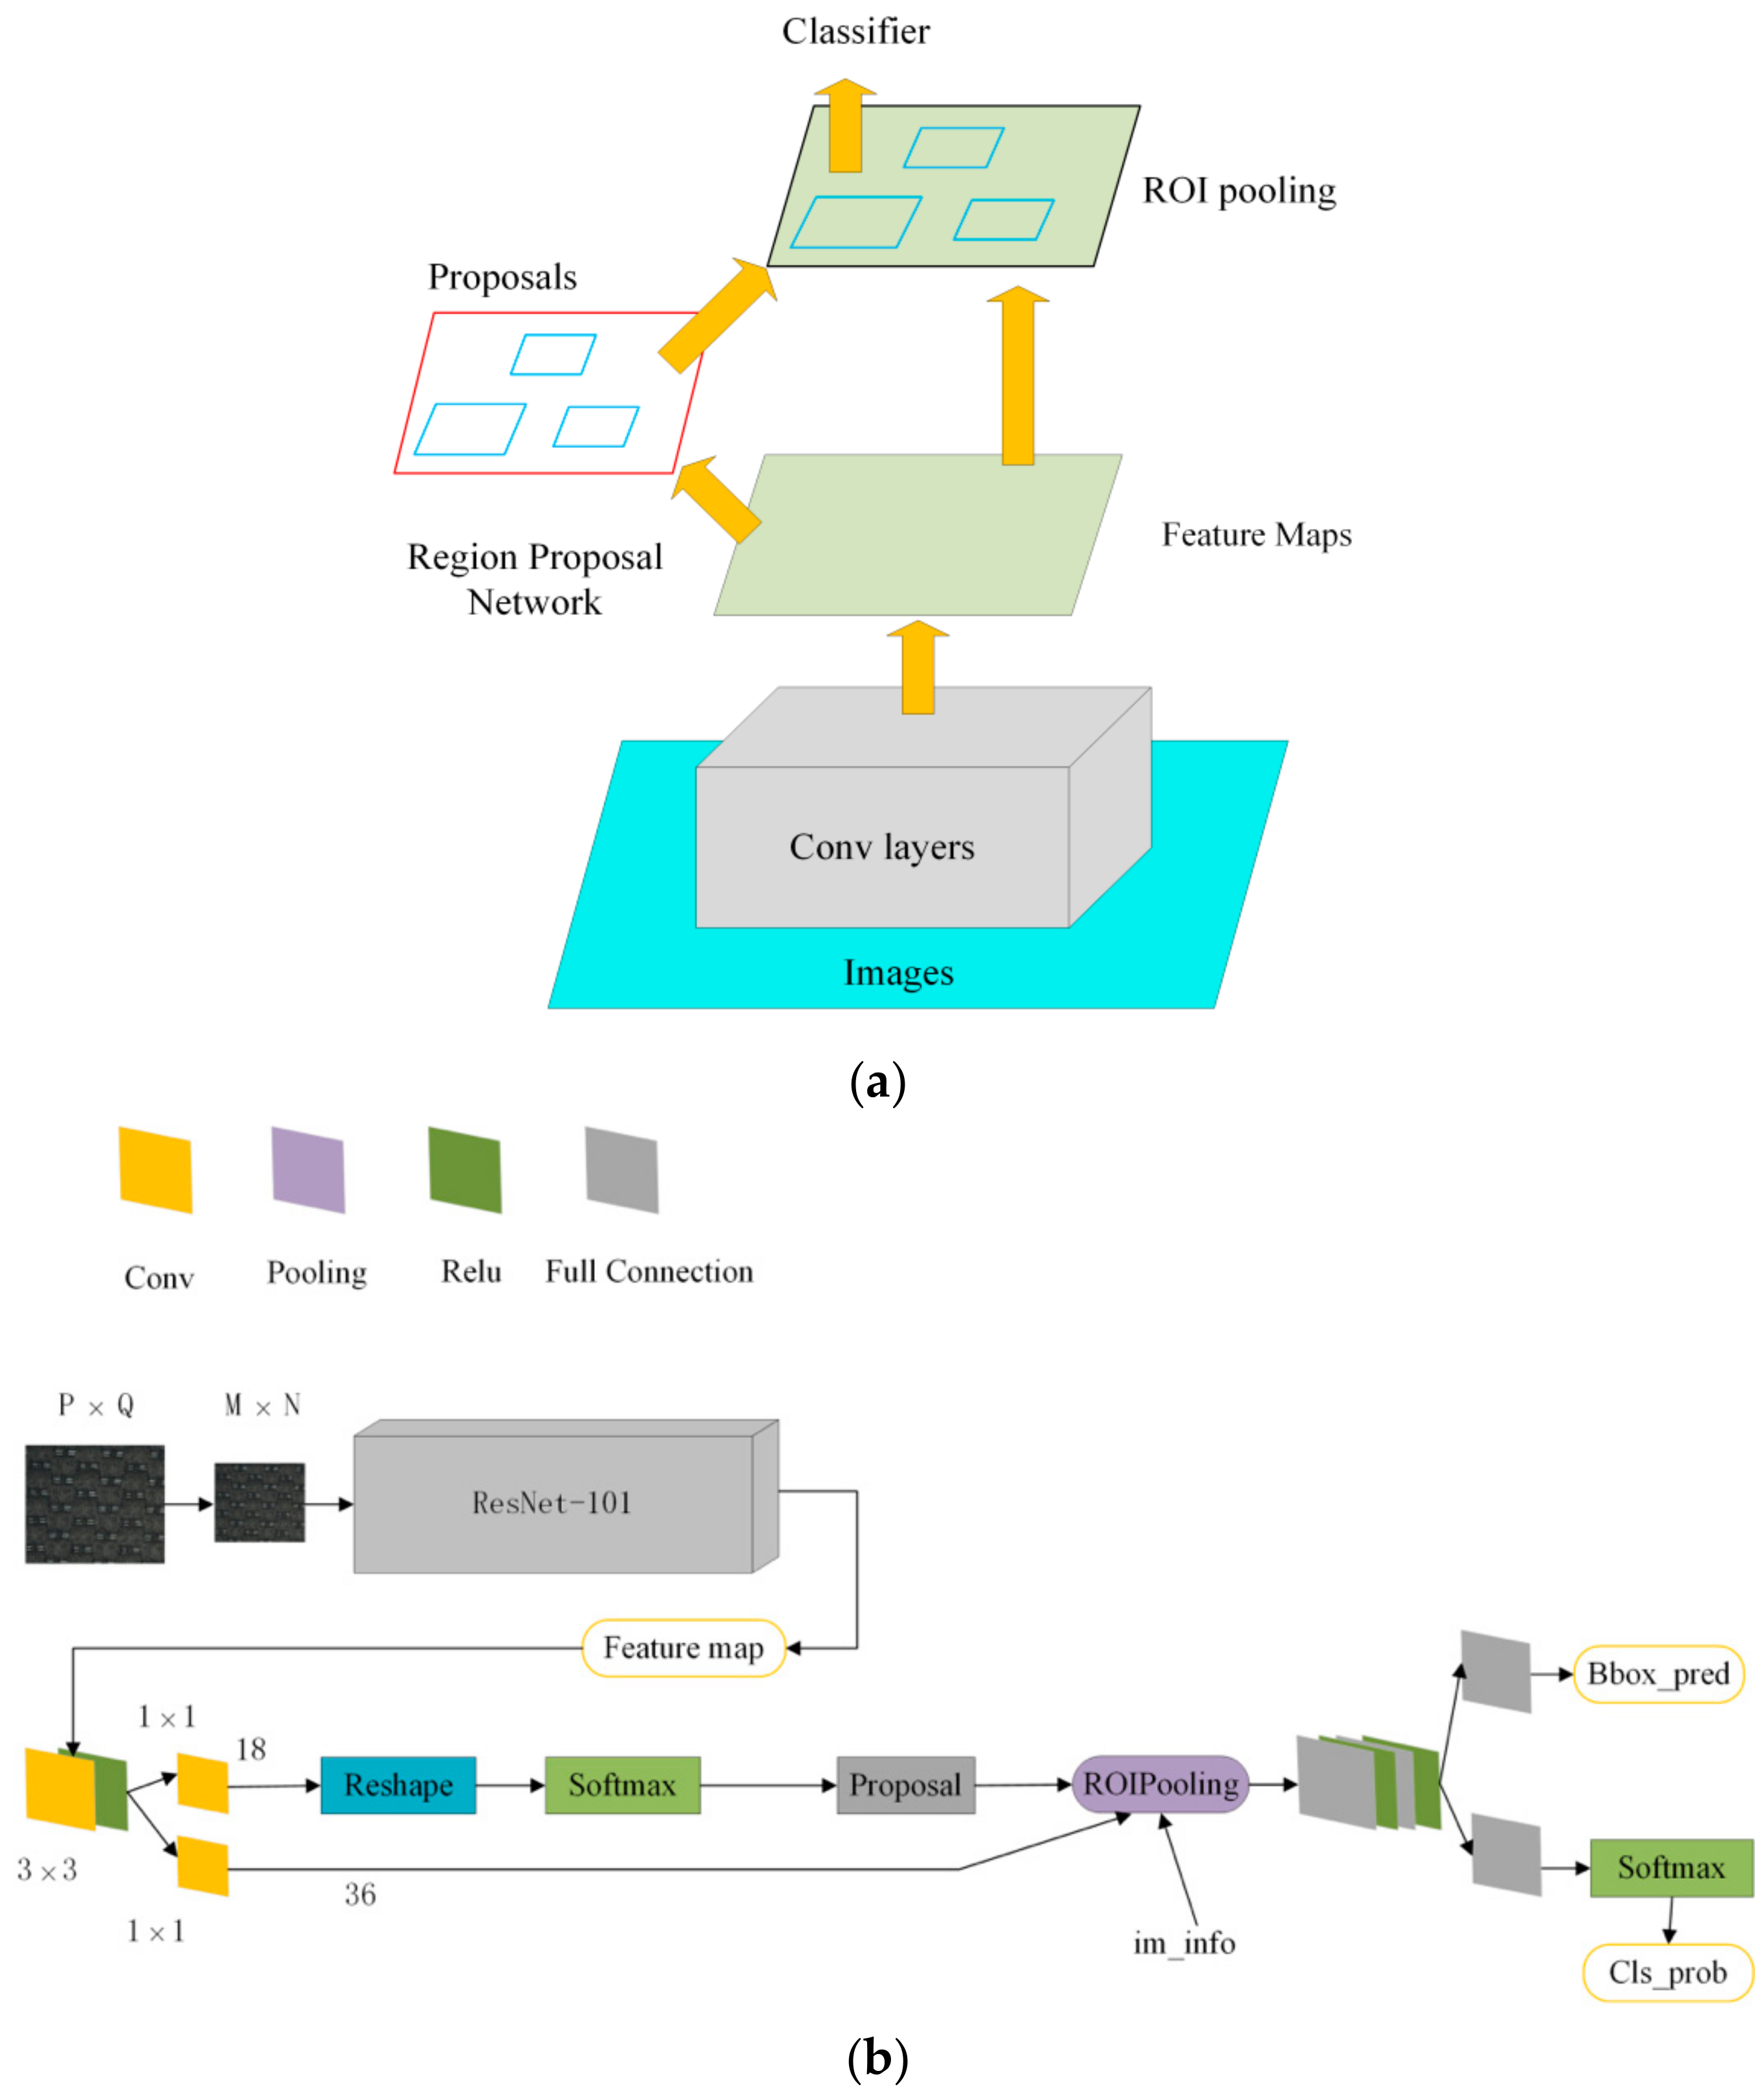
After R-CNN [
17] and Fast R-CNN [
18], Microsoft’s Shaoqing Ren proposed Faster R-CNN [
13] to optimize the running time of the detection network. The region proposal network (RPN) was proposed to generate the proposal region. RPN replaces the previous methods such as Selective Search [
24] and EdgeBoxes [
25] and it shares the convolution feature of the full map with the detection network so that the region proposal detection takes very little time. The Faster R-CNN structural framework consists of RPN + Fast R-CNN. The RPN network is mainly used to generate high-quality proposal region boxes, and Fast R-CNN is used to learn high-quality proposal region features and classify objects. The overall framework of Faster R-CNN is shown in
Figure 4.
Faster R-CNN proposes the region proposal network and improves the efficiency of object detection. This provides feasibility for detecting multi-period patterns with Faster R-CNN. Three nets (ZF-Net [
27], VGG16 [
28] and Rse-Net-101 [
29]) were respectively used as the pre-trained model of Faster R-CNN, where the pattern dataset contained 5382 patterns and a total of six types of patterns:
Fi,
Fr,
Fw,
Fs1,
Fs2 and
Fs3 (see
Figure 3). The number of various pattern images was 894, 899, 902, 892, 904 and 891. Image size was 512 × 640 pixels. The pattern dataset was randomly divided into validation set, test set and train set according to the ratio of 2:2:6. Then, the divided datasets were used for training of Faster R-CNN (ZF-Net), Faster R-CNN (VGG16) and Faster R-CNN (ResNet-101), respectively. The experimental platforms included Windows 7, GPU GTX1080ti, Matlab 2014a and Visual Studio 2013, and the whole experiment was based on the deep learning framework Caffe.
The compared results are shown in
Table 1, where the performance of the three pattern detection models can be seen. Precision represented the detection accuracy of the pattern. Balanced accuracy (Ba) was used to evaluate balanced accuracy of the pattern dataset. Kappa (K) was used to evaluate the accuracy of the pattern classification. Mean average precision (mAP) was the main indicator for evaluating the main detection results, because mAP was the actual metric for object detection.
From
Table 1, it can be concluded that the precision, K, Ba and mAP of the Resnet-101 net as the pre-trained model were higher than the other two nets, and thus Resnet-101 was chosen as the pre-trained model in this paper.
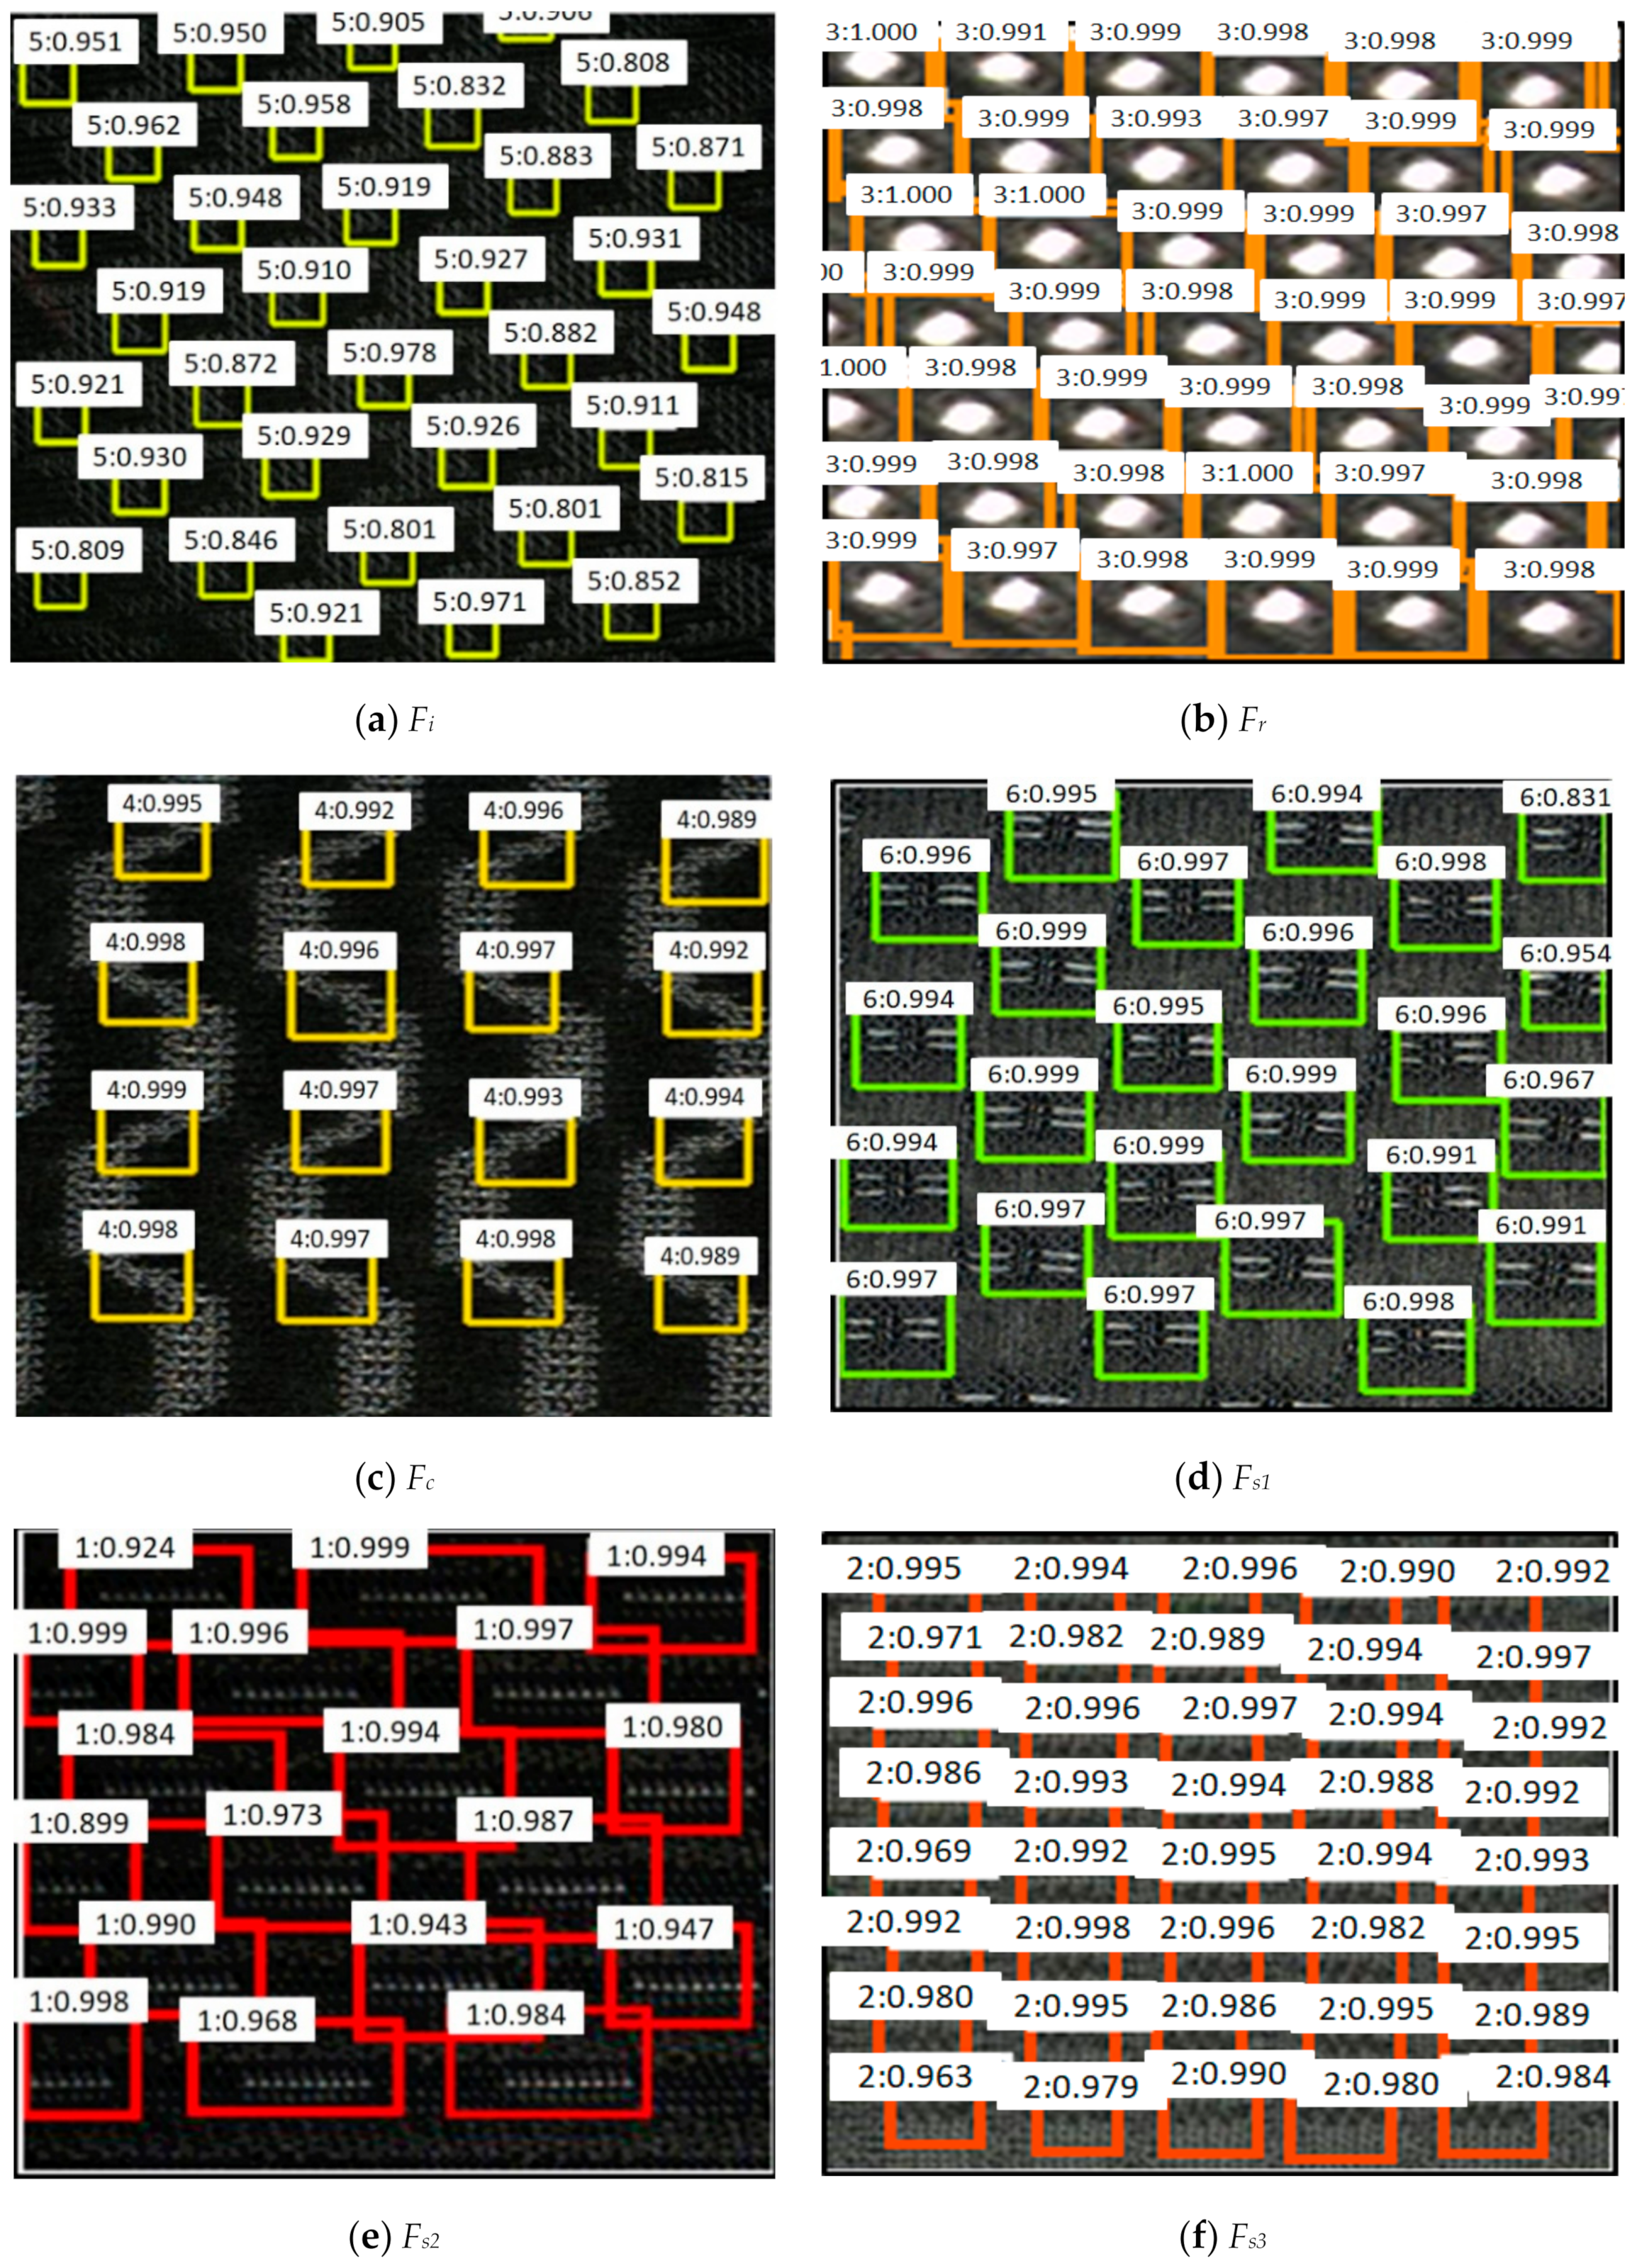
Figure 5 shows the detection results of the six patterns (
Fi,
Fr,
Fw,
Fs1,
Fs2 and
Fs3) on the Faster R-CNN model. The boxes of different colors represent the different pattern categories detected by the model; the upper left corner of the box represents the classification result, pattern category and category score for the object of the box region. Since the patterns
Fs1,
Fs2,
Fs3 and
Fr had the characteristics of large pattern pitch, small volume and regular shape, we chose to completely surround the pattern with the bounding box. The patterns
Fi and
Fc were irregular shapes and could not be completely surrounded by the bounding box, so we regarded a part of the pattern having the periodic characteristics as the detection object. It can be concluded from
Figure 5 that the Faster R-CNN model could effectively detect six types of multi-period patterns and had fewer false positive and missing alarms.
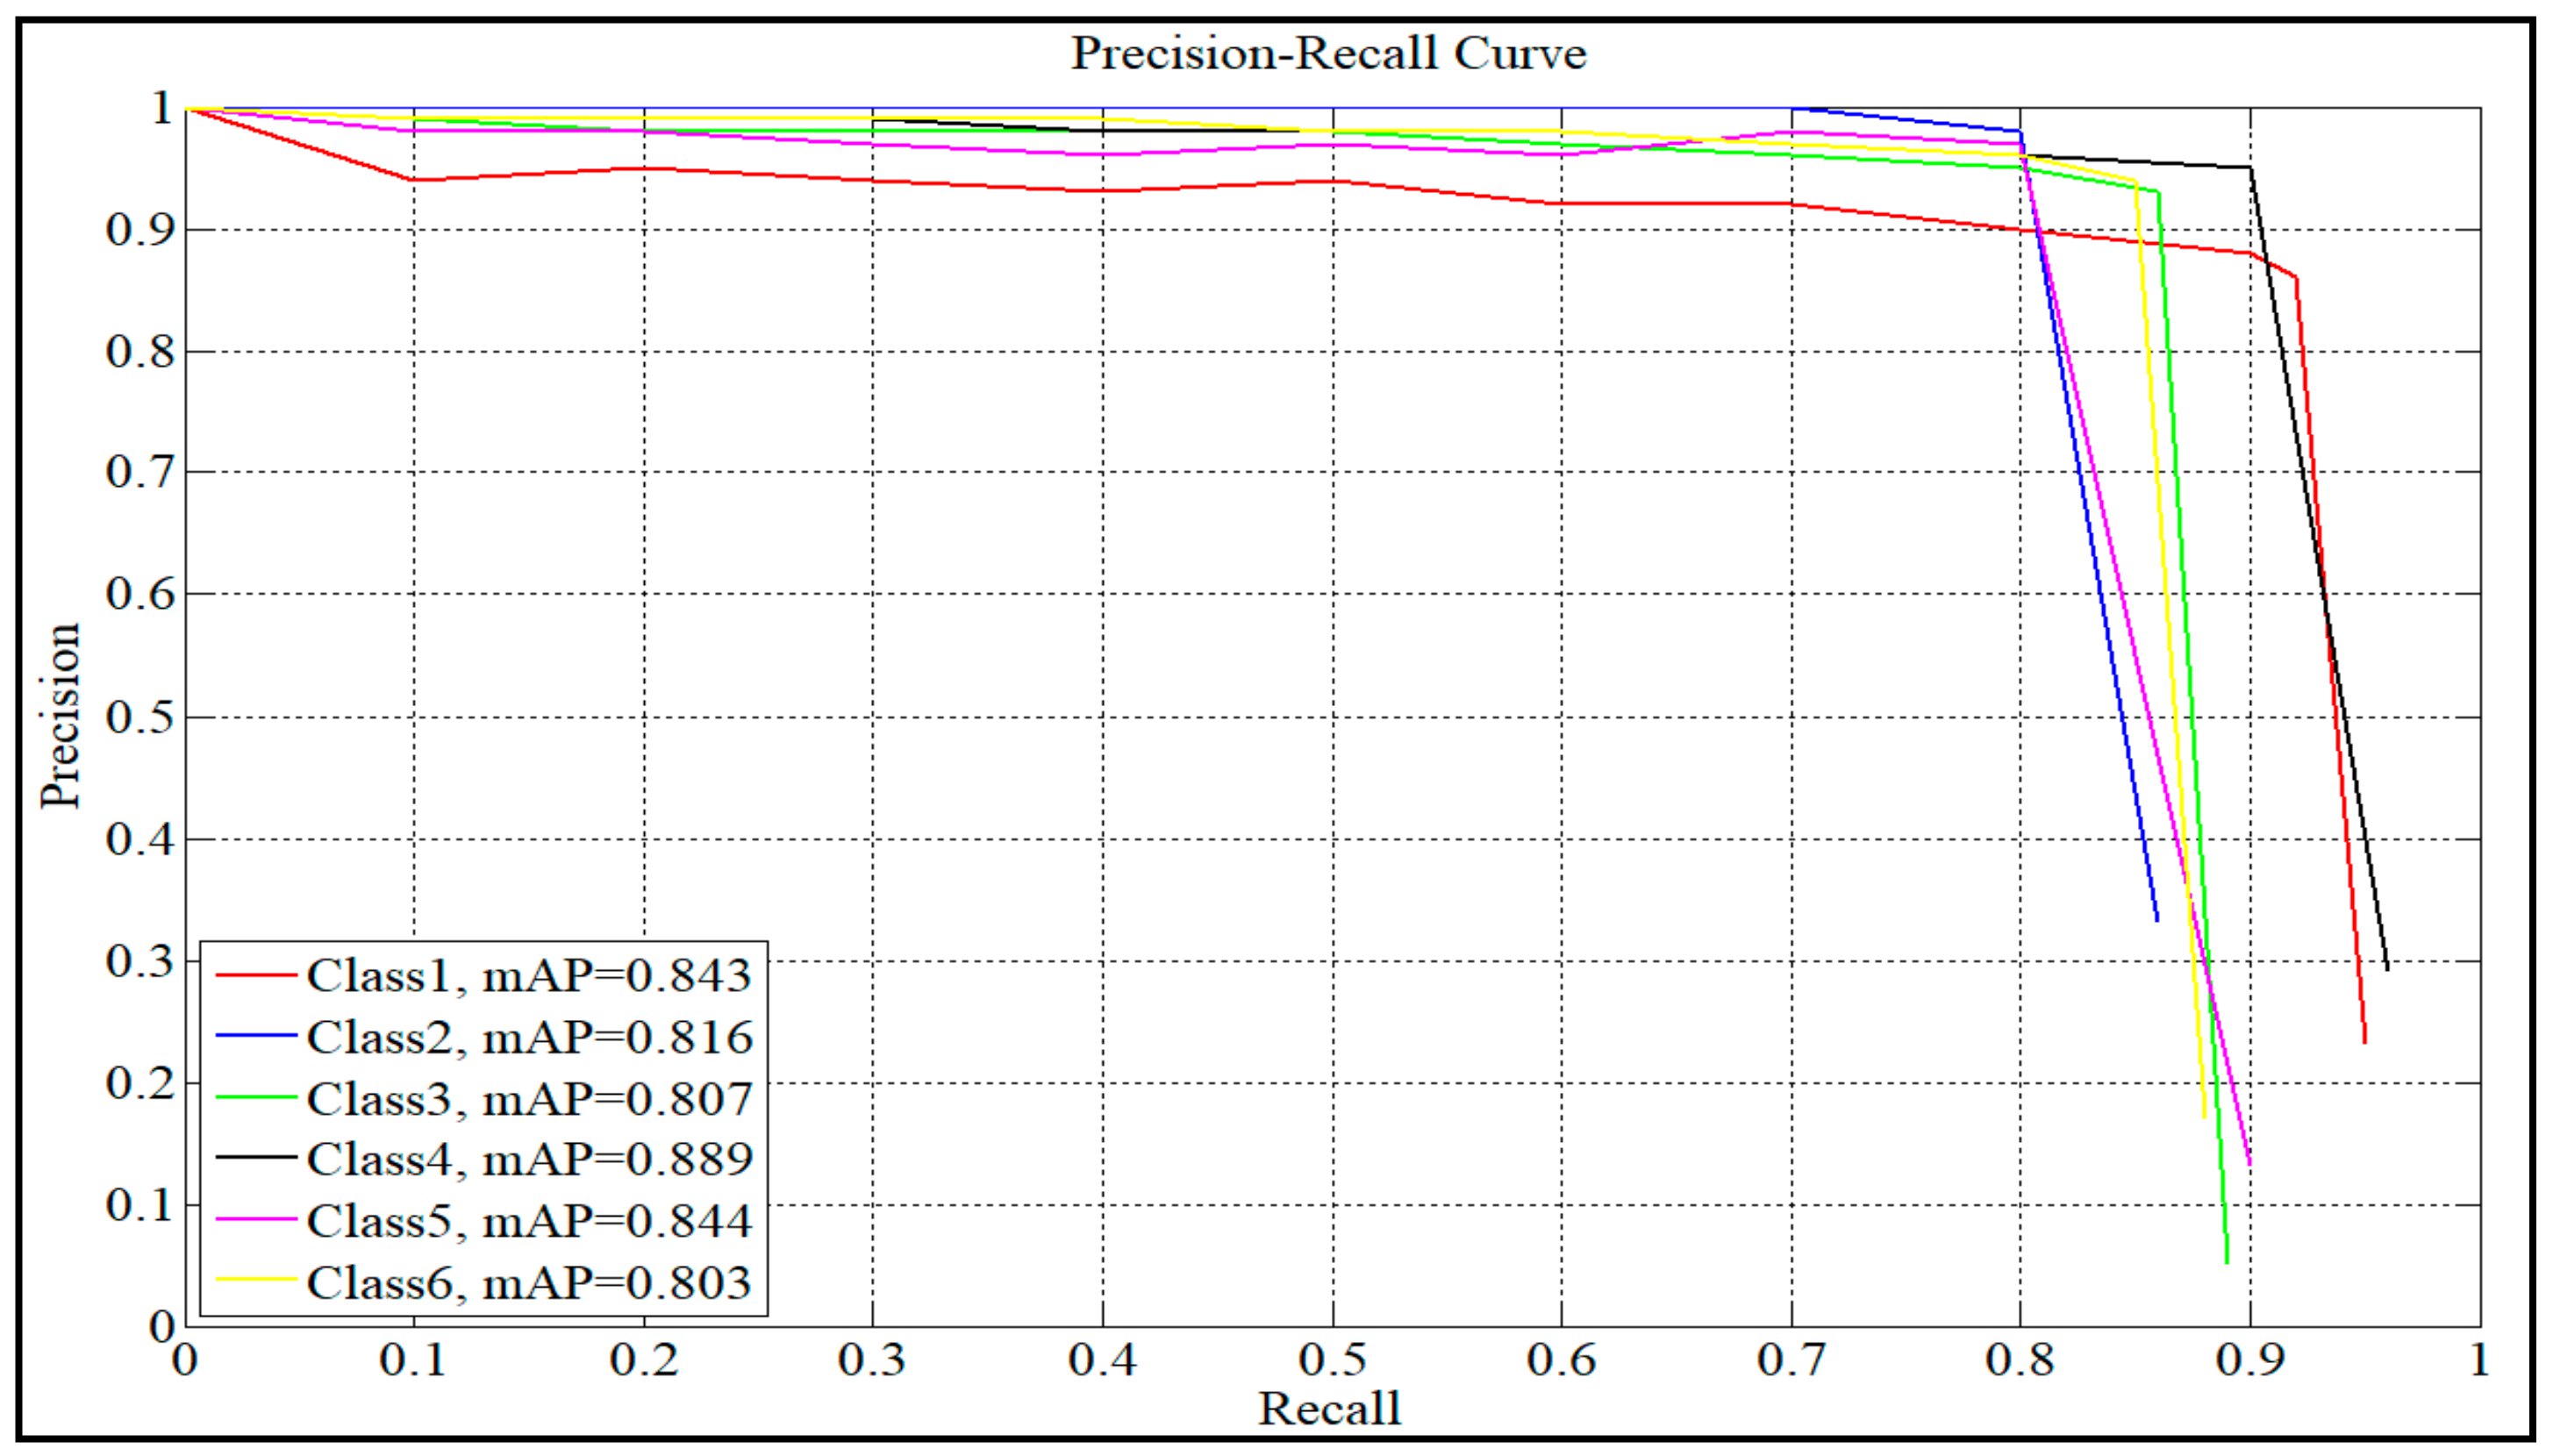
Figure 6 shows the precision–recall (P–R) curve of the Faster R-CNN pattern detection model. The precision is the vertical axis, and the recall is the horizontal axis. The area value enclosed by the curve represents the mAP. It can be concluded from the
Figure 6 that the pattern detection model had high accuracy, recall rate and average precision, so this model had pretty good pattern detection ability and excellent detection accuracy.
2.3. Centre Point Extraction
The center point of the pattern is defined as the center of the region enclosed by the pattern outline. The area is defined as the number of pixels of a region. The center is calculated as the mean value of the line or column coordinates, respectively, of all pixels. The proposed method detected the approximate position of the pattern using the Faster R-CNN, and then an automatic threshold method was used to divide the pixel points of the pattern region and calculate the center coordinates. The steps are as follows:
Step 1: Image cropping method with overlapping areas is used for image cropping. The original image (
Figure 7a) with size of 1208 × 1024 pixels is cropped into several sub-images (
Figure 7b–e) of 640 × 512 pixels. The moving step length of the image cropping is approximately twice the length of the pattern period.
Step 2: The Faster R-CNN model is used to detect the pattern and output the classification score and categories. (
Figure 7f–i).
Step 3: Merge sub-image
Fsubi according the coordinates of image cropping, obtaining image
Fnew (see
Figure 8b). For example, define the coordinates of sub-image as (
xsub,
ysub), and the coordinates in image
Fnew as (
xori,
yori), so the coordinates (
xori,
yori) are computed as follows:
where
sx and
sy are, respectively, the horizontal moving step length and the longitudinal moving step length. The variables
i (
i = 1, 2, 3 …) and
j (
j = 1, 2, 3 …), respectively, represent the times of horizontal and vertical cropping. Then combine the overlapping bounding boxes into one large bounding box according the maximum coordinates of overlapping bounding boxes, getting image
Fnew1 (see
Figure 8c).
Step 4: Correct the inaccurate bounding boxes and calculate the center points of the patterns to get the original center point map. First, the grey distribution information of the original image is counted by the grey histogram and the average grey value
Gth is calculated. Second,
Gth is used as a threshold to segment the patterns in the bounding boxes and calculate the area
Si (
i = 1, 2 …) of segmented pattern, the average value
Sav of
Si, the center point
Pp of the pattern, and the center point
Pb of the bounding box. Third, compare the size of
Si and
Sav, and remove the bounding boxes which
S ≤
Sav. Fourth, adjust the positions of bounding boxes by moving the bounding boxes toward
Pp to make
S >
Sav. Finally, segment the patterns
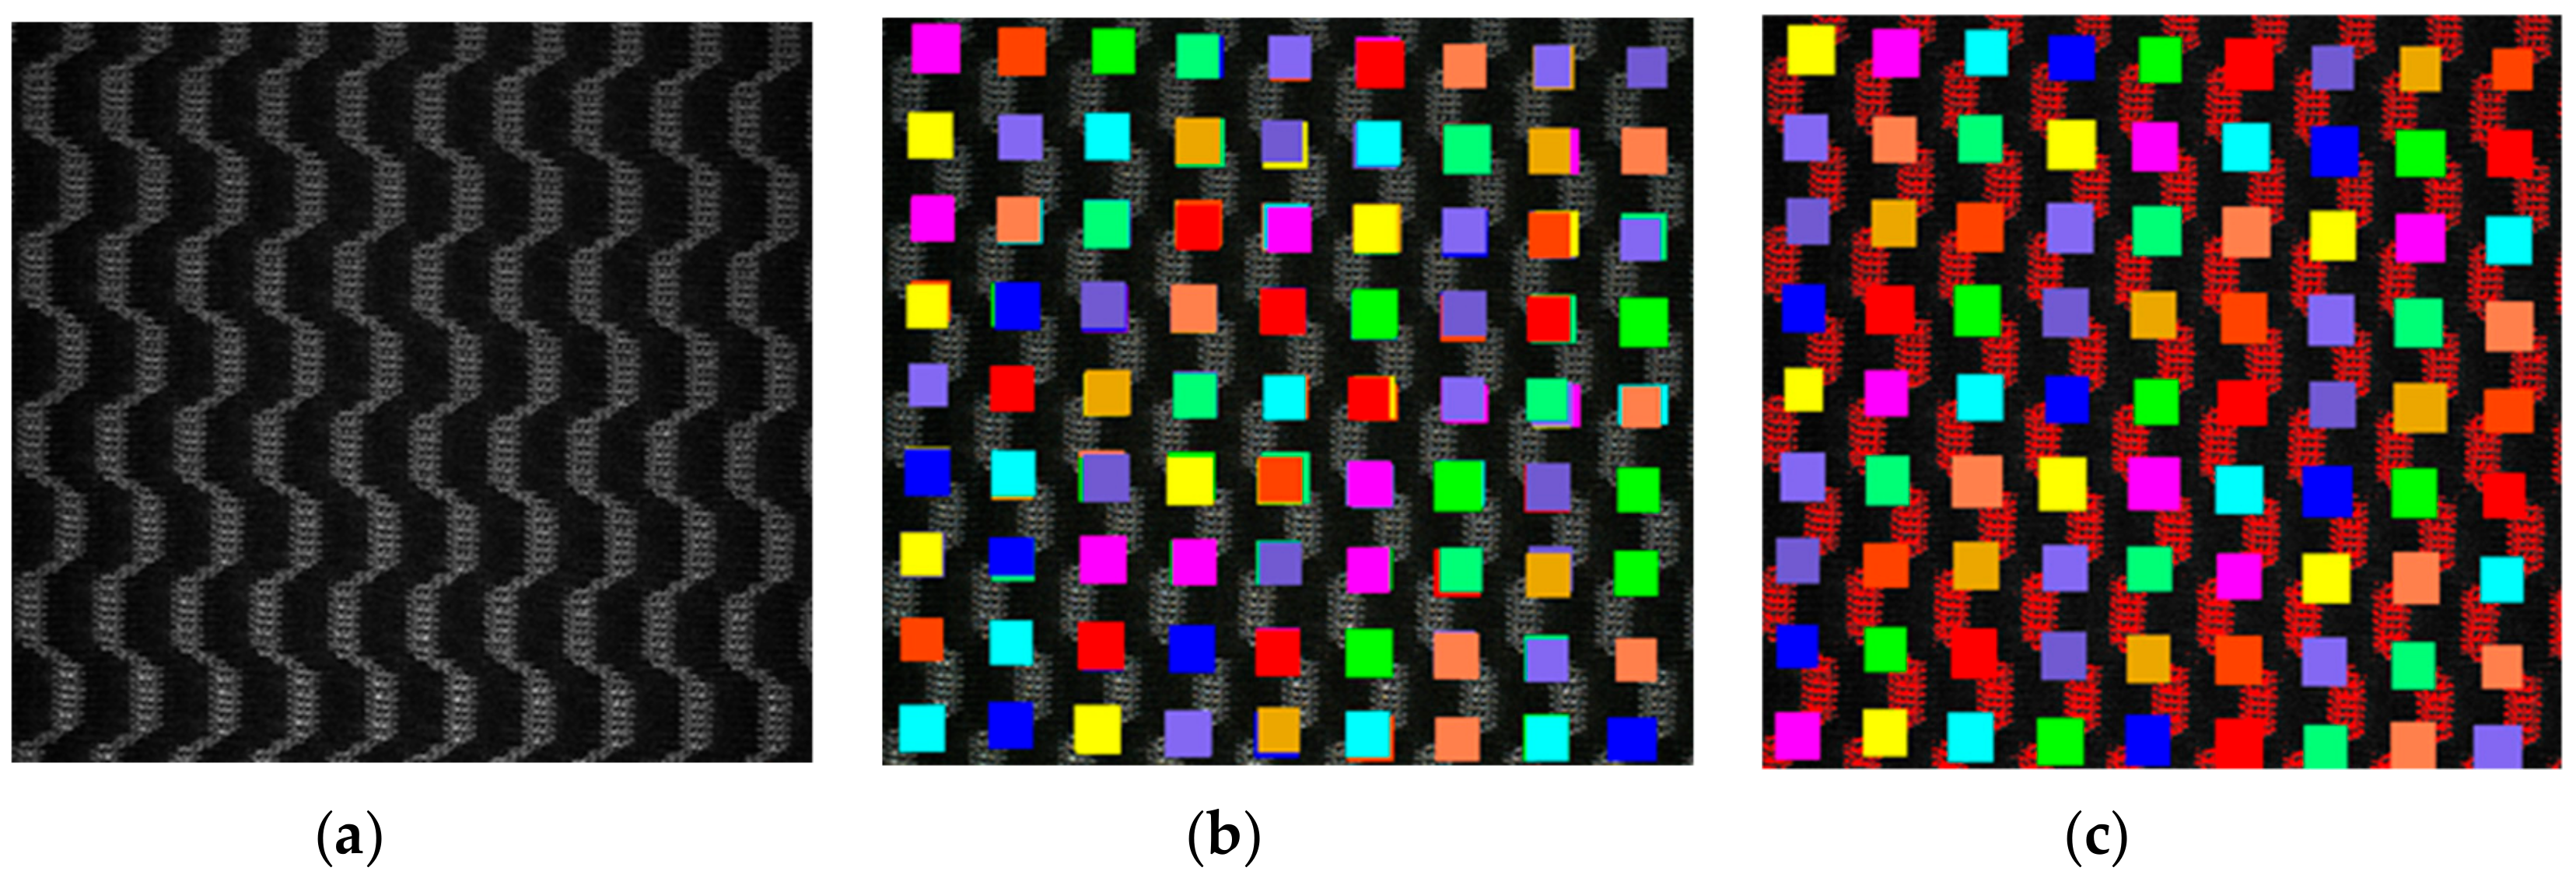
f in the corrected bounding boxes using the threshold segmentation method and calculate them center points to obtain the original center point map (see
Figure 9a).
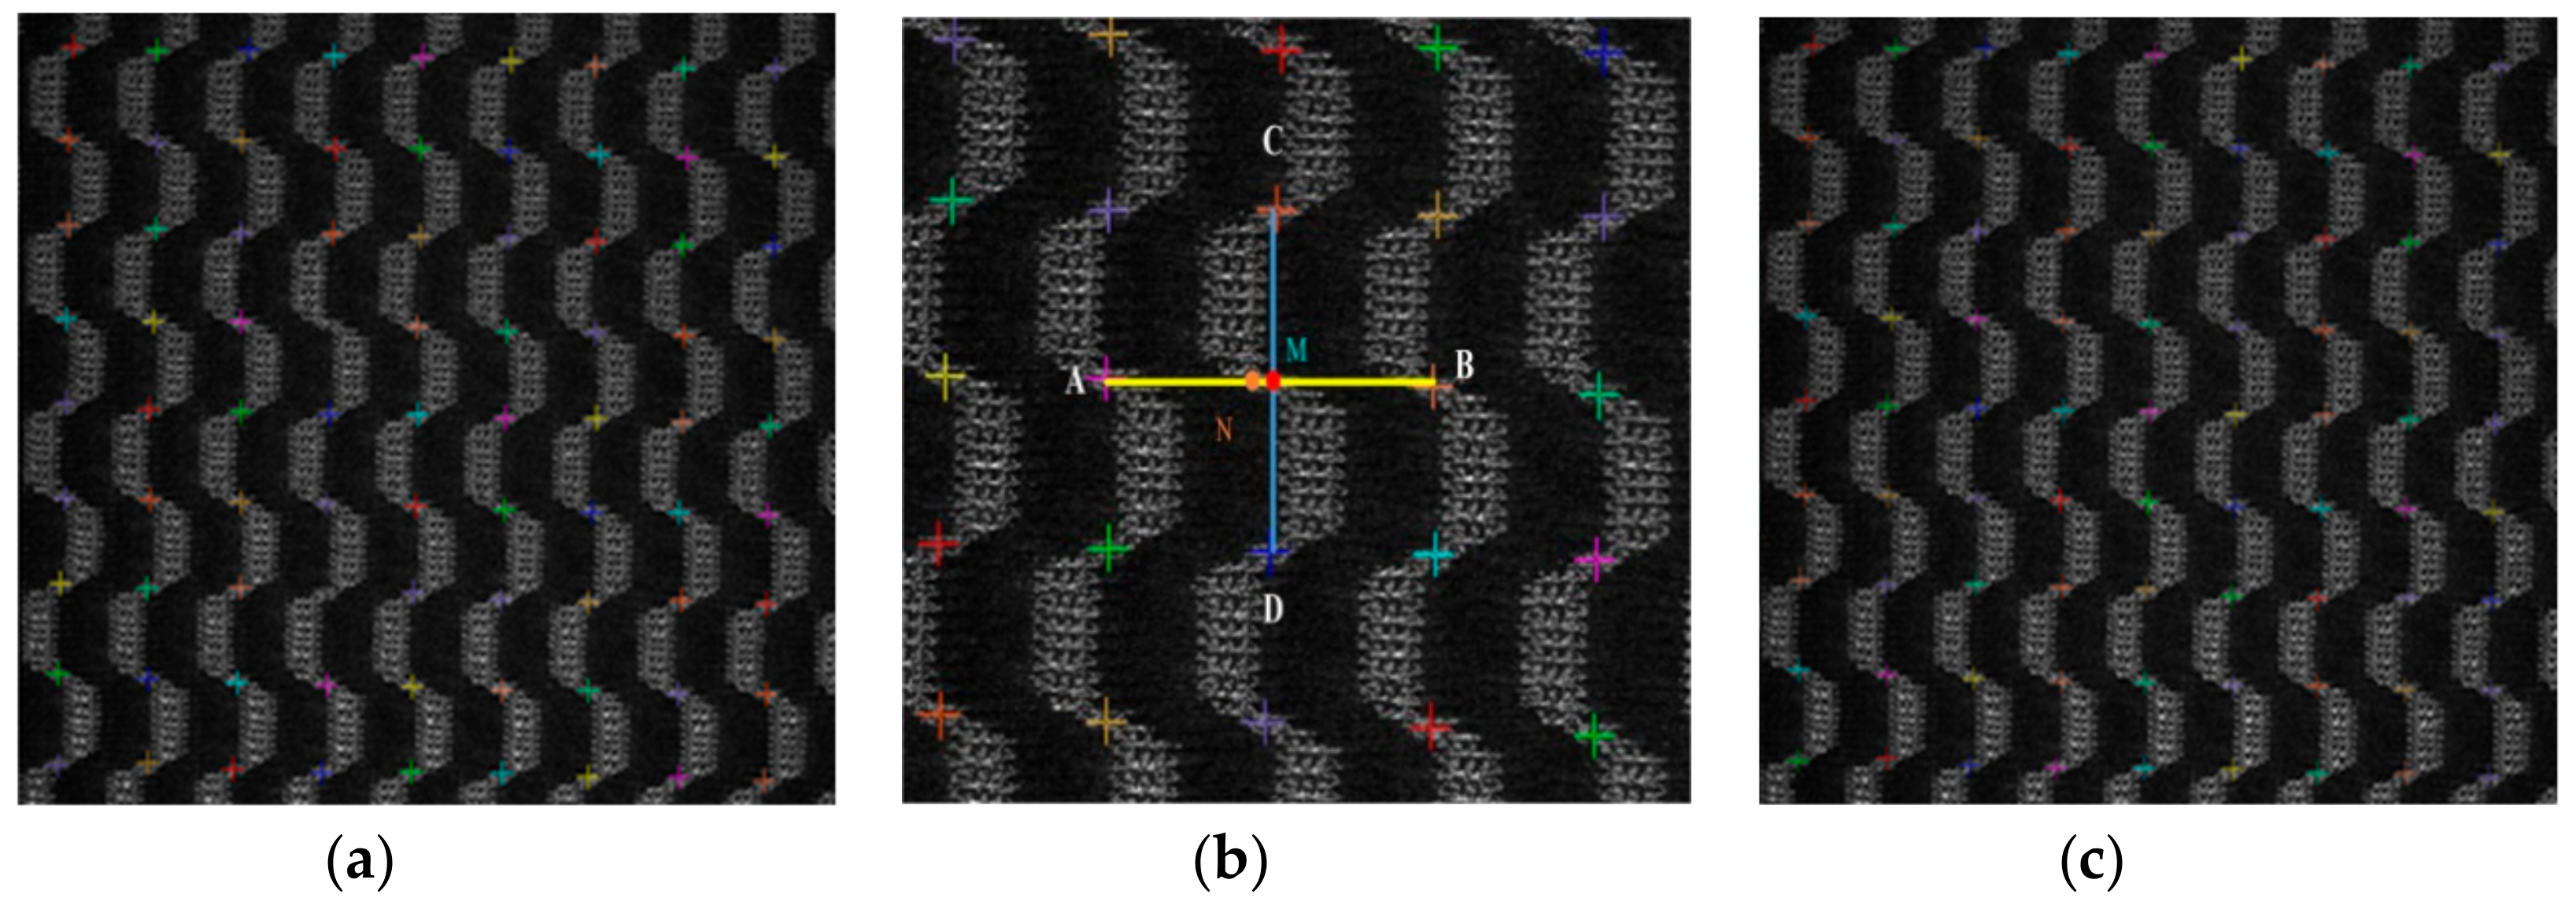
Step 5: Missing center points are filled based on four-neighbor-method to obtain the final center point map (see
Figure 9c). First, approximately weft period length
Thx and approximately warp period length
Thy are counted from the original center point map. Second, the missing center point is between two known adjacent points
A and
B. If (
k + 1/2) <
Thx <
dm < (
k + 3/2)
Thx, where
k = 1, 2 …, and
dm is the distance between two adjacent corners
A and
B, then fill in k missing center points uniformly on the line
AB. Suppose the filled point is
N. Third, find two adjacent points
C and
D of
N in the longitudinal direction. Finally, the missing point
M (see
Figure 9b) is the intersection between
L1 (the line formed by point
A and point
B) and
L2 (the line formed by point
C and point
D). Similarly, handle the cases with missing points in the vertical direction.
2.4. Pattern Period Length and Skew Angle Measurement
The skew angles and period length can be measured based on the final center point map which reflects the center points distribution of the pattern.
The period lengths include the weft period length
Th and warp period length
Tv. As shown in
Figure 10b, the detected center points were denoted by the red points
Hi,
Vi, (
i = 1, 2, 3, …). One weft period length is
Th =
dHiHj, where
dHiHj is the distance between the
Hi and
Hj (
j =
i + 1,
i = 1, 2, 3…). Similarly, one warp period length is
Tv =
dViVj, where
dViVj is the distance between the
Vi and
Vj (
j =
i + 1,
i = 1, 2, 3…).
The skew angles also include the weft skew angle
θweft and warp skew angle
θwarp. The
θweft and
θwarp are calculated by
θh,
θv and
θc in
Figure 10a, where
θc is the angle between the contour of the piece and the x-axis, measured by the measuring tool (see
Figure 10a). Since this paper only studied the local pattern features of the piece, it is assumed that
θc is a known angle. The way to obtain
θh and
θv is shown in
Figure 10b. First, the least squares method is used to fit the center points
Hi (
i = 1, 2, 3…) in the weft direction as a weft period line
Lh. Second, calculate the slope
Kh of the line
Lh. Finally,
θh is calculated by the equation
. Similarly, the center points
Vi (
i = 1, 2, 3…) in the weft direction are used to obtain
θv. The skew angles (
θweft and
θwarp) can be obtained by the following equation:
3. Results and Discussion
In this section, the proposed algorithm was used to test the six types of pattern images (
Fi,
Fr,
Fc,
Fs1,
Fs2 and
Fs3) shown in
Figure 11a–f. The center point maps reflecting the periodic characteristics of the pattern are shown in
Figure 11g–l. Since
θc in
Figure 10a is an external angle and does not affect the overall accuracy of the angle to be measured, this paper measured and evaluated the
θh and
θv shown in
Figure 10a.
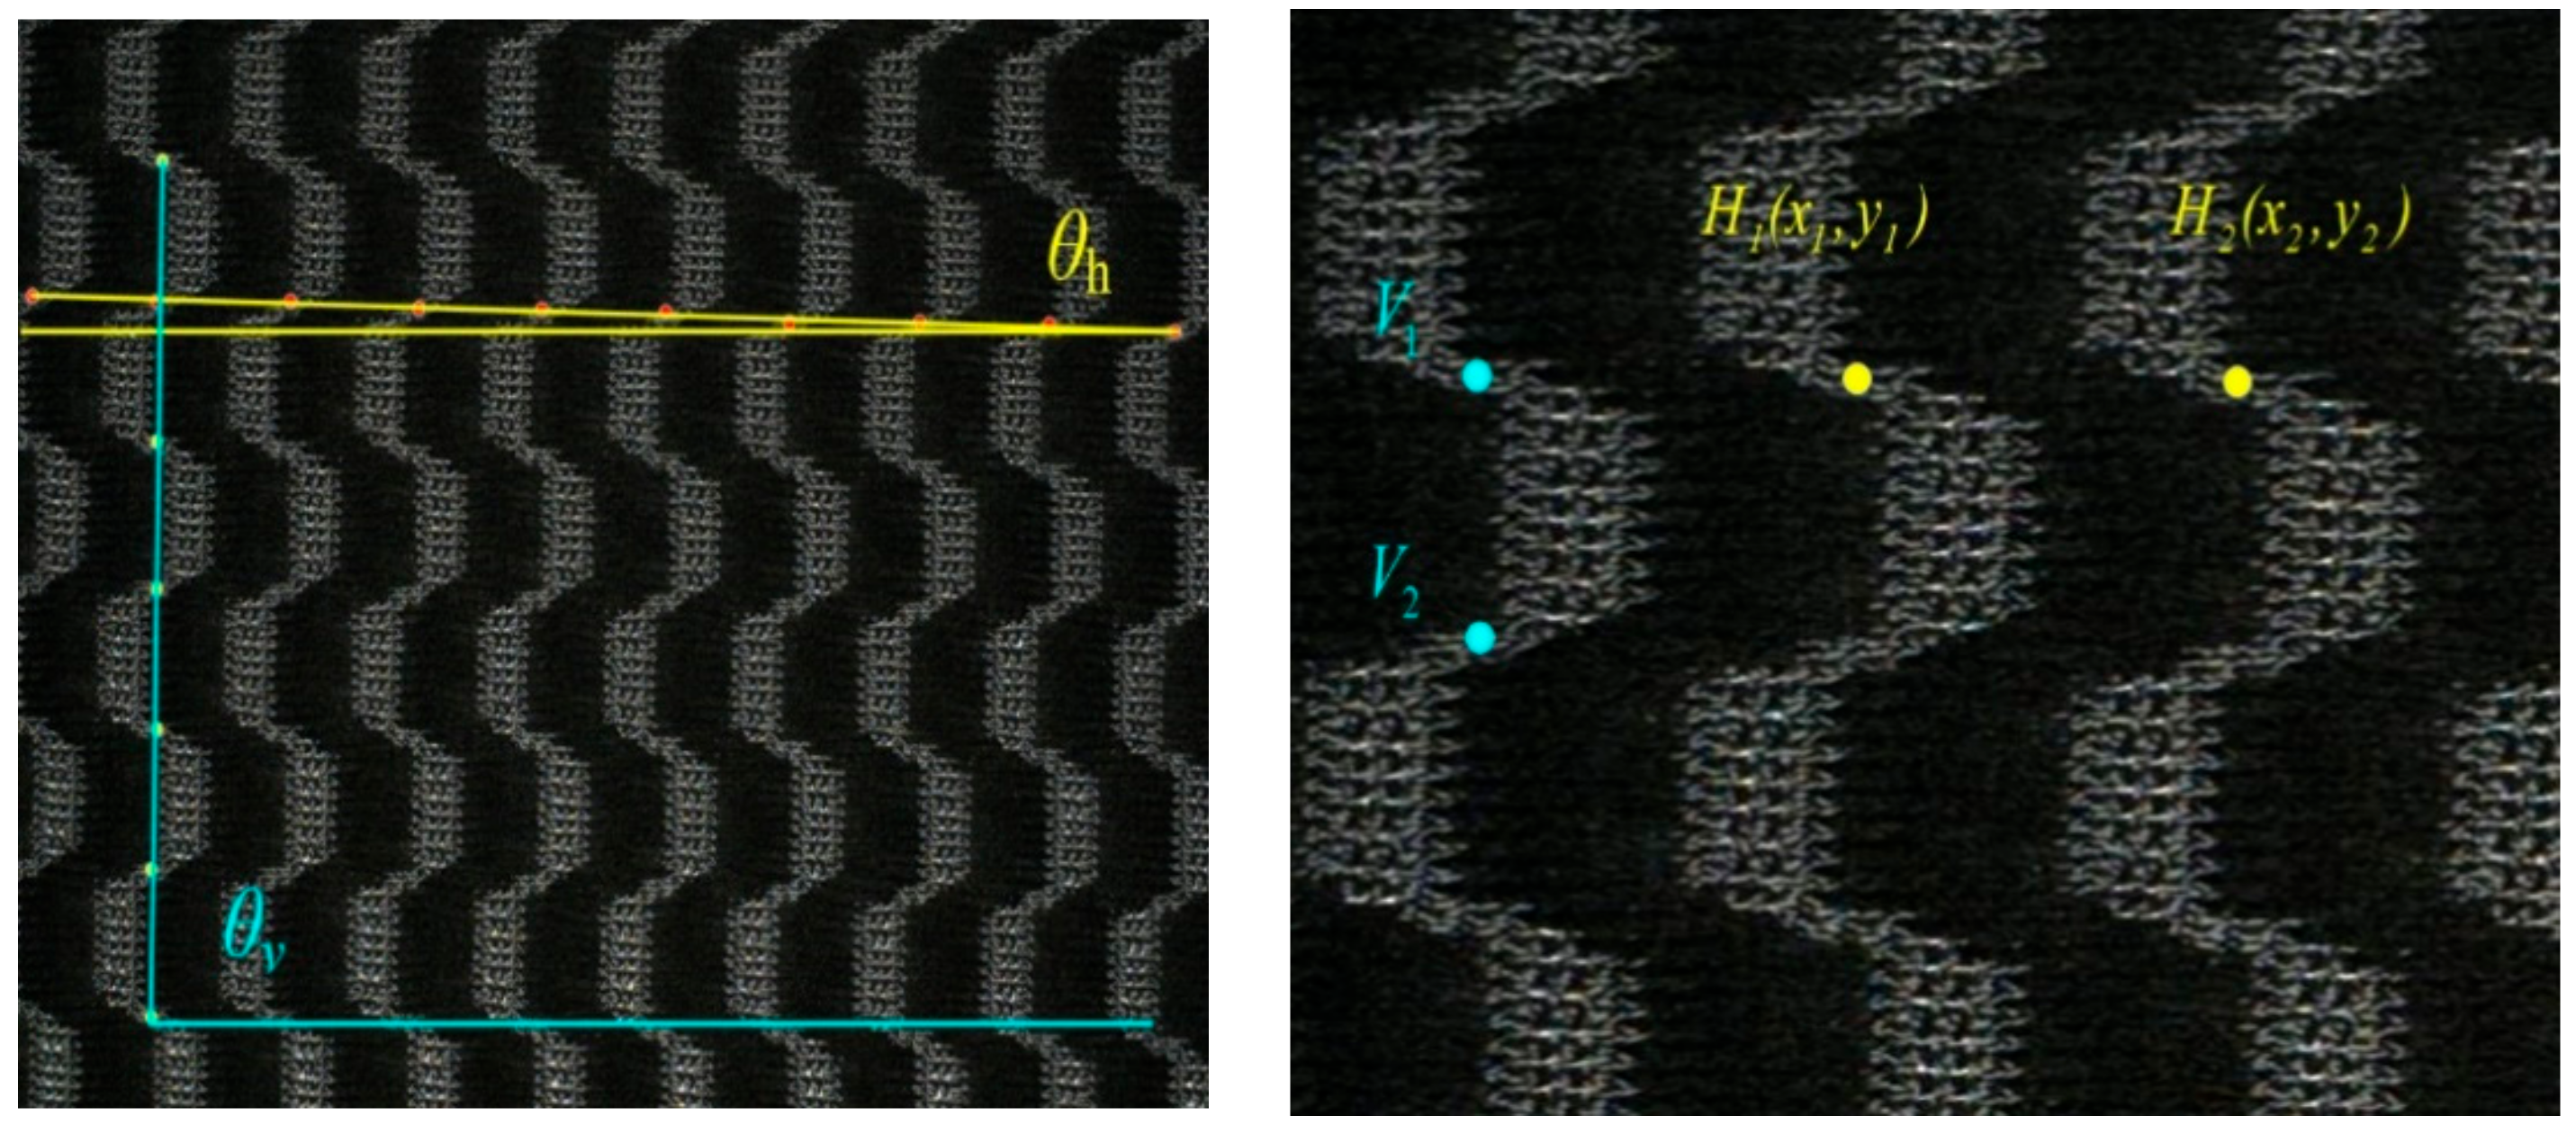
To evaluate the proposed algorithm, we compare the proposed algorithm with manual measurement results. Manual measurement of the period length was achieved by clicking the center points of the patterns on the computer screen. As illustrated in
Figure 12b, for example, we obtained the center points
Hi,
Vi, (
i = 1, 2, …) and then calculated the weft period length as
Th =
dHiHj, where
dHiHj is the distance between the
Hi and
Hj (
j =
i + 1,
i = 1, 2,…).And the warp period length as
Tv =
dViVj, where
dViVj is the distance between the
Vi and
Vj (
j =
i + 1,
i = 1, 2, …).
Th and
Tv were measured twenty times, and the final result was the average of the measurements. Similarly, manual measurement of the
θh and
θv also was accomplished by clicking the center points of the patterns on the computer screen. The center points in the same period direction were fitted as a straight line and the angle between the line and the x-axis was calculated (see
Figure 11a). We measured each angle twenty times and then calculated the average values to obtain the result. The standard deviation
δ was used to analyze the accuracy of the manual measurements of the period length and skew angle.
The expression of the standard deviation is shown as follows:
where
is the average value of
X.
Table 2 shows the manual measurement standard deviation of period length of images (
Fr,
Fc,
Fs1,
Fs2 and
Fs3), where
δThα,
δThβ, and
δThγ were the minimum, maximum and average standard deviation, respectively, of the weft period length measurement.
δTvα,
δTvβ, and
δTvγ were defined similarly for the warp period length measurement. As shown in
Table 2, the standard deviation obtained by manual measurement was very small. Therefore, it was reasonable to use the manual measurement results as the evaluation standard.
Table 3 shows the period length measurement results of images (
Fi,
Fr,
Fc,
Fs1,
Fs2 and
Fs3 in
Figure 11). The method based on image autocorrelation, the method based on distance matching function and the proposed method were compared with the manual measurement results, where
T is the period length, the subscript
h represents the weft direction, the subscript
v represents the warp direction,
m stands for manual measurement method,
p stands for the proposed method,
z stands for autocorrelation,
d stands for distance matching function.
Table 4 shows the relative error value between different period length measurement methods and manual measurements of images (
Fi,
Fr,
Fc,
Fs1,
Fs2 and
Fs3 in
Figure 11), where the
ehpm represents the relative error of
Thp with
Thm.
ehzm represents the relative error of
Thz with
Thm.
ehdm represents the relative error of
Thd with
Thm. Similarly,
evpm is the relative error of
Tvp with
Tvm.
evzm is the relative error of
Tvz with
Tvm.
evdm is the relative error of
Tvd with
Tvm. The expression of the relative error RE is shown in the following Equation (5).
where
X represents the measured value and
T represents the actual value.
From
Table 3 and
Table 4, we could conclude that the period length measured by the proposed method had higher accuracy than the autocorrelation-based and the distance-matching function-based method. There was also a smaller relative error between the proposed method and the manual measurement result.
Similar to the evaluation of the period length, the standard deviation was used to suggest the reliability of the manual measurement of the angles.
Table 5 shows the manual measurement standard deviation of
θh and
θv of images (
Fi,
Fr,
Fc,
Fs1,
Fs2 and
Fs3 in
Figure 11), where the
δθhα,
δθhβ and
δθhγ are the minimum, maximum and average standard deviation of the
θh, respectively. Similarly,
δθvα,
δθvβ and
δθvγ are the minimum, maximum and average standard deviation of the
θv, respectively. From
Table 5, we could conclude that the standard deviation of the manual measurements was small. Therefore, it was reasonable to use the manual measurement results as a benchmark to evaluate the measurement accuracy of the proposed measurement method.
Table 6 shows the various methods measurement results of
θh and
θv of images (
Fi,
Fr,
Fc,
Fs1,
Fs2 and
Fs3 in
Figure 11). The method based on corner detection method and the proposed method for measuring
θh and
θv were compared with the manual measurement results, where the subscript
h represents the weft direction, the subscript
v represents the warp direction,
m stands for manual measurement method,
p stands for the proposed method,
c stands for corner detection.
Table 7 shows the relative error value between different angle measurement methods and manual measurements of images (
Fi,
Fr,
Fc,
Fs1,
Fs2 and
Fs3 in
Figure 11), where the
ehpm represents the relative error of
θhp with
θhm.
evpm represents the relative error of
θvp with
θvm.
ehcm represents the relative error of
θhc with
θhm.
evcm represents the relative error of
θvc with
θvm.
The following observations were derived from
Table 6 and
Table 7. The proposed method for measuring
θh and
θv achieved a smaller relative error compared to manual measurements. Compared with the corner detection-based method, the proposed method had higher accuracy and more stable performance in angle measurement.


