Article

A Method Validation for Simultaneous Determination of Phthalates and Bisphenol A Released from Plastic Water Containers

1
Department of Agriculture, Environmental and Food Sciences, University of Molise, via De Sanctis, I-86100 Campobasso, Italy
2
Department of Public Health and Infectious Diseases, University of Rome “La Sapienza”, p.le Aldo Moro 5, I-00185 Rome, Italy
3
Institute of Ecotoxicology & Environmental Sciences, Kolkata 700156, India
*
Author to whom correspondence should be addressed.
Appl. Sci. 2019, 9(14), 2945; https://doi.org/10.3390/app9142945
Submission received: 8 July 2019 / Revised: 17 July 2019 / Accepted: 19 July 2019 / Published: 23 July 2019
(This article belongs to the Section Chemical and Molecular Sciences)

Abstract

:

Featured Application

If plastic bottles are left in the heat for a long time, they can be harmful to human health. One has probably seen pallets of water bottles in front of large supermarkets waiting for someone to take them away from the sun and heat. The main problem derives from the fact that the commonly defined plastic bottles, once in contact with heat sources, release both phthalates and bisphenol A. This means that great care must be taken not to expose water bottles to food, neither during transport, nor in supermarket stores in any way. For this reason, the authors propose an easy, robust, and rapid method to determine such compounds with high precision and accuracy.

Abstract

Phthalates (or phthalate esters, PAEs) and bisphenol A (BPA) are widely used in various industries, particularly in the fields of cosmetics and packaging, and they increase the malleability and workability of materials. As a result of their use, some international health organizations have begun to study them. In this study, the authors developed a methodology for the simultaneous determination of dimethyl phthalate (DMP), diethyl phthalate (DEP), diisobutyl phthalate (DiBP); dibutyl phthalate (DBP), bis(2-ethylhexyl) phthalate (DEHP); di-n-octyl-phthalate (DnOP) and bisphenol A (BPA) from drinking and non-potable waters. The extraction of PAEs and BPA was performed using a solvent-based dispersive liquid–liquid microextraction (SB-DLLME) method. The analytical determination was performed using a gas chromatography–ion trap mass spectrometry (GC-IT/MS) analysis. The entire procedure was validated as recoveries were studied according to the volume and the extraction solvent used, pH, and ionic strength. Dynamic linearity ranges and linear equations of all the compounds were experimentally determined as well as the limit of detection (LOD) (1–8 ng mL−1) and the limit of quantification (LOQ) (5–14 ng mL−1), reproducibility, and sensitivity. The method was applied to 15 water samples (mineral water and tap water) for determining PAEs and BPA released from the plastic container. After the release simulation, four PAEs (i.e., DiBP, DBP, DHEP, and DnOP) were determined at very low concentrations (below 1.2 ng mL−1) in two water samples from (sport) bottles.

1. Introduction

Currently, plastics are one of the most practical and economical ways to contain food, healthcare products, cosmetics, or other products [1,2,3]. The development and wide use of plastic materials as containers has led the packaging industry to significantly change the chemical composition of plastics in recent years. In fact, chemical additives are added to their composition to increase their malleability, brilliance, and workability. Among these additives, the most commonly used are phthalates and bisphenol A (BPA) [4,5,6].
Phthalates (or phthalate esters, PAEs) are compounds synthesized by double esterification of 1,2 benzendicarboxylic acid (phthalic acid) with linear or branched alcohols, starting from methanol or ethanol (C1-C2), up to isotridecanol (C13). Depending on the molecular weight, they can be used in various industrial applications. Low molecular weight phthalates, such as diethyl phthalate (DEP) and dibutyl phthalate (DBP), have been used since 1930 in personal care and hygiene products (in the preparation of perfumes, shampoos, soaps, lotions, cosmetics, and softeners, or added as plasticizers of cellulose acetate), in the process industry (e.g., production of lacquers, paints, lubricating oils, adhesives, inks, insecticides, coatings), and also in the pharmaceutical industry (in some drugs, it is used to regulate the release speed) [7]. On the other hand, high molecular weight phthalates, such as bis(2-ethylhexyl) phthalate (DEHP), diisononyl phthalate (DINP), and di-n-octyl phthalate (DnOP) are mainly used as plasticizers in the production of vinyl, which is often used in products such as flooring and wall covering, toys, food packing, and medical devices [8]. The plasticizing phthalates, which also include diisodecyl phthalate (DIDP), dimethyl phthalate (DMP), diethyl phthalate (DEP), dibutyl phthalate (DBP), and benzylbutyl phthalate (BBP), are used as intermolecular lubricants conferring hardness, flexibility, malleability, and elasticity [9]. The chemical and physical properties vary with the structure, that is, with the length of the chain and the branches. They are generally colorless and odorless and lipophilic, and show a high boiling point and a low vapor pressure, both parameters influencing their high stability and presence in the environment. Fundamentally, up to 8 million tons of phthalate products are produced each year worldwide, of which over 2 million are just DEHP [10]. In Western Europe, about one million tons of phthalates are produced annually, of which 900,000 are used in the production process of polyvinyl chloride (PVC) to increase its plastic properties.
PAEs are molecules that are not covalently linked to the matrix and show a tendency to migrate, especially in the presence of lipophilic compounds and/or in the event of mechanical or thermal stress [11]. For example, a generic product containing PVC (it may include more than 40% of DEHP) or other products containing such molecules produces a typical release of PAEs into the environment [12,13]. Therefore, PAEs represent ubiquitous contaminants and decompose with both exposure to sunlight and aerobic microbial activity; they tend to adsorb soil particles, sediments, and humus where they are protected from sunlight. From the environmental point of view, PAEs have a duration (and therefore a permanence) of several hours in the atmosphere and of months in the soil, whereas they can persist for years in sediments [14]. They can bioaccumulate in invertebrates, fish, and plants, whereas in complex animals they are efficiently metabolized and excreted. This last consideration is very important because the possible presence of PAEs in tissues [15] indicates a very recent exposure/contamination.
PAEs play an extremely dangerous role for human health because they can accumulate in the human body and cause chronic intoxication causing serious damage to the liver and/or reproductive system [16]. In fact, they are considered endocrine disruptors [17]. Humans are widely exposed to PAEs [18]. Exposure may derive from four major routes, namely, ingestion (mainly with respect to PAE plasticizing; sources can be food contamination during the preparation or packaging process, drugs and nutritional preparations, baby toys), inhalation (mainly DEP and DEHP, although they show low volatility; they can originate from medical devices, e.g., bags or pipes, or be present in indoor dust, e.g., furniture, clothes, building materials, plastic components), intravenous (from medical PVC devices transporting intravenous fluids, nutritional formulas, blood; DEHP migration varies according to some parameters such as lipid content, temperature, and duration time), and dermal (mainly DEP; contamination through clothes, footwear, gloves, cosmetics, sunscreen, insecticides, hygiene products, paints, toys) [19,20,21,22,23,24]. Phthalates have a low acute toxicity, with an LD50 between 1 and 30 g of body weight [25,26]. It should be noted that the exposure risk decreases with individual age [22]. PAEs do not show mutagenic and/or genotoxic activity [27], although a recent study shows potentially surprising mutagenic activity by DEHP [28], whereas the carcinogenic aspect is more complex [29]. DEP activity is questionable, there are no carcinogenicity data available for DiNP, DBP appears to be associated with tumor promotion activity, and DEHP exposure produces hepatocellular carcinoma in rodents along with a variety of other hepatocellular effects [30]. In addition, the European Food Safety Authority (EFSA) has established the maximum daily limit of human intake for some PAEs (DBP 0.01, BBP 0.5, DEHP 0.05, DNP 0.15, DDP 0.15 mg kg−1 per day per body weight) [31]. The International Agency for Research on Cancer (IARC) has recently evaluated DEHP and modified its classification from “possibly carcinogenic to humans (Group 2B)” to “not classifiable as to its carcinogenicity to humans (Group 3)”. The PAE residues in food and beverages are internationally regulated; in many countries, phthalates are banned as food substances.
On the other hand, BPA, belonging to the group of diphenylmethane and bisphenol derivatives, is a pseudo-persistent chemical and, despite its short duration, is omnipresent in the environment due to its release [32]. The presence of hydroxyl groups results in good reactivity. Similar to other phenols, BPA can be converted into ethers, esters, and salts, showing good solubility in fats but less in water. The presence of BPA in the natural environment is linked exclusively to activities of anthropic origin; it is a starting material for the synthesis of plastics [33]. The release can take place during the production, transport, or processing phases. BPA has acute toxicity towards vertebrates. The LD50 values in rats are 3250 mg kg−1 body weight for oral intake, 841 mg kg−1 intraperitoneal. and 35.26 mg kg−1 intravenously [34]. Since 1988, the U.S. Environmental Protection Agency (US EPA) has estimated a reference dose for oral ingestion of 50 μg kg−1 body weight [35], whereas the European Food Safety Authority (EFSA) recently set the tolerable daily intake (TDI) at 4 µg kg−1 body weight (i.e., twelve and a half times lower than the previous level) [18] and a new revision is planned for 2020. In recent years. the study on BPA’s toxic, teratogenic, carcinogenic, and estrogenic effects has considerably intensified, also considering its widespread use. BPA is a xenoestrogen, a compound that disturbs the functions of the endocrine system [36,37,38,39]. A recent study by Acevedo et al. (2013) [40] suggested that BPA taken from mice in does comparable to those taken by humans behaves like a carcinogen for the mammary gland. Finally, numerous investigations have shown that BPA, by exerting an action on the endocrine system, can contribute to the development of obesity [41,42].
For these reasons, several studies have been set up to determine the PAE/BPA presence in food packaging and/or in food and beverages following the migration process [43,44,45,46]. Although the analytical determination is well studied, it is still difficult [47]. In the literature, there are few articles on these topics in such matrices and they are based on stir bar sorptive extraction (SBSE) or solid phase extraction (SPE) [48,49,50,51,52,53,54].
For many years, our research group has been involved in the development of analytical methods for micropollutant determination in different food matrices [55,56,57,58,59,60,61,62,63]. In this paper, the authors investigated the possibility of simultaneous PAE and BPA determination in water samples after their release from plastic water containers.

2. Materials and Methods

2.1. Materials and Chemicals

Standards of PAEs investigated in this study, such as dimethyl phthalate (DMP; C10H10O4; MW 194; first and second fragment m/z ratio 163), diethyl phthalate (DEP; C12H14O4; MW 222; m/z 149 and 177), diisobutyl phthalate (DiBP; C16H22O4; MW 278; m/z 149 and 205); dibutyl phthalate (DBP; C16H22O4; MW 278; m/z 149 and 205), bis(2-ethylhexyl) phthalate (DEHP; C24H38O4; MW 390; m/z 149 and 261); di-n-octyl-phthalate (DnOP); C24H34O4; MW 391; m/z 149 and 261), and bisphenol A (BPA; C15H16O2; MW 228; m/z 213 and 228), were obtained from Sigma-Aldrich (Milan, Italy). A mixture containing all the standards was prepared at an initial concentration of 200 µg mL−1 and subsequently diluted up to 50 ng mL−1. The solutions were stored in 2 mL amber vials at −20 °C. n-Hexane, n-heptane, iso-octane, and benzene were of pesticide grade (Carlo Erba, Milan, Italy), whereas sodium chloride (Carlo Erba) was of analytical reagent grade. Finally, 5 µL of anthracene (1 mg mL−1) (C14H10; MW 178; LabService Analytica, Anzola Emilia, Bologna, Italy) were added as the internal standard (I.S.) to each sample before being processed.
Regarding cross-contamination due to reagents (especially to minimize background contamination due to NaCl), materials, and laboratory equipment (e.g., glassware, tubing), which is still a fundamental problem in PAE analysis, all chemicals and instruments were subjected to severe cleaning procedures. Previous papers [58,60] report all the details. In summary, the glassware was soaked and washed in acetone, dried at 140 °C for at least 4 h; NaCl was heated for 4 h at 140 °C and, after cooling, kept in a tightly sealed glass vial. For the PAE standard solutions (0.1 mg mL−1 of each PAE), absolute ethanol was used; each solution was further diluted by ethanol to obtain solutions at different PAE concentrations for spiking the samples.

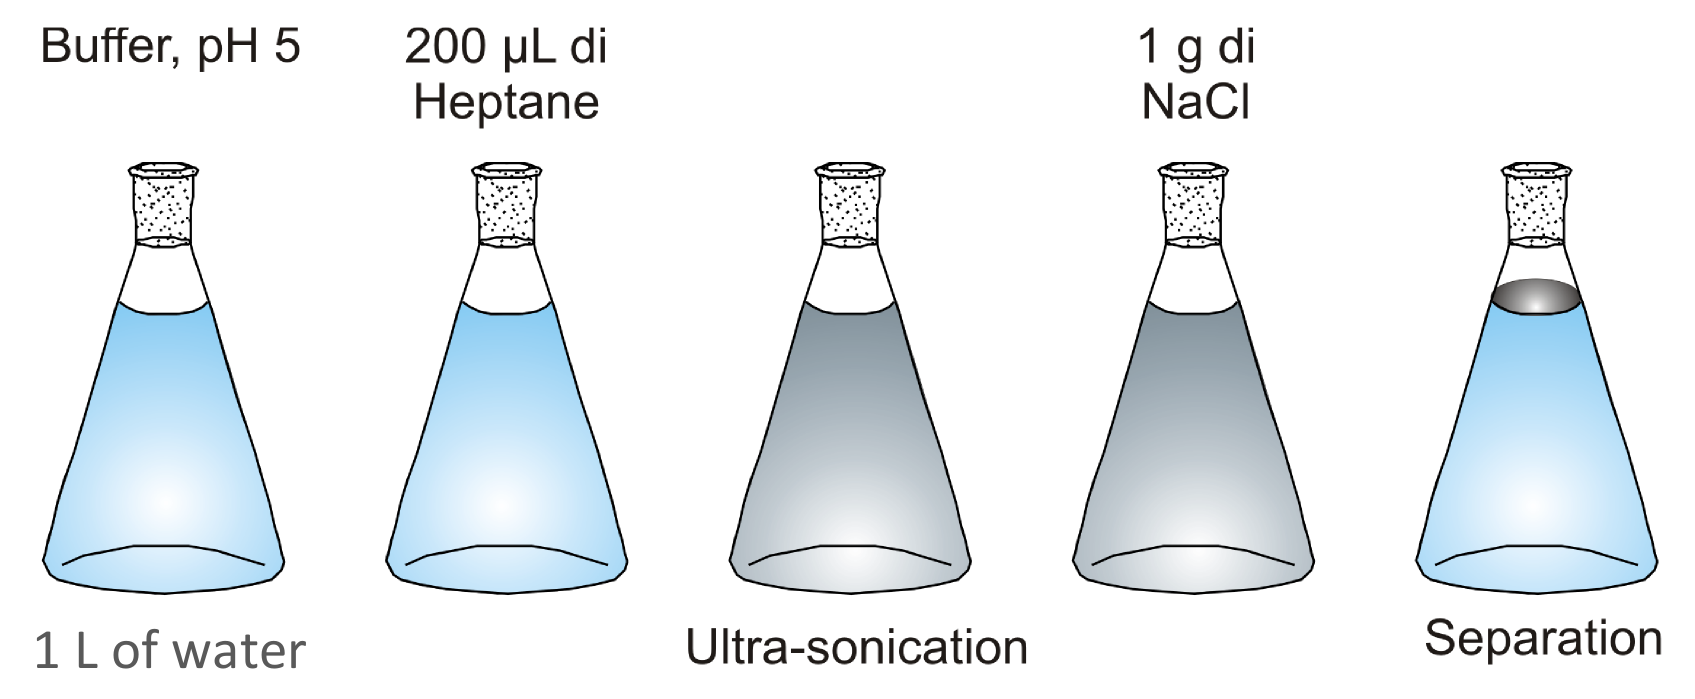
2.2. Extraction Process Using Dispersive Liquid–Liquid Microextraction (DLLME) Methodology

The study of this analytical approach (i.e., the DLLME procedure) can be divided into several phases. The choice of the best extraction solvent among different solvents, such as n-hexane (density 0.66 g cm−3), n-heptane (0.68 g cm−3), iso-octane (0.69 g cm−3), and benzene (0.88 g cm−3), is the first step. All the solvents tested had a lower density than water. Several volumes of each solvent were tested to evaluate the best extraction solvent. Taking into account the absence of the dispersive solvent (e.g., acetone), it was necessary to use other methods to achieve efficient emulsification. Among the different possibilities, ultrasounds were tested; 6 min in the ultrasonic bath (100 W power) allowed us to reach a stable and homogeneous emulsion. Second, NaCl addition was necessary to break the emulsion; different NaCl concentrations were compared in terms of percentage recoveries. Using this approach, 1 L of water sample (pH 5) with the addition of 100 μL of PAE/BPA mixture solution (50 pg μL−1 of each analyte) and 50 μL of I.S. (1 µg μL−1) was treated with 200 μL of n-hexane identified as the best extraction solvent. Subsequently, the sample was subjected to 5 min stirring and ultrasounds for 6 min and NaCl 15 g L−1 was added. The solution was vortexed for 10 min to break the emulsion, then 1 μL withdrawn by syringe was injected into the GC-MS instrument. All experimental conditions were applied to study the analytical parameters of the PAE and BPA extraction.

2.3. GC-MS Analysis

A TraceGC gas chromatograph (GC) coupled with a mass spectrometry ion trap (IT/MS) PolarisQ (Thermo Fischer, Milan, Italy) was used for the analysis, whereas the data acquisition and process were performed using specific software (Xcalibur, version 1.4.1, ThermoFischer,).Reange A model TRB-Meta X5 (30 m × 0.25 mm × 0.25 µm) fused-silica capillary column (SE-54, 5% phenyl −95% dimethylpolisiloxane) from Teknokroma (Rome, Italy) was used. Helium 5.5 was used as carrier gas at a flow rate of 1.0 mL min−1. A programmable temperature vaporization (PTV) injector in the splitless mode was used; 10 seconds after the injection, the vaporizer was heated from 110 to 280 °C at 14.5 °C min−1 and the splitter valve was opened after 120 s. The oven temperature program was as follows: 100 °C, held for 60 s, 10 °C min−1 up to 280 °C and held for 3 min. The transfer line and detector temperatures were maintained throughout the analysis at 270 °C and 250 °C, respectively. The source used for the ionization of molecules inside the mass spectrometer was the electronic impact, with fixed ionization energy at 70 eV. Acquisition started 5 min after injection to prevent the solvent band from ending up on the lit filament. The acquisition was made in full scan in a range of atomic mass units between 75 and 400. Inside the ion trap, an inert gas (helium) was flowed at a rate of 0.3 mL min−1. The Xcalibur software allowed us to run a selected ion monitoring (SIM) display once the full scan chromatogram was acquired. The analytes were examined by setting a separate display in two chromatograms, so that the peaks of the analytes were present on the first chromatogram and the internal standard was present on the second chromatogram. Two fragments were chosen for each analyte, the first with a relative abundance of 100% and the second specific for each compound. Since phthalates have a common basic structure, fragment 149 was present in all phthalates except in DMP.
The quantitative analysis was performed using calibration graphs of the ratio Area(analytes)/Area(IS,anthracene) plotted versus each concentration (pg μL−1). All the samples were determined in triplicate.

3. Results and Discussion

Following much experience developed by the authors in food and beverage samples, this paper aimed to achieve the development of a simple analytical method to simultaneously determine PAE and BPA. This determination was also favored by the high pre-concentration factors achieved during the sample preparation procedure.
Basically, the initial idea was to extract PAEs and BPA from a 1 L aqueous solution. The pH adjustment, the extraction solvent and its volume, the ultrasonic bath, the vortex time, and the amount of NaCl for breaking the emulsion were fundamental analytical parameters to be studied before applying the procedure to the real samples. Finally, 1 μL was injected into the GC-IT/MS. Figure 1 summarizes the extraction protocol.

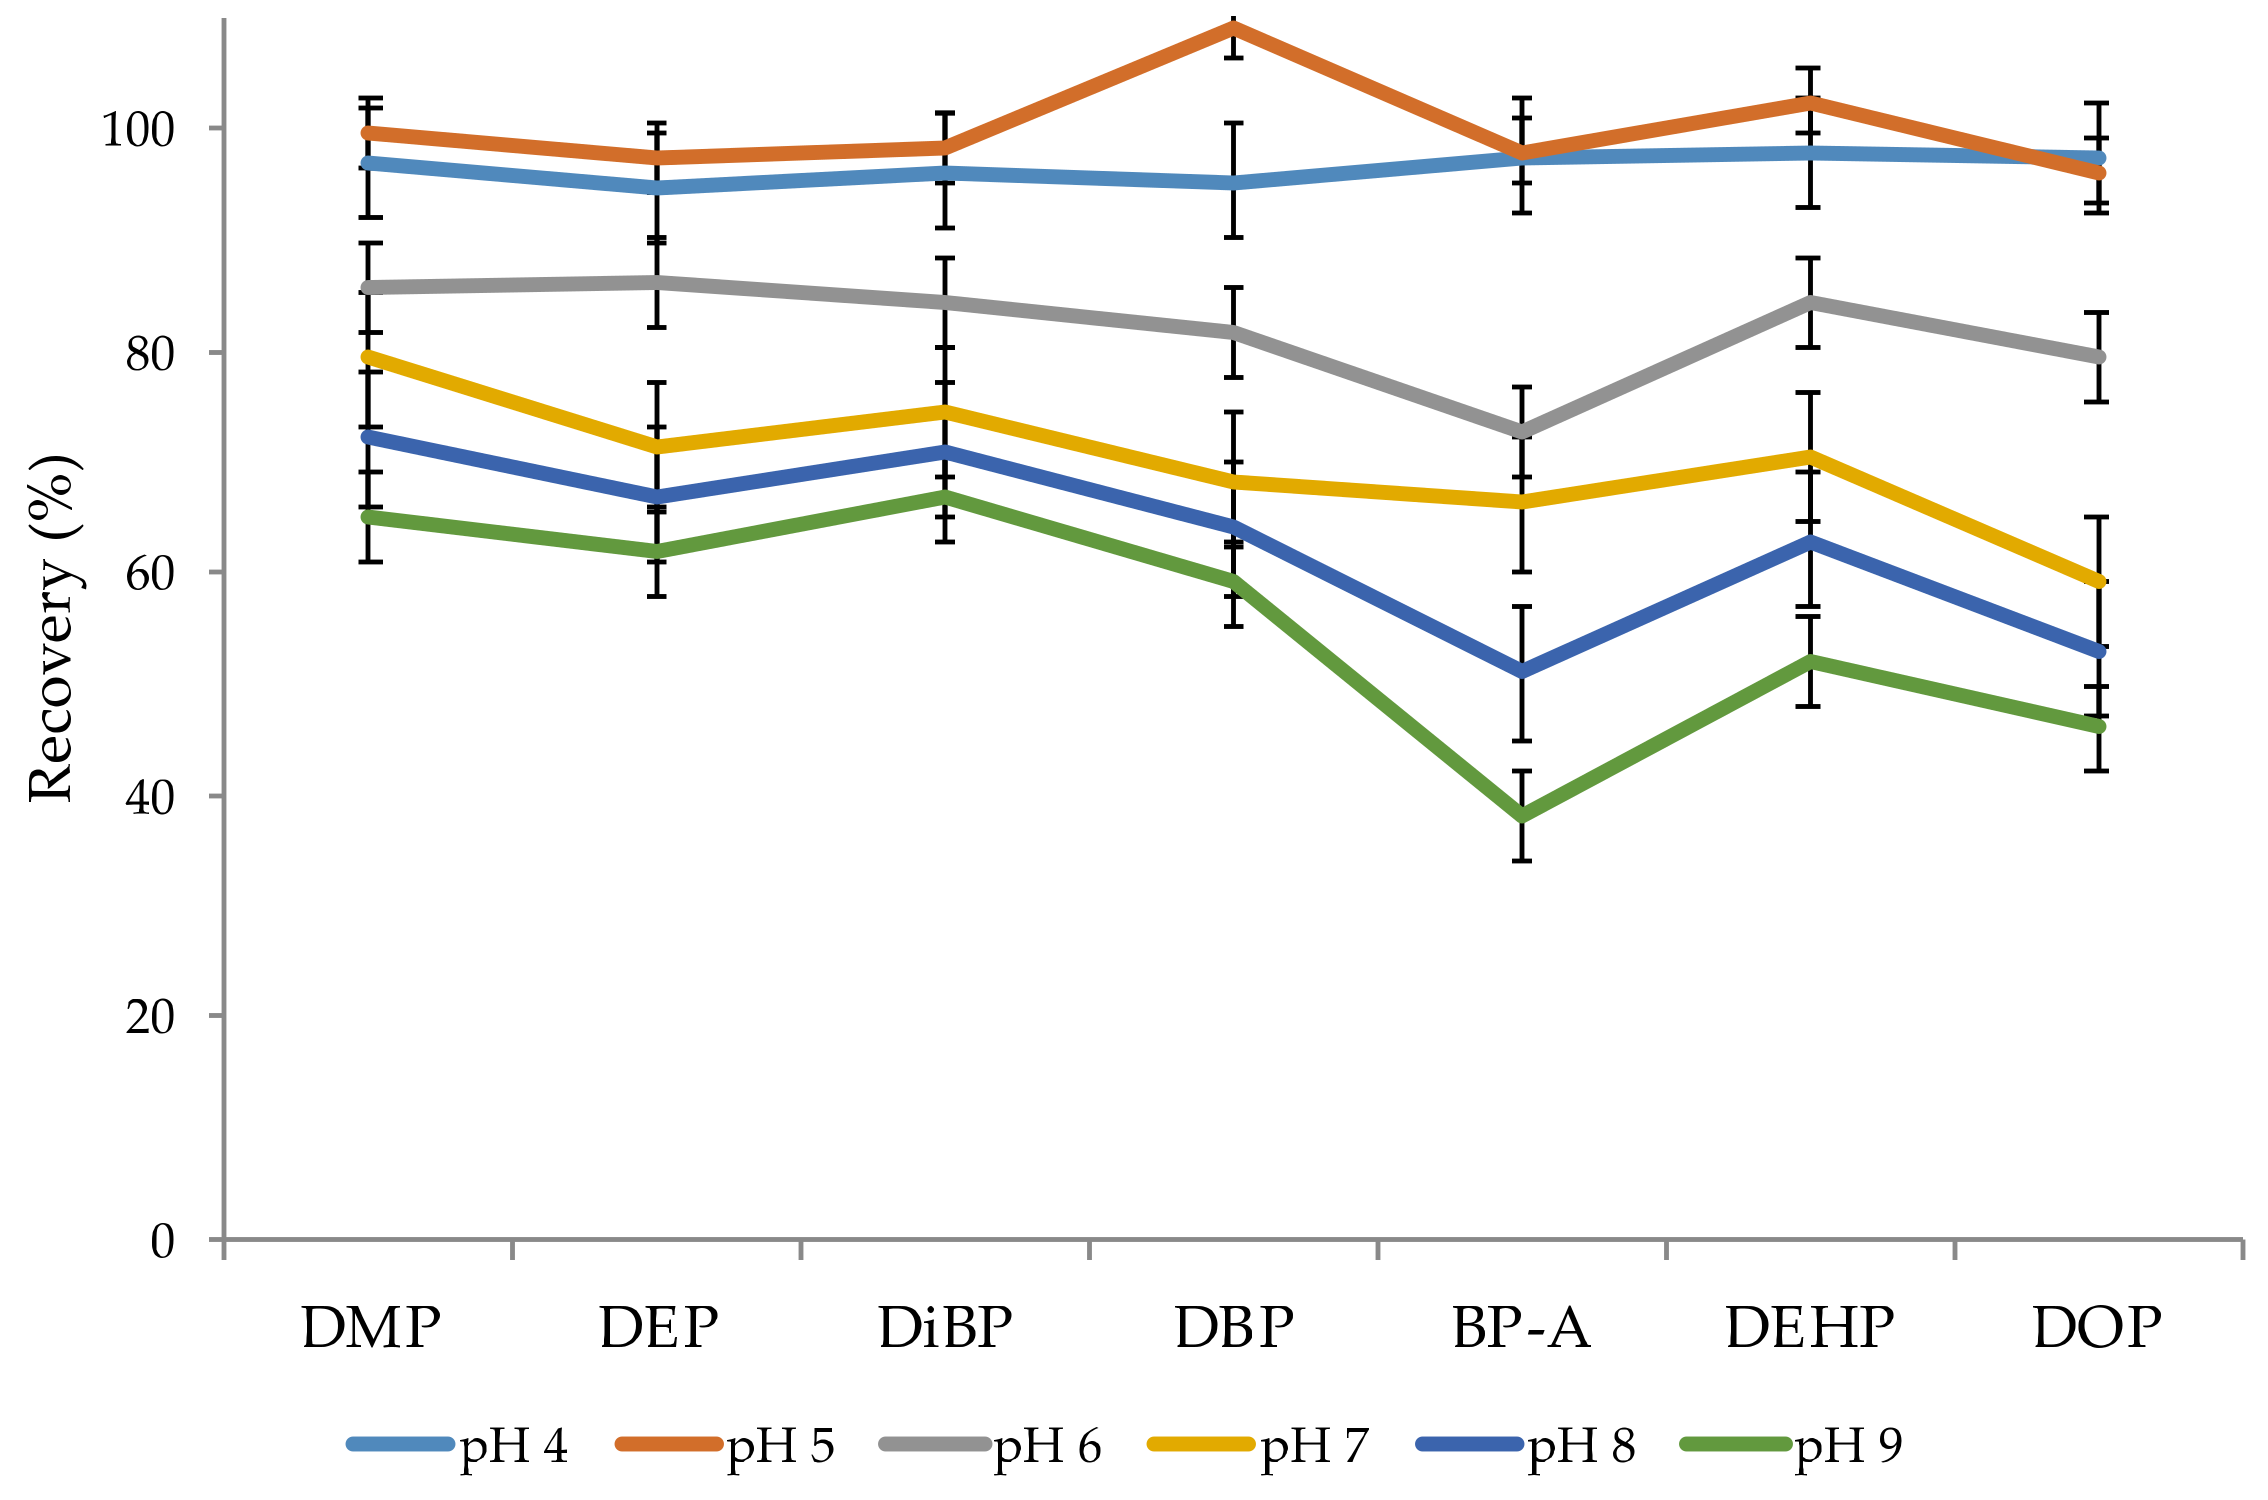
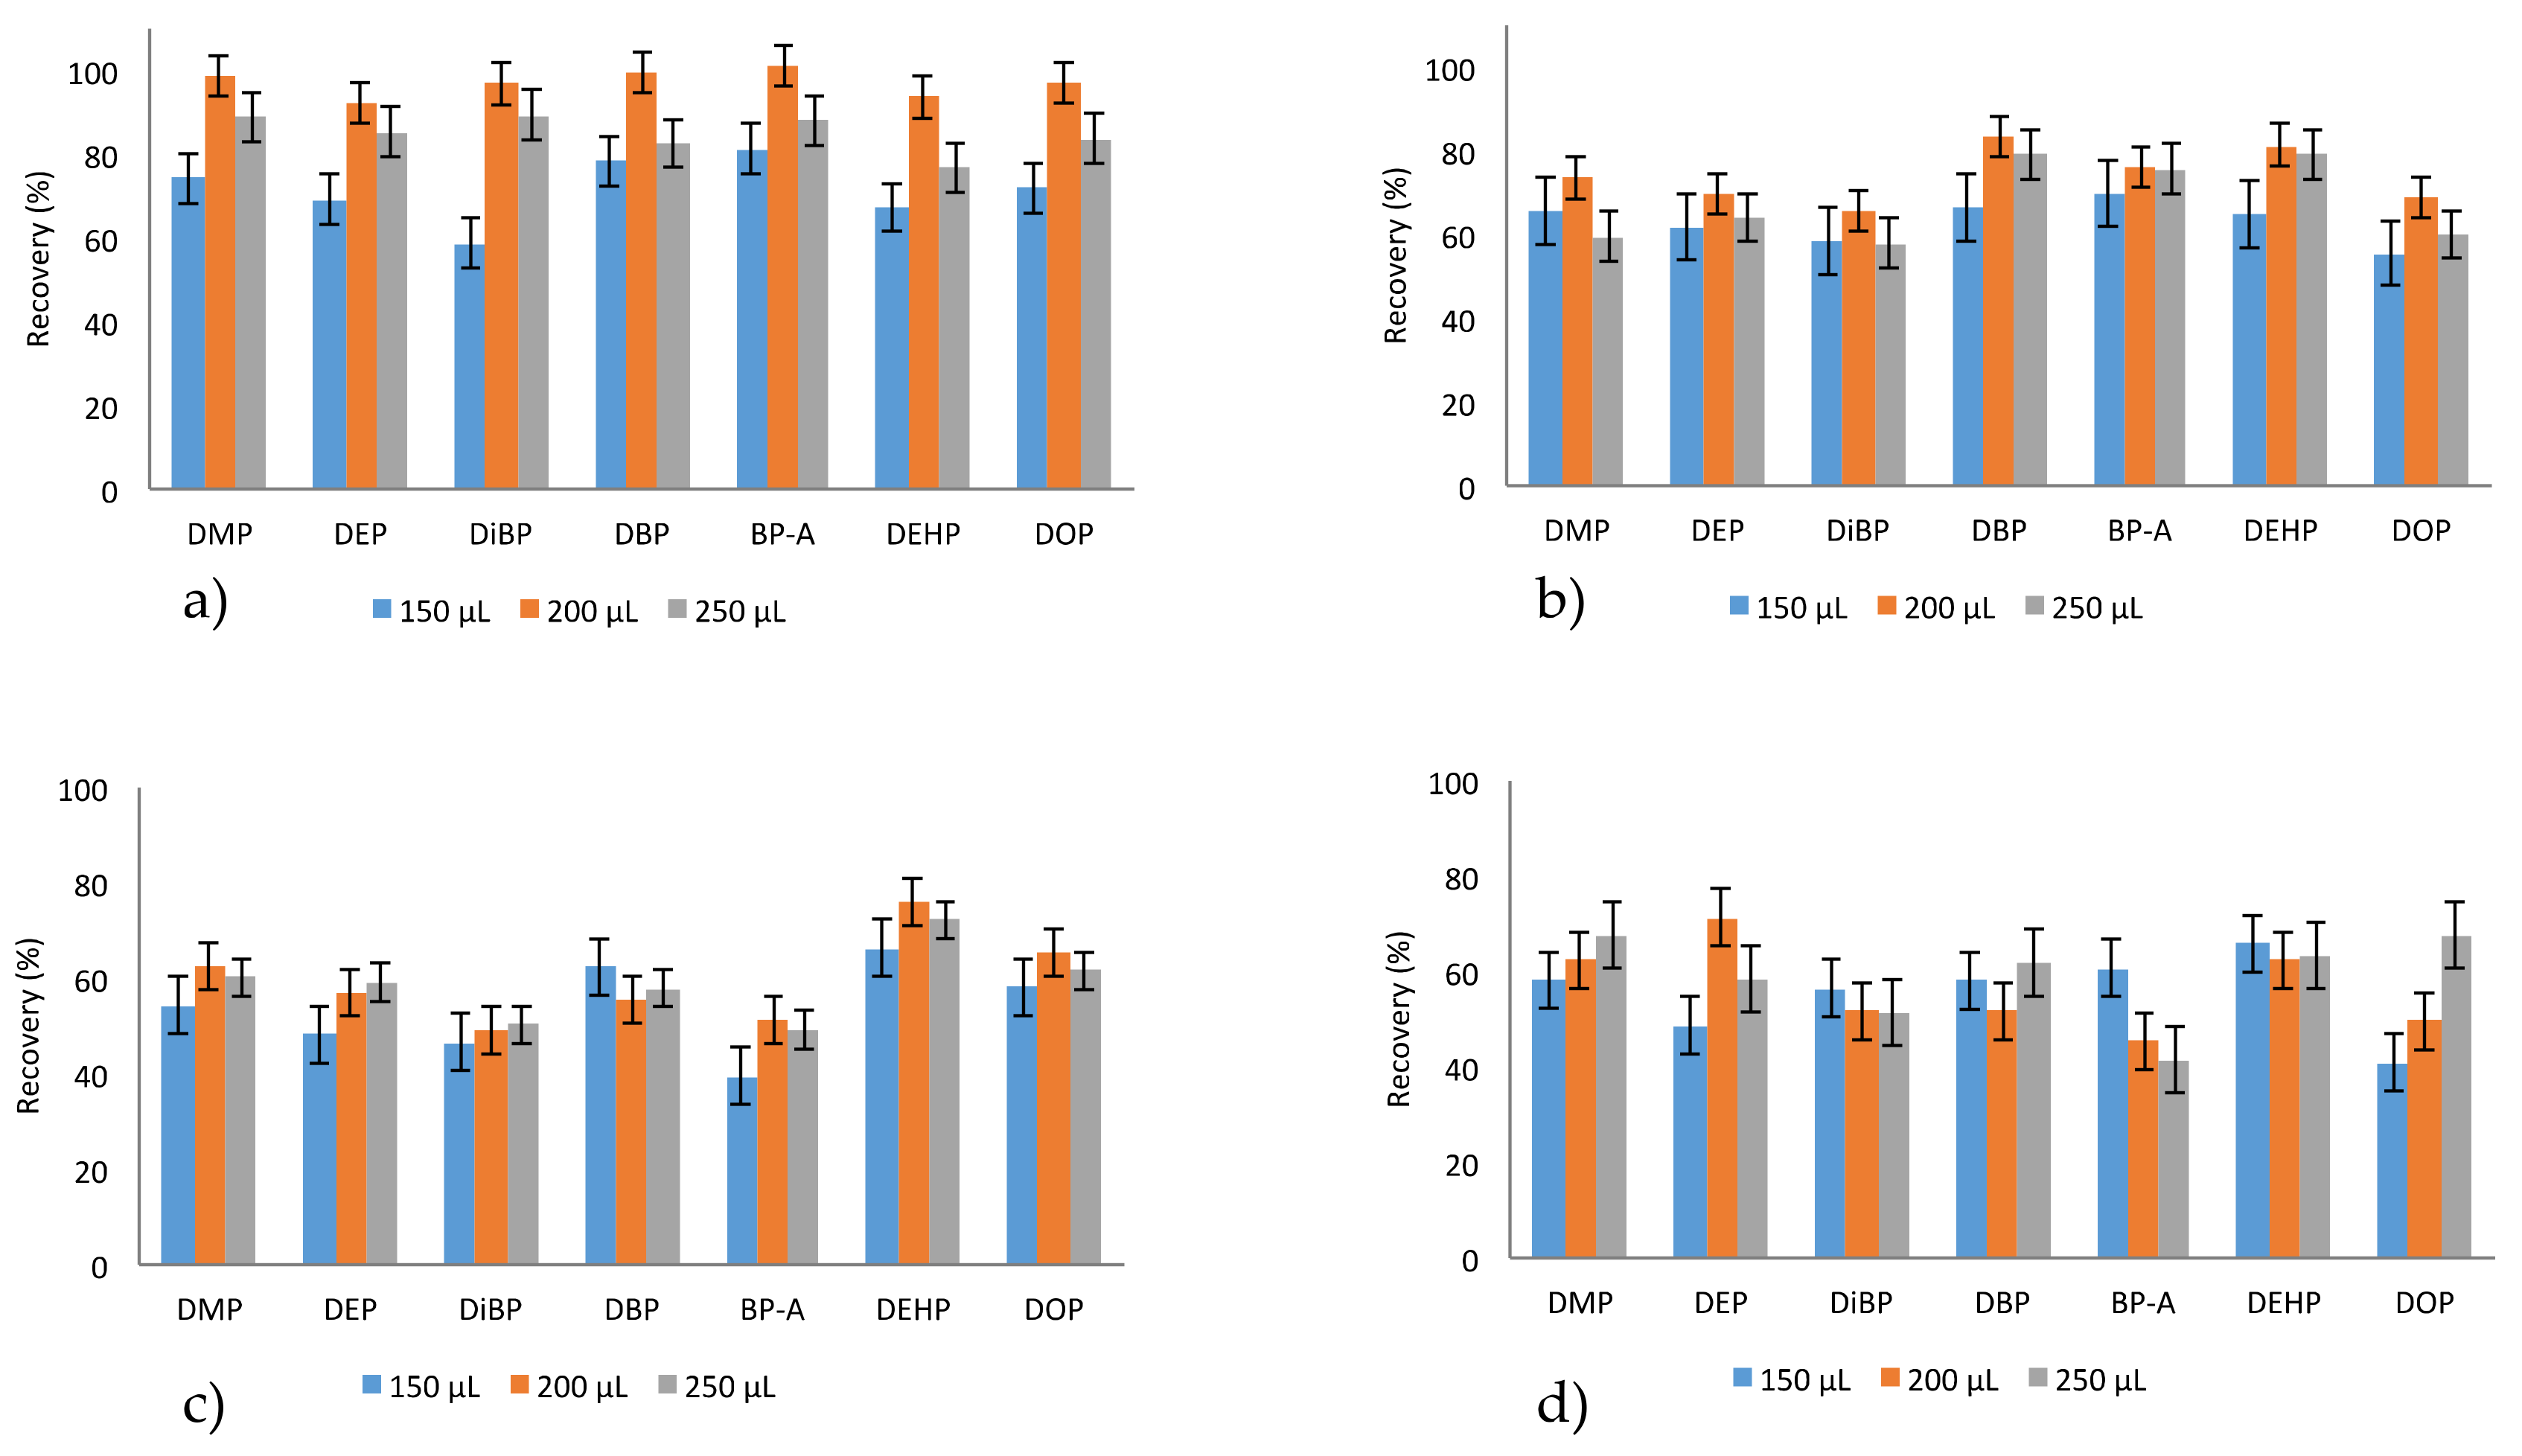
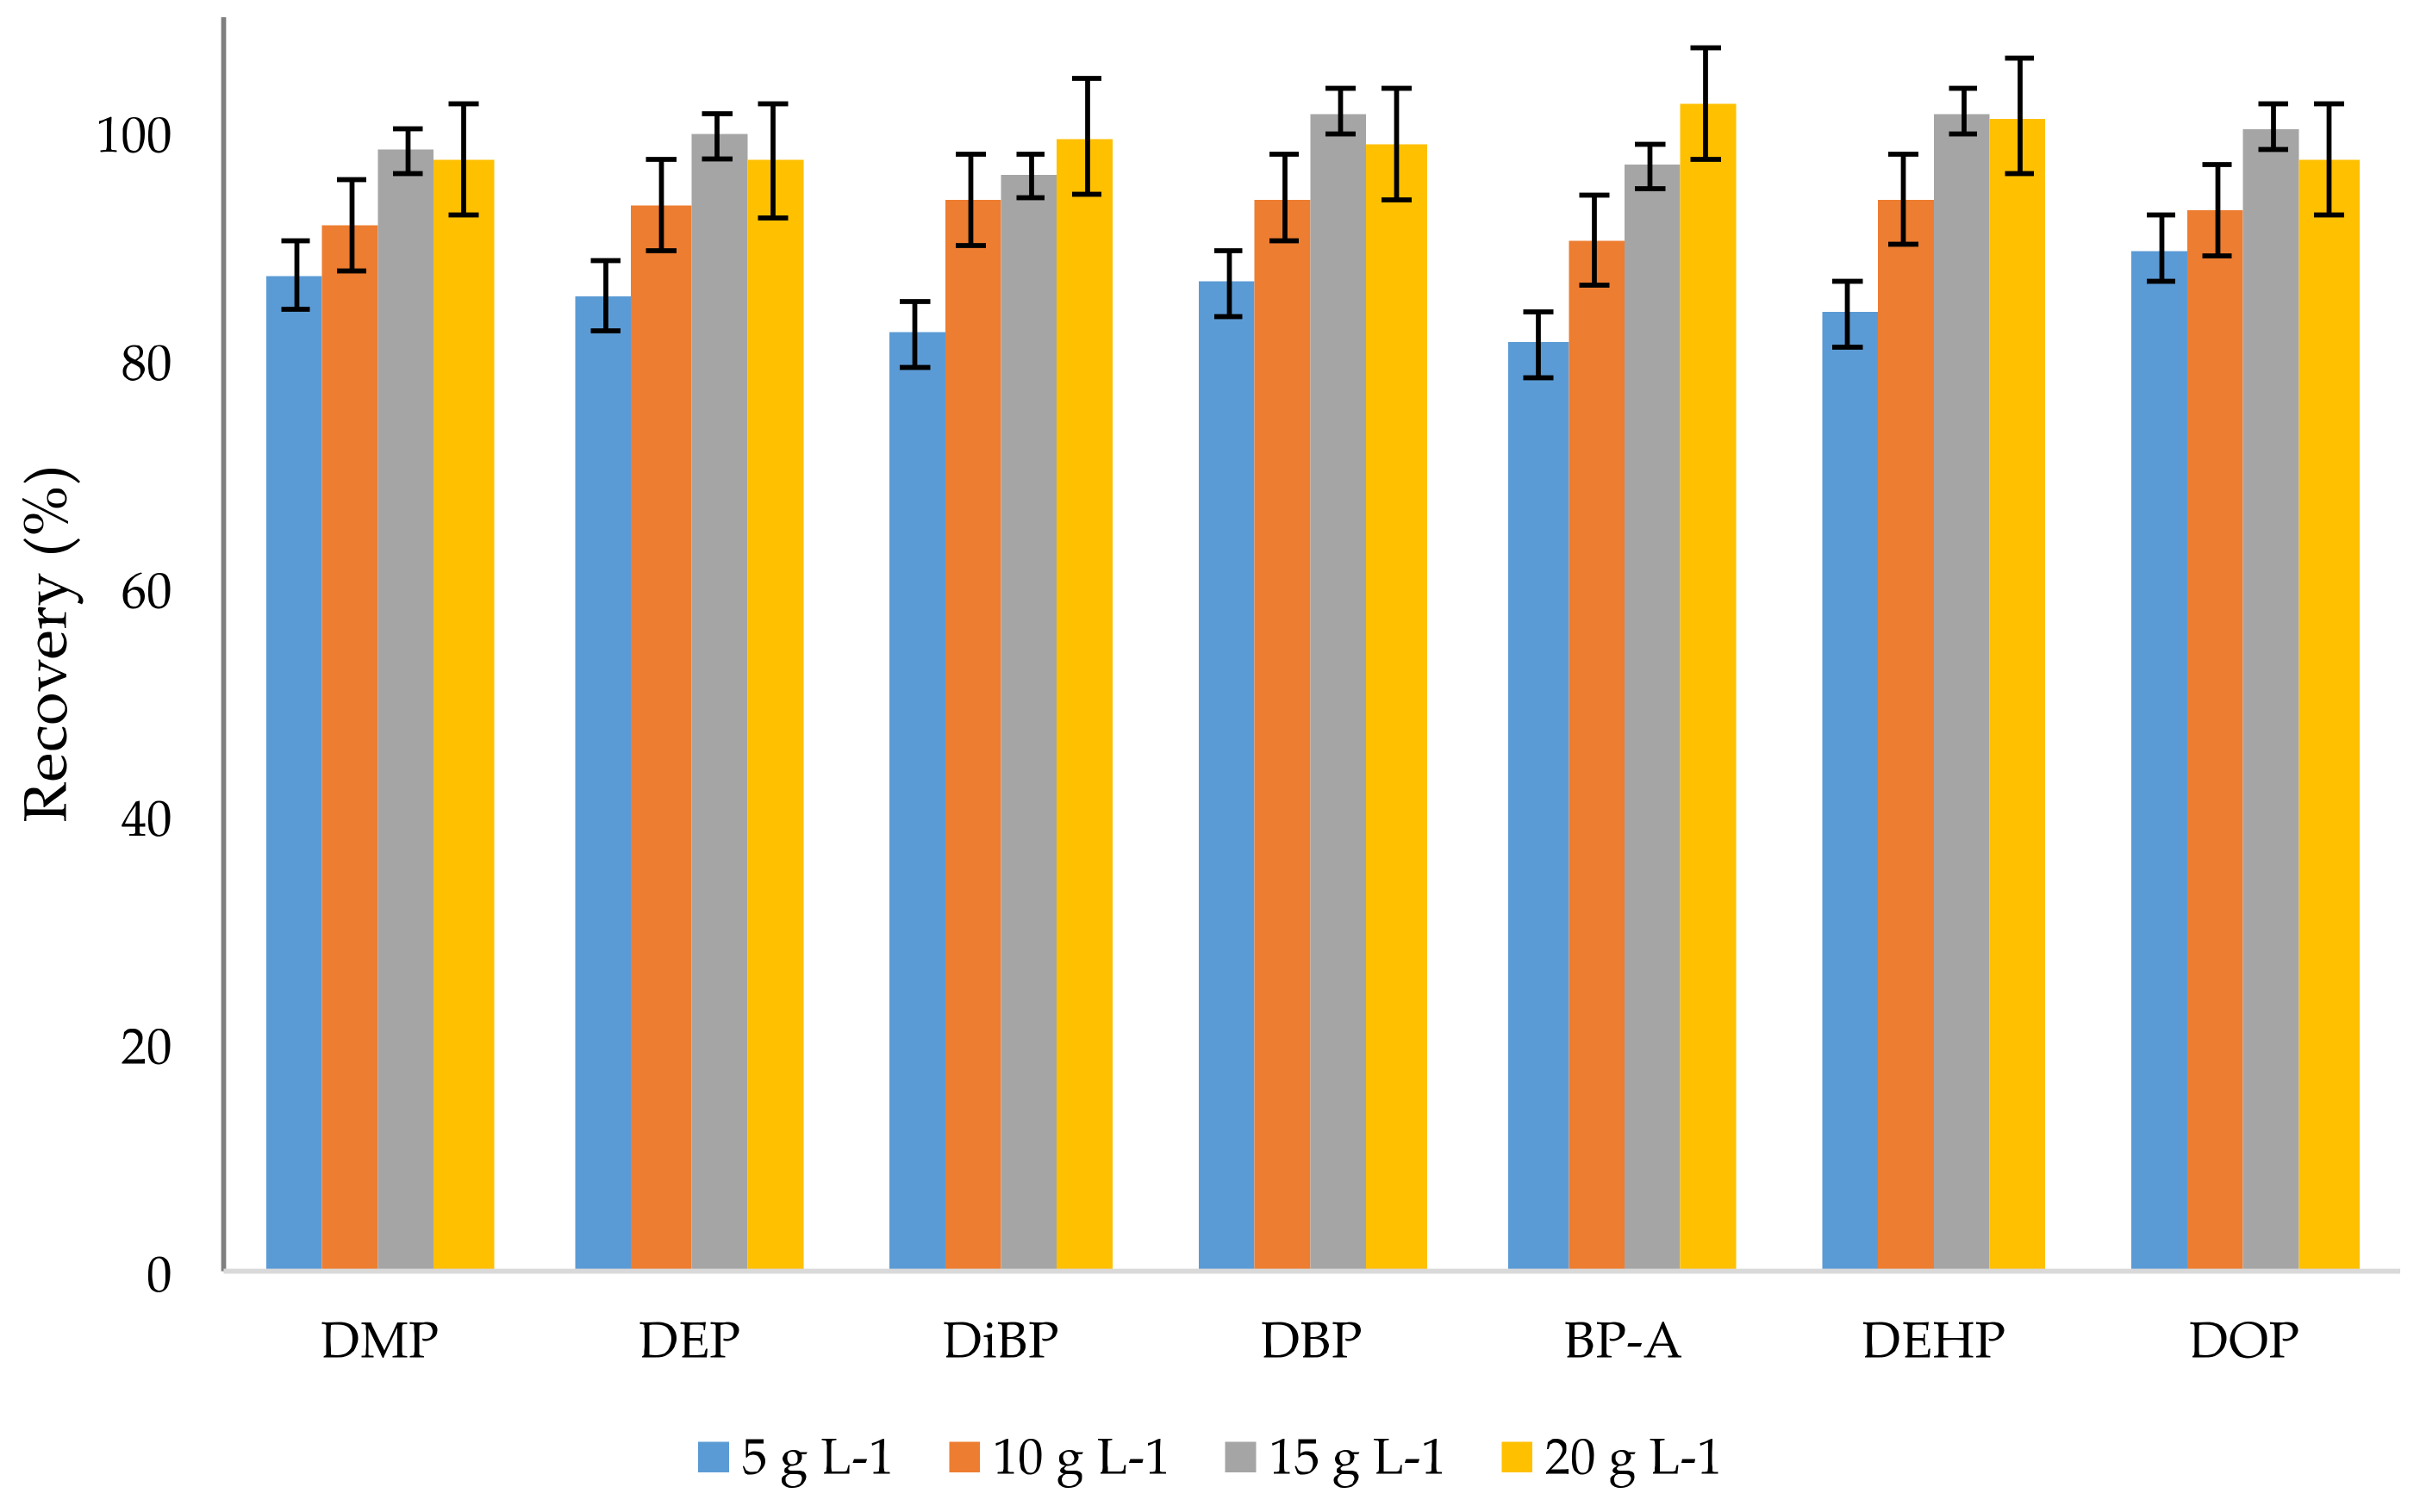
3.1. Evaluation of the Extraction Process

First, the best pH was studied, varying between 4 and 9. Solutions of HCl and NaOH 1 M, 0.1 M, and 0.01 M were used to lower or to raise the pH value, respectively. The percent recoveries obtained at pH 4 and those obtained at pH 5 were analytically significant; therefore, we can state that at acid pH the extraction of the analytes took place quantitatively. However, the authors noted that the percentage of errors increased at lower values of pH. Therefore, the experiments were carried out at pH 5. Figure 2 shows the recoveries, together with the relative error bars in the pH range between 4 and 7.
It should be noted that Figure 2 does not report recoveries above pH 7 because they are very low with respect to this pH value. The reason should be due to the I.S. ionization [64,65,66] and thus, the Areaanalyte/AreaIS ratio is completely altered. The methodology examined in this paper is based on the dispersion of the extraction solvent in the solution. In this way, micro-droplets are formed containing the extraction solvent and the solution becomes opalescent; the greater the opalescence, the greater the dispersion, but at the same time the contact surface between the solvent and the analyte is smaller. In this way, a stable dispersion is obtained and, very importantly, it does not change for the whole analytical procedure. In the experiments, the authors deeply investigated the analytical conditions, in particular the choice of the extraction solvent and the relative volume to be used. Four different solvents were tested (i.e., n-hexane, n-heptane, iso-octane and benzene) at three different volumes (150 μL, 200 μL, 250 μL). The choice of the extraction solvents was based on their density, which had to be lower than that of water; thus, they could be directly recovered on the solution using the Hamilton syringe. Solvent volumes were studied based on two considerations. Volumes lower than 150 μL do not allow to recover any extraction solvent because the solvent layer shows a real small thickness; on the other hand, a large drop is formed using extraction solvent volumes greater than 250 μL (a bad condition for microextraction). Using an extraction solvent volume between 150 and 250 μL, the volume recovered at the top of the solution is between 90 and 160 μL. Figure 3 shows the recoveries obtained using the four solvents together with the relative standard deviation (RSD) reported as error bars for each measurement. The best recoveries are obtained by 200 μL of n-hexane.
Subsequently, two further important parameters for improving the extraction procedure, such as the stirring time and the ultrasonic bath duration, were studied. Mixing times ranging between 5 and 25 min were studied, whereas experiments were performed with different ultrasound times of between 6 and 30 min to obtain the best analytical conditions. In fact, different tests were performed by varying both parameters (individually or simultaneously), but no significant increase in analyte recoveries was achieved. Consequently, the authors decided to perform 5 min of stirring time and 6 min of ultrasonic bath; these conditions were sufficient to obtain a reliable dispersion and a quantitative PAEs/BPA recovery.
The other fundamental step concerns the breaking of the emulsion, where a salt addition is essential. Actually, the best method is to centrifuge the solution and obtain the separation of the two phases; starting from 1 L, this procedure was difficult. The key already tested in previous papers [67,68] consisted of changing the solution polarity by salt addition. This event modified the ionic strength of the solution and supported the separation between the polar phase and the apolar phase. At the same time, the time required for separation decreased. The use of a stirring magnetic plate stressed and increased the result. For this purpose, it was necessary to choose a strongly dissociated salt. Among the different salts tested at different concentrations (i.e., NaCl, KCl, CH3COONa, NH4Cl), sodium chloride was chosen because it allowed the best recoveries. Figure 4 reports the PAE/BPA recoveries (in percentage) based on the different NaCl amounts added.
Looking at Figure 4, the major recoveries were obtained by adding 15 g L−1 NaCl, ranging between 98 and 102%. The additions of smaller NaCl amounts were not adequate to break up the dispersion and the analyte recoveries were not so good (<90% using 5 g L−1 and <95% using 10 g L−1), whereas higher NaCl amounts did not increase the analyte recoveries, which remained constant around the levels obtained using 15 g L−1 (between 97 and 102% using 20 g L−1).
After the formation of the two phases, the extraction solvent recovery was recovered using a special homemade laboratory glassware (Figure 5).
This particular lab glassware, sealed, was built in our laboratory, with the apolar solvent being collected in the thin-diameter glass tube, in particular a special fitting with sintered glass. The deionized water, which was added to the flask on the right side, was used to grow the solvent level in the tube to recover the extraction solvent, which was then injected directly into the GC-MS.
For a correct risk assessment of chemicals in each matrix, especially with respect to issues related to public health problems, it is necessary to have a satisfactory analytical procedure. One of the most important points is to examine the application of each procedure on a blank sample and on a real sample. In this case, the authors applied the entire procedure to a distilled water sample (“blank solution”) and to a tap water sample (“real sample”), both solutions being spiked with the mixed PAE/BPA standard solution (80 ng mL−1 of each compound) and reaching comparable recoveries in both cases. Table 1 shows the recoveries (as %) obtained by analyzing the two matrices; they range between 97.2 and 99.6% for the blank solution with a relative standard deviation (RSD) below 4.4 and between 95.1 and 98.8% for the real sample with an RSD below 8.7 (RSDs are reported in brackets). The good agreement between the two datasets shows that the matrix effect is to be considered negligible.

3.2. Analytical Protocol Parameters

The analytical parameters of each compound (i.e., the correlation curve and relative correlation coefficient r, the limit of detection (LOD), the limit of quantification (LOQ), reproducibility, and precision) were studied by applying the best experimental conditions to a real sample. Briefly, the optimal conditions are as follows: 200 μL of n-hexane, used as extraction solvent, and 5 µL of anthracene (1 mg mL−1) are added to 1 L water sample (pH solution 5), followed by 5 min stirring time and 6 min ultrasonic bath and addition of NaCl 15 g L−1, vortex for 10 min, and injection of 1 μL of the final solution. The analyte extraction procedure was performed using the dispersive liquid–liquid microextraction (DLLME) method. This step offers two advantages: the dispersive solvent, which substantially allows and simplifies the dispersion of the extraction solvent, is not used (replaced by the ultrasonic bath step) and, more importantly, an average pre-concentration factor of 5000.
Table 2 shows all the analytical parameters obtained using the best experimental conditions, namely, the linear equations and the relative correlation coefficients (r) studied in the linear dynamic ranges (LDRs) along with the limit of detection (LOD) and the limit of quantification (LOQ) of each compound. These values were determined according to Knoll’s definition [69], that is, an analyte concentration that produces a chromatographic peak is equal to three times (LOD) and seven times (LOQ) the standard deviation of the baseline noise (this definition is based on the signal-to-noise approach).
Table 3 shows the recoveries for each compound at different concentrations and the intra-day and inter-day precisions calculated by adding different PAE/BPA amounts to real water samples. The recoveries were determined at two different concentrations, namely, at low, 30 ng mL−1, and high, 300 ng mL−1, concentrations: in the first case, the recoveries vary between 93.4% (BPA) and 101.1% (DiBP), whereas in the second case they vary between 95.7% (DEP) and 104.5% (DEHP). The intra-day errors are between 3.6% and 7.4%, whereas the inter-day errors are less than 9.3%.
Figure 6 shows the gas chromatogram of mixing PAE/BPA standard solution at the concentration of 50 ng mL−1 of each compound, whereas Figure 7 shows the gas chromatograms of (a) drinking water sampled from plastic bottles and (b)the same sample spiked with the mixed PAE/BPA solution (50 ng mL−1 of each compound). As can be seen, the chromatograms are clear, which means that the extraction procedure is effective and that the peaks are sharp and well resolved.
For a complete analytical characterization, a comparison was carried out between our main results and those reported in the literature; in particular, recoveries, LODs and LOQs were compared between different studies performed in the last decade for the simultaneous analysis of PAEs and BPA in food/beverage matrices [51,52,53,71,72,73,74,75,76,77,78] (Table 4). As can be seen, the main basic PAEs analyzed in most papers are DEP, DBP, and DEHP together with BPA, whereas only a few papers show a more complete PAE speciation. According to the analytical parameters, our recoveries are acceptable compared to the other studies; in addition, the LODs and LOQs are adequate for determining such compounds in the water matrix, although Dévier et al. [52] achieved very low LODs and LOQs. It should be noted that very good LODs and LOQs were achieved by Gosetti et al. [75]; PAEs and bisphenols (A and S) were simultaneously analyzed at very low levels (0.8–15.5 and 2.3–46.9 ng L−1, with good recoveries ranging between 95% and 109%). These parameters are better than those obtained by the authors; it should be noted however that they were reached using a different methodology (SPE) and, essentially, by ultra-high performance liquid chromatography–tandem mass spectrometry (UHPLC-MS/MS), a very expensive instrumentation. Furthermore, the matrix is different from that investigated in this study. A similar consideration could be drawn by other authors. Finally, it should be noted that the paper by Gorji et al. [77] shows interesting LODs and LOQs, but that the paper is focused only on the determination of five PAEs (with no BPA).

3.3. Real Sample Application

Finally, the water contained in 15 containers for different uses was analyzed. In particular, we examined six bottles of water with a volume of between 1 and 2 L, all in polyethylene terephthalate, but with different consistency and color; three baby bottles, two of which were in low-density polyethylene and one in polyethylene; and, finally, six sport bottles, five of which were made of polyethylene and one of low-density polyethylene.
The determination of the water bottles was carried out using all the available volume, whereas for the bottles and sport bottles the volume was increased to 1 L with ultra-pure water. After measuring the blank, release tests were performed for the bottles after a week, fifteen days, a month, and two months. For the feeding bottles and sport bottles, the study was concentrated in a few hours, because the use of these containers was limited in time; the analyses were carried out each hour during a total period of six hours. Only in two of the fifteen samples did the release of phthalates from the vessel appear relevant; in particular, the releases of DiBP and DBP from a sport bottle (Figure 8a) and of DEHP and DOP from a bottle (Figure 8b) were found. Regarding BPA, it should be noted that it was not found in any sample. The three baby bottles and the two sport bottles carried the label “BPA-free” and this justifies why it was not found. The six bottles did not show any information as the other sport bottles used for the analysis, so it is difficult to extrapolate considerations on the reasons for the lack of BPA determination.

4. Conclusions

The importance of a simultaneous determination of PAEs and BPA in different matrices (alimentary, environmental, biological fluids, etc.) is still an important issue. A further proof of this importance is that only 30 papers have been published since 2015, whereas more than 1000 papers deal with PAE determination in the same period (source: Scopus) and more than 2000 papers deal with BPA determination. Among the different methods investigated for this simultaneous determination, no official approach has been established, while many authors have developed different procedures. The protocol proposed in this study manages to analyze PAEs and BPA simultaneously in beverages contaminated by the release of such compounds from plastic bottles. The protocol does not require toxic solvents (except a small amount of hexane) and also saves the operator and the environment. At the same time, obtaining a pre-concentration factor of 5,5000 allows these compounds to be detected at very low levels in such matrices. To this end, the authors applied the entire procedure to 15 water samples after a long contact with the plastic and identified the presence of DiBP, DBP, DEHP, and DOP at a concentration below 1.2 ng mL−1 in two water samples.

Author Contributions

Conceptualization, P.A.; methodology, P.A.; software, I.N. and B.B.; validation, I.N. and M.V.; formal analysis, I.N. and C.P.; investigation, I.N.; resources, P.A.; data curation, I.N.; writing—original draft preparation, P.A. and I.N.; writing—review and editing, P.A. and C.P.; visualization, B.B.; supervision, P.A.; funding acquisition, P.A. and M.V.

Funding

This research received no external funding.

Acknowledgments

The authors would like to thank Drs. Marilisa Trevisonne and Giuseppe Ianiri for their help in the experimental activity and useful comments in the manuscript elaboration.

Conflicts of Interest

The authors declare no conflict of interest.

References

  1. Dilkes-Hoffman, L.S.; Pratt, S.; Laycock, B.; Ashworth, P.; Lant, P.A. Public attitudes towards plastics. Resour. Conserv. Recycl. 2019, 147, 227–235. [Google Scholar] [CrossRef]
  2. Bauer, A.; Jesús, F.; Gómez Ramos, M.J.; Lozano, A.; Fernández-Alba, A.R. Identification of unexpected chemical contaminants in baby food coming from plastic packaging migration by high resolution accurate mass spectrometry. Food Chem. 2019, 295, 274–288. [Google Scholar] [CrossRef] [PubMed]
  3. García Ibarra, V.; de Quirós, A.; Paseiro Losada, P.; Sendón, R. Non-target analysis of intentionally and non intentionally added substances from plastic packaging materials and their migration into food simulants. Food Packag. Shelf Life 2019, 21, 100325. [Google Scholar] [CrossRef]
  4. Mohanty, A.K.; Vivekanandhan, S.; Pin, J.M.; Misra, M. Composites from renewable and sustainable resources: Challenges and innovations. Science 2018, 362, 536–542. [Google Scholar] [CrossRef] [PubMed] [Green Version]
  5. Groh, K.J.; Backhaus, T.; Carney-Almroth, B.; Geueke, B.; Inostroza, P.A.; Lennquist, A.; Leslie, H.A.; Maffini, M.; Slunge, D.; Trasande, L.; et al. Overview of known plastic packaging-associated chemicals and their hazards. Sci. Total Environ. 2019, 651, 3253–3268. [Google Scholar] [CrossRef] [PubMed]
  6. Luzi, F.; Torre, L.; Kenny, J.M.; Puglia, D. Bio-and fossil-based polymeric blends and nanocomposites for packaging: Structure-property relationship. Materials 2019, 12, 471. [Google Scholar] [CrossRef] [PubMed]
  7. Lorz, P.M.; Towae, F.K.; Enke, W.; Jäckh, R.; Bhargava, N.; Hillesheim, W. Phthalic Acid and Derivatives. In Ullmann’s Encyclopedia of Industrial Chemistry; Wiley-VCH: Weinheim, Germany, 2007. [Google Scholar] [CrossRef]
  8. Root, S.E.; Savagatrup, S.; Printz, A.D.; Rodriquez, D.; Lipomi, D.J. Mechanical properties of organic semiconductors for stretchable, highly flexible, and mechanically robust electronics. Chem. Rev. 2017, 117, 6467–6499. [Google Scholar] [CrossRef]
  9. Peters, E.N. Plastics, Information and Properties of Polymeric Materials. In Mechanical Engineers’ Handbook, 3rd ed.; Kutz, M., Ed.; Wiley: Hoboken, NJ, USA, 2005. [Google Scholar]
  10. Jamarani, R.; Erythropel, H.C.; Burkat, D.; Nicell, J.A.; Leask, R.L.; Maric, M. Rheology of green plasticizer/poly (vinyl chloride) blends via time-temperature superposition. Processes 2017, 5, 43. [Google Scholar] [CrossRef]
  11. Paluselli, V.; Galgani, F.; Sempéré, R. Phthalate release from plastic fragments and degradation in seawater. Environ. Sci. Technol. 2019, 53, 166–175. [Google Scholar] [CrossRef]
  12. Lili, M.; Wen, C.; Wentao, L.; Yufang, Z. The migration study in PVC food packaging film under microwave condition. In Proceedings of the 21st IAPRI World Conference Packaging, Zhuhai, China, 19–22 June 2018; pp. 744–750. [Google Scholar]
  13. Shu, H.; Jonsson, B.A.G.; Gennings, C.; Lindh, C.H.; Nanberg, E.; Borneagh, C.G. PVC flooring at home and uptake of phthalates in pregnant women. Indoor Air 2019, 29, 43–54. [Google Scholar] [CrossRef]
  14. Sopheak, N.; Sempere, R.; Delmont, A.; Paluselli, A.; Ouddane, B. Occurrence, fate, behavior and ecotoxicological state of phthalates in different environmental matrices. Environ. Sci. Technol. 2015, 49, 4019–4035. [Google Scholar]
  15. Savoca, D.; Arculeo, M.; Barreca, S.; Buscemi, S.; Caracappa, S.; Gentile, A.; Persichetti, M.F.; Pace, A. Chasing phthalates in tissues of marine turtles from the Mediterranean sea. Mar. Pollut. Bull. 2018, 127, 165–169. [Google Scholar] [CrossRef] [PubMed]
  16. Mikula, P.; Svobodovaá, Z.; Smutnaá, M. Phthalates: Toxicology and Food Safety—A Review. Czech J. Food Sci. 2005, 23, 217–223. [Google Scholar] [CrossRef]
  17. De Toni, L.; Tisato, F.; Seraglia, R.; Roverso, M.; Gandin, V.; Marzano, C.; Padrini, R.; Foresta, C. Phthalates and heavy metals as endocrine disruptors in food: A study on pre-packed coffee products. Toxicol. Rep. 2017, 4, 234–239. [Google Scholar] [CrossRef] [PubMed]
  18. EFSA (European Food Safety Authority); Gundert-Remy, U.; Bodin, J.; Bosetti, C.; FitzGerald, R.E.; Hanberg, A.; Hass, U.; Hooijmans, C.; Rooney, A.A.; Rousselle, C.; et al. Bisphenol A (BPA) Hazard Assessment Protocol; EFSA Supporting Publication: Parma, Italy, 2017. [CrossRef]
  19. Hauser, R.; Calafat, A.M. Phthalates and human health. Occup. Environ. Med. 2005, 62, 806–818. [Google Scholar] [CrossRef] [PubMed]
  20. Schettler, T. Human exposure to phthalates via consumer products. Int. J. Androl. 2006, 29, 134–139. [Google Scholar] [CrossRef]
  21. Latini, G. Monitoring phthalate exposure in humans. Clin. Chim. Acta 2005, 361, 20–29. [Google Scholar] [CrossRef]
  22. Shea, K.M. Pediatric exposure and potential toxicity of phthalate plasticizers. Pediatrics 2003, 111, 1467–1474. [Google Scholar] [CrossRef]
  23. Krais, A.M.; Andersen, C.; Eriksson, A.C.; Johnsson, E.; Nielsen, J.; Pagels, J.; Gudmundsson, A.; Lindh, C.H.; Wierzbicka, A. Excretion of urinary metabolites of the phthalate esters DEP and DEHP in 16 volunteers after inhalation and dermal exposure. Int. J. Environ. Res. Public Health 2018, 15, 2514. [Google Scholar] [CrossRef]
  24. Zeng, D.; Kang, Y.; Chen, J.; Li, A.; Chen, W.; Li, Z.; He, L.; Zhang, Q.; Luo, J.; Zeng, L. Dermal bioaccessibility of plasticizers in indoor dust and clothing. Sci. Total Environ. 2019, 672, 798–805. [Google Scholar] [CrossRef]
  25. Schmid, P.; Schlatter, C. Excretion and metabolism of di (2-ethylhexyl) phthalate in man. Xenobiotica 1985, 15, 251–256. [Google Scholar] [CrossRef] [PubMed]
  26. David, R.M. Exposure to phthalate esters. Environ. Health Perspect. 2000, 108, A440. [Google Scholar] [CrossRef] [PubMed]
  27. Xu, D.P.; Li, S.; Chen, Y.H.; Li, H.B.; Li, A.N.; Xu, X.R. Phthalates: Toxicity, occurrence and analytical methods. Int. J. Mod. Biol. Med. 2013, 4, 12–29. [Google Scholar]
  28. Nepalia, A.; Singh, A.; Mathur, N.; Kamath, R.; Pareek, S. Assessment of mutagenicity caused by popular baby foods and baby plastic-ware products: An imperative study using microbial bioassays and migration analysis. Ecotoxicol. Environ. Saf. 2018, 162, 391–399. [Google Scholar] [CrossRef] [PubMed]
  29. Chang, W.H.; Lee, C.C.; Yen, Y.H.; Chen, H.L. Oxidative damage in patients with benign prostatic hyperplasia and prostate cancer co-exposed to phthalates and to trace elements. Environ. Int. 2018, 121, 1179–1184. [Google Scholar] [CrossRef] [PubMed]
  30. Corton, J.C.; Cunningham, M.L.; Hummer, B.T.; Lau, C.; Meek, B.; Peters, J.M.; Popp, J.A.; Rhomberg, L.; Seed, J.; Klaunig, J.E. Mode of action framework analysis for receptor-mediated toxicity: The peroxisome proliferator-activated receptor alpha (PPARα) as a case study. Crit. Rev. Toxicol. 2014, 44, 1–49. [Google Scholar] [CrossRef] [PubMed]
  31. EFSA; Silano, V.; Baviera, J.M.B.; Bolognesi, C.; Bruüschweiler, B.J.; Chesson, A.; Cocconcelli, P.S.; Crebelli, R.; Gott, D.M.; Grobar, K.; et al. Draft Update of the Risk Assessment of di-Butylphthalate (DBP), Butyl-Benzyl-Phthalate (BBP), Bis (2-ethylhexyl) Phthalate (DEHP), Di-Isononylphthalate (DINP) and Di-Isodecylphthalate (DIDP) for Use in Food Contact Materials. Available online: https://www.efsa.europa.eu/sites/default/files/consultation/consultation/Phthalates_in_plastic_FCM_draft_opinion_for_public_consultation.pdf (accessed on 15 May 2019).
  32. Sarigiannis, D.A.; Karakitsios, S.P.; Handakas, E.; Simou, K.; Solomou, E.; Gotti, A. Integrated exposure and risk characterization of bisphenol-A in Europe. Food Chem. Toxicol. 2016, 98, 134–147. [Google Scholar] [CrossRef]
  33. Corrales, J.; Kristofco, L.A.; Steele, W.B.; Yates, B.S.; Breed, C.S.; Williams, E.S.; Brooks, B.W. Global assessment of Bisphenol A in the environment. Review and analysis of its occurrence and bioaccumulation. Dose Response 2015, 13, 1559325815598308. [Google Scholar] [CrossRef]
  34. Paut, J.; Desphande, S. Acute toxicity of bisphenol A to rats. Indian J. Exp. Biol. 2012, 50, 425–429. [Google Scholar]
  35. Vogel, S. The Politics of plastics: The making and unmaking of bisphenol a “safety”. Am. J. Public Health 2009, 99, S559–S566. [Google Scholar] [CrossRef]
  36. Markey, C.; Coombds, M.; Sonnenschein, C.; Soto, A. Mammalian development in a changing environment: Exposure to endocrine disruptors reveals the developmental plasticity of steroid-hormone target organs. Evol. Dev. 2003, 5, 1–9. [Google Scholar] [CrossRef]
  37. Vandenberg, L.; Chahoud, I.; Heindel, J.; Padmanabhan, V.P.F.; Schoenfelder, G. Urinary, circulating, and tissue biomonitoring studies indicate widespreadexposure to bisphenol A. Cienc. Saude Colet. 2012, 17, 407–434. [Google Scholar] [CrossRef]
  38. Richter, C.; Birnbaum, L.; Farabollini, F.; Newbold, R.; Rubin, B.; Talsness, C.; Saal, F. In vivo effects of bisphenol A in laboratory rodent studies. Reprod. Toxicol. 2007, 24, 199–224. [Google Scholar] [CrossRef] [PubMed] [Green Version]
  39. Ryan, K.K.; Haller, A.M.; Sorrell, J.E.; Woods, S.C.; Jandacek, R.J.; Seeley, R.J. Perinatal exposure to bisphenol-A and the development of metabolic syndrome in CD-1 mice. Endocrinology 2010, 151, 2603–2612. [Google Scholar] [CrossRef] [PubMed]
  40. Acevedo, N.; Davis, B.; Schaeberle, C.M.; Sonnenschein, C.; Soto, A.M. Perinatally administered bisphenol A as a potential mammary gland carcinogen in rats. Environ. Health Perspect. 2013, 121, 1040–1046. [Google Scholar] [CrossRef] [PubMed]
  41. Saal, F.; Nagel, S.; Coe, B.; Angle, B.; Taylor, J. The estrogenicendocrine disrupting chemical bisphenol A (BP-A) and obesity. Mol. Cell. Endocrinol. 2012, 354, 74–84. [Google Scholar] [CrossRef]
  42. Li, D.-K.; Miao, M.; Zhou, Z.J.; Wu, C.; Shi, H.; Liu, X.; Wang, S.; Yuan, W. Urine bisphenol-A level in relation to obesity and overweight in school-age children. PLoS ONE 2013, 8, e65399. [Google Scholar] [CrossRef] [PubMed]
  43. Coltro, L.; Pitta, J.B.; da Costa, P.A.; Favaro Perez, M.A.; de Araújo, V.A.; Rodrigues, R. Migration of conventional and new plasticizers from PVC films into food simulants: A comparative study. Food Control 2014, 44, 118–129. [Google Scholar] [CrossRef]
  44. Lambertini, F.; Catellani, D.; Vindigni, M.; Suman, M. Multiresidual LC-MS analysis of plasticizers used in PVC gaskets of lids and assessment of their migration into food sauces. J. Mass Spectrom. 2016, 51, 805–813. [Google Scholar] [CrossRef]
  45. Mercogliano, R.; Santonicola, S. Investigation on bisphenol A levels in human milk and dairy supply chain: A review. Food Chem. Toxicol. 2018, 114, 98–107. [Google Scholar] [CrossRef]
  46. Cortina-Puig, M.; Hurtado-Fernandez, E.; Lacorte, S. Plasticizers in drinking water and beverages. Curr. Anal. Chem. 2018, 14, 344–357. [Google Scholar] [CrossRef]
  47. Gallart-Ayala, H.; Núñez, O.; Lucci, P. Recent advances in LC-MS analysis of food-packaging contaminants. TrAC Trends Anal. Chem. 2013, 42, 186–204. [Google Scholar] [CrossRef]
  48. Kawamura, Y.; Tagai, C.; Maehara, T.; Yamada, T. Simultaneous determination method of additives in polyvinyl chloride. J. Food Hyg. Soc. Jpn. 1999, 40, 189–197. [Google Scholar] [CrossRef]
  49. Ozaki, A.; Yamaguchi, Y.; Okamoto, A.; Kawai, N. Determination of alkylphenols, bisphenol A, benzophenone and phthalates in containers of baby food, and migration into food simulants. J. Food Hyg. Soc. Jpn. 2002, 43, 260–266. [Google Scholar] [CrossRef]
  50. Mitani, K.; Narimatsu, S.; Izushi, F.; Kataoka, H. Simple and rapid analysis of endocrine disruptors in liquid medicines and intravenous injection solutions by automated in-tube solid-phase microextraction/high performance liquid chromatography. J. Pharmaceut. Biomed. 2003, 32, 469–478. [Google Scholar] [CrossRef]
  51. Khedr, A. Optimized extraction method for LC-MS determination of bisphenol A, melamine and di (2-ethylhexyl) phthalate in selected soft drinks, syringes, and milk powder. J. Chromatogr. B 2013, 930, 98–103. [Google Scholar] [CrossRef] [PubMed]
  52. Dévier, M.H.; Le Menach, K.; Viglino, L.; Di Gioia, L.; Lachassagne, P.; Budzinski, H. Ultra-trace analysis of hormones, pharmaceutical substances, alkylphenols and phthalates in two French natural mineral waters. Sci. Total Environ. 2013, 443, 621–632. [Google Scholar] [CrossRef]
  53. Lo Turco, V.; Di Bella, G.; Potortiì, A.G.; Tropea, A.; Casale, E.K.; Fede, M.R.; Dugo, G. Determination of plasticisers and BPA in Sicilian and Calabrian nectar honeys by selected ion monitoring GC/MS. Food Addit. Contam. A 2016, 33, 1693–1699. [Google Scholar] [CrossRef]
  54. Myridakis, A.; Chalkiadaki, G.; Fotou, M.; Kogevinas, M.; Chatzi, L.; Stephanou, E.G. Exposure of preschool-age greek children (RHEA cohort) to bisphenol a, parabens, phthalates, and organophosphates. Environ. Sci. Technol. 2016, 50, 932–941. [Google Scholar] [CrossRef]
  55. Russo, M.V.; Notardonato, I.; Cinelli, G.; Avino, P. Evaluation of an analytical method for determining phthalate esters in wine samples by solid-phase extraction and gas chromatography coupled with ion-trap mass spectrometer detector. Anal. Bioanal. Chem. 2011, 402, 1373–1381. [Google Scholar] [CrossRef]
  56. Russo, M.V.; Avino, P.; Cinelli, G.; Notardonato, I. Sampling of organophosphorus pesticides at trace levels in the atmosphere using XAD-2 adsorbent and analysis by gas chromatography coupled with nitrogen-phosphorus and ion-trap mass spectrometry detectors. Anal. Bioanal. Chem. 2012, 404, 1517–1527. [Google Scholar] [CrossRef] [PubMed]
  57. Cinelli, G.; Avino, P.; Notardonato, I.; Centola, A.; Russo, M.V. Rapid analysis of six phthalate ester in wine by ultrasound-vortex-assisted dispersive liquid-liquid micro-extraction coupled with gas chromatography-flame ionization detector or gas chromatography-ion trap mass spectrometry. Anal. Chim. Acta 2013, 769, 72–78. [Google Scholar] [CrossRef] [PubMed]
  58. Cinelli, G.; Avino, P.; Notardonato, I.; Centola, A.; Russo, M.V. Study of XAD-2 adsorbent for the enrichment of trace levels of phthalate esters in hydroalcoholic food beverages and analysis by gas chromatography coupled with flame ionization and ion-trap mass spectrometry detectors. Food Chem. 2014, 146, 181–187. [Google Scholar] [CrossRef] [PubMed]
  59. Notardonato, I.; Avino, P.; Centola, A.; Cinelli, G.; Russo, M.V. Validation of a novel derivatization method for GC-ECD determination of acrylamide in food. Anal. Bioanal. Chem. 2013, 405, 6137–6141. [Google Scholar] [CrossRef] [PubMed]
  60. Notardonato, I.; Avino, P.; Cinelli, G.; Russo, M.V. Fast determination of phthalate ester residues in soft drinks and light alcoholic beverages by ultrasound/vortex assisted dispersive liquid-liquid microextraction followed by gas chromatography-ion trap mass spectrometry. RSC Adv. 2014, 4, 59655–59663. [Google Scholar]
  61. Russo, M.V.; Notardonato, I.; Avino, P.; Cinelli, G. Determination of phthalate esters at trace levels in light alcoholic drinks and soft drinks by XAD-2 adsorbent and gas chromatography coupled with ion trap-mass spectrometry detection. Anal. Methods 2014, 6, 7030–7037. [Google Scholar] [CrossRef]
  62. Russo, M.V.; Avino, P.; Perugini, L.; Notardonato, I. Extraction and GC-MS analysis of phthlate esters in food matrices: A review. RSC Adv. 2015, 5, 37023–37043. [Google Scholar] [CrossRef]
  63. Russo, M.V.; Avino, P.; Notardonato, I. Fast analysis of phthalates in freeze-dried baby foods by ultrasound-vortex-assisted liquid-liquid microextraction coupled with gas chromatography-ion trap/mass spectrometry. J. Chromatogr. A 2016, 1474, 1–7. [Google Scholar] [CrossRef]
  64. Sjöberg, P.J.R.; Markides, K.E. Capillary column supercritical fluid chromatography-atmospheric pressure ionisation mass spectrometry. Interface performance of atmospheric pressure chemical ionisation and electrospray ionization. J. Chromatogr. A 1999, 855, 317–327. [Google Scholar] [CrossRef]
  65. Lee, S.; Ryu, H.; Nam, K. Phenanthrene metabolites bound to soil organic matter by birnessite following partial biodegradation. Environ. Toxicol. Chem. 2009, 28, 946–952. [Google Scholar] [CrossRef]
  66. Chebbi, A.; Hentati, D.; Zaghden, H.; Baccar, N.; Rezgui, F.; Chalbi, M.; Sayadi, S.; Chamkha, M. Polycyclic aromatic hydrocarbon degradation and biosurfactant production by a newly isolated Pseudomonas sp. strain from used motor oil-contaminated soil. Int. Biodeterior. Biodegrad. 2017, 122, 128–140. [Google Scholar] [CrossRef]
  67. Russo, M.V.; Avino, P.; Perugini, L.; Notardonato, I. Fast analysis of nine PAHs in beer by ultrasound-vortex-assisted dispersive liquid-liquid micro-extraction coupled with gas chromatography-ion trap mass spectrometry. RSC Adv. 2016, 6, 13920–13927. [Google Scholar] [CrossRef]
  68. Avino, P.; Notardonato, I.; Perugini, L.; Russo, M.V. New protocol based on high-volume sampling followed by DLLME-GC-IT/MS for determining PAHs at ultra-trace levels in surface water samples. Microchem. J. 2017, 133, 251–257. [Google Scholar] [CrossRef]
  69. Knoll, J.K. Estimation of the limit of detection in chromatography. J. Chromatogr. Sci. 1985, 3, 422–425. [Google Scholar] [CrossRef]
  70. US Environmental Protection Agency. National Primary Drinking Water Regulations; Fed. Reg. Part 14, 40 CFR Part 141; USEPA: Washington, DC, USA, 1991; p. 395.
  71. Souza, R.R.; Martins, E.A.J.; Otomo, J.J.; Furusawa, H.A.; Pires, M.A.F. Determination of plasticizers in drinking water using gas chromatography and mass spectrometry. Quim. Nova 2012, 35, 1453–1458. [Google Scholar] [CrossRef]
  72. Gu, Y.Y.; Yu, X.J.; Peng, J.F.; Chen, S.B.; Zhong, Y.Y.; Yin, D.Q.; Hu, X.L. Simultaneous solid phase extraction coupled with liquid chromatography tandem mass spectrometry and gas chromatography tandem mass spectrometry for the highly sensitive determination of 15 endocrine disrupting chemicals in seafood. J. Chromatogr. B 2014, 965, 164–172. [Google Scholar] [CrossRef]
  73. Vidal, R.B.P.; Ibanñez, G.A.; Escandar, G.M. A green method for the quantification of plastics-derived endocrine disruptors in beverages by chemometrics- assisted liquid chromatography with simultaneous diode array and fluorescent detection. Talanta 2016, 159, 336–343. [Google Scholar] [CrossRef]
  74. Jiao, A.; Chen, H.W.; Zhang, S.L. A novel extraction-cleanup method for determination of trace PPCPs in water samples. Adv. Mater. Res. 2014, 1035, 173–179. [Google Scholar] [CrossRef]
  75. Gosetti, F.; Bolfi, B.; Robotti, E.; Manfredi, M.; Binotti, M.; Ferrero, F.; Bona, G.; Marengo, E. Study of endocrine disrupting compound release from different medical devices through an on-line SPE UHPLC-MS/MS method. Anal. Chim. Acta 2018, 1042, 141–154. [Google Scholar] [CrossRef]
  76. García-Córcoles, M.T.; Cipa, M.; Rodríguez-Gómez, R.; Rivas, A.; Olea-Serrano, F.; Vílchez, J.L.; Zafra-Gómez, A. Determination of bisphenols with estrogenic activity in plastic packaged baby food samples using solid-liquid extraction and clean-up with dispersive sorbents followed by gas chromatography tandem mass spectrometry analysis. Talanta 2018, 178, 441–448. [Google Scholar] [CrossRef]
  77. Gorji, S.; Biparva, P.; Bahram, M.; Nematzadeh, G. Development of magnetic solid phase microextraction method for determination of the endocrine disrupting chemicals leached from reused plastic bottles. Talanta 2019, 194, 859–869. [Google Scholar] [CrossRef] [PubMed]
  78. Tang, Z.; Han, Q.; Xie, L.; Chu, L.; Wang, Y.; Sun, Y.; Kang, X. Simultaneous determination of five phthalate esters and bisphenol A in milk by packed-nanofiber solid-phase extraction coupled with gas chromatography and mass spectrometry. J. Sep. Sci. 2019, 42, 851–861. [Google Scholar] [CrossRef] [PubMed]
Figure 1. Master scheme of the extraction process procedure.
Applsci 09 02945 g001
Figure 2. Percentage recoveries obtained at different pH extraction solutions. The relative standard deviations (RSDs) of each measurement are reported as error bars.
Applsci 09 02945 g002
Figure 3. Percentage recoveries obtained in relation to the volume and the solvent used: (a) n-hexane; (b) n-heptane; (c) iso-octane; and (d) benzene. The RSDs of each measurement are reported as error bars.
Applsci 09 02945 g003
Figure 4. Phthalate (or phthalates ester, PAE) and bisphenol A (BPA) recoveries obtained varying the NaCl amount added for breaking the dispersion. The RSDs of each measurement are reported as error bars.
Applsci 09 02945 g004
Figure 5. Close-up view of the extraction solvent recovery in a special homemade laboratory glassware.
Applsci 09 02945 g005
Figure 6. Gas chromatogram of mixed PAE/BPA standard (50 ng mL−1 of each compound). Peaks: 1, dimethyl phthalate (DMP); 2, diethyl phthalate (DEP); internal standard (IS); 3, diisobutyl phthalate (DiBP); 4, dibutyl phthalate (DBP); 5, BPA; 6, diethylhexyl phthalate (DEHP); 7, di-n-octyl-phthalate (DOP). For experimental conditions, see the text.
Applsci 09 02945 g006
Figure 7. Gas chromatograms of (a) a sample of drinking water without addition and (b) the same drinking water sample spiked with 50 ng mL−1 of PAEs and BPA. Peaks: 1, DMP; 2, DEP; I.S.; 3, DiBP; 4, DBP; 5, BPA; 6, DEHP; 7, DOP. For experimental conditions, see the text.
Applsci 09 02945 g007
Figure 8. Kinetics of release from (a) a sport bottle (DiBP and DBP) and (b) a bottle (DEHP and DOP).
Applsci 09 02945 g008
Table 1. Evaluation (in terms of % recoveries) of the entire analytical procedure on the matrix effect: comparison between a distilled water solution and a tap water sample (SD, standard deviation), both spiked with the same mixed PAE/BPA standard solution (80 ng mL−1 of each compound) (RSDs are reported in brackets).
CompoundBlank SolutionReal Sample
% ± SD (RSD)% ± SD (RSD)
DMP99.1 ± 2.1 (2.1)97.5 ± 3.5 (3.6)
DEP99.6 ± 1.6 (1.6)97.9 ± 5.9 (6.0)
DiBP98.5 ± 3.1 (3.1)98.8 ± 8.6 (8.7)
DBP99.1 ± 3.5 (3.5)98.4 ± 3.8 (3.9)
BPA97.2 ± 4.3 (4.4)95.1 ± 6.2 (6.5)
DEHP97.9 ± 2.6 (2.4)96.3 ± 5.2 (5.4)
DOP99.7 ± 1.7 (1.7)98.2 ± 4.1 (4.2)
Table 2. Linear dynamic range (LDR), linear equation, correlation coefficient (r), limit of detection (LOD), and limit of quantification (LOQ) of each compound investigated in this study.
CompoundLDR
(ng mL−1)
Correlation CurverLOD
(ng mL−1)
LOQ
(ng mL−1)
Limit
DMP6–1500y = 2.860x + 0.5160.9944165.0a
DEP11–1500y = 1.810x + 0.1300.99834110.55a
DiBP6–1500y = 1.984x + 0.2270.9933360.01b
DBP5–1500y = 2.493x + 0.2120.9981250.45a
BPA9–1500y = 2.102x + 0.2950.99615950c
DEHP9–1500y = 2.392x + 0.2580.9972198d
DOP14–1500y = 2.014x + 0.2530.9979814
a, threshold limit value (TLV) expressed as mg L−1 (US EPA, reference [70]); b, expressed as mg kg−1 day/b.w. (EFSA, ref. 31); c, as µg L−1 (from the U.S. Food and Drug Administration, FDA); d, as µg L−1 (from the World Health Organization, WHO).
Table 3. Recovery (%) at different PAE/BPA spiking and method repeatability/reproducibility investigated as intra-day and inter-day measurements (%).
CompoundRecoveryIntra-dayInter-day
30 ng mL−1300 ng mL−1(RSD, %)(RSD, %)
DMP96.598.34.27.9
DEP99.195.75.47.3
DiBP101.1103.75.78.2
DBP97.5101.24.56.1
BPA93.495.87.49.3
DEHP98.1104.53.65.1
DOP99.4102.64.16.7
Table 4. Analytical parameter comparison among different studies performed for simultaneous PAEs/BPA determination in food and beverage matrices.
CompoundsMatrixRecoveries (%)LODs/LOQs
(ng mL−1)
References
DEP, DBP, BPAdrinking water62–1057–29/23–44a[71]
DEHP, –BPAsoft drinks, milk powder83.0–102.513–21/46–66b[51]
DEP, DMP, DBP, BBP, –BPA, DEHP, DOPFrench mineral waters90–1100.1–1.6/10–30b[52]
DMP, DEP, DBP, –BPA, DEHPseafood57–1190.034/0.64/-c[72]
DEP, DBP, DEHP, BPAmineral water, juice, soft drinks, wine, beer, distilled beverages90–1000.04–0.38/-[73]
DMP, DEP, DEP, DBP, BPA, BBP, DEHP, DOPhoney81.2–119.85–303/3–270[53]
DEP, DBP, DEHP, BPAenvironmental water75.3–84.32.0–8.5/6.6–28.0[74]
BPA, BP-S, DBP, DEHP, DEPmedical devices95.7–1090.8–15.5/2.3–46.9b[75]
BPAF, BPA, BPB, BPS, BPPready-to-eat plastic packaged baby foods91–1060.1–1/0.5–4c[76]
DMP, DEP, DiBP, DBP, DEHPwater and liquid food from reused plastic bottles87.4–106.90.008–1/0.026–3.26[77]
DEP, DBP, BPA, BBP, DEHPfruit juice81.9–109.620–300/60–1100[78]
DMP, DEP, DiBP, DBP, BPA, DEHP, DOPmineral water, tap water93.4–104.51–8/6–14This study
a: expressed as μg mL−1; b: expressed as ng L−1; c: expressed as ng g−1.

