Article

Wind Resource Assessment on Puná Island

by
Yuri Merizalde
1,
Luis Hernández-Callejo
2,*,
Javier Gracia Bernal
3,
Enrique Telmo Martínez
4,
Oscar Duque-Perez
5,
Francisco Sánchez
4 and
Andrés Llombart Estpopiñán
4
1
Faculty of Chemical Engineering, University of Guayaquil, Ph.D. School of University of Valladolid (UVA), Clemente Ballen 2709 and Ismael Perez Pazmiño, Guayaquil 593, Ecuador
2
Department of Agricultural Engineering and Forestry, University of Valladolid (UVA), Campus Universitario Duques de Soria, 42004 Soria, Spain
3
Compañan Eólica de Tierras Altas S.A. (CETASA), Calle Diputación 1, Edificio Caja Rural, 42002 Soria, Spain
4
Department of Electrical Systems, Group Analysis and Optimization of Renewable Generation, Center for Energy Resources and Consumption Research (CIRCE), Avda. Ranillas 3D, 1ª Planta, 50018 Zaragoza, Spain
5
Department of Electrical Engineering, University of Valladolid (UVA), Escuela de Ingenierías Industriales, Paseo del Cauce 59, 47011 Valladolid, Spain
*
Author to whom correspondence should be addressed.
Appl. Sci. 2019, 9(14), 2923; https://doi.org/10.3390/app9142923
Submission received: 18 May 2019 / Revised: 16 July 2019 / Accepted: 17 July 2019 / Published: 22 July 2019
(This article belongs to the Section Energy Science and Technology)

Abstract

:
Puná Island, located in the Pacific Ocean off the southern coast of Ecuador, has a population of approximately 3344 inhabitants. However, not all inhabitants have access to electricity, which is largely supplied by diesel generators. Therefore, to identify a renewable, sustainable, environmentally friendly and low-cost alternative, a 40-m-high anemometer tower was installed for wind resource assessment and to determine the possibility of generating electricity from wind energy. Based on mathematical models for electricity generation from wind energy, data were analyzed using the software Windographer and WAsP, to determine a long-term wind speed of 4.8 m/s and a mean wind power density of 272 W/m2. By simulating the use of a 3.3-MW wind turbine, we demonstrated that as much as 800 kWh could be generated during the hours when the wind reaches its highest speed. In addition to demonstrating the technical feasibility of meeting the electricity demands of Puná Island through wind power, this study exemplifies a method that can be used for wind resource assessment in any location.

1. Introduction

Belonging to the Guayaquil canton, Guayas province, Ecuador, the rural parish of Puná is a group of more than 30 islands and islets with 35 human settlements, of which 22 are located on the largest island (919 km2), Puná Island. Located in the Gulf of Guayaquil, Puná Island is 3 km off the coast of the Posorja precinct, which is the mainland town closest to the island (see Figure 1). The Universal Transverse Mercator (UTM) coordinate is NS98 and its Joint Operations Graphics grid reference is SA17-11. The time zone of the island is Coordinated Universal Time (UTC)/Greenwich Mean Time (GMT)-5. The geographical coordinates of the points that define the location of the island in its entirety are outlined in Table 1 [1,2].
According to the latest census conducted in 2010, the island has a population of approximately 3344 inhabitants, divided into 22 human settlements or precincts. Only 50.78% of the population has completed primary education, and the illiteracy rate is 11.73%. Although part of the population of Puná Island has access to piped water, the island lacks basic services: drinking water (when necessary, drinking water is transported from the mainland to the island), sewage treatment, a sanitary landfill, a hospital, and access roads in satisfactory conditions. The local electricity company supplies electricity to 66% of the population through three generators with a total power of 2.2 MW, whereas 20% of the inhabitants have their own electric generator. Water pumps used in shrimp ponds are the predominant energy demand of the island, which is met using diesel generators (over 200 HP). Currently, approximately 80% of the population is engaged in activities related to shrimp farming, fishing, forestry, agriculture, and animal husbandry. Other economic activities include tourism, commerce, and construction. Despite the wealth generated from shrimp farming, the economic benefits are not invested in the island because the owners of the shrimp ponds are neither native to nor residents of the island. In addition, oil spills, exhaust gas emissions, garbage, plastic waste washed ashore, domestic sewage discharges, and shrimp farms cause pollution. This environment of unmet needs not only prevents economic growth but also causes migration, in the absence of the necessary conditions for development, thereby aggravating the island’s problems [4,5].
One of the primary factors for the development of towns and their economic growth is the availability of energy resources that supply the electricity necessary for society’s activities in the 21st century [6,7]. Therefore, the main objective of this study is to determine the wind energy potential to generate the electricity Puná Island requires for its sustainable development. Furthermore, this study aims to apply existing knowledge of wind resource assessment in a manner that may be replicated in any location. The remaining manuscript is organized as follows: the method, materials, and costs of this research are described in Section 2; and some theoretical foundations of electricity generation from wind energy are addressed in Section 3. The results from the data analysis using the software Windographer and WAsP are included in Section 4. The study ends with conclusions and recommendations in Section 5.

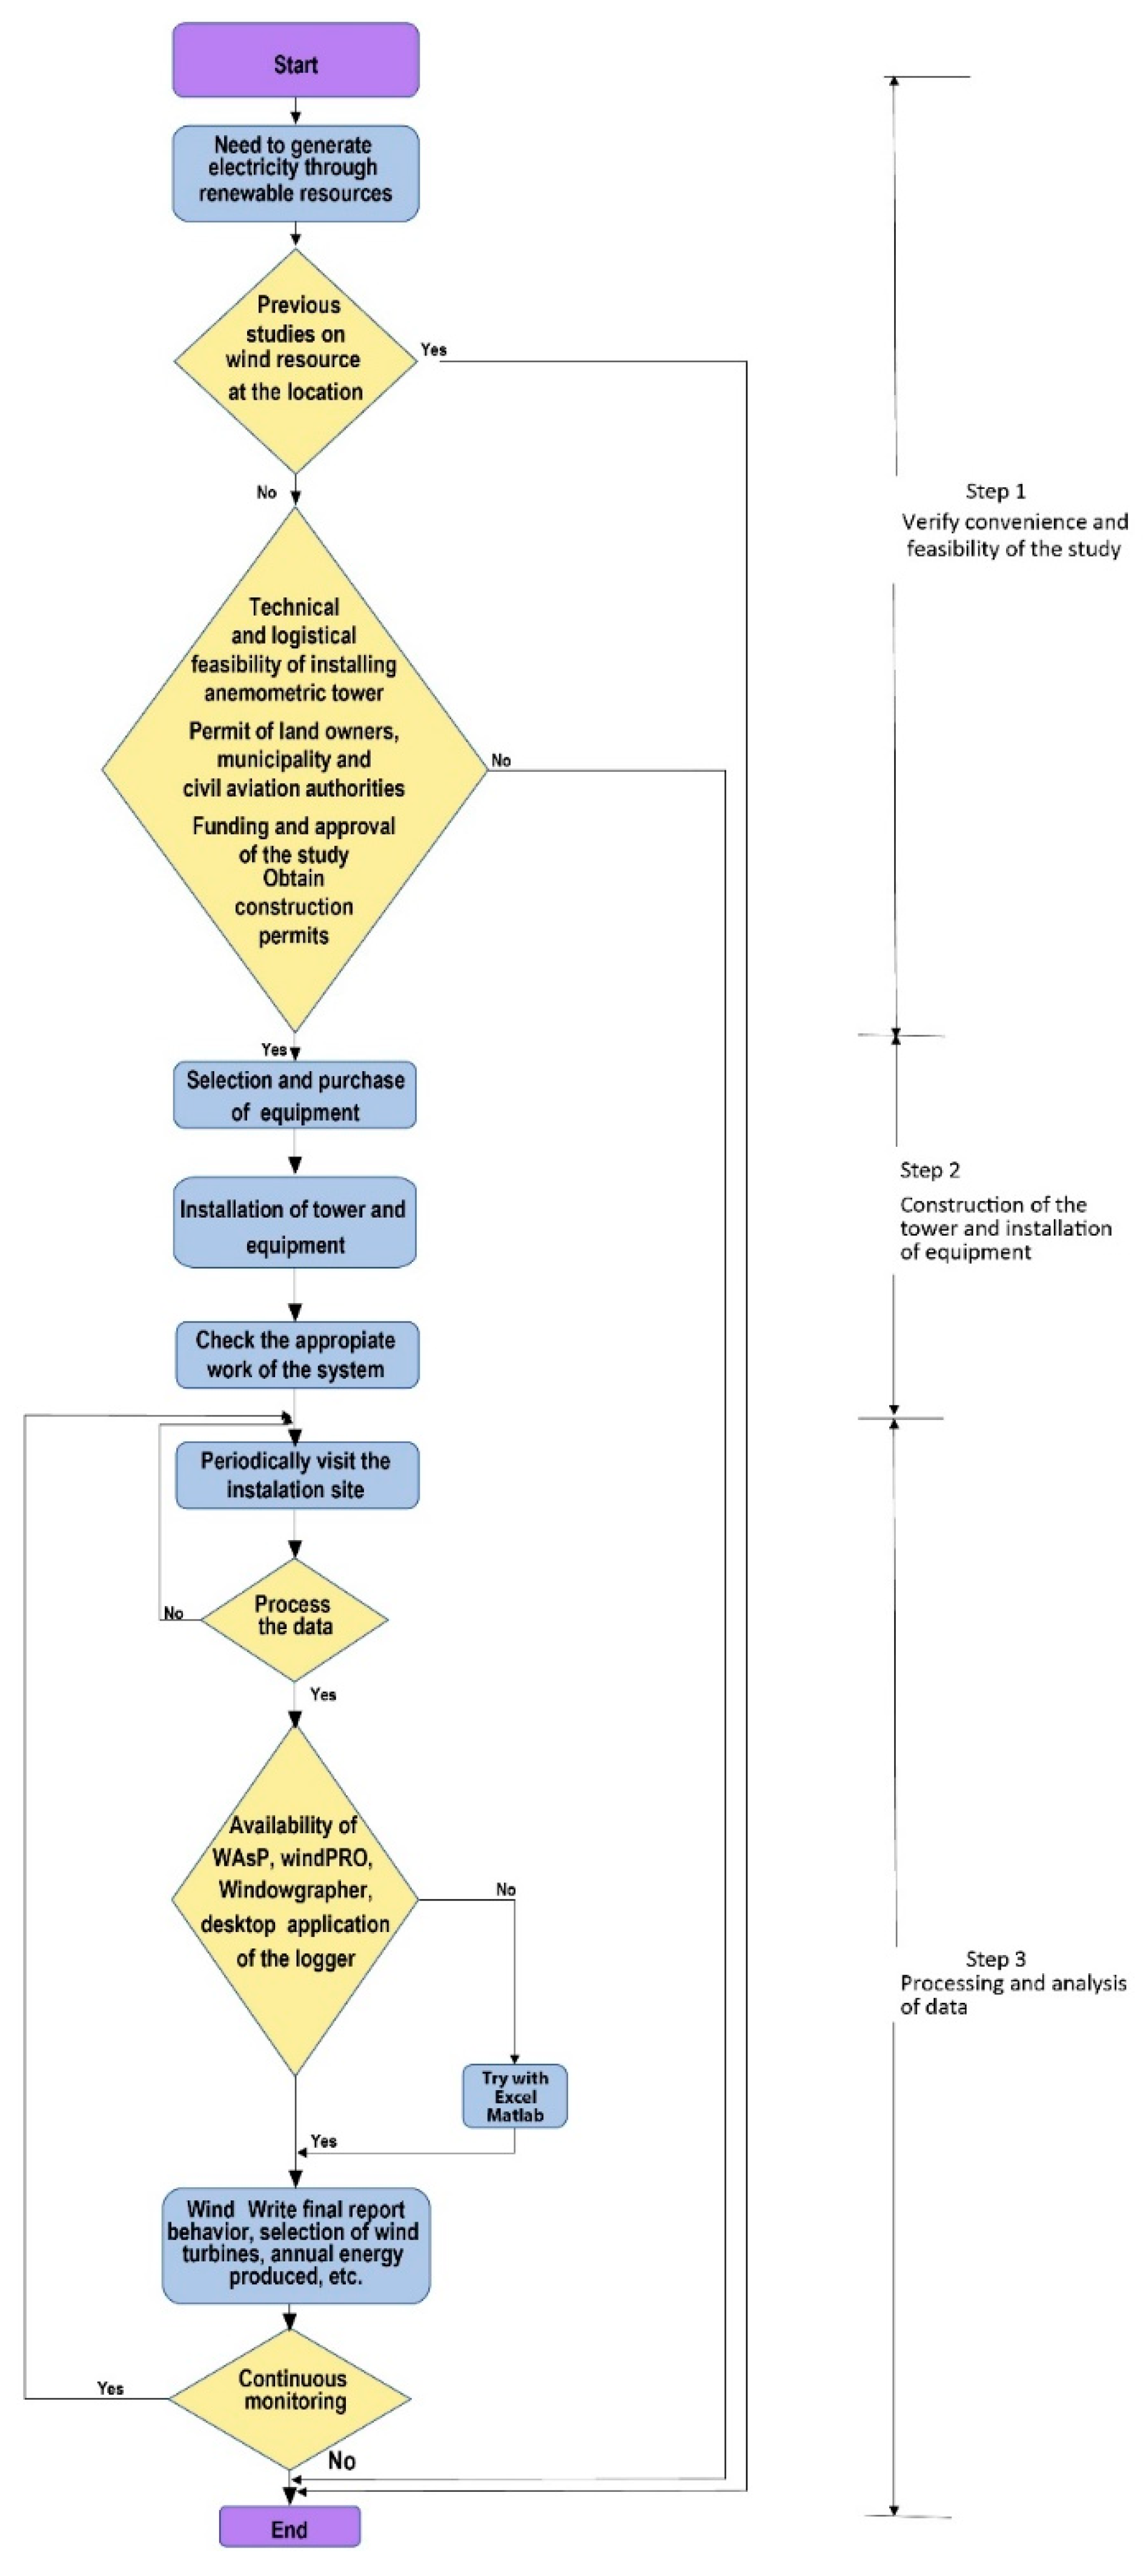
2. Materials and Methods

In general, based on the experience gained in this research project, the methodology and phases of wind resource assessment studies follow the flowchart of Figure 2, whereas the specific data processing method follows the flowchart presented in [8]. As electricity supply is essential for modern human activities and that wind energy is an increasingly developed alternative worldwide, wind resource assessment is crucial for testing the feasibility of this type of initiative in a specific location. For this purpose, the first step should be to determine whether wind resource assessment studies have already been performed at the site; otherwise, a study with a minimum duration of one year must be conducted.
Whether a study is performed depends on several factors. The economic factor may be the most important because it determines not only whether the study is feasible as well as its magnitude, i.e., its duration, number of anemometer towers to be installed, tower characteristics, and equipment availability [9]. Another key issue to consider is technical and legal feasibility, i.e., whether a site’s conditions make it possible to build and transport a tower, obtaining landowners’ permission to erect a tower and legal requirements for its installation, such as municipal and civil aviation permits.
After ensuring the availability of economic resources, important decisions are required regarding aspects, such as purchasing a prefabricated tower or constructing a tower from scratch. The former alternative is typically expensive, therefore leaving the option to design and build the tower from scratch. In both cases, experienced staff are required. Some system component (sensors and data loggers) options for wind resource assessment are available on the market. Their selection depends on technical characteristics, costs, availability, and warranties, among other factors. In addition to storing records on memory cards, data loggers can send data by email, as long as they have access to the Internet.
After installing the tower and initiating the devices, the data logger must be tested to assess whether the data from all installed instruments are recorded and whether the values recorded are within the expected range or abnormal, possibly due to equipment failure or installation problems. Frequent equipment failures are often due to improper wind vane installation or data logger programming or battery discharge. The following measures aim to avoid these setbacks: accurately programming the data logger before installing the device, installing a solar panel large enough to prevent battery discharge, and periodically visiting the tower site to test the conditions of the entire system. After a year of measurements or when a report must be submitted, the data are processed. Thus, depending on the objectives and availability of financial resources, different tools may be used to process information from the data loggers, ranging from desktop applications such as Excel or MATLAB, which are easily accessible programs, to software such as WAsP, Windographer, and windPRO.
For this study, an anemometer tower was installed at coordinates 2°43′58.06″ south by 80°11′56.97″ west (see Figure 3). On the tower, wind vanes were installed at 40 and 20 m, in addition to a thermometer, a barometer, and a relative humidity sensor. All instruments used, including the data logger, were purchased from NRG Systems [9]. All equipment and respective costs are outlined in Table 2, and the design of the tower is presented in Figure 4.
The project requires not only the approval and resources of the sponsoring entities but also the permission of the landowners of the tower site. After installing the equipment and activating the Internet, the data logger records the variables every 10 min and stores hourly means on its memory card. The data logger is configured to send data every day at 07h00 a.m. (Ecuador time) in an email with a report of the measurements from the previous day.
According to the standards, the studies on evaluation of wind resources should last a minimum of one year, however, due to the gap between the date of approval by the funding institution and the availability of resources necessary for the study, monitoring could only be performed for nine months. The data collected during this period were analyzed using the software Windographer to determine the following parameters: wind speed variation as a function of time of day and month, wind speed histogram, wind direction (compass rose), theoretical mean power a particular wind turbine model would deliver, and daily and annual energy production depending on the selected wind turbine model. The contour and wind resource maps were drawn using WAsP and Google Earth.

3. Fundamentals of Electricity Production from Wind

For thousands of years, wind has been an important resource from which humans have harnessed the necessary energy to perform various activities such as sailing, grain milling, water pumping, and electricity generation [10]. The energy that can be harnessed from wind is proportional to its speed, which is not affected by terrain conditions at high altitudes. However, in the lower layers of Earth’s atmosphere, wind varies as a function of surface friction or ground surface roughness (affected by vegetation cover and buildings, among other factors). In short, wind speed is proportional to the height above ground. As anemometer towers cannot always be erected at the height at which wind turbines operate, wind speed is extrapolated using functions such as Equation (1), known as the Hellman function or power-law profile and Equation (2), called logarithmic wind profile [11,12].
v v 1 = ( z z 1 ) α ,
v = v k ln z z 0 ,
where:
  • v = wind speed at height z;
  • v 1 = wind speed at height z 1 ; and
  • v = friction velocity;
  • k = the von Karmann constant;
  • z 0 = roughness length; and
  • α = friction or Hellman coefficient.
As the amount of available wind energy varies as a function of wind speed, which changes constantly, statistical models and probability distributions, such as Gaussian, Rayleigh, and Weibull distributions, are used to quantify the performance of this variable at a specific location over time. The Gaussian or normal distribution is the probability density function that best describes wind variations. This model is represented according to Equation (3), whereas the probability of a specific wind speed at a given interval is provided by Equation (4). In the wind industry, Rayleigh and Weibull are the most commonly used probability distributions [13]. The equations of these models and their respective cumulative distribution functions (probability of a wind speed lower than or equal to a specific value) are presented in Equations (5)–(8) [14,15].
p ( v ) = 1 σ v 2 π e x p [   ( v v ¯ ) 2 2 σ v 2 ] ,
p   ( v a v v b ) = v a v b p ( v ) d v ,
p ( v ) 1 = π 2 ( v v ¯ 2 ) e x p [   π 4 ( v v ¯ ´ ) 2 ] ,
F ( v ) 1 = 1   e x p [   π 4 ( v v ¯ ´ ) 2 ] ,
p ( v ) 2 = ( k c ) ( v c ) k 1 e x p [   ( v c ) k ] ,
F ( v ) 2 = 1   e x p [   ( v c ) k ] ,
where:
  • v = wind speed;
  • v ¯ = mean wind speed;
  • p(v) = probability density function of wind speed;
  • σ v = standard deviation of wind speed;
  • p ( v ) 1 = Rayleigh distribution;
  • F ( v ) 1 = cumulative distribution function;
  • p ( v ) 2 = Weibull distribution;
  • F ( v ) 2 = cumulative distribution function;
  • k = shape factor; and
  • c = scale factor.
The wind power per unit area or wind power density may be determined using Equation (9), whereas the hourly mean is calculated according to Equations (10) and (11). In practice, for increased reliability in predicting the production of wind power using wind turbines, the mean speed determined in our study was not used; instead, the value calculated by applying a correction factor was used. This correction factor is a percentage of the differences between the mean wind speed of our study and those provided by databases with wind speed records from several years [14,15,16]. In this research study, databases such as Modern-Era Retrospective analysis for Research and Applications, Version 2 (MERRA-2) and Climate Forecast System Reanalysis (CFSR2) were used for comparison purposes. The coincidence that exists between the magnitude of the wind speed obtained with the measurements made in this study and the values obtained from the aforementioned databases, in addition to validating the study, allows for more accurate projections.
P A = 1 2 ρ v 3 ,
P ¯ A = 1 2 ρ v ¯ 3 K e ,
K e = 1 N v ¯ 3 i = 1 N U i 3 ,
where:
  • P A = Power per unit area or wind power density (power that can be extracted from the wind by a wind turbine having the rotor swept area A).
  • P = power (watts);
  • ρ = air density (1.225 kg/m3);
  • v = wind speed (m/s);
  • P ¯ = mean wind power (watts);
  • v ¯ = annual mean wind speed (m/s);
  • K e = energy pattern factor;
  • N = 8760 hours in a year; and
  • U i = wind hours available.
For example, assuming that two hours of data were missing daily (it would have only 22 h of wind) and annual mean wind speed is 5 m/s, when replacing values in Equations (9) through (11), a wind power density of 272 watts per square meter is assessed. Conversely, the higher the wind speed and the larger the diameters of the wind turbine blades, the higher the harnessed amount of wind power.
K e = 1 ( 8760 ) ( 5 ) ¯ 3 i = 1 365 ( 22 ) 3 ,
K e = 3.55 ,
P ¯ A = 1 2 ρ V ¯ 3 K e ,
P ¯ A = 1 2 ( 1225 kg m 3 ) ( 5   m / s ) 3 ( 3.55 ) ,
P ¯ A = 272   watts / m 2 ,
The theoretical energy production of the selected turbines may be calculated using several methods, including [13,14]:
  • direct use of the mean data during an interval;
  • wind speed data binning (bins);
  • construction of a wind power curve using the data; and
  • statistical analysis.
Using the first method, the mean power assessed in a wind turbine of a specific power P w is given by Equation (12), whereas when using probability and statistical methods, the mean wind power is given by Equation (13). The wind power curve may be constructed using the available wind power and the rotor power coefficient Cp, according to Equations (14) and (15). By combining Equations (13) through (15), the mean power of a wind turbine is given by Equation (16), which may be expressed as a function of the cumulative distribution function, according to (18). Replacing Equation (8) in Equation (18) and solving the resulting equation, P ¯ may be calculated using the Weibull distribution, according to Equation (19) [14,15].
P ¯ = 1 N i = 1 N P w ( v ) ,
P ¯ = 0 P w ( v ) p ( v ) d v ,
P ( v ) = 1 2 ρ A C p η v 3 ,
C p = R o t o r   p o w e r W i n d   p o w e r = P r o t o r 1 2 ρ A v 3 ,
P ¯ = 1 2 ρ η π R 2 0 C p ( λ ) v 3 p ( v ) d v ,
λ   =   B l a d e   t i p   s p e e d W i n d   s p e e d =   Ω R v ,
P ¯ = 0 P w ( v ) d F ( v ) ,
P ¯ = j = 1 N B { exp [   (   v j     1 c ) k ] exp [   (   v j   c ) k ] P w ( v j 1 +   v j 2 ) ,
where:
  • P ( v ) = power calculated using the wind turbine power curve as a function of v;
  • p(v) = probability distribution of v;
  • C P = rotor power coefficient;
  • η = drive train efficiency;
  • λ = tip speed ratio;
  • Ω = angular speed (radians/sec); and
  • R = rotor radius.

4. Results

In wind resource assessment studies, wind variation is analyzed using frequency distributions of wind speed, wind direction (compass rose), wind speed as a function of height, and mean wind speed according to time of day [17]. Based on these and other variables, the appropriate wind turbine for a specific location is designed or selected while determining the optical location for the wind turbine and predicting the power or electricity that may be harnessed. In the following subsections, the records are processed to analyze the wind variation on Puná Island, especially at the anemometer tower site.

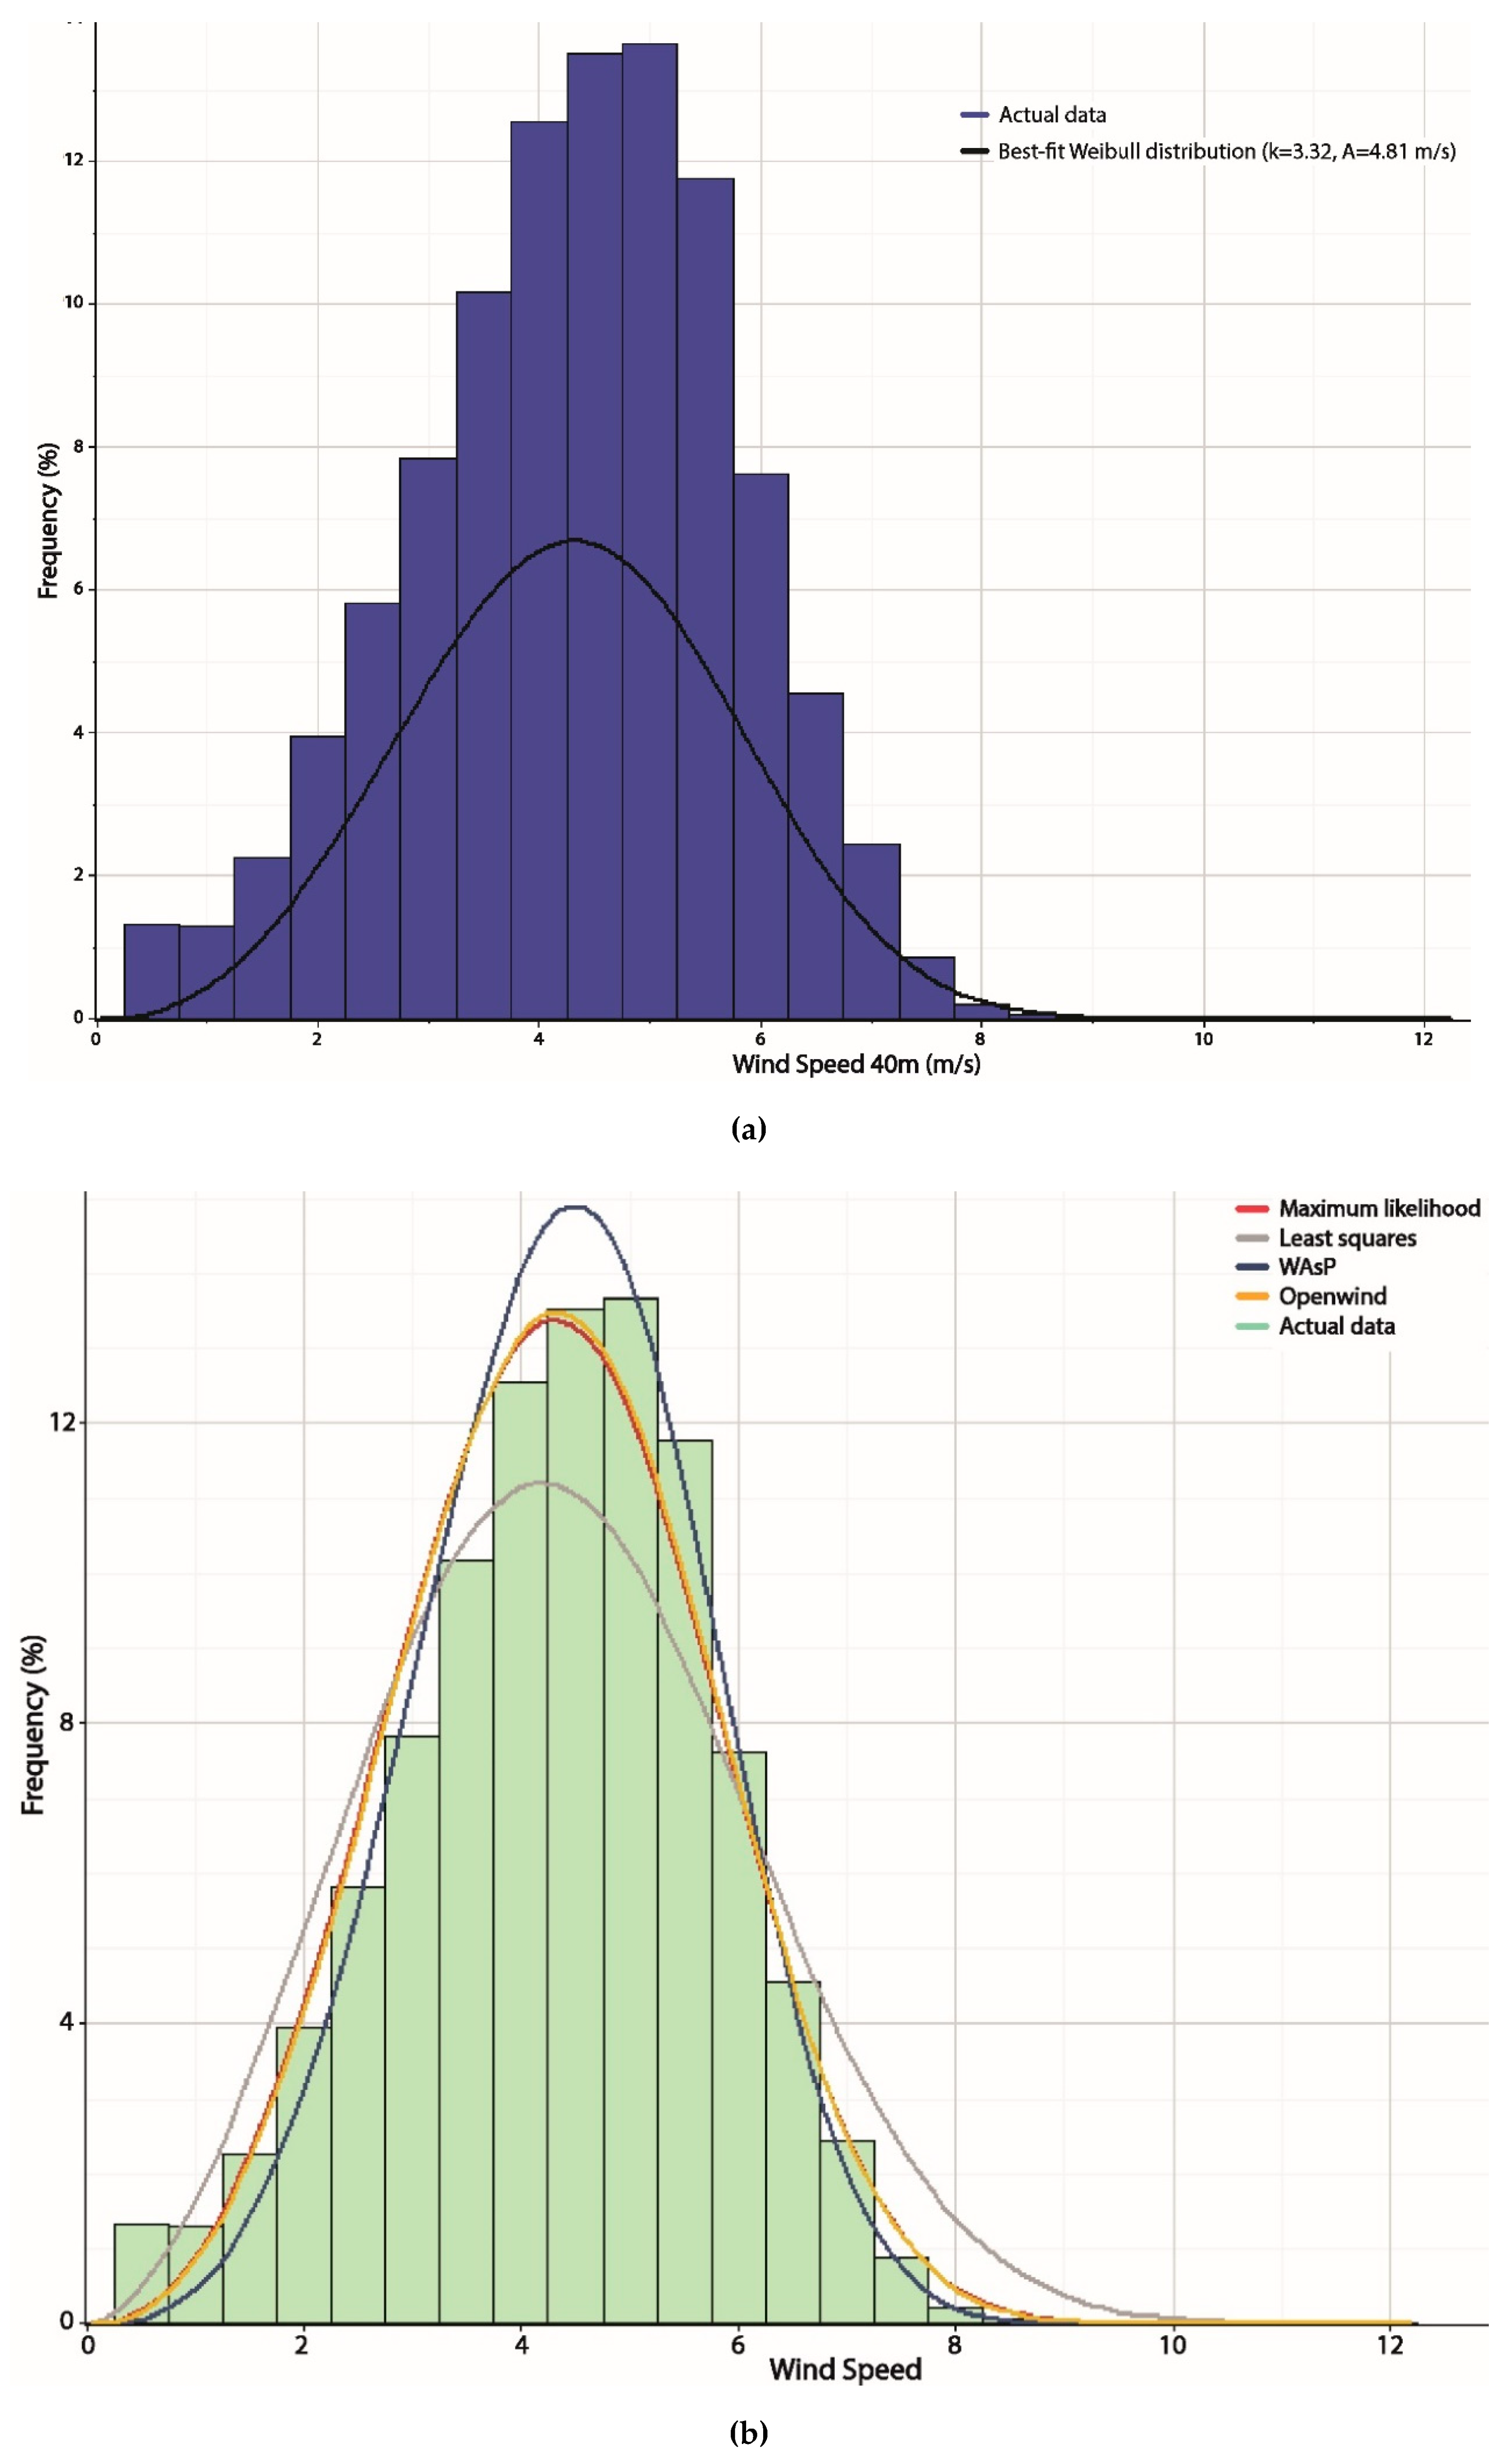
4.1. Frequency Distributions
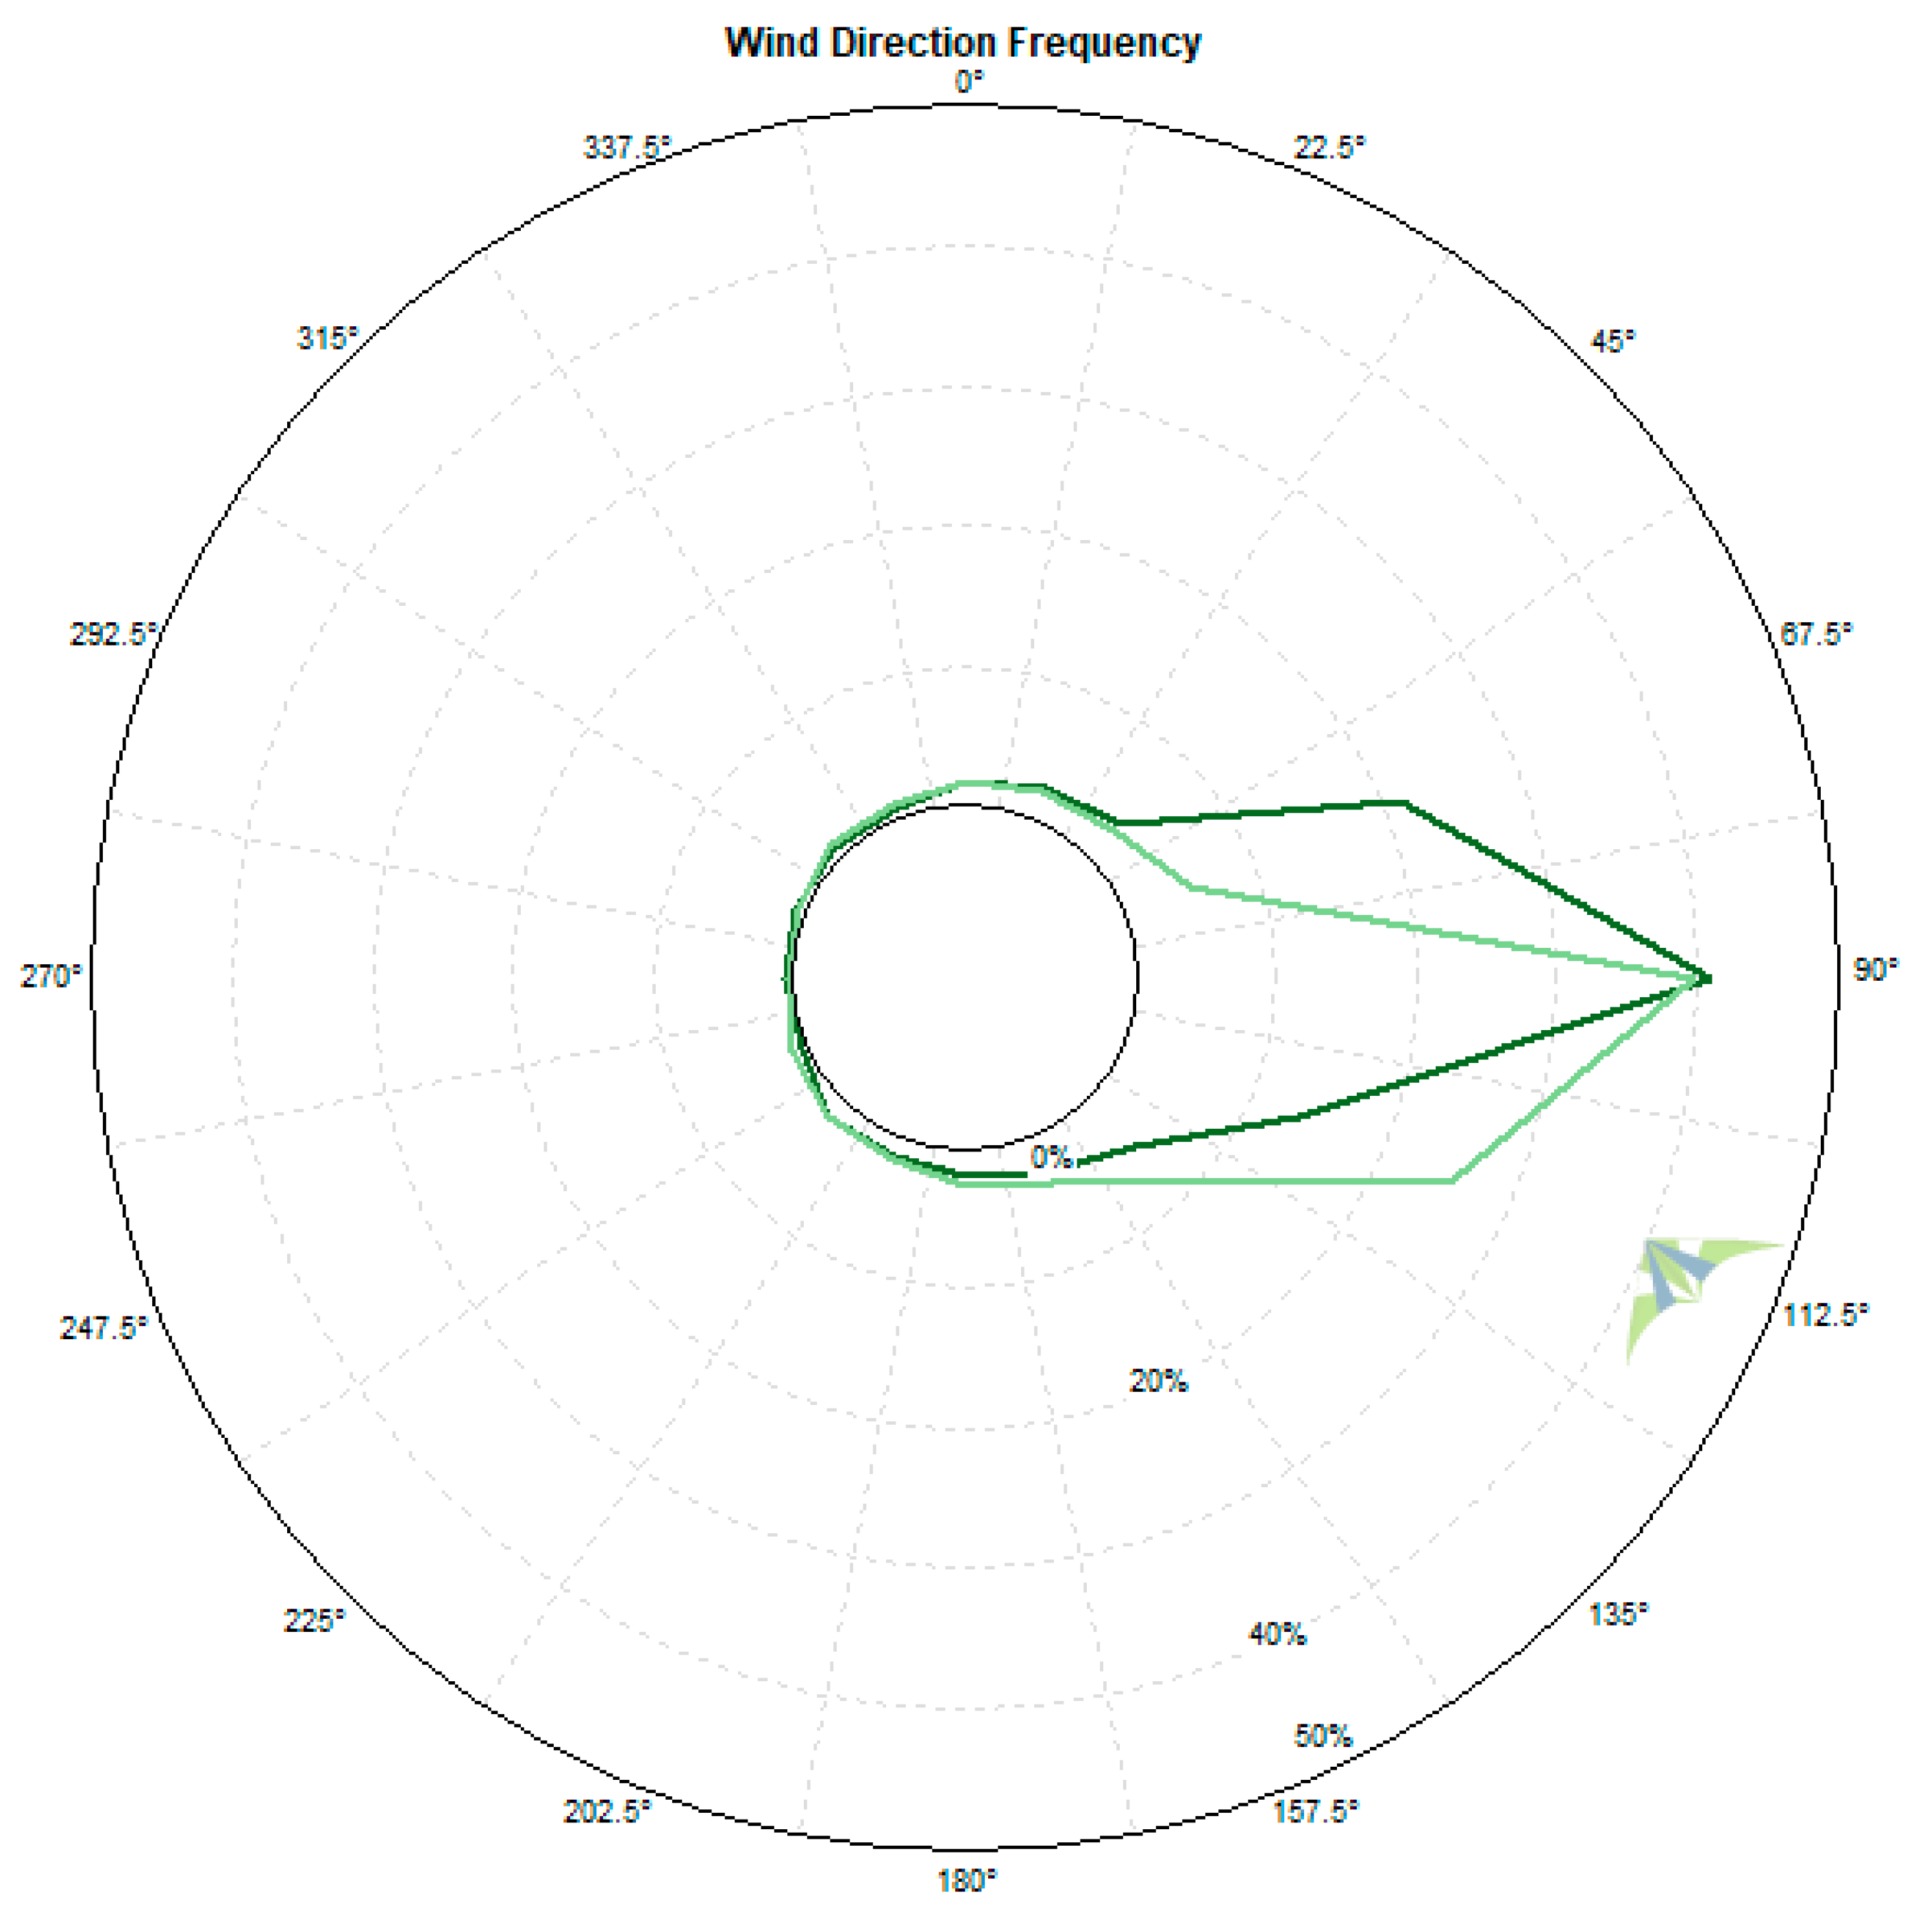
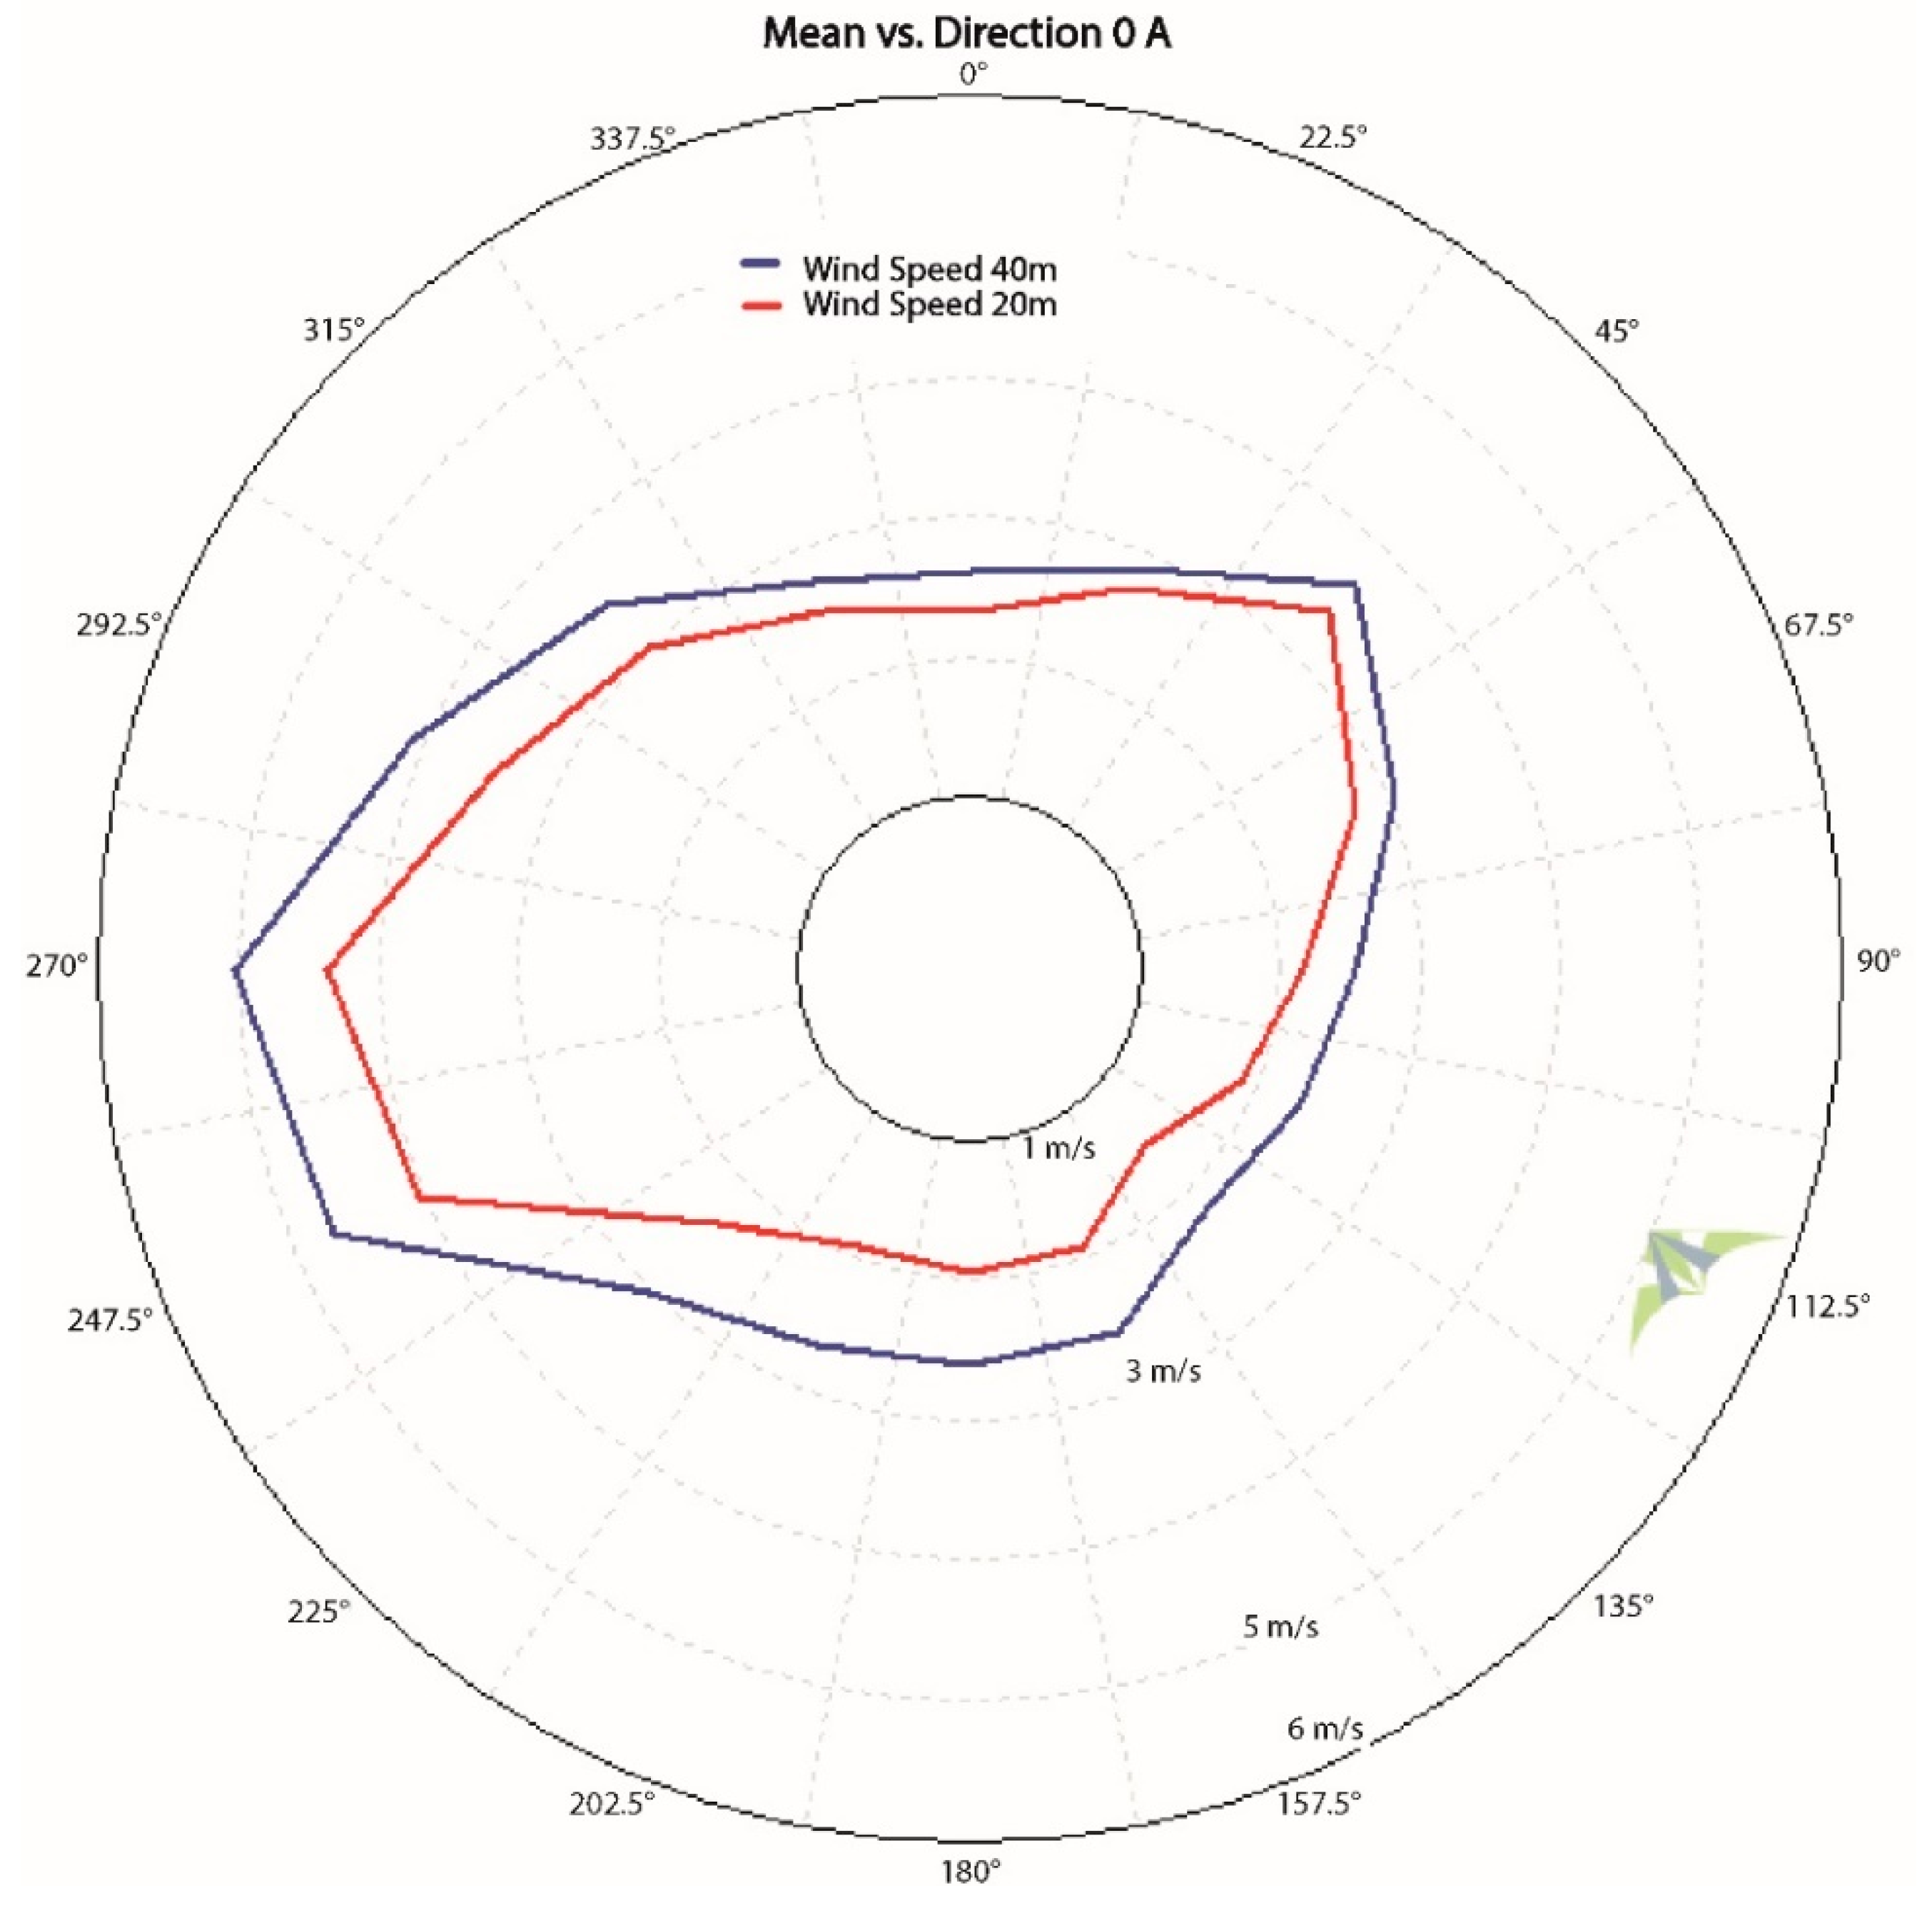
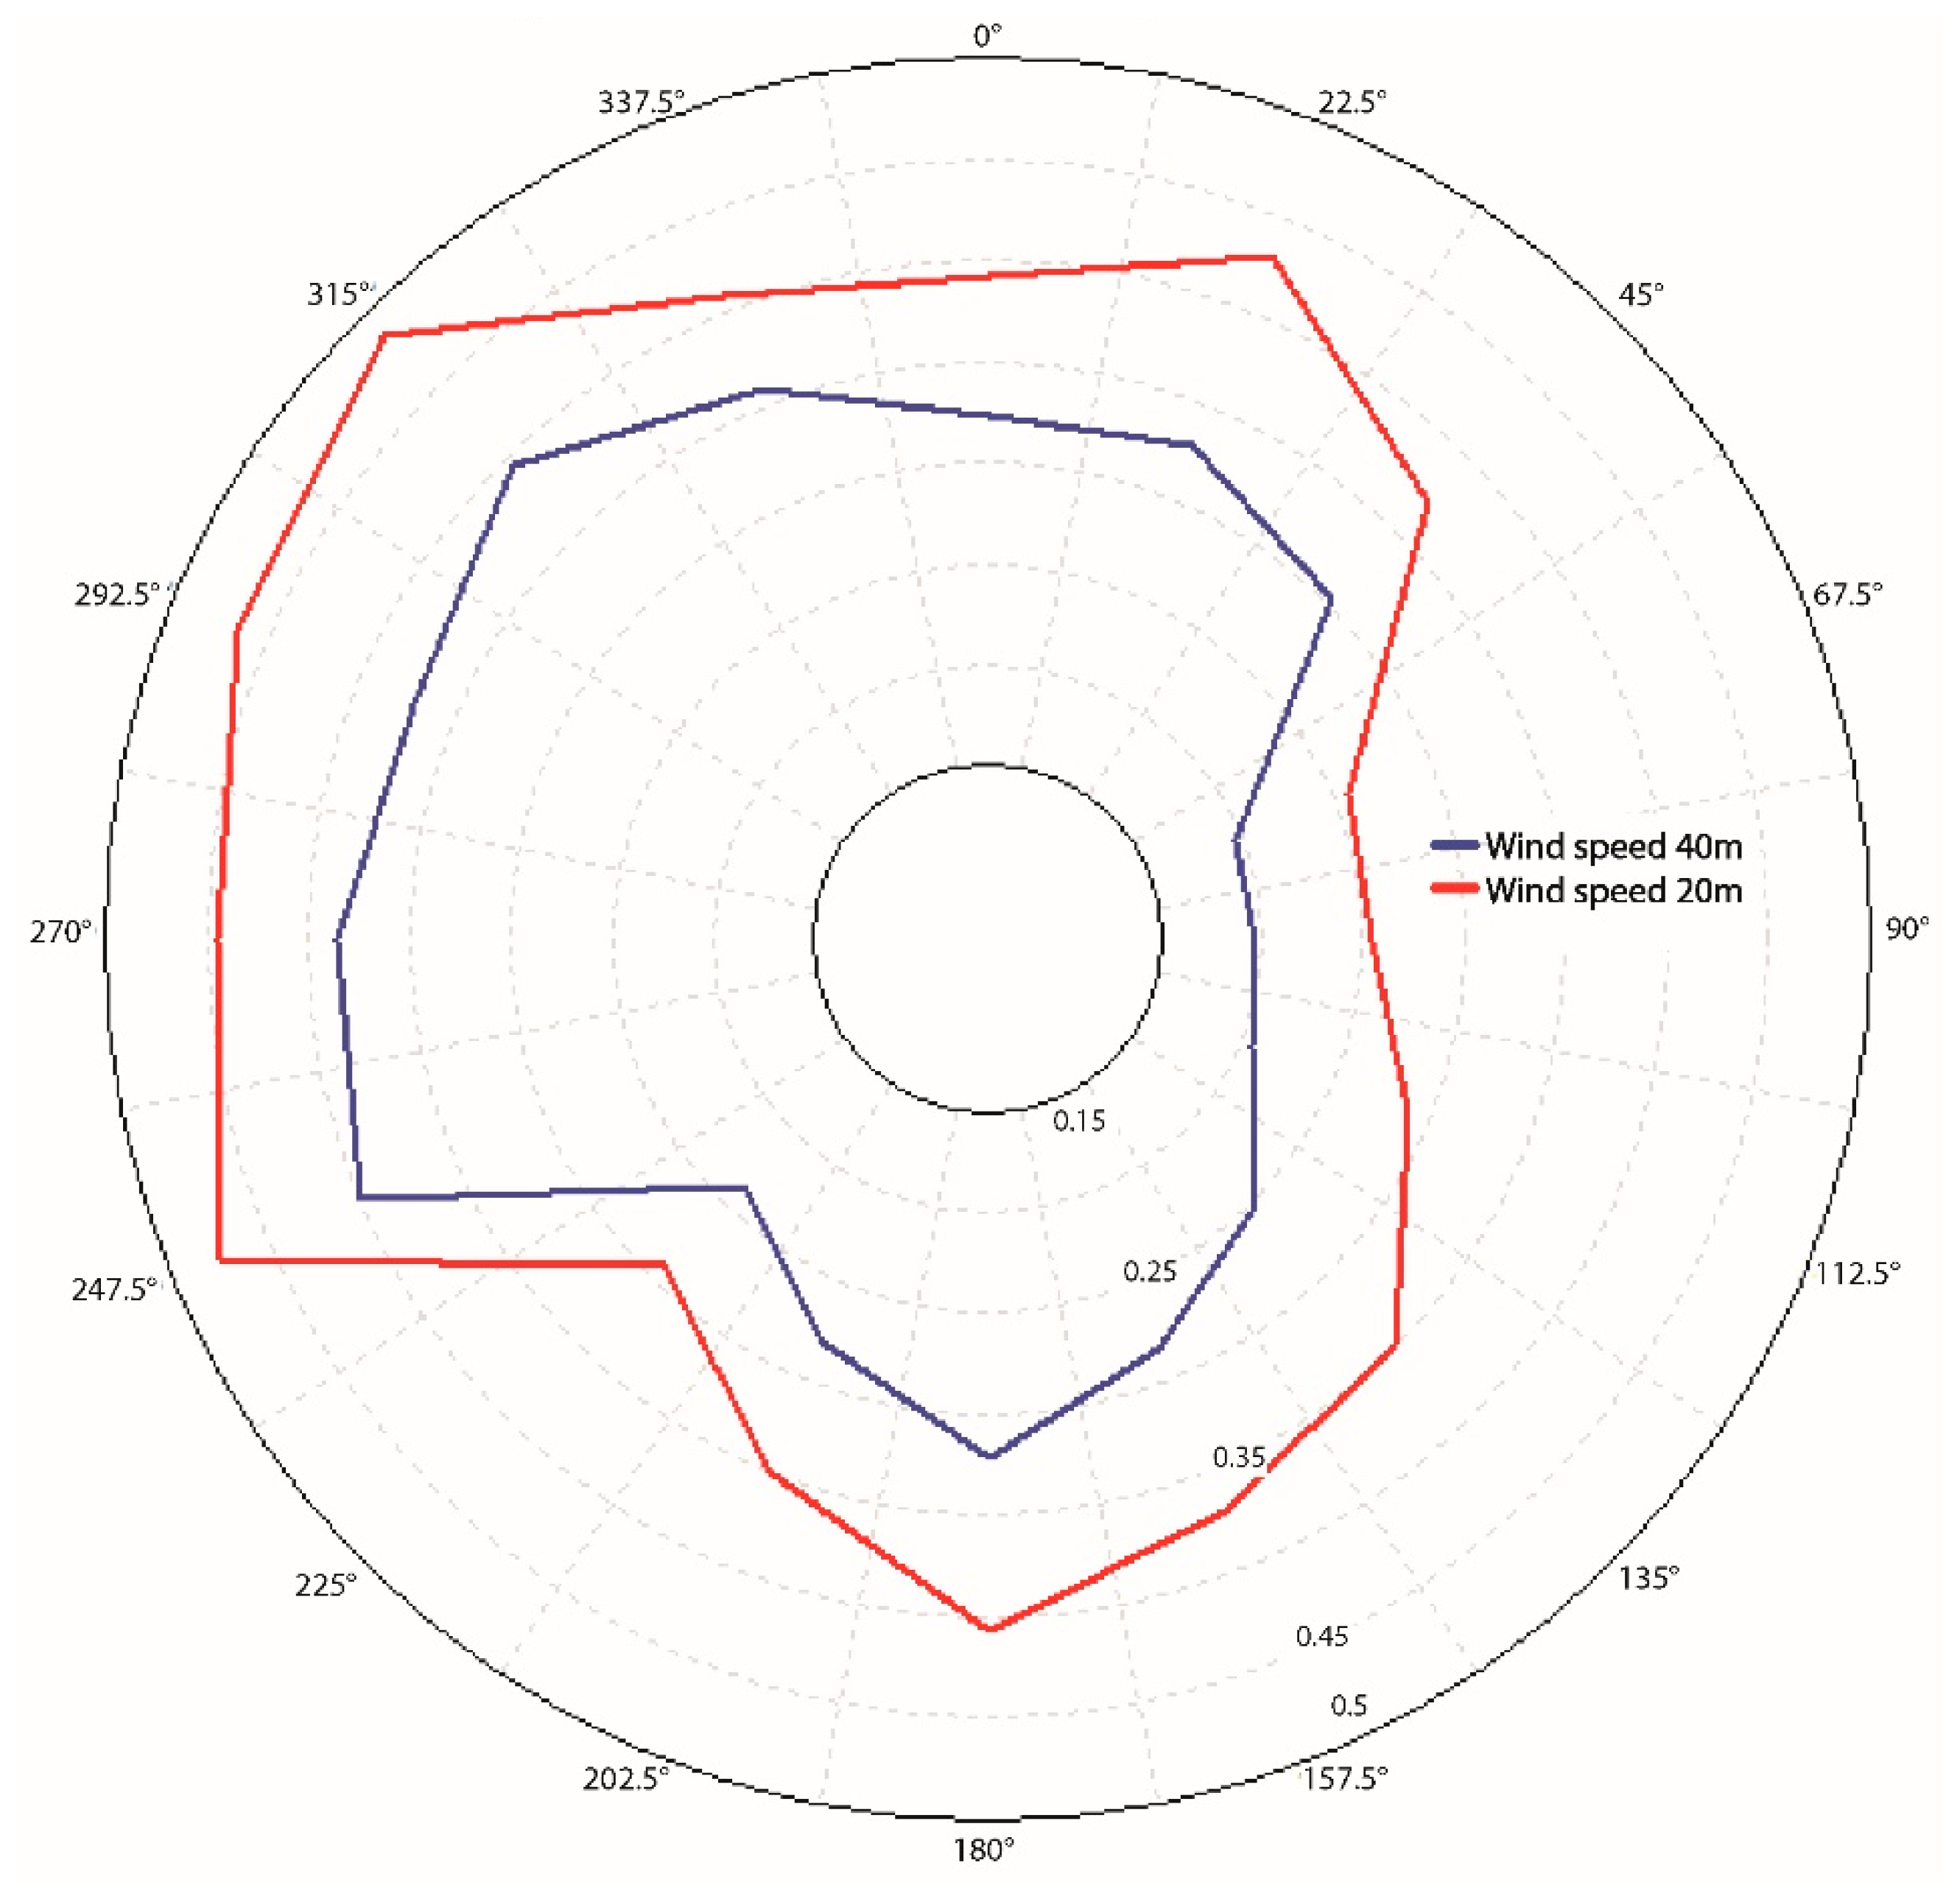
One of the primary characteristics of wind resources is the frequency distribution of different values of wind speed at a given location. For analysis purposes, the speed spectrum is typically divided into different ranges, such as 0.5 or 1 m/s termed bins. The frequency histograms with several frequency distributions of wind speed for Puná Island are presented in Figure 5a,b. The mean wind speed is approximately 4.8 m/s, which reflects a class II wind resource with marginal potential [18]. The lowest values occur from 6 to 7 a.m., after which time wind speed increases again, peaking at 3 and 5 p.m. (see Figure 6). During the study period (9 months), availability was 88%; extrapolating this value to a full year, availability declines to 60%. Wind speed varies similarly at both 40 and 20 m, as shown in Figure 6, which is mathematically corroborated by the correlation between anemometer measurements (see Figure 7).

4.2. Wind Direction

A compass rose is a circle through which the horizon is divided according to the direction of the four cardinal points, typically into 8, 12, or 16 sectors (45, 30, or 22.5 degrees per sector, respectively), upon which the percentage of wind blowing in a specific direction is plotted. A primary use of a compass rose is the determination of the optimal location for a wind turbine. Wind direction as a function of frequency and energy as a function of direction are shown in Figure 8 and Figure 9, respectively, revealing predominantly eastward winds according to the data logger. As we can see in the compass rose of Figure 8, 80% of the highest wind speeds occur within the interval from 67.5° to 112.5°. The same range encompasses approximately 90% of the available wind energy (see Table 3). Wind direction uniformity is beneficial for both the individual production of a wind turbine and the installation of several wind turbines in the case of a wind farm. A comparison of the compass rose results with those provided by the databases MERRA-2 and CFSR2 reveals a 180° difference because, according to the aforementioned databases, the wind blows predominantly westward in the study area. Nevertheless, the mean wind speed of the present study agrees completely with those of the referenced databases.

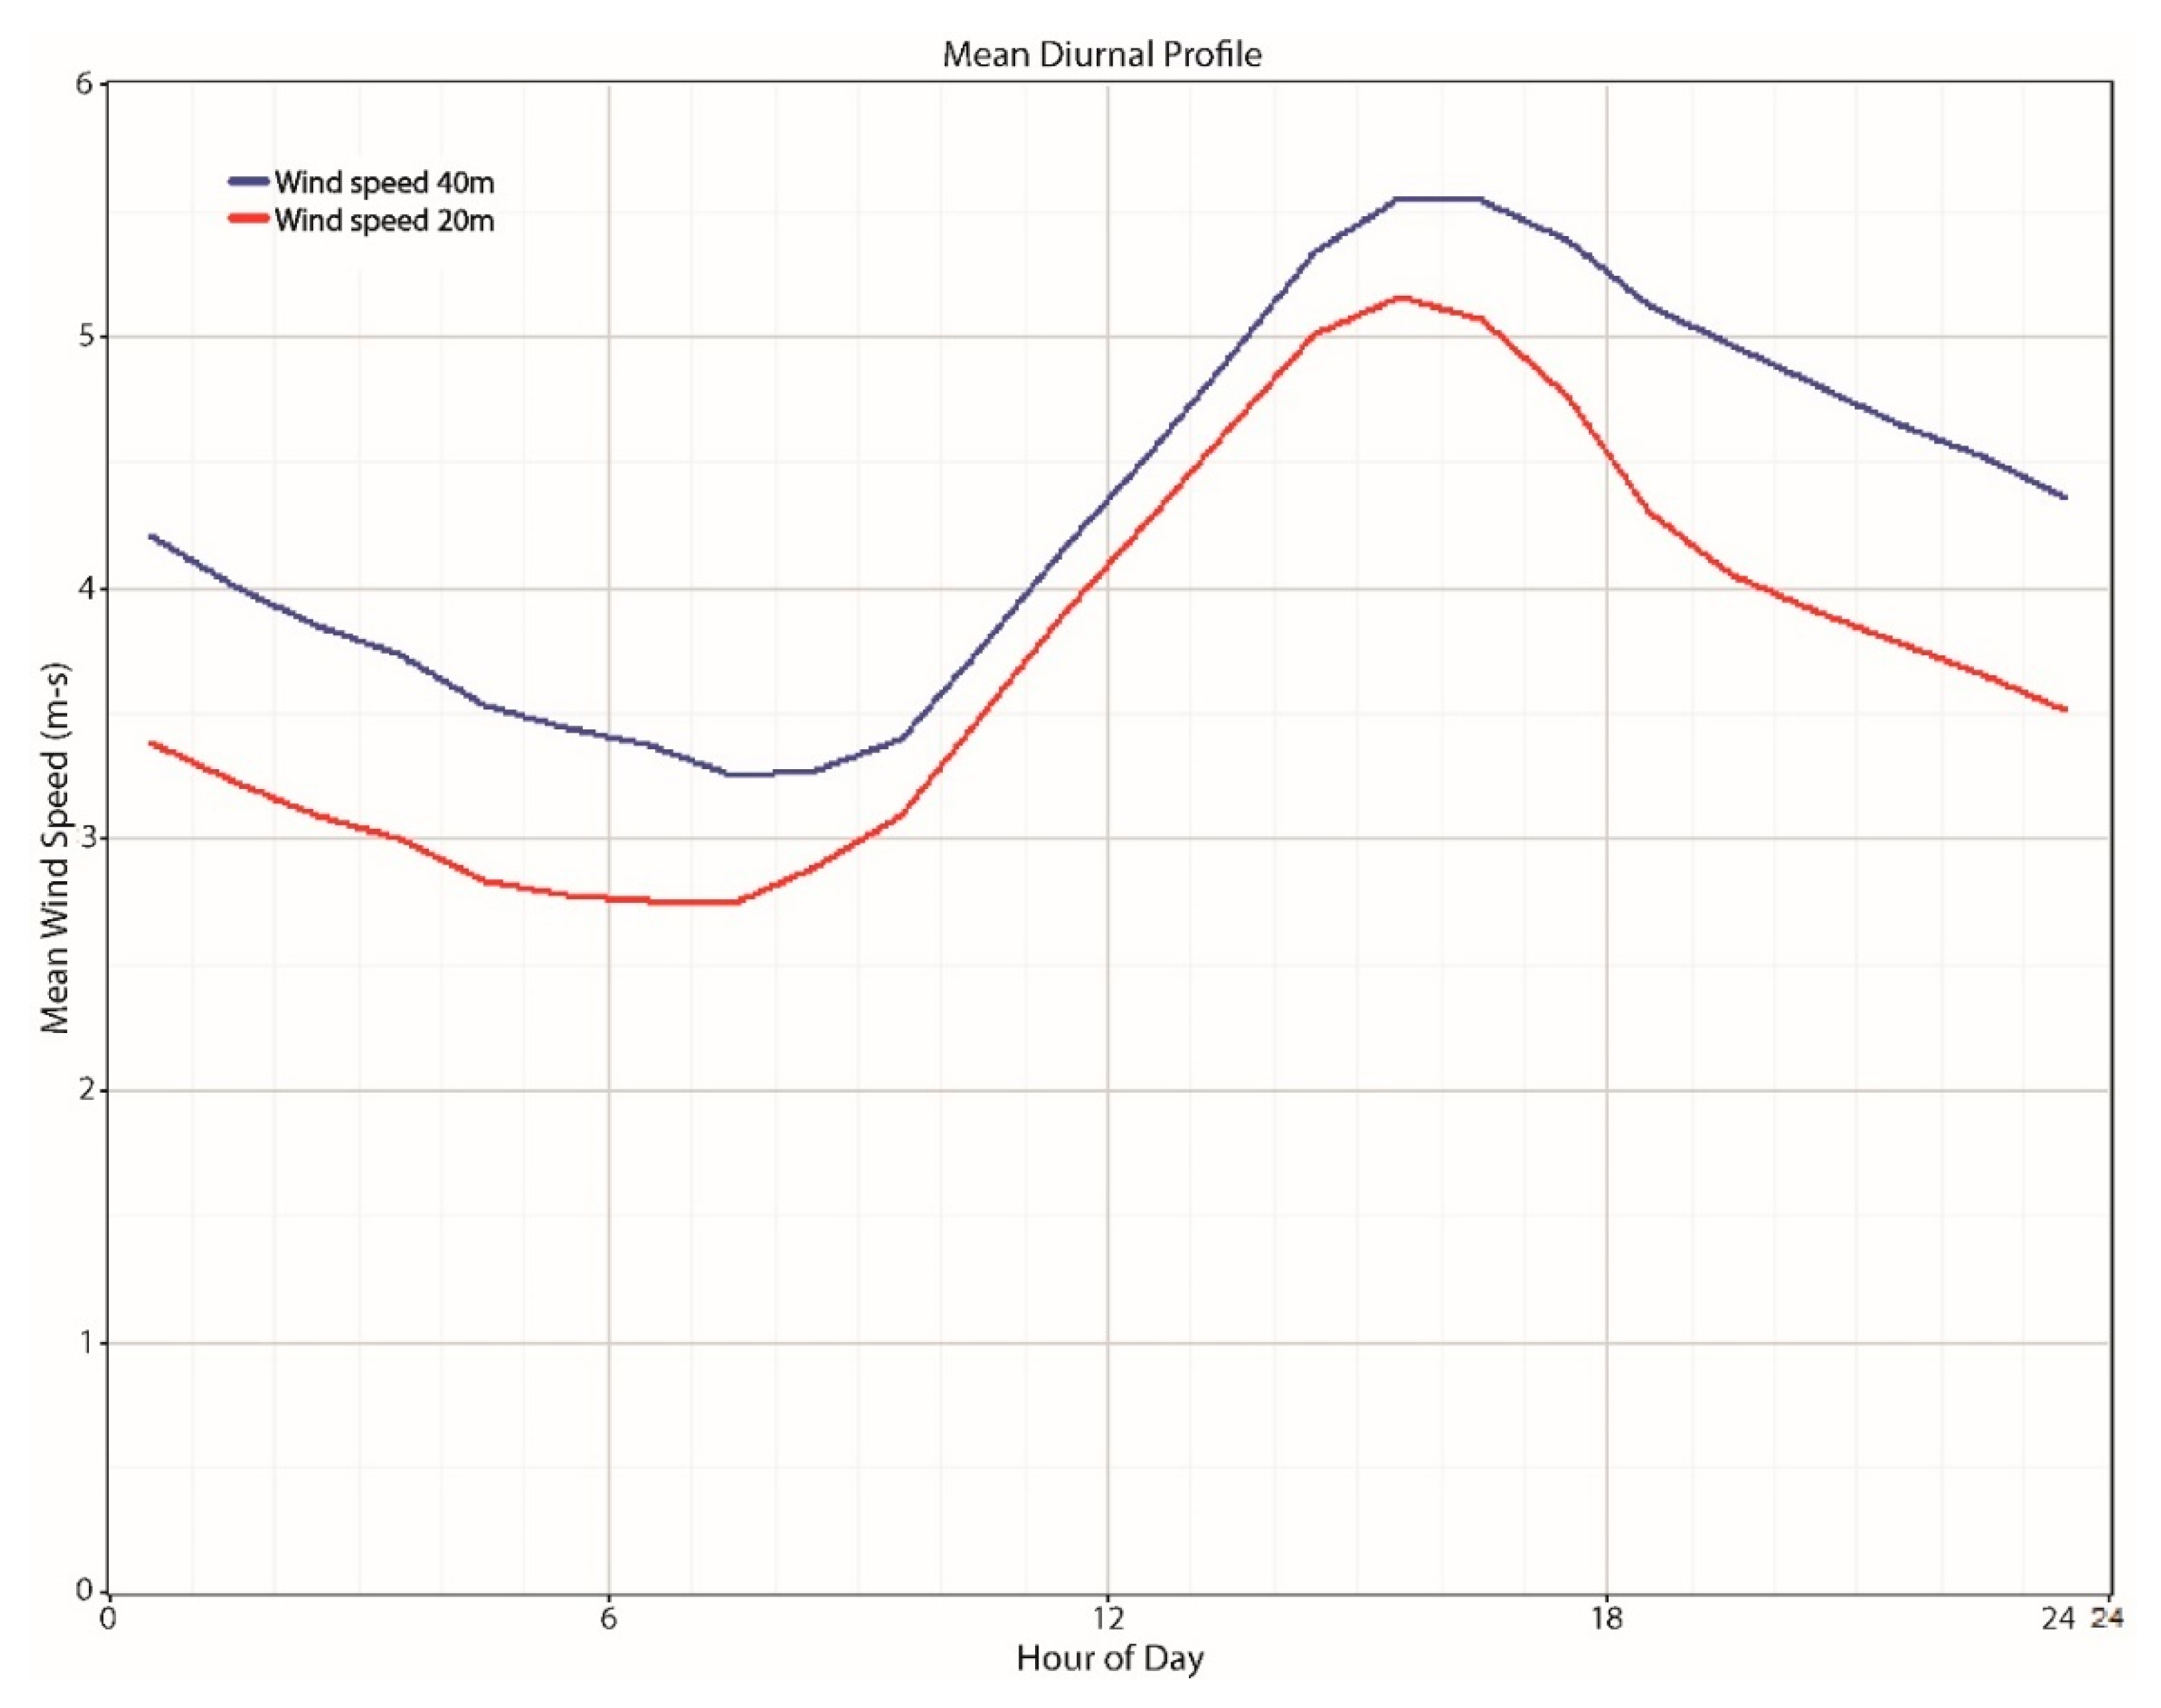
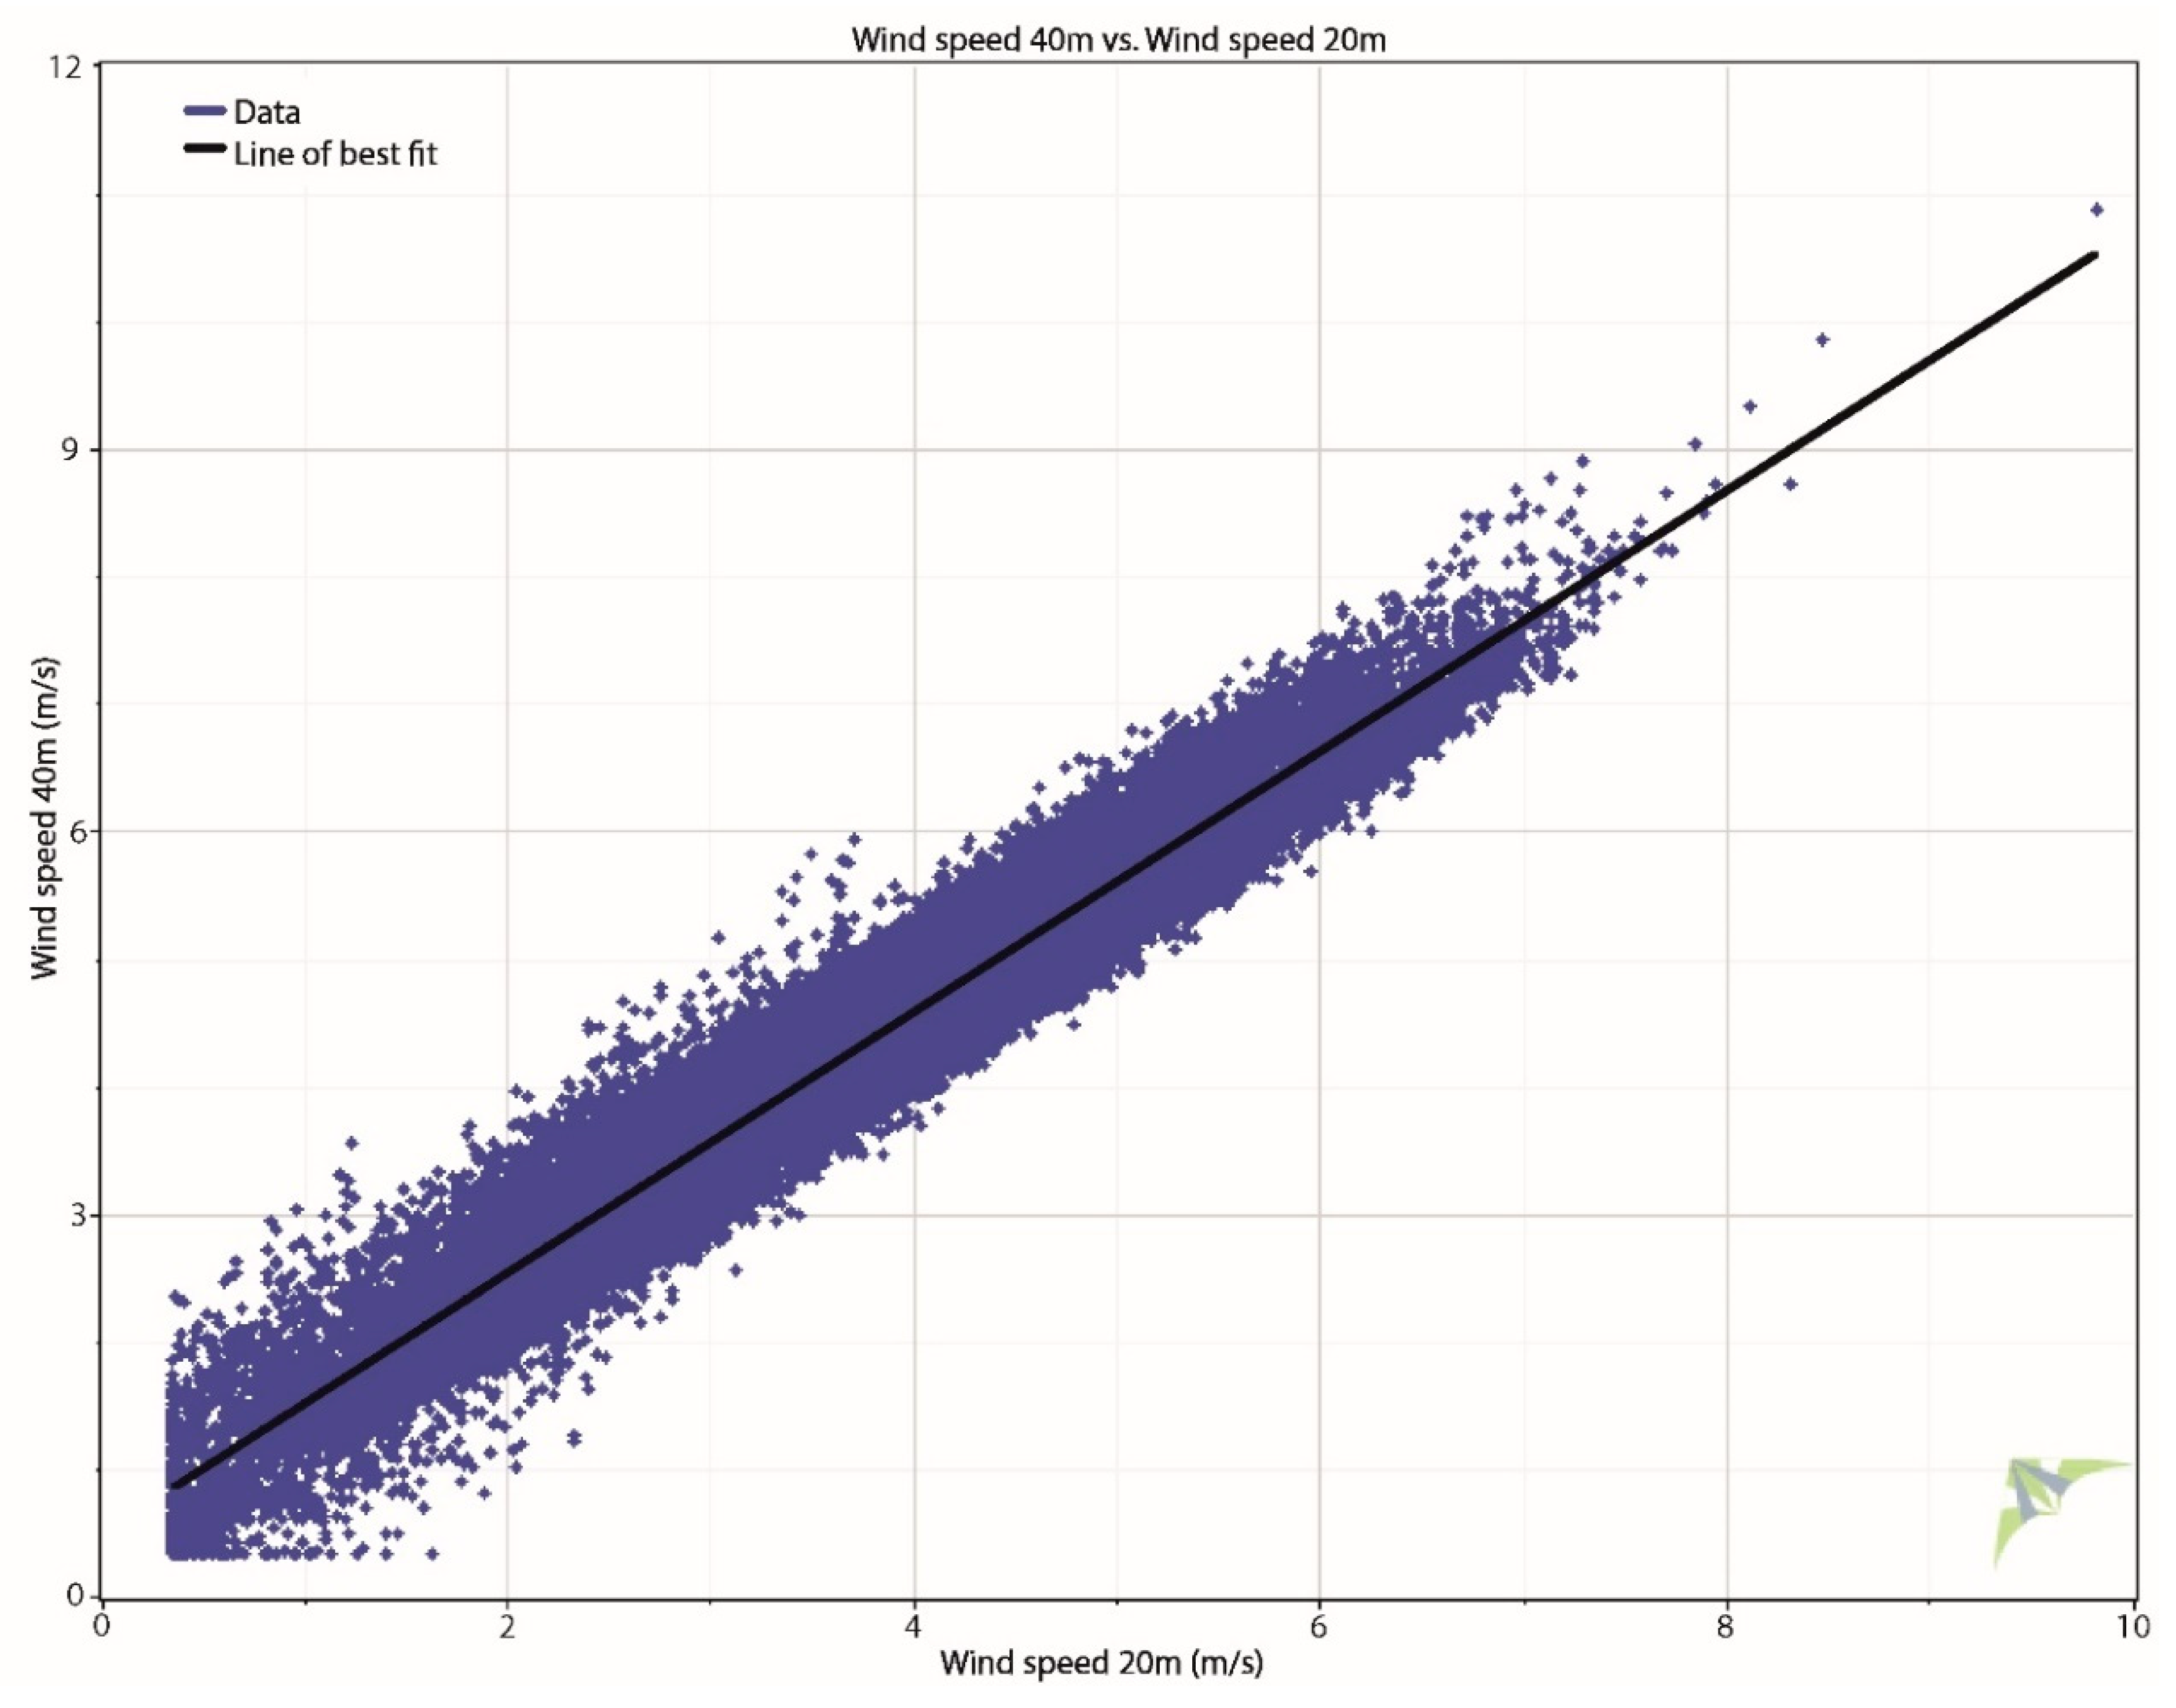
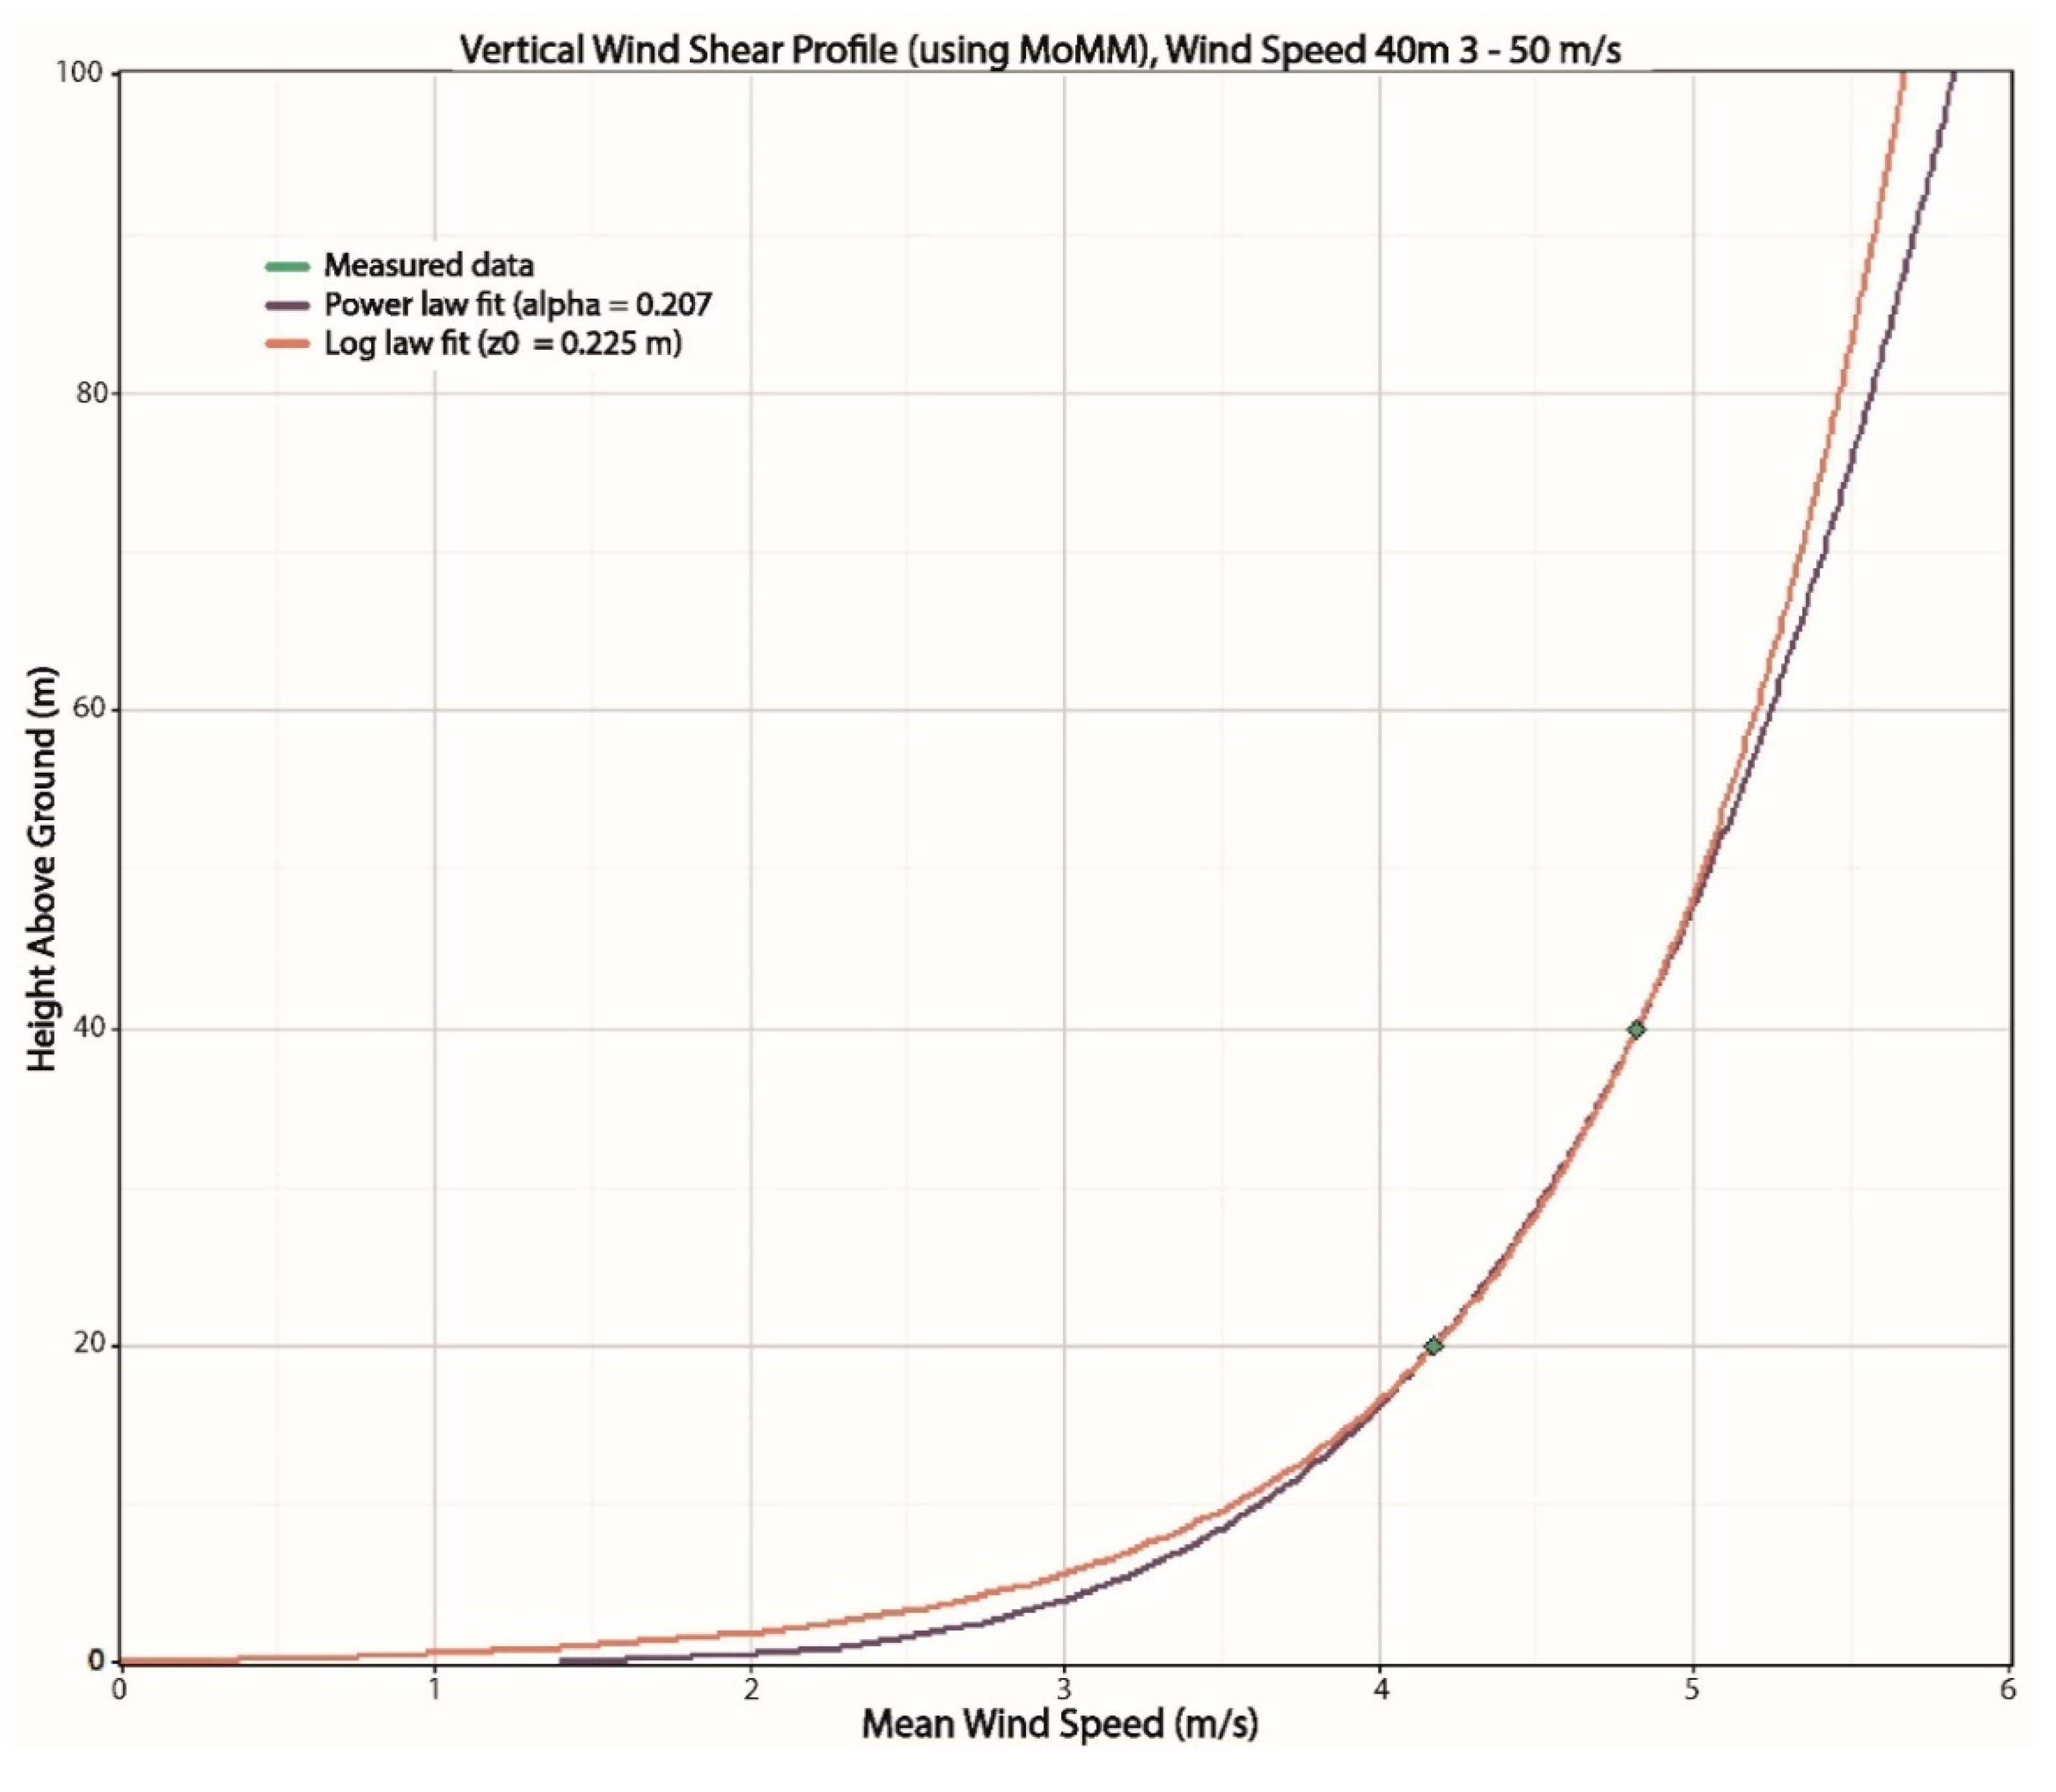
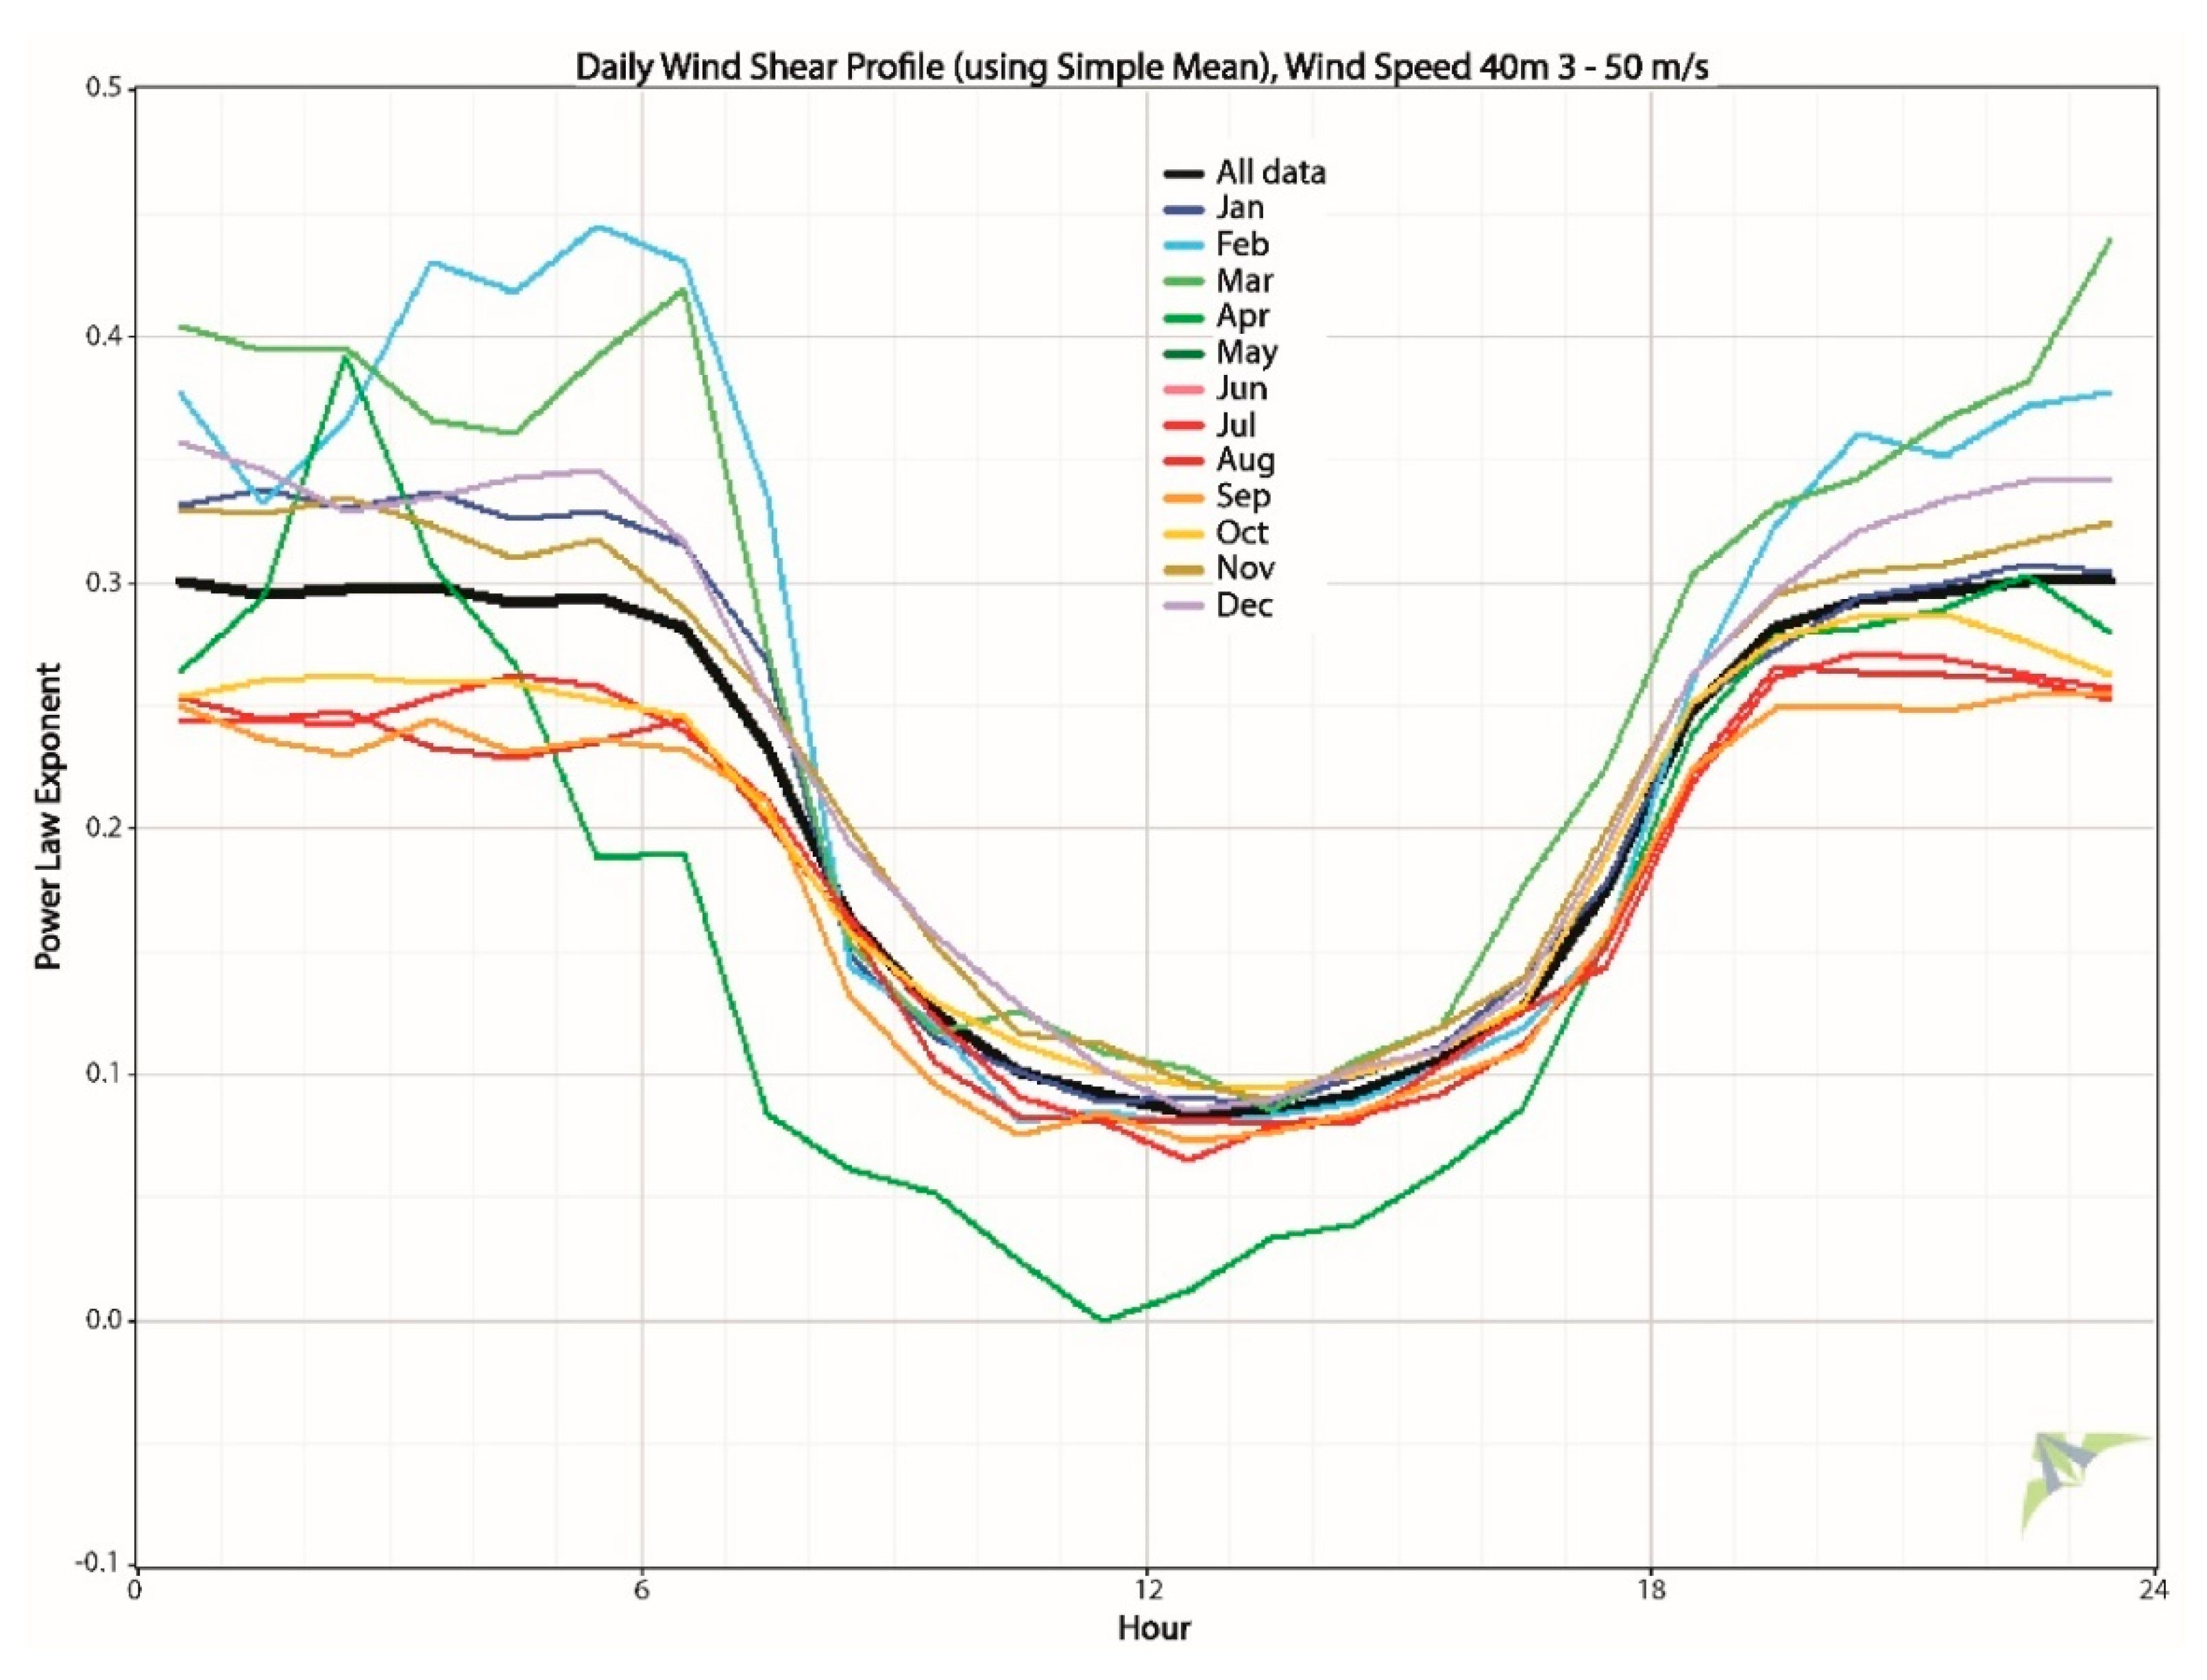
4.3. Vertical Wind Profile as a Function of Height

The vertical wind profile as a function of height, determined using exponential and logarithmic functions, according to Equations (1) and (2), is presented in Figure 10. Although the wind resources measured at 40 m may be considered scarce, wind speeds reach values of approximately 6 m/s at 80 and 100 m, heights at which most modern wind turbines, whose power can be several MWs, operate. The variation of the exponential coefficient of Hellman’s law, according to the time of day and month, is presented in Figure 11.

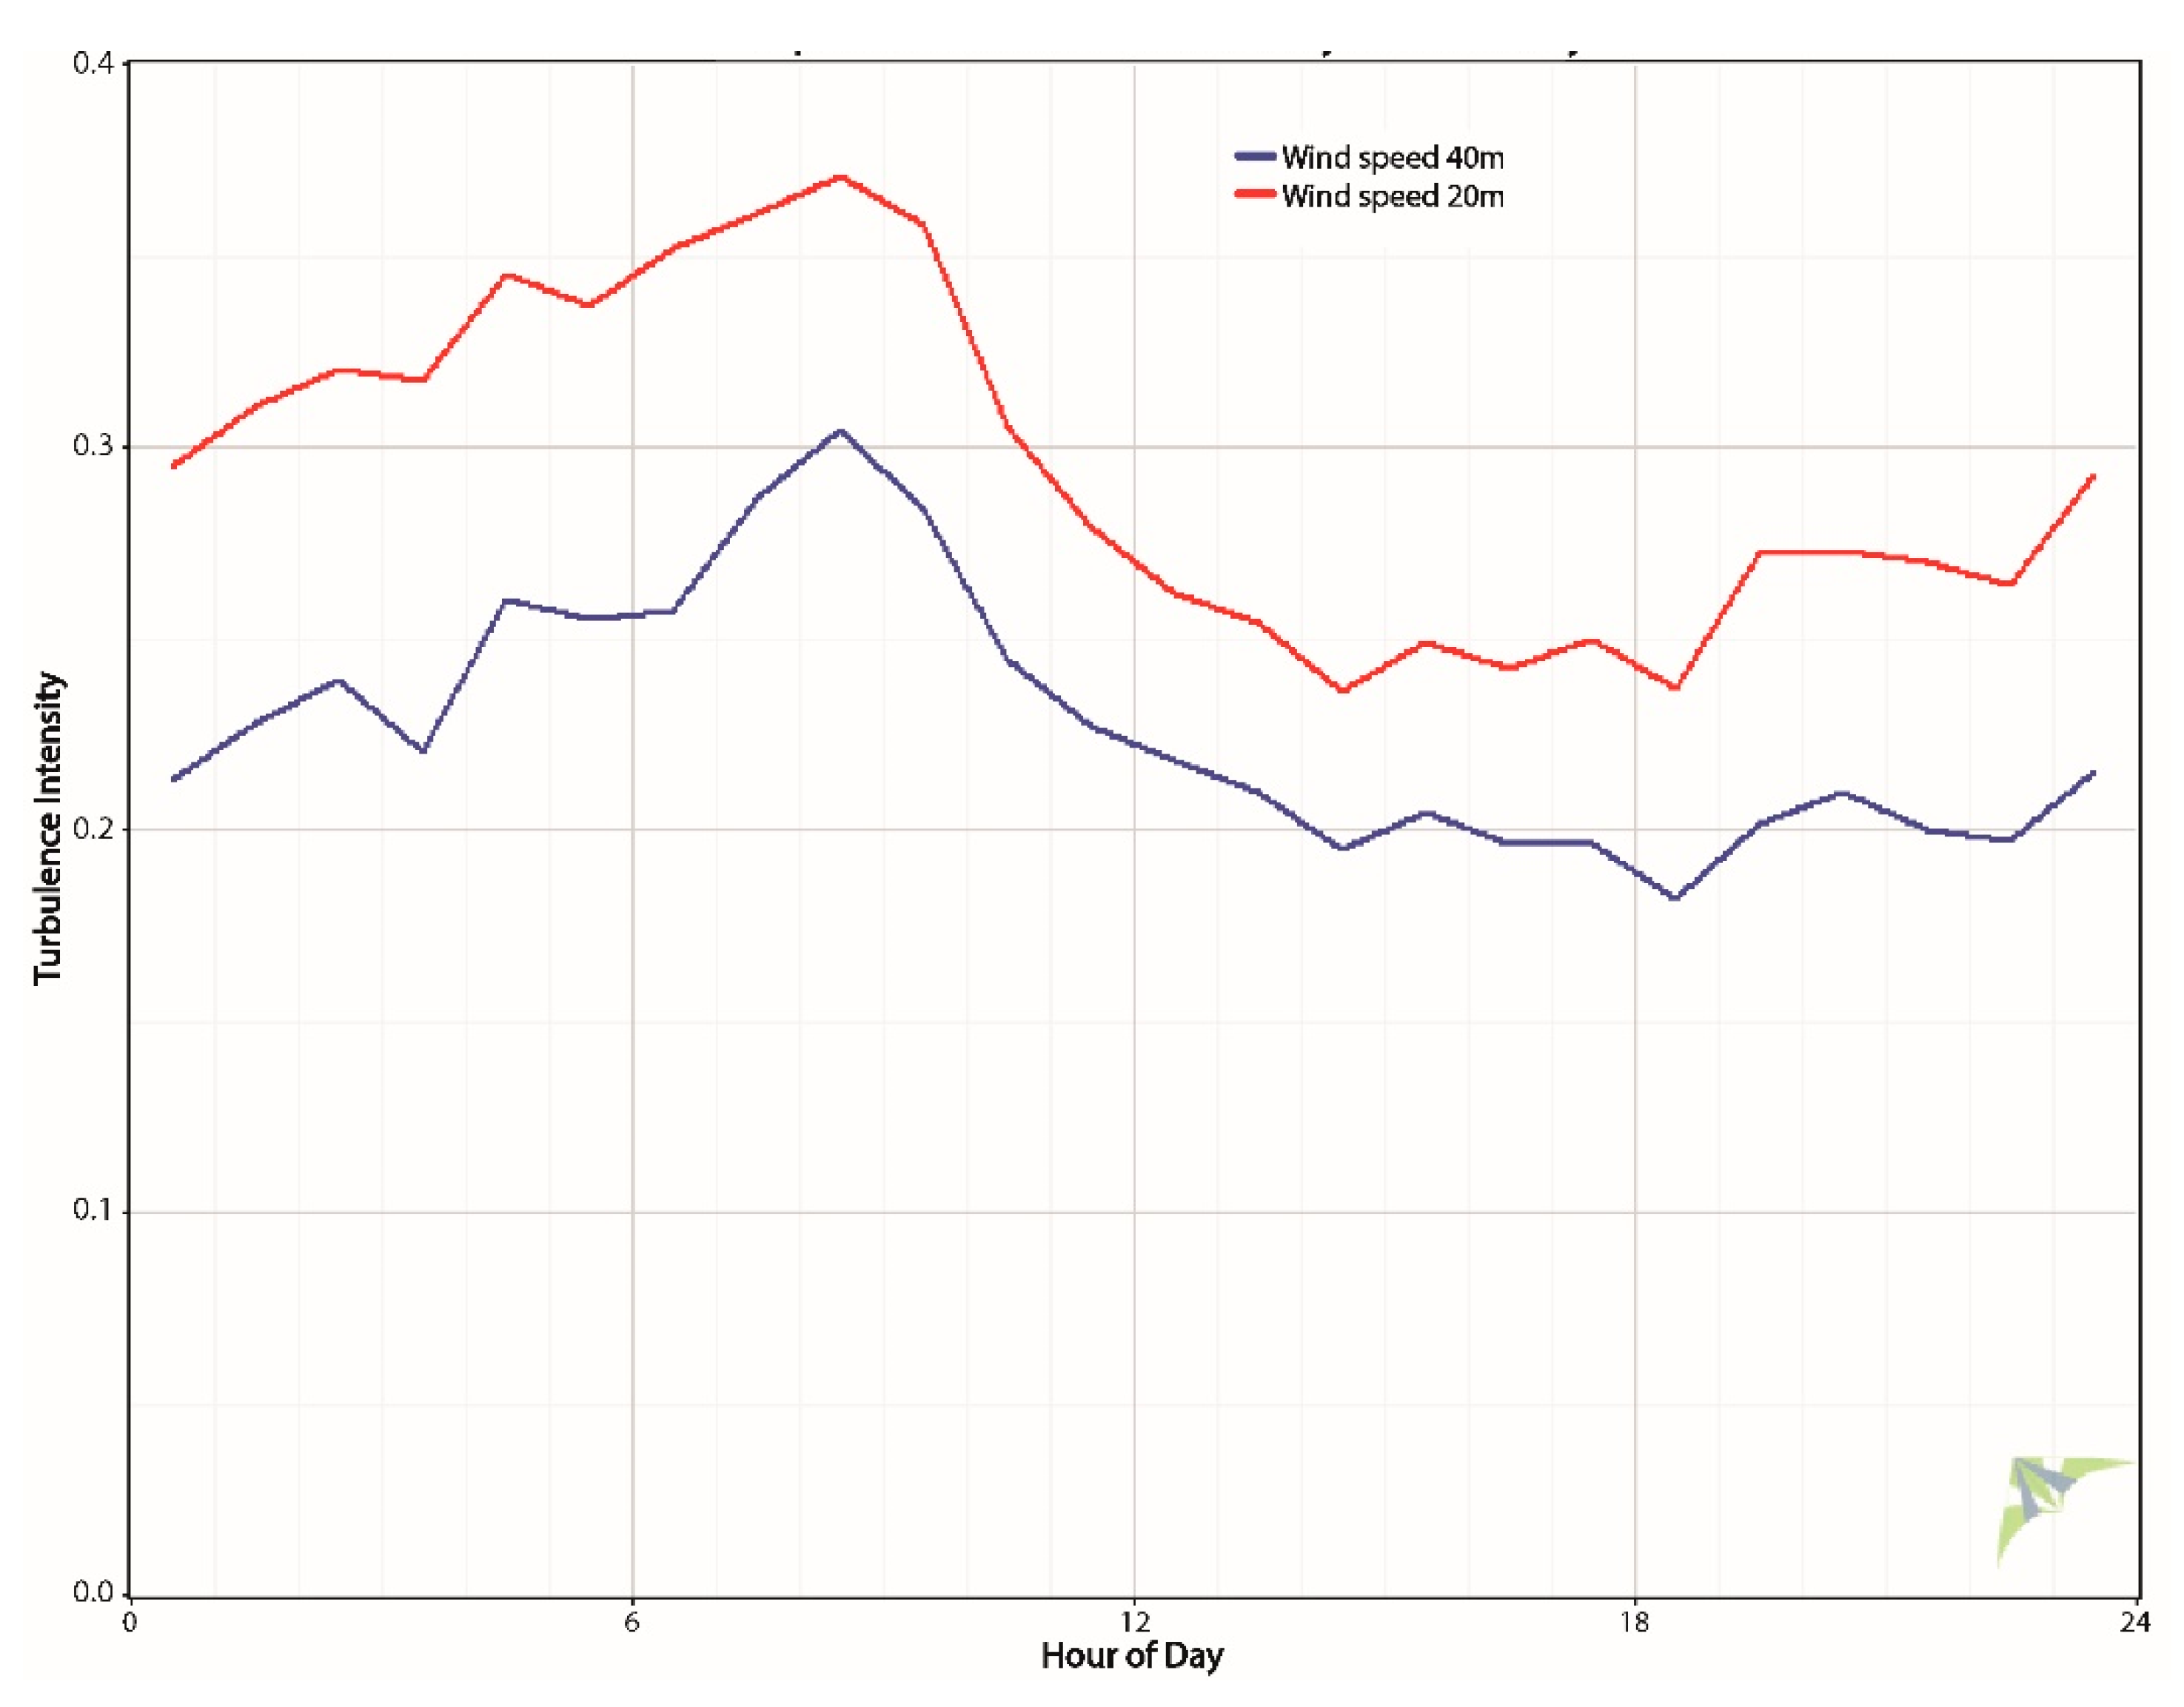
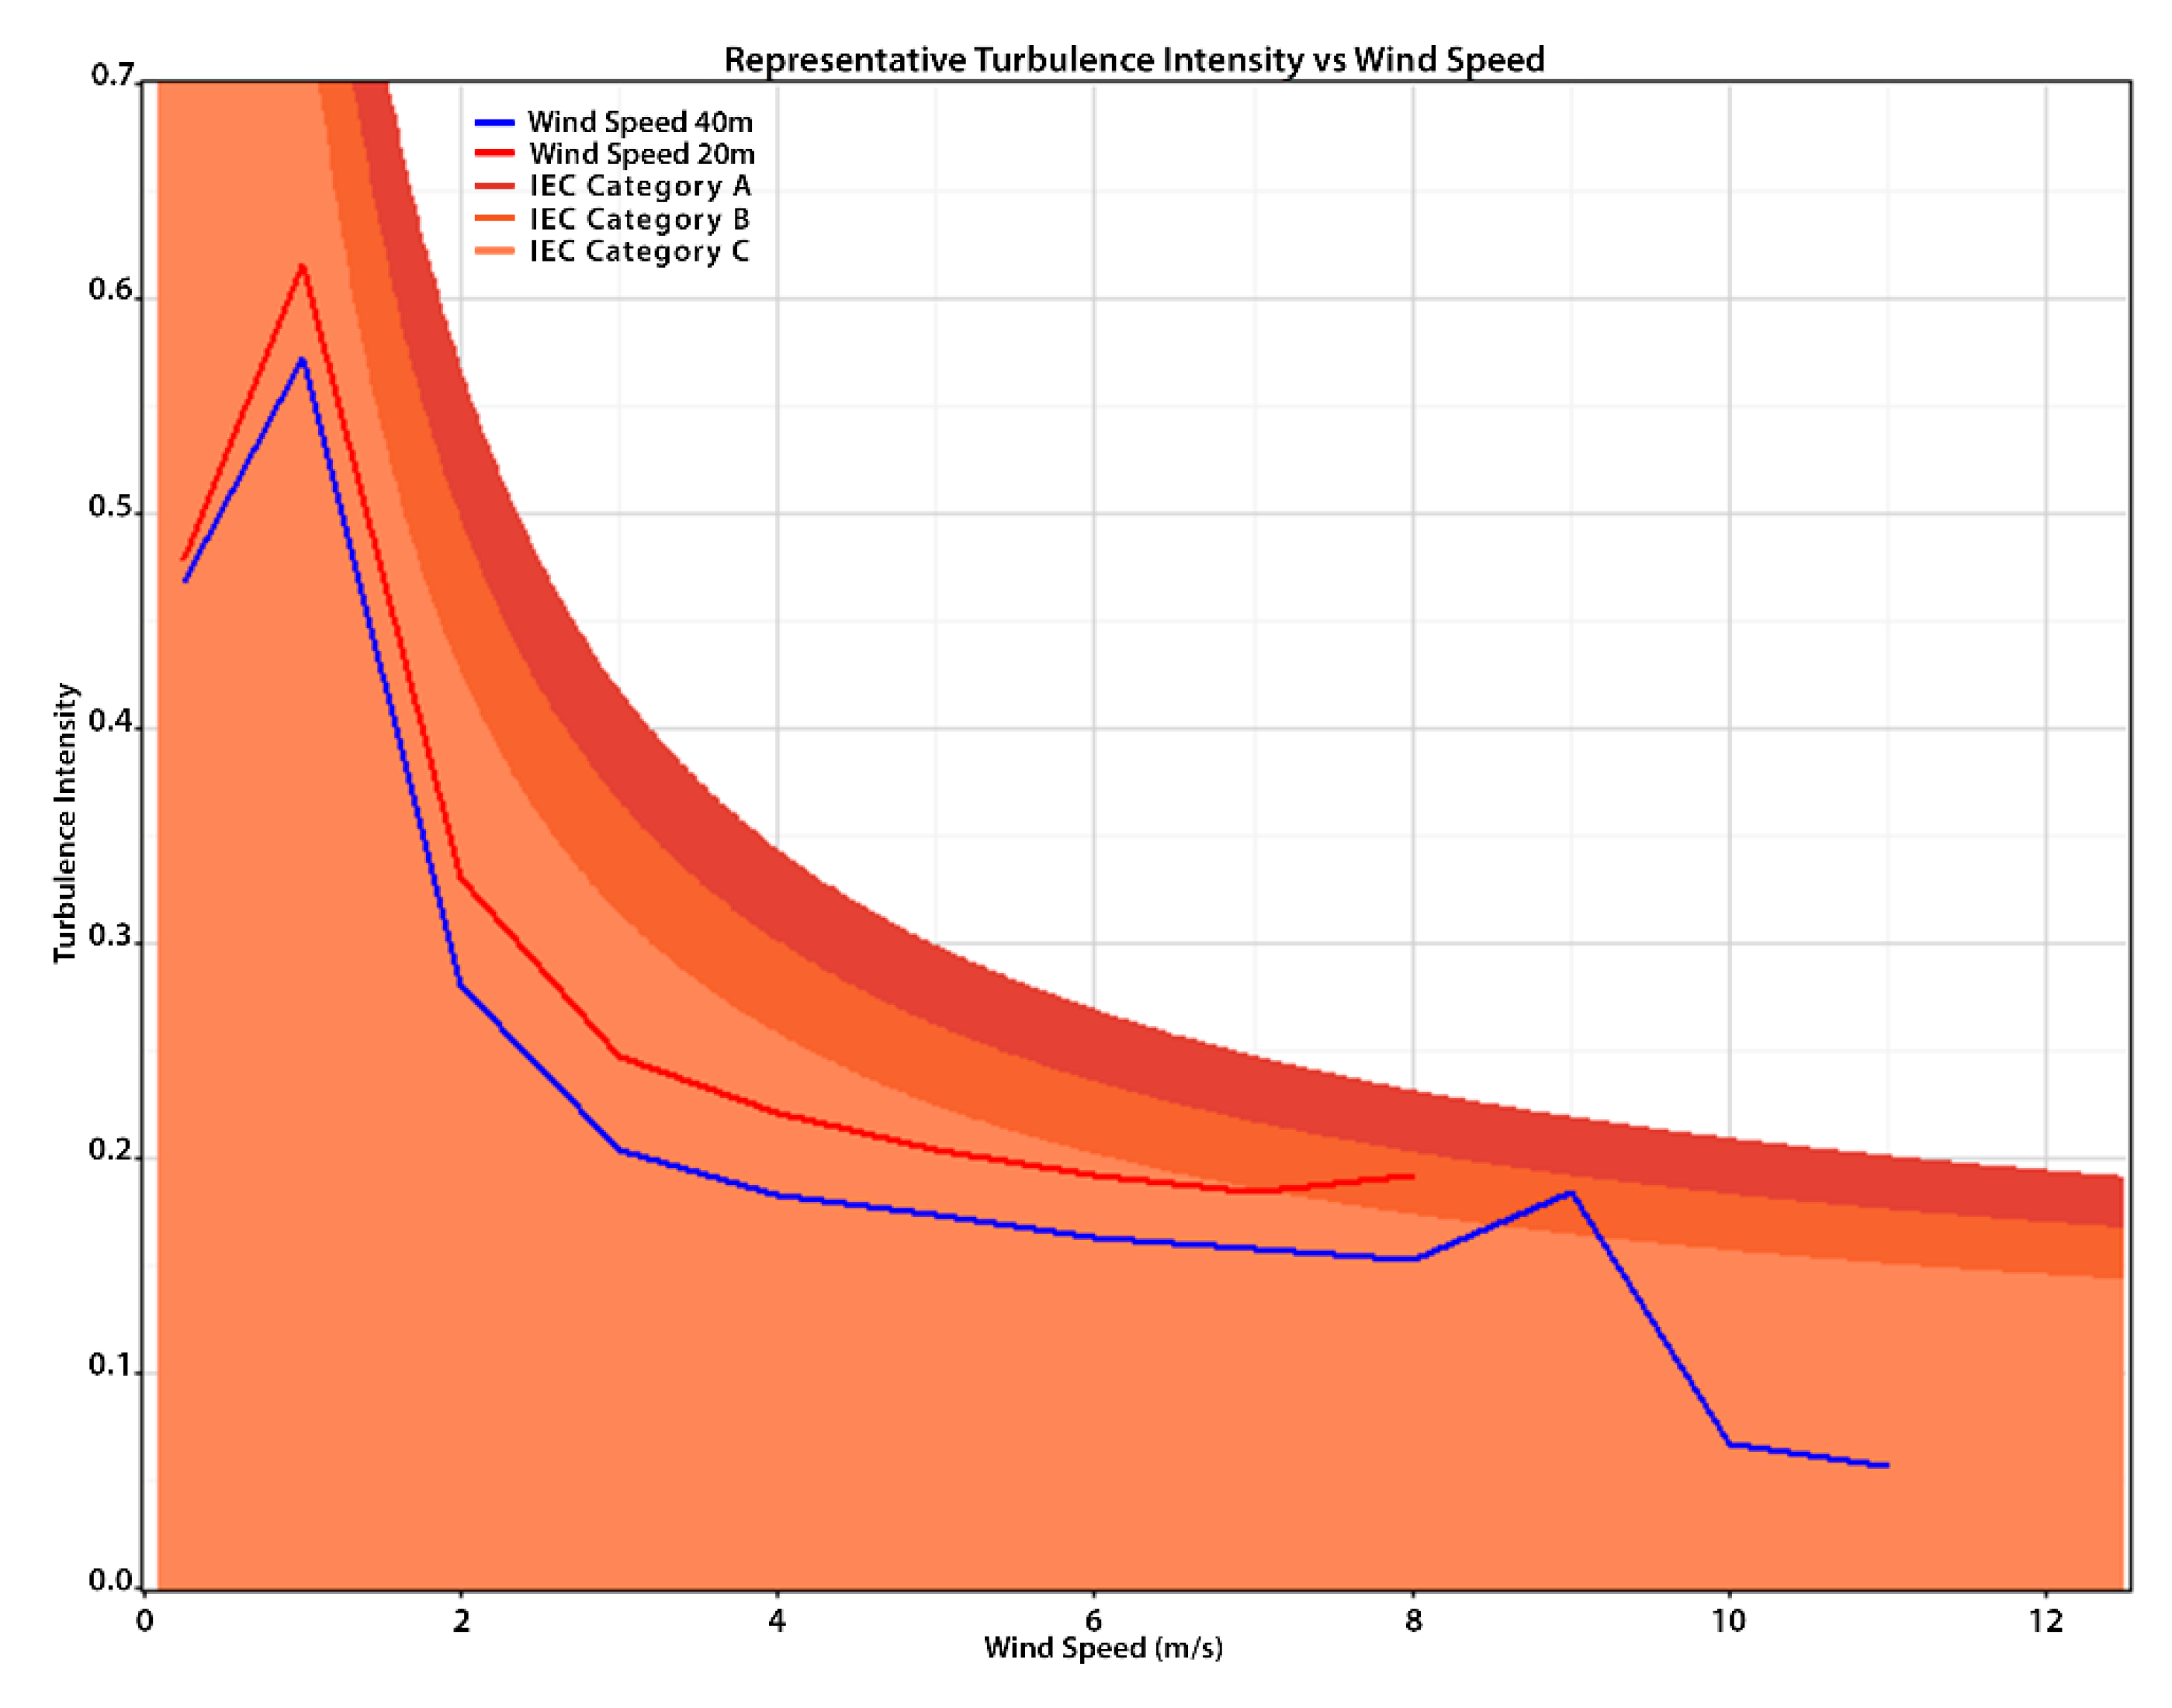
4.4. Short-Term Wind Variation, Gusts, and Turbulence

Turbulence peaks in the early hours of the morning (see Figure 12), but the magnitude of this variable is nonsignificant because the wind speed is lower than the values found in areas considered turbulent (see Figure 13). The small values of turbulence occur in the opposite direction to the region where the highest values of wind speed are observed (see Figure 14). No short-term, monthly, or seasonal variations in wind direction were detected. As the maximum value observed during the study period was 8 m/s, no extreme wind speed calculations were made.

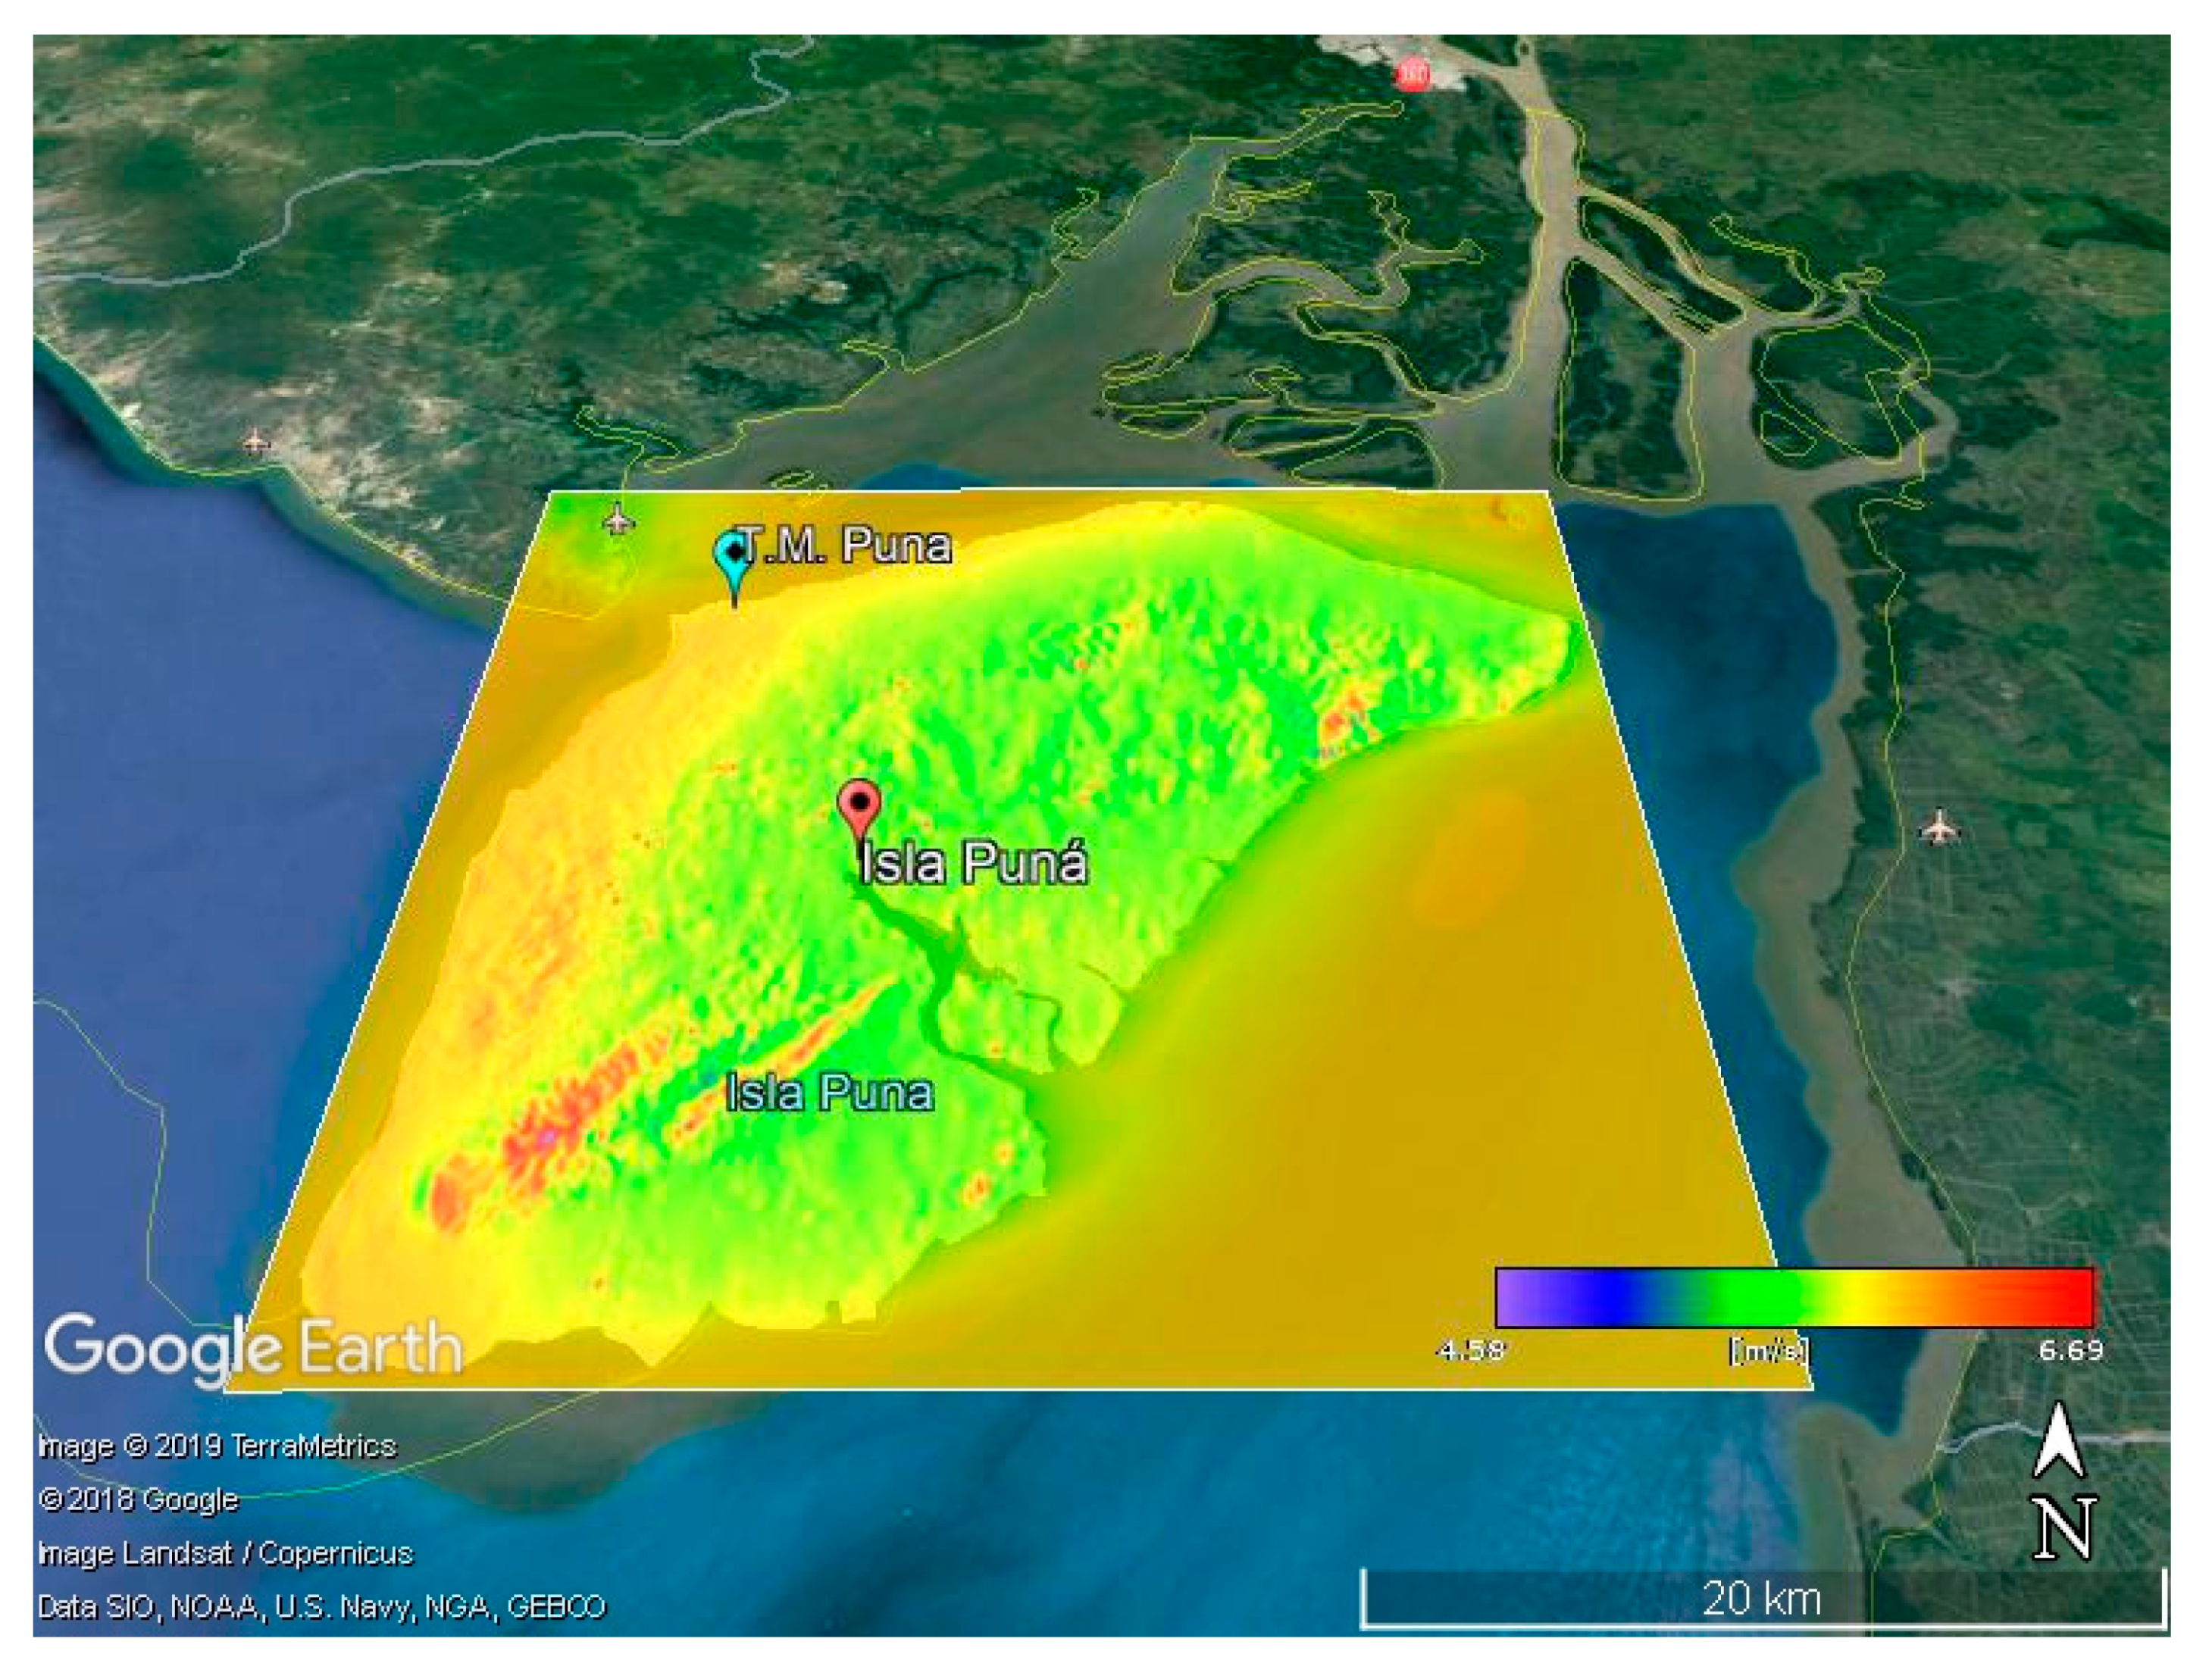
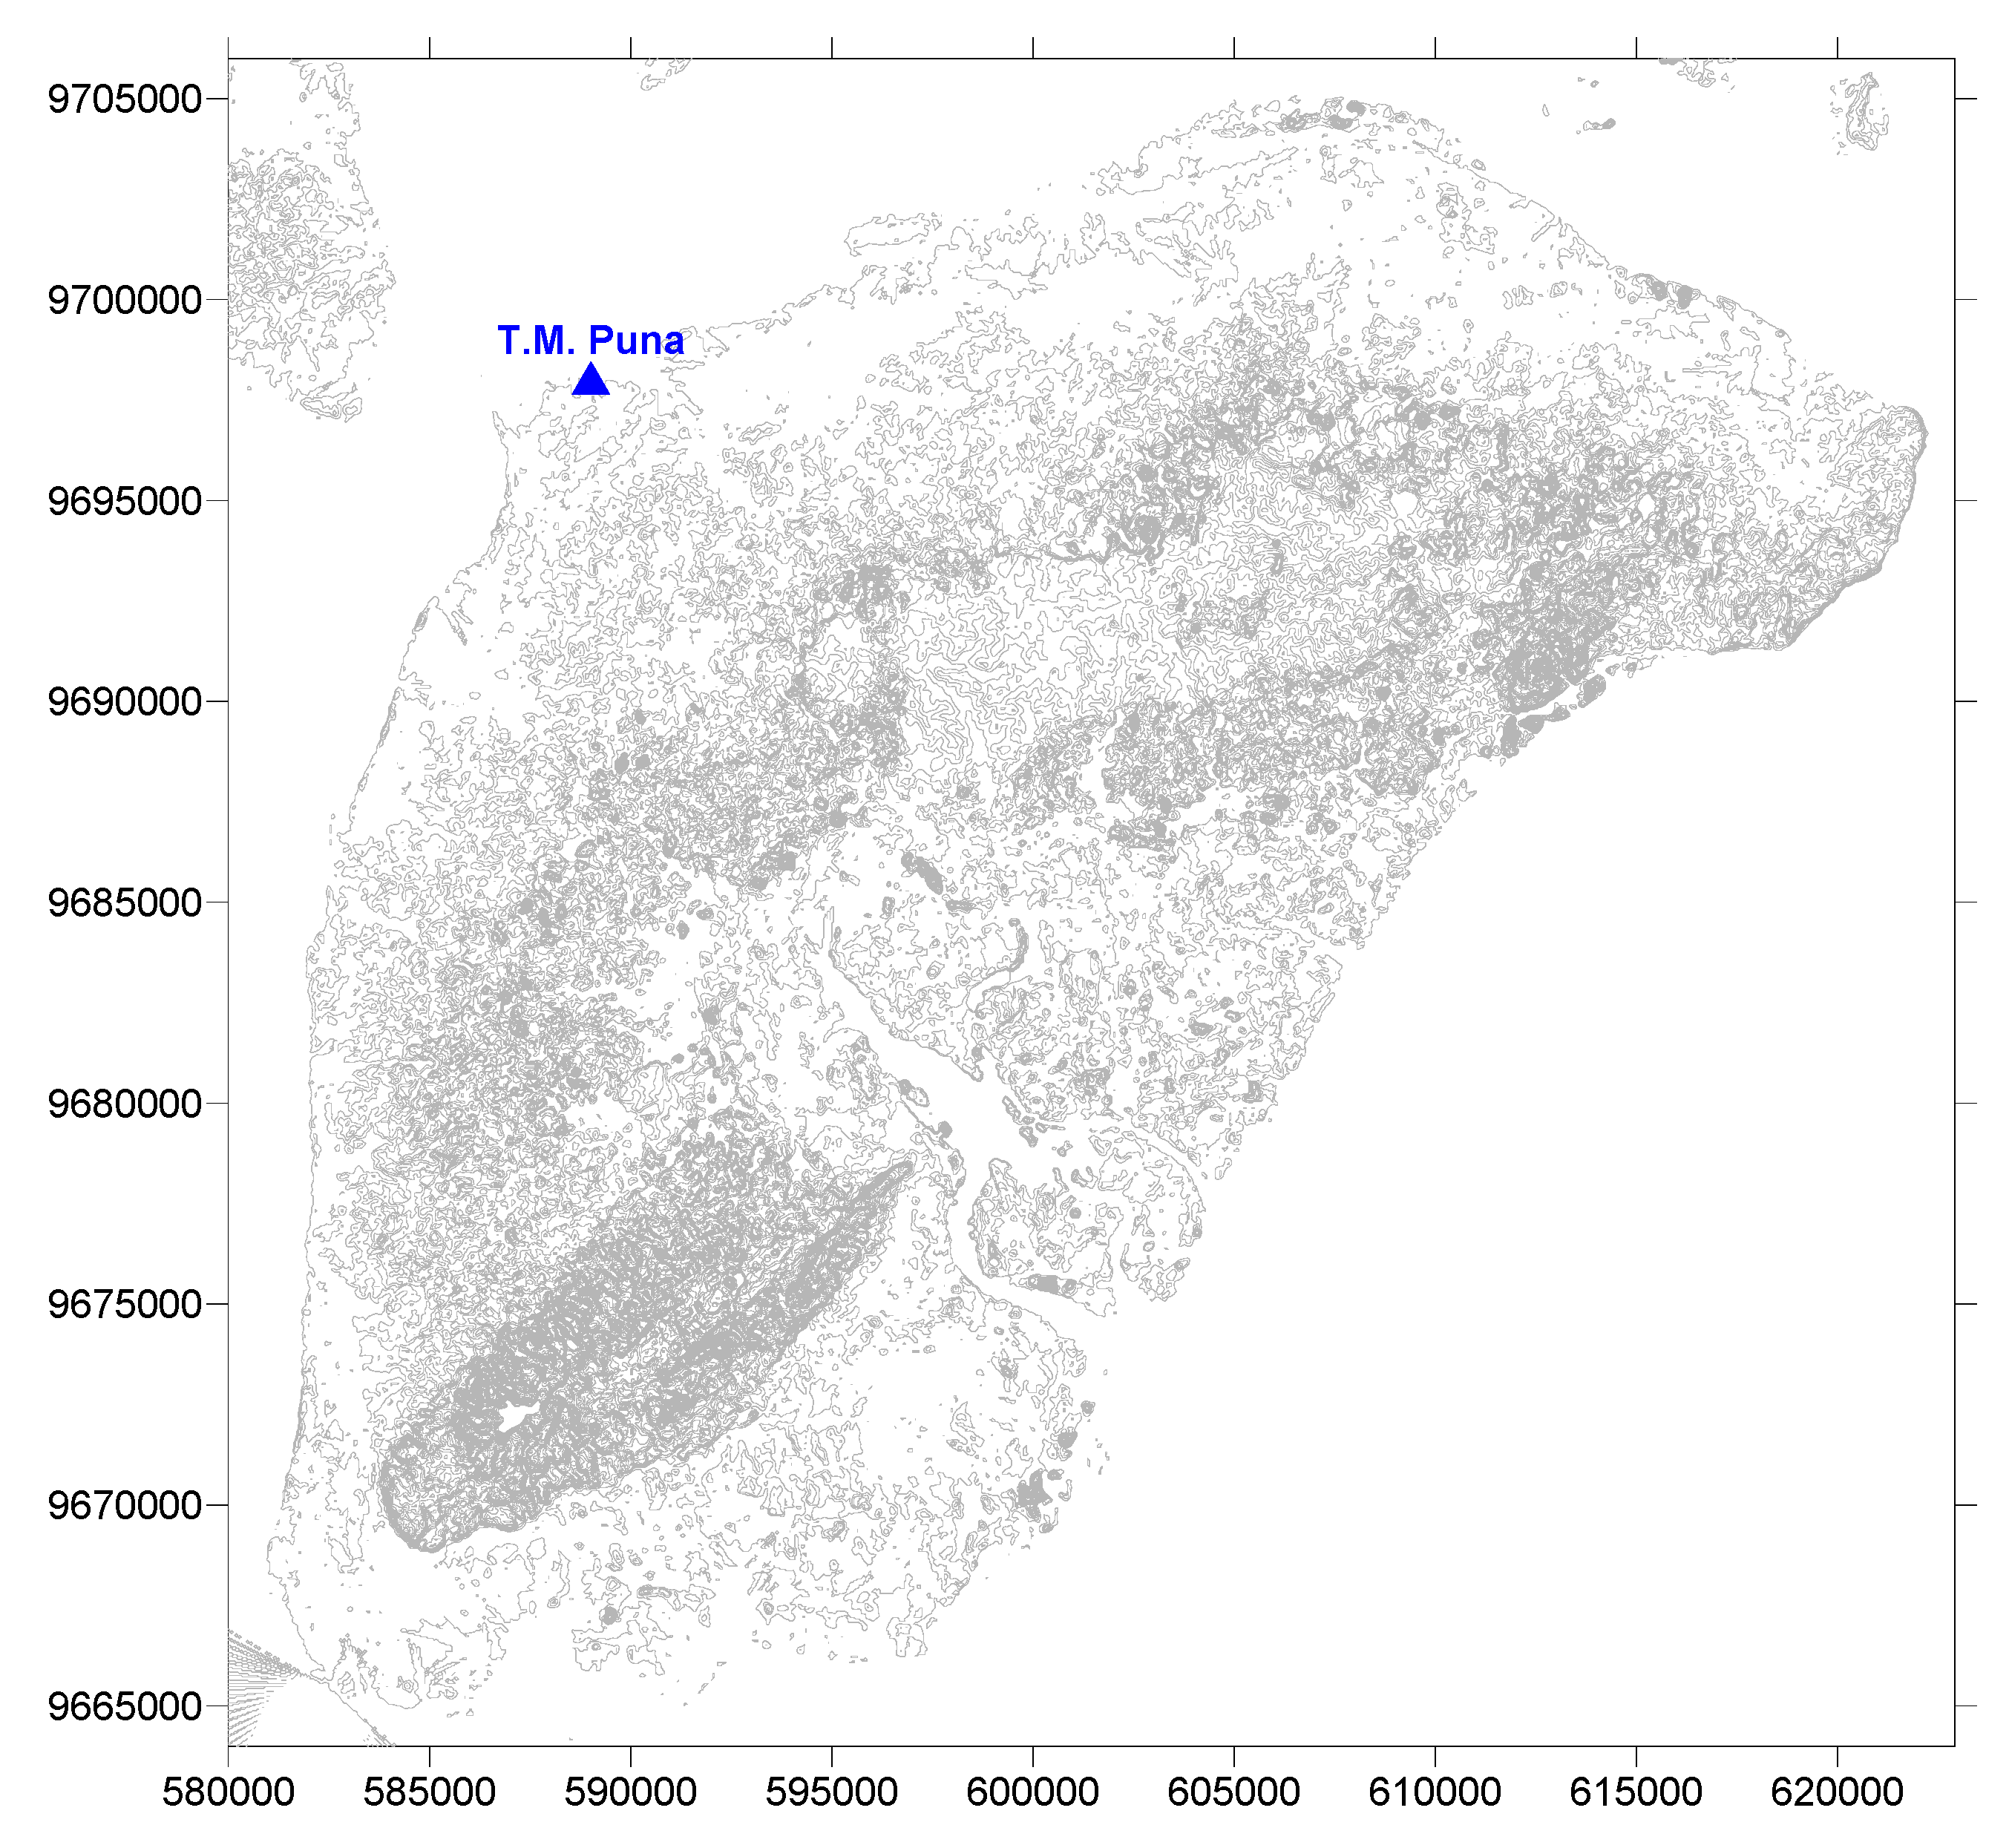
4.5. Contour Line Maps, Isotach Maps, and Wind Turbine Siting

A contour line map, isotach map at 120 m and contour lines spaced every 5 m for the entire island, are shown in Figure 15 and Figure 16, respectively. The topographical maps of the site, in which the contour lines and the available measurement device are represented, were obtained using WindPRO 3.2 software (downloaded from SRTM server).

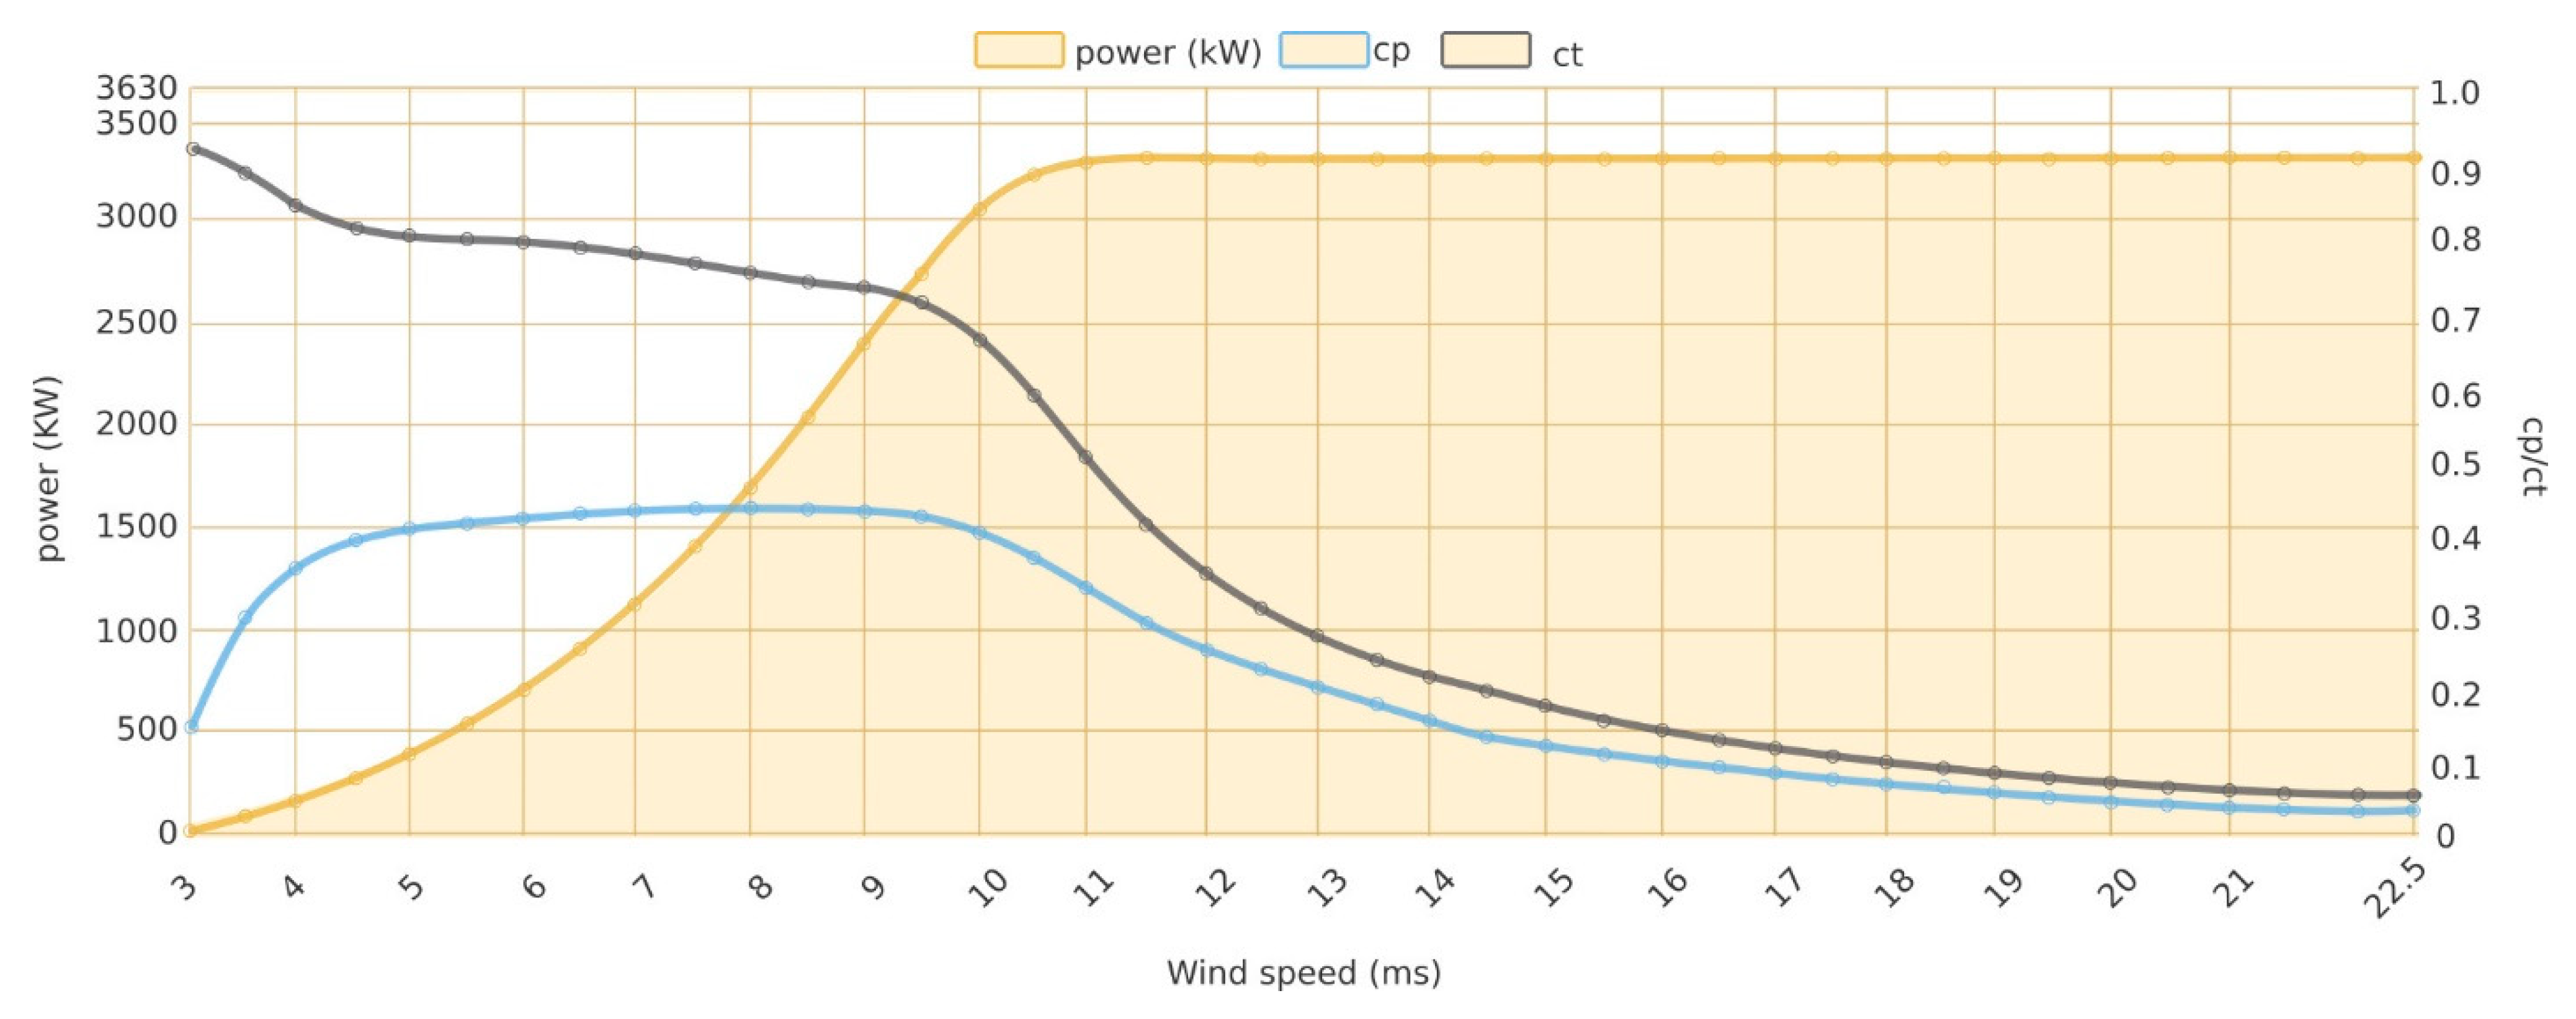
4.6. Wind Turbine Selection and Assessed Wind Power

As the wind resource has a low speed, low-speed wind turbines with considerable diameter sweeps and as high as possible should be used for energy production. The following wind turbine models meet these criteria: Gamesa G126-2.5 MW, Vestas V110-2.0 MW, and Vestas V126-3.3 MW. Considering that a higher power wind turbine equates to a higher power generated at low wind speeds, the last of the aforementioned models was used for the simulation. According to its power curve (see Figure 17), 179 and 711 kW could be generated at 5 and 6 m/s, respectively. According to simulations based on the software results of the gross mean output curve shown in Figure 18, depending on wind speeds and time of day, this wind turbine could generate minimum and maximum powers of 200 and 850 kW, respectively. Table 4 outlines the net power and annual energy production of five wind turbine models. As the diameter and height of the turbine increases, the production of electric power will be improved.

5. Conclusions and Recommendations

Several software programs are publicly available for use, as are a significant number of studies on wind resource assessment. Accordingly, in this type of project and especially because the study site was an island, the most complex task is the installation of an anemometer tower. On Puná Island, the low-density wind resource is classified as marginal, with a well-defined variation by time of day and a long-term mean speed of 4.8 m/s. Wind availability peaks in the afternoon hours, and the lowest values occur in the morning hours. Electricity production might be possible; however, due to the low mean wind speed, wind turbines with a considerable blade diameter, equal to or greater than 100 m, would have to be used. Therefore, the power of such turbines would be on the order of megawatts. In this study, the use of the Vestas V126-3.3 MW wind turbine model was simulated. However, this type of wind turbine has an estimated cost of one million US dollars per megawatt, which might limit possible funding.
Based on the mean power assessed in the simulation of this wind turbine model at low wind speed hours (see Figure 5), to generate 2.2 MW, which is currently the power installed on the island, approximately 10 wind turbines would be necessary. An alternative would be to concurrently operate a lesser number of wind turbines with diesel generators that are currently installed on the island, particularly during hours of low wind availability. In addition, because solar radiation peaks during the midday hours and subsequently decreases to zero at night, energy could be generated in the morning using a solar farm, whereas wind turbines would operate in the afternoon, evening, and night. For all alternatives, an accumulator system capable of storing excess wind or solar energy would ideally be coupled to the electrical grid to supply electricity during peak demand hours, maintaining the diesel generators as backup.
The use of wind resources would make it possible to replace not only diesel generators that provide electricity to the island but also a considerable number of stationary engines used for water pumping in shrimp farms. These machines contaminate the island environment not only with CO2 emissions but also with lubricant waste and discarded spare parts. For some of the island’s inhabitants, some of which have no access to electricity due to their distance from the electrical grid or lack of power installed, an alternative would be to install individual wind turbines. This option would also be valid for smaller islands in the area. To complete the research project, a feasibility study should be conducted to determine the following:
  • electricity demand of the island;
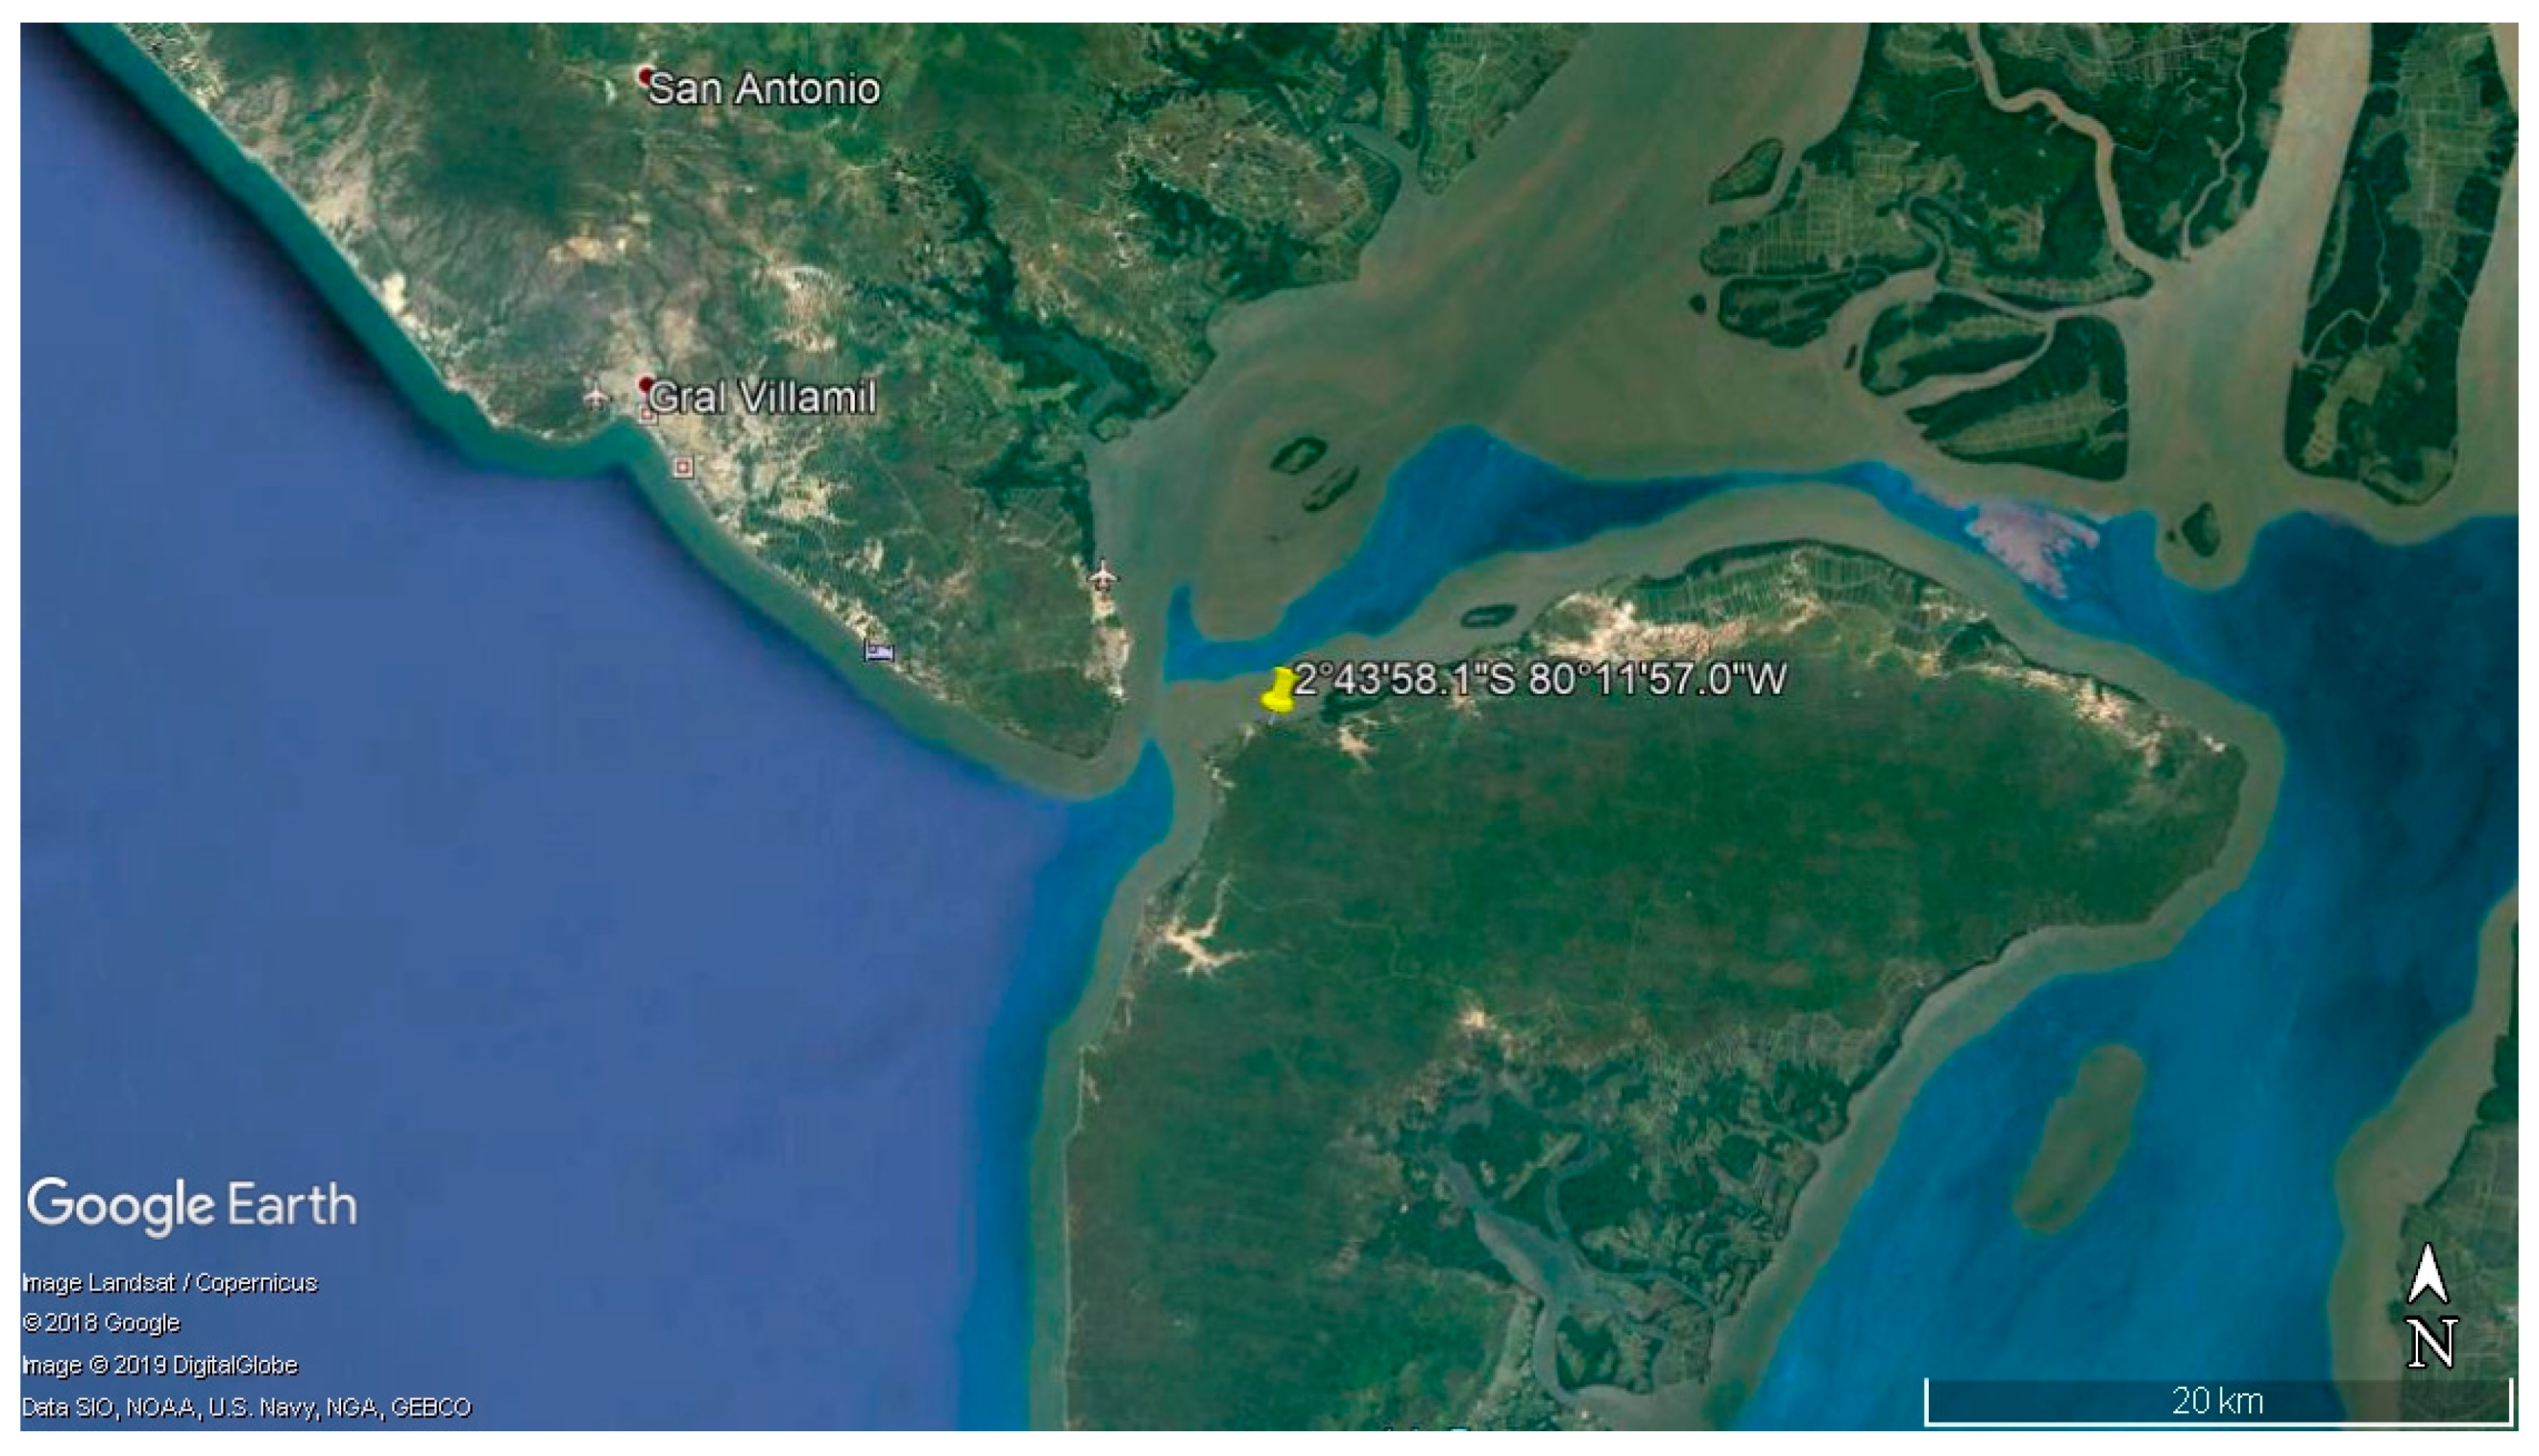
  • wind resources using an 80-m anemometer tower in several locations on the island, especially in the region closest to the Pacific Ocean (Punta Carnero);
  • civil engineering considerations (foundations for wind turbines, access roads, electrical grids);
  • type of coupling to the wind turbine grid (direct coupling or via accumulators); and
  • costs and funding.
Another key initiative would be to promote this study among different institutions to obtain financing for the next phase of the study and perhaps the development of a wind farm. The following institutions could be targeted: The Ministry of Energy, Ministry of the Environment, electric companies, and Guayaquil’s government. Development of a wind farm would not only supply clean and renewable energy to Puná Island but also create a research and training center.

Author Contributions

Conceptualization and methodology: Y.M., L.H.-C. and J.G.B.; software, validation and formal analysis: E.T.M., F.S. and A.L.E.; investigation: Y.M. and L.H.-C.; resources: J.G.B. and Y.M.; data curation: E.T.M. and Y.M.; writing—original draft preparation: Y.M.; writing—review and editing: L.H.-C.; supervision: O.D.-P. and L.H.-C.; project administration: Y.M.

Funding

This research was funded by the University of Guayaquil (Universidad de Guayaquil—UG), by Compañia Eólica de Tierras Altas (CETASA), the University of Valladolid (Universidad de Valladolid—UVA) and the Research Center for Energy Resources and Consumption Research (Centro de Investigación de Recursos y Consumos Energéticos—CIRCE).

Acknowledgments

The authors express their gratitude to Martha Heras and Miguel Ángel Hernández, CETASA, for their support in providing us with the equipment used in the tower. We also thank the anonymous reviewers who contributed to publishing the study.

Conflicts of Interest

The authors declare no conflict of interest.

References

  1. Gaceta Oficial del Muy Ilustre Municipio de Guayaquil. Available online: http://www.guayaquil.gob.ec/Gacetas/Periodo%202014-2019/Gaceta%2024.pdf (accessed on 3 September 2018).
  2. Los Delfines de la isla Puná. Available online: http://losdelfinesdelaislapuna.blogspot.com/2013/12/informacion-goegrafica.html (accessed on 3 September 2018).
  3. Google Maps. Available online: https://www.google.com/maps/ (accessed on 3 September 2018).
  4. Instituto Nacional Ecuatoriano de Estadisticas y Censo. Available online: http://www.ecuadorencifras.gob.ec/institucional/home/ (accessed on 20 April 2019).
  5. Navarrete, R.; Carcelén, F.; Sotomayor, P.; Pérez, J. Evaluación ecológica y Social de la Comuna Subida alta Parroquia Puná, Guayaquil. Provincia del Guayas. 2011. Available online: https://www.academia.edu/31048020/Evaluaci%C3%B3n_Ecol%C3%B3gica_Subida_Alta._Isla_Pun%C3%A1._Prov._Guayas._Ecuador (accessed on 10 April 2019).
  6. Pereira, M.; Freitas, M.; Da Silva, N. Rural electrification and energy poverty: Empirical evidences from Brazil. Renew. Sustain. Energy Rev. 2010, 14, 1229–1240. [Google Scholar] [CrossRef]
  7. Kaygusuz, K. Energy services and energy poverty for sustainable rural development. Renew. Sustain. Energy Rev. 2011, 15, 936–947. [Google Scholar] [CrossRef]
  8. Gonzalez-Longatt, F. Wind Resource Potential in Los Taques Venezuela. IEEE Lat. Am. Trans. 2011, 13, 1429–1437. [Google Scholar] [CrossRef]
  9. Guasch, J. Diseño de una Torre de Medición de Viento Para Auditoria del Recurso Eólico. Ph.D. Thesis, Departament d’ Enginyeria Electránica, Eléctrica i Automática, Universitat Rovira I Virgili, Tarragona, Cataluña, España, 2015. Available online: https://openair.rgu.ac.uk/bitstream/handle/10059/268/AndrawusThesis.pdf (accessed on 10 January 2017).
  10. Leslie, R. Power from Wind: A History of Windmill Technology, 1st ed.; Cambridge University Press: New York, NY, USA, 1996; ISBN 9780521566865. [Google Scholar]
  11. Köse, R. An evaluation of wind energy potential as a power generation source in Kutahya, Turkey. Energy Convers. Manag. 2004, 45, 1631–1641. [Google Scholar] [CrossRef]
  12. Domagalski, P.; Bardal, L. Vertical Wind Profiles in Non-neutral Conditions-Comparison of Models and Measurements from Frøya. J. Offshore Mech. Arct. Eng. 2019, 141, 041101. [Google Scholar] [CrossRef]
  13. Stevens, M.; Smulders, P. The estimation of the parameters of the Weibull wind speed distribution for wind energy utilization purposes. Wind Eng. 1979, 3, 132–145. [Google Scholar]
  14. Manwell, J.; McGowan, J.; Rogers, A. Wind Energy Explained. Theory, Design and Application, 2nd ed.; John Wiley and Sons: Gewerbestrasse, Switzerland, 2009; ISBN 978-0-470-01500-1. [Google Scholar]
  15. Vestas. Available online: https://en.wind-turbine-models.com/turbines/695-vestas-v126-3.3 (accessed on 12 April 2019).
  16. Ayodele, T.; Ogunjuyigbe, A.; Amusan, T. Techno-economic analysis of utilizing wind energy for water pumping in some selected communities of Oyo State, Nigeria. Renew. Sustain. Energy Rev. 2018, 91, 335–343. [Google Scholar] [CrossRef]
  17. Bekele, G.; Palm, B. Wind energy potential assessment at four typical locations in Ethiopia. Appl. Energy 2009, 86, 388–396. [Google Scholar] [CrossRef]
  18. Mostafaeipour, A.; Sedaghat, A.; Dehghan-Niri, A.; Kalantar, V. Wind energy feasibility study for city of Shahrbabak in Iran. Renew. Sustain. Energy Rev. 2011, 15, 2545–2556. [Google Scholar] [CrossRef]
Figure 1. Satellite view of Puná Island. Source: [3].
Applsci 09 02923 g001
Figure 2. Methodology for studies on wind resource assessment.
Applsci 09 02923 g002
Figure 3. Location of the anemometric tower on Puná island. Source: [3].
Applsci 09 02923 g003
Figure 4. Details of design and assembly of the anemometer tower.
Applsci 09 02923 g004
Figure 5. (a) Frequency histogram and Weibull distribution of wind speed for Puná Island. Source: generated by the software. (b). Frequency histogram and several frequency distributions of wind speed for Puná Island. Source: generated by the software.
Applsci 09 02923 g005
Figure 6. Mean diurnal profile of wind speed. Source: generated by the software.
Applsci 09 02923 g006
Figure 7. Correlation between wind speed values from different anemometers at 40 and 20 m height. Source: generated by the software.
Applsci 09 02923 g007
Figure 8. Wind direction frequency. Source: generated by the software.
Applsci 09 02923 g008
Figure 9. Wind direction as a function of mean speed. Source: generated by the software.
Applsci 09 02923 g009
Figure 10. Wind variation as a function of height above ground. Source: generated by the software.
Applsci 09 02923 g010
Figure 11. Alpha coefficient, according to the month of the year and time of day. Source: generated by the software.
Applsci 09 02923 g011
Figure 12. Wind turbulence as a function of time of day. Source: generated by the software.
Applsci 09 02923 g012
Figure 13. Comparison between wind speed and wind turbulence intensity. Source: generated by the software.
Applsci 09 02923 g013
Figure 14. Representative turbulence intensity vs. wind direction. Source: generated by the software.
Applsci 09 02923 g014
Figure 15. Contour line and isotach map of Puná Island.
Applsci 09 02923 g015
Figure 16. Contour lines every 5 m.
Applsci 09 02923 g016
Figure 17. Power curve of the Vestas V126-3.3 MW wind turbine. Source: [15].
Applsci 09 02923 g017
Figure 18. Gross mean power output of the Vestas V126-3.3 MW wind turbine. Source: generated by the software.
Applsci 09 02923 g018
Table 1. Geographical coordinates of the perimeter of Puná Island. Source: [1].
PointGeographical CoordinatesPointGeographical Coordinates
XYXY
1571,331.999,705,877.726589,765.939,702,878.50
2572,464.239,705,608.007585,466.929,698,762.99
3576,440.609,706,019.368584,241.359,694,975.13
4578,109.749,706,338.389577,967.609,694,979.36
5583,024.359,707,088.1310577,968.029,698,883.58
Table 2. Costs of equipment and materials used.
ITEMNumberUnit of MeasurementUnit Value (USD)Total Value (USD)
Meters of anemometer tower 40meters1004000
Tower assembly1overall10001000
Construction of the concrete foundation to erect the tower 4units2501000
Lease of the land where the anemometer tower was installed12month4004800
Transportation and food1overall500500
Internet for data transmission12month20240
Data logger NRG Symphonie Plus 31units20002000
Anemometers (WindSensor P2546-OPR)2units381.3762.6
Wind vane NRG 200P 2units262524
Temperature sensor 10S1units250250
Barometric pressure sensor BP201units402402
Relative humidity sensor RH5X1units445445
20-Watt solar panel1units5050
70-Ah battery1units100100
Franklin’s lightning rod1units150150
3 × 16 concentric cable2roll60120
Electric board1units6060
6-mm steel cable300m1300
3/4″ turnbuckles21units10210
3/4″ ground rod70units170
TOTAL 16,983.60
Table 3. Mean wind speed, frequency, and energy as function of direction. Source: the authors.
SectorMidpointFrequency (%)Mean (m/s) vs. ‘Direction 0 A’Proportion of Total Wind Energy (%)
Direction 0 ADirection 0 BSpeed 40 mSpeed 20 mSpeed 40 mSpeed 20 m
11.771.752.6251.9630.530.34
222.5°2.432.292.7291.9330.740.42
345°3.42.63.0062.3011.290.93
467.5°21.335.144.6614.00724.2124.39
590°40.7739.655.0034.35755.6256.89
6112.5°13.5425.544.1223.45610.889.8
7135°4.718.373.5343.0862.562.63
8157.5°2.743.582.7972.5750.811
9180°1.772.422.5672.2860.450.5
10202.5°1.631.812.8662.6810.510.64
11225°1.771.873.7623.4951.331.57
12247.5°0.611.193.022.720.270.31
13270°0.590.472.4552.0850.170.16
14292.5°0.940,712.2971.8240,170,13
15315°0,941.232.1961.5720.170.09
16337.5°1.061.362.6131.9350.290.19
Table 4. Power and energy of several wind turbine models. Source: the authors.
TurbineValid Time SamplesHub Height Wind Speed (m/s)Percentage of Time atSimple MeanMean of Monthly Means
Zero PowerRated PowerNet Power (kW)Net AEPNCFNet Power (kW)Net AEPNCF
(kWh/yr)(%)(kWh/yr)(%)
Vestas V126-3.3 MW IEC IIIA (90 m)31914.948.260466.24,083,96714.13466.24,083,96014.13
Gamesa G80-2.0 MW (80 m)31914.8213.330175.11,533,9618.76175.11,533,9628.76
GE 2.75-100 (80 m)31914.8213.9902121,856,8097.712121,856,8077.71
Suzlon S66-1.25 MW (80 m)31914.8213.890104.5915,0888.36104.5915,0848.36
Vestas V100-1.8 MW 60 Hz (80 m)31914.828.830292.32,560,84816.11292.32,560,85116.11

