1. Introduction
Artificial intelligence (AI) plays an important role in assisting medical experts with early disease diagnosis. There are a large number of AI-based disease detection and classification systems combining medical test results and domain knowledge [
1,
2,
3,
4,
5,
6]. However, correlating the actual symptoms and clinical observations with the corresponding diseases is missing in most of these systems. This is perhaps owing to the variety of observation recording methods by medical experts. For example, some use symbols for diagnosis, whereas others give a textual description; hence, there is no standard method. Therefore, this data should be manually converted into a standard format so that machines can use it for analysis. This limits the size of data used in any analytical study, which is the main cause of current gaps in human-knowledge-based diagnosis and machine-intelligence-based predictions.
Commonly, ophthalmic diseases are not life threatening; however, progress over time can have significant impact on the patient’s life. Physical examinations are performed using ophthalmological instruments and a comprehensive interpretation is used for diagnosis. Therefore, any machine-based solution should concurrently consider observations, symptoms and standardized test results for predictions. Furthermore, the use of a standard description for clinical data and medical test results can be the key to success. The first step toward this is the use of health records in electronic form. Maintaining patient information as digital data has several potential benefits, including rapid retrieval along with timely data transmission among multiple medical experts [
7]. Moreover, the use of standard taxonomies for patient data recording can further improve its quality, accuracy and consistency.
This study focuses on developing a general framework for the standardized recording of patient symptoms and clinical observations, thus assisting medical experts in keeping up with the exponential development of medical knowledge arising from clinical trials and logical advancements in the field. Similarly, medical cases solved in the past may greatly contribute to the training of machine-learning agents for accurate diagnosis [
8]. This is also important because machine-learning algorithms can analyze the large number of features required for diagnosis more effectively than humans. Accordingly, intelligent agents, using a carefully designed multi-agent-based classification model, can outperform humans by efficiently analyzing all the features along with previous information [
9].
The rest of the paper is organized as follows. In
Section 2, existing machine-based solutions for medical diagnosis are briefly described. In
Section 3, the proposed methods for data modeling and pre-processing are explained, as well as the framework designed for analyzing and predicting eye diseases. In
Section 4, the results are described and the paper is concluded in
Section 5.
2. Related Work
A large amount of research has been conducted on developing medical expert systems to automate diagnostic processes [
2,
4,
10,
11,
12]. These expert systems can produce accurate responses based on pre-defined rules; however, the use of static rules results in restricted learning and therefore failure to respond to new situations. With the advancement in machine learning algorithms, the focus shifted toward machine learning through training data. Hence, almost all medical fields, in particular ophthalmology, are now experiencing rapid growth in machine-based research activities. A brief review of related work will now be provided.
In References [
4,
13,
14,
15,
16], textual and numeric data was used for certain eye problems, namely, dry eye diseases, refractive error, esotropic eyes and progression in glaucomatous visual field defects. Moreover, probabilistic classifiers such as naïve Bayes and support vector machines were used. In 2011, research on cataract disease was conducted by the Electronic Medical Records and Genomics Network. ICD-9 (International Classification of Diseases) [
17] codes and current procedural terminology codes were used for cataract diagnosis in patients without surgery. Furthermore, natural language processing (NLP) and intelligent character recognition (ICR) were the machine-learning techniques used to identify cataract cases and their type. Specifically, written documents were scanned and after ICR and NLP were performed, they were used in the diagnosis process [
18,
19]. In 2014, a study was conducted to analyze clinical data for finding the relationship between signs and diagnosis of dry eyes disease [
20]. The dataset was obtained from 344 patients and the analysis was based on independent component analysis (ICA) and Pearson correlations. The highest correlations were found between conjunctiva and corneal staining. Furthermore, each component of the ICA mixing matrix exhibited minimal residual information. Consequently, no consistent relationship was found among the most frequently used signs and symptoms.
Moreover, a number of studies focused on analyzing image data for direct conversion into diagnostic data. In 2018, research was conducted into blood vessel segmentation [
21] using image-processing methods based on machine-learning methods. Vessel segmentation process is divided into four categories including vessel enhancement, machine learning, deformable models and tracking. Reference [
21] also provides a recent survey of the methods that can be used in this type of research and Reference [
22] provides an earlier such survey. The most common disease leading to blindness is glaucoma [
1], for which image-based detection was relatively more efficient than for other diseases. In References [
3,
23,
24,
25], algorithms were used for the detection of abnormal retina along with the classification of a normal retina. Furthermore, multiple diagnostic images of the retinas were used along with patient clinical records. In Reference [
26], a survey of various computer-based ocular disease identification methods was presented. Multilayer perceptron, support vector machines and linear and quadratic discriminant classifiers were found to be more successful in identifying different eye problems.
As previously mentioned, the most common but dangerous eye disease is currently glaucoma. Optical coherence tomography (OCT) images are used for its diagnosis and therefore they should be classified for computer-aided glaucoma detection [
1,
6,
27,
28,
29,
30,
31]. Similarly, in Reference [
32], imaging data was used for identifying intraocular lenses and refractive surgery. EyeView was used to optimize vision quality. Furthermore, computing solutions have been presented for identifying specific eye diseases such as age-related macular degradation [
33], for the auto-detection of a diabetic retina [
34,
35] and for automatic localization of the optic disc using image classification with support vector machines [
5].
Moreover, to predict cataracts, visual quality was determined using contrast sensitivity in Reference [
32]. Then, Fageeri et al. [
16] diagnosed refractive error based on the spherical, cylindrical and axis values of wearing glasses. The model was based on decision tree, naïve Bayes and support vector machine classification algorithms and used four classes of patients suffering from hyperopia astigmatism, myopia (nearsightedness), myopia astigmatism and hyperopia (farsightedness). The analysis was conducted using the Waikato environment for knowledge analysis and the proposed model was used for disease classification and for determining the relationship between symptoms and diagnosis with accuracy up to 98.75%. In Reference [
36], a gene network was designed to define disease expression involving the determinants corresponding to nodes.
Table 1 presents some recently published research work in medical or related domains using different machine-learning algorithms. Mostly researchers focused on using sophisticated machine-learning methods such as Naïve Bayes, SVM and Deep Learning algorithms to improve classification accuracy. However, no effort has been directed towards data modeling, which, however, can improve the classification or prediction of results. Therefore, this requirement has become the basis of the current study.
3. Methodology Adopted
The literature review demonstrated that almost all existing studies are disease based and, thus, the algorithms developed or used were tested for specific eye diseases, for example, glaucoma disease prediction in Reference [
13] and refractive error classification in Reference [
16]. Accordingly, no general solution is available. This is primarily due to the lack of standardization in recording medical information, a major difficulty that has hindered general automated solutions. A critical challenge in applying machine-learning methods to data obtained by multiple experts is inconsistencies owing to differences in expression style/vocabulary for disease description and diagnosis. Hence, a standardized framework is required to facilitate direct data entry by experts as efficiently as possible, which in turn may facilitate classification, as shown in the results section of this paper (
Section 4). Overall, the following are the innovative contributions this paper makes:
Automatic conversion of data into a structured format directly collected from medical experts using ICD coding;
State-of-the-art data modeling for fast and accurate disease classification;
Support for features selection in classification;
Dynamic updating of codes to incorporate new symptoms and clinical observations; and
Improved classification results using conventional machine-learning methods.
3.1. Data Modeling
To resolve the ambiguity caused by variations in medical language when representing the same concepts, controlled terminologies have been established, ensuring effective communication across health care entities and information systems. These terminologies map synonyms of medical terms to a common concept so that similar objects can be grouped together, thereby providing the infrastructure to support powerful features such as retrospective data analysis, prospective clinical trials and evidence-based practice [
7]. Various standards in medical terminologies are available, such as the 10th version of International Classification of Diseases (ICD-10), Systematized Nomenclature of Medicine, Clinical Terms and Medical Entities Dictionary [
7].
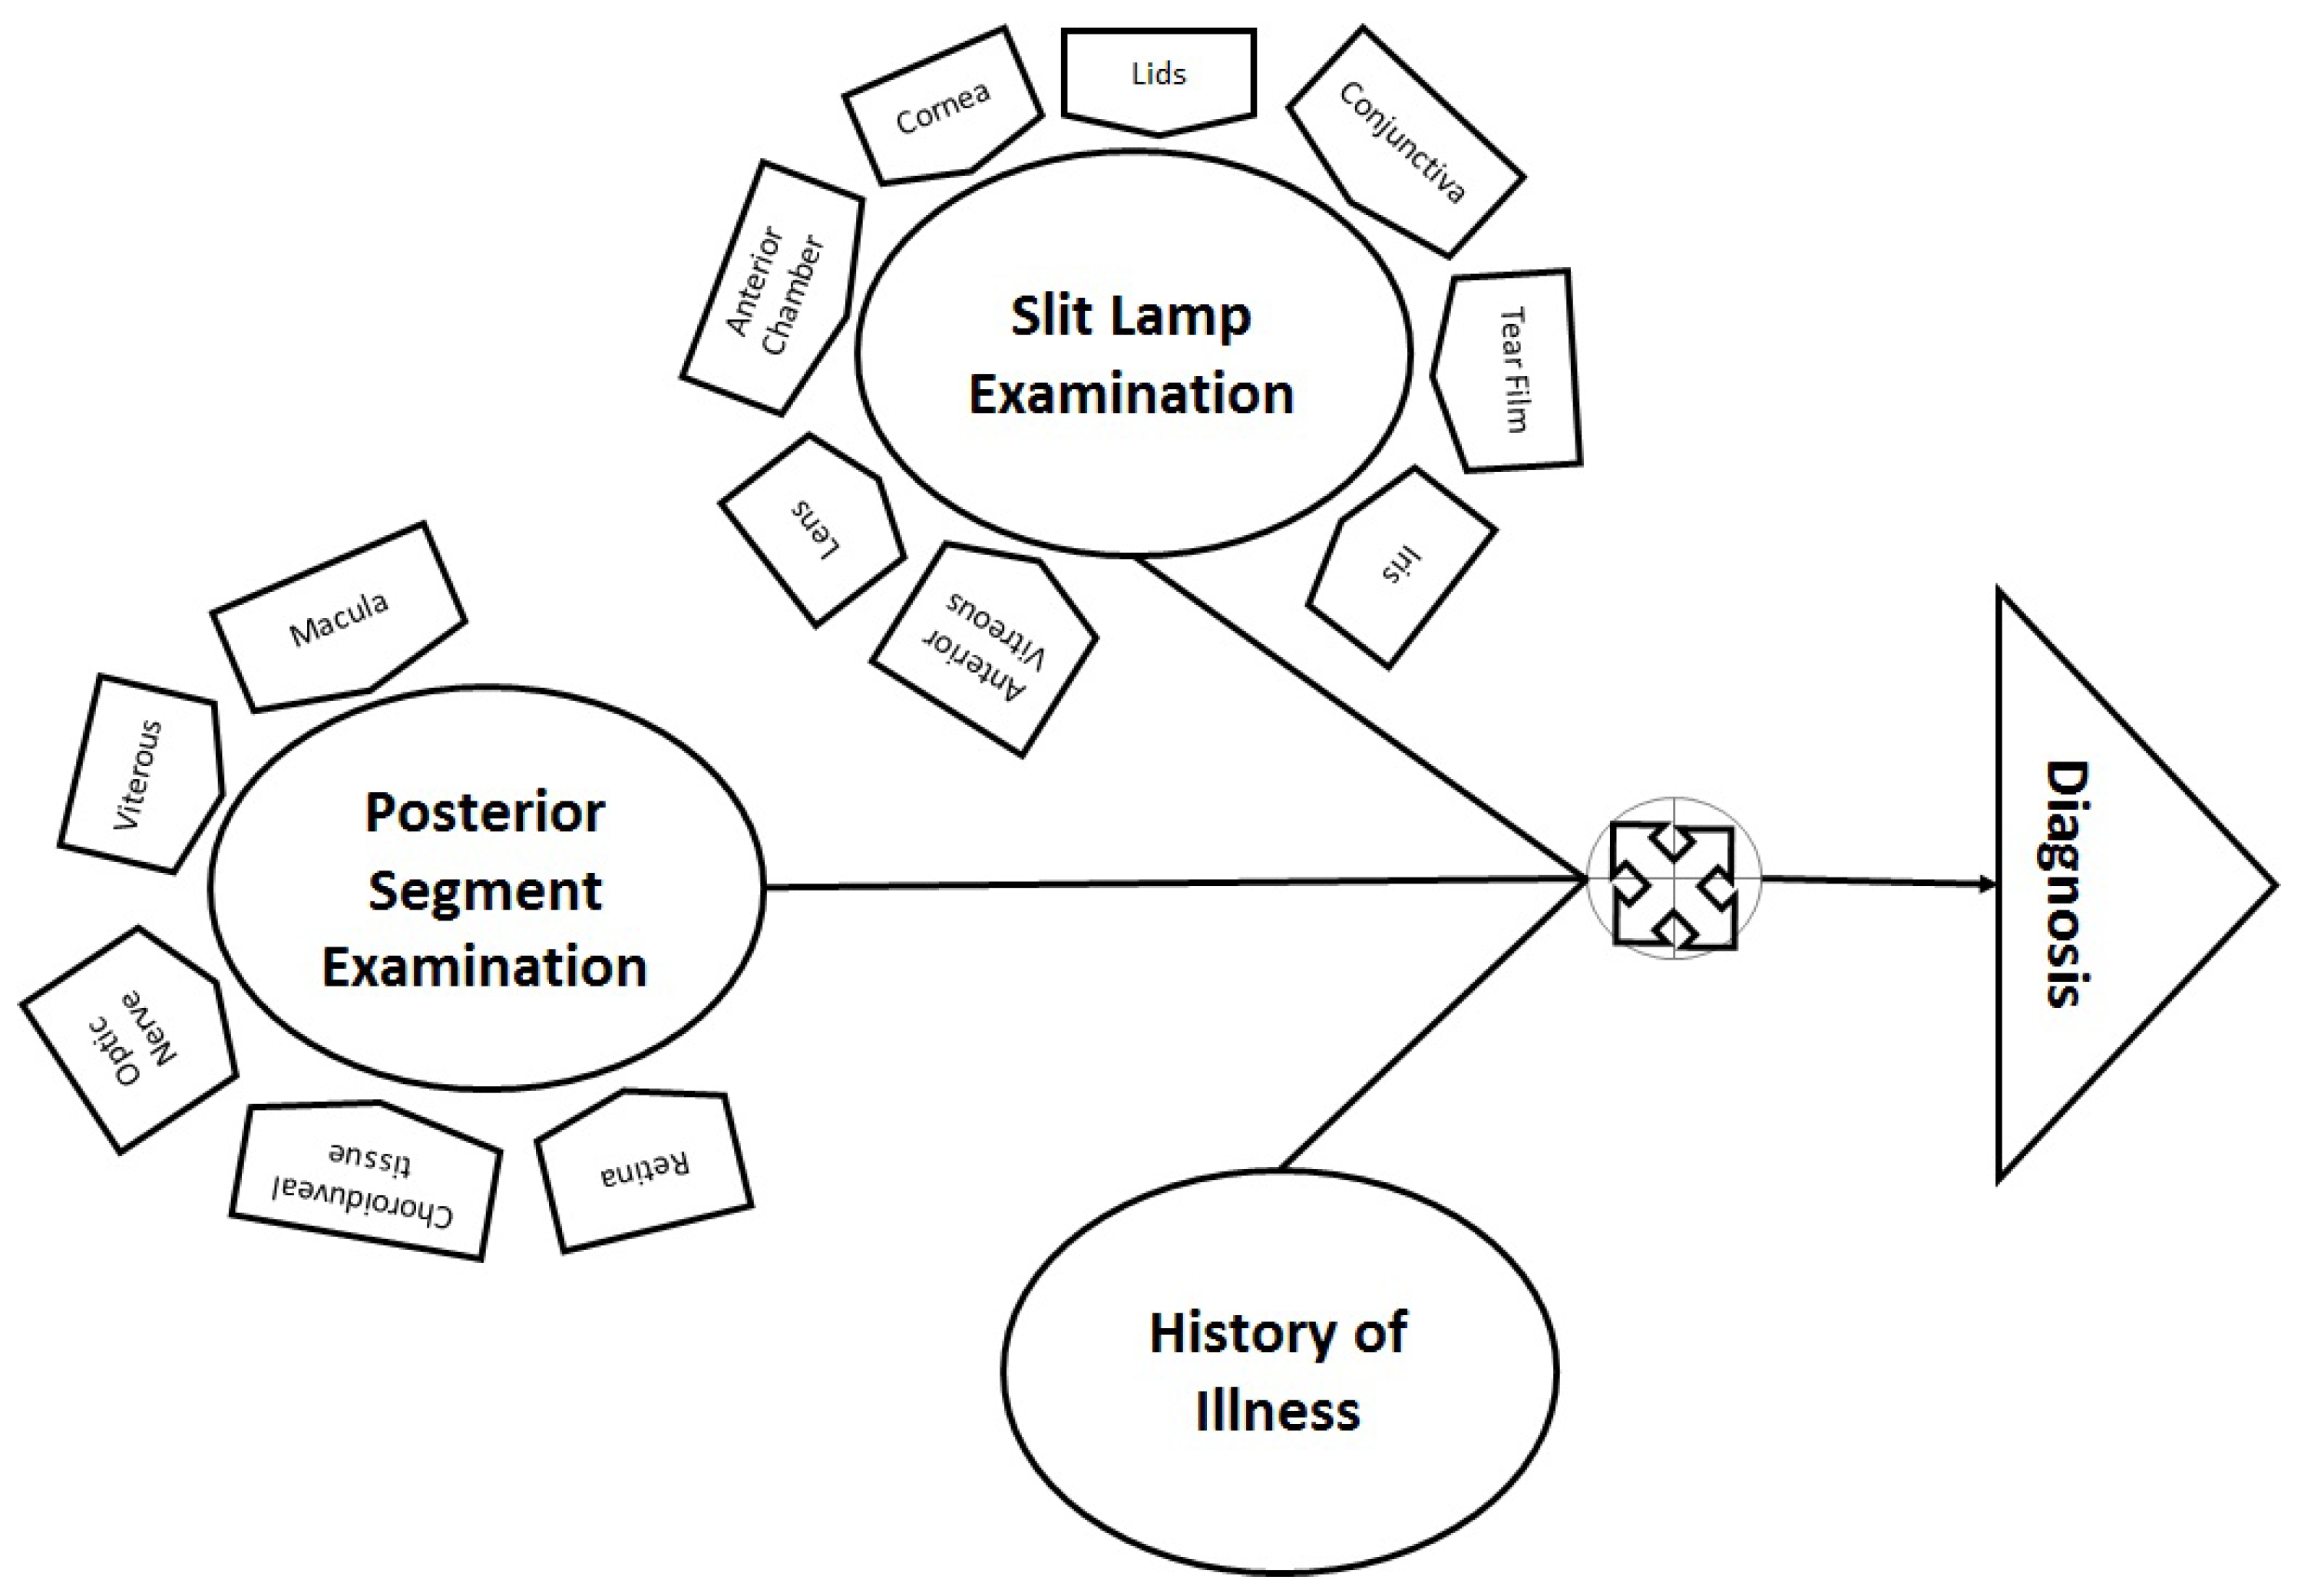
In ophthalmology, multiple factors are considered, such as illness history (including general health information), anterior eye examination (through a slit lamp) and posterior segment examination (through a specialized lens). Therefore, data from slit lamp examination and posterior segment examination are combined for diagnosis, as shown in
Figure 1. ICD-10 [
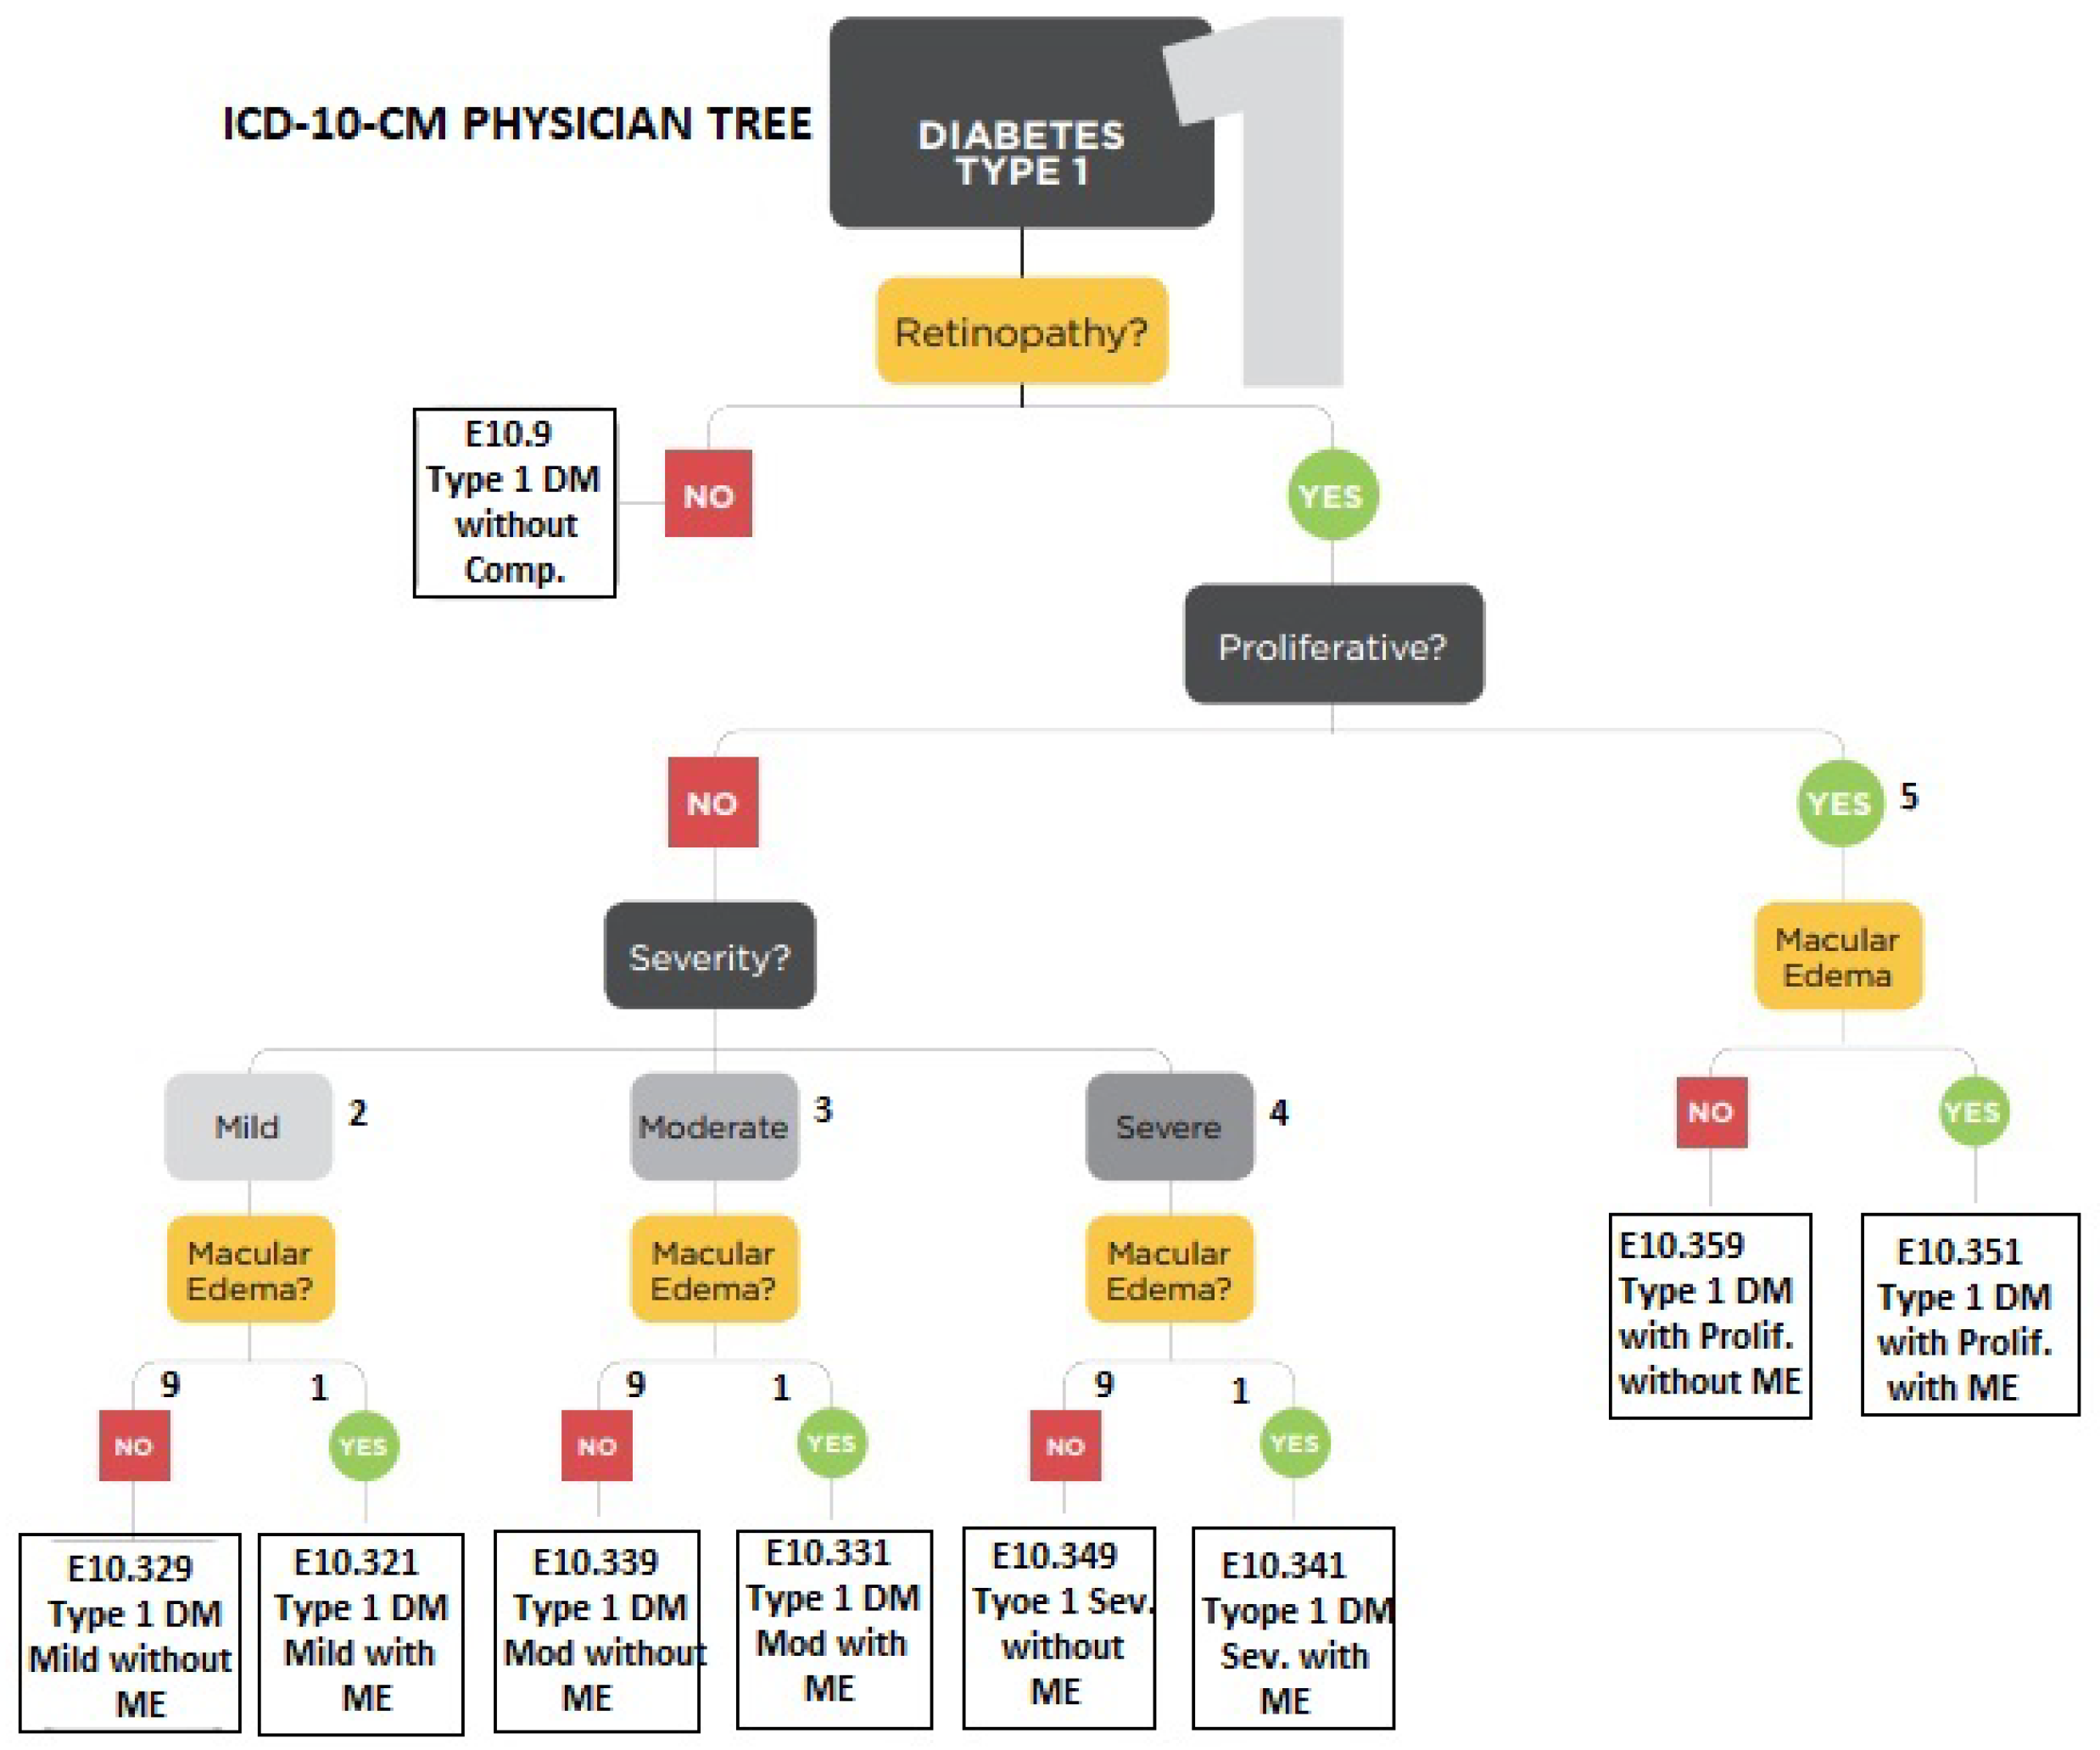
17] is also based on structured hierarchies for eye-related disease diagnosis. Therefore, these examinations were used for AI-based learning and were arranged in a hierarchical structure similar to the physician decision tree shown in
Figure 2. After rigorous analysis and discussion with experts, the most suitable hierarchical structures of ICD-10 coding for eye diseases were adopted. Diagnosis consisted of multiple levels, according to the existing eye problem. There were a maximum of six levels involved in the definition of any symptom. However, for flexibility, less than six hierarchical levels were required for cases where the disease is at a premature stage. Therefore, in the proposed framework, the definition of a symptom varies according to the situation. An example of a symptom identified from slit examination can be seen below.
Cornea Endothelium KPs Fine Site Generalized
Moreover, recording data in this form is impossible during the examination, as the doctor cannot ignore the patient while writing down all required elements of a symptom. Therefore, a highly efficient method is required to ensure accurate data entry and, hence, an interface for web applications was developed so that the doctor or any other medical expert needs to click only three times (on average) to select the entire hierarchy of a particular symptom.
Figure 3 shows the definition of a symptom using a graphical user interface. The mouse is pointed to the plus symbol of “Cornea” for either the right or the left eye and the next level of available options appears as a dropdown menu. When the user further hovers the mouse over “Endothelium” the next level of available options appears. Continuing further, multiple options appear for the final definition of the symptom. Finally, the last option is selected and all the above levels are concatenated. In the example, when “Generalized” is selected, the complete hierarchy will be displayed.
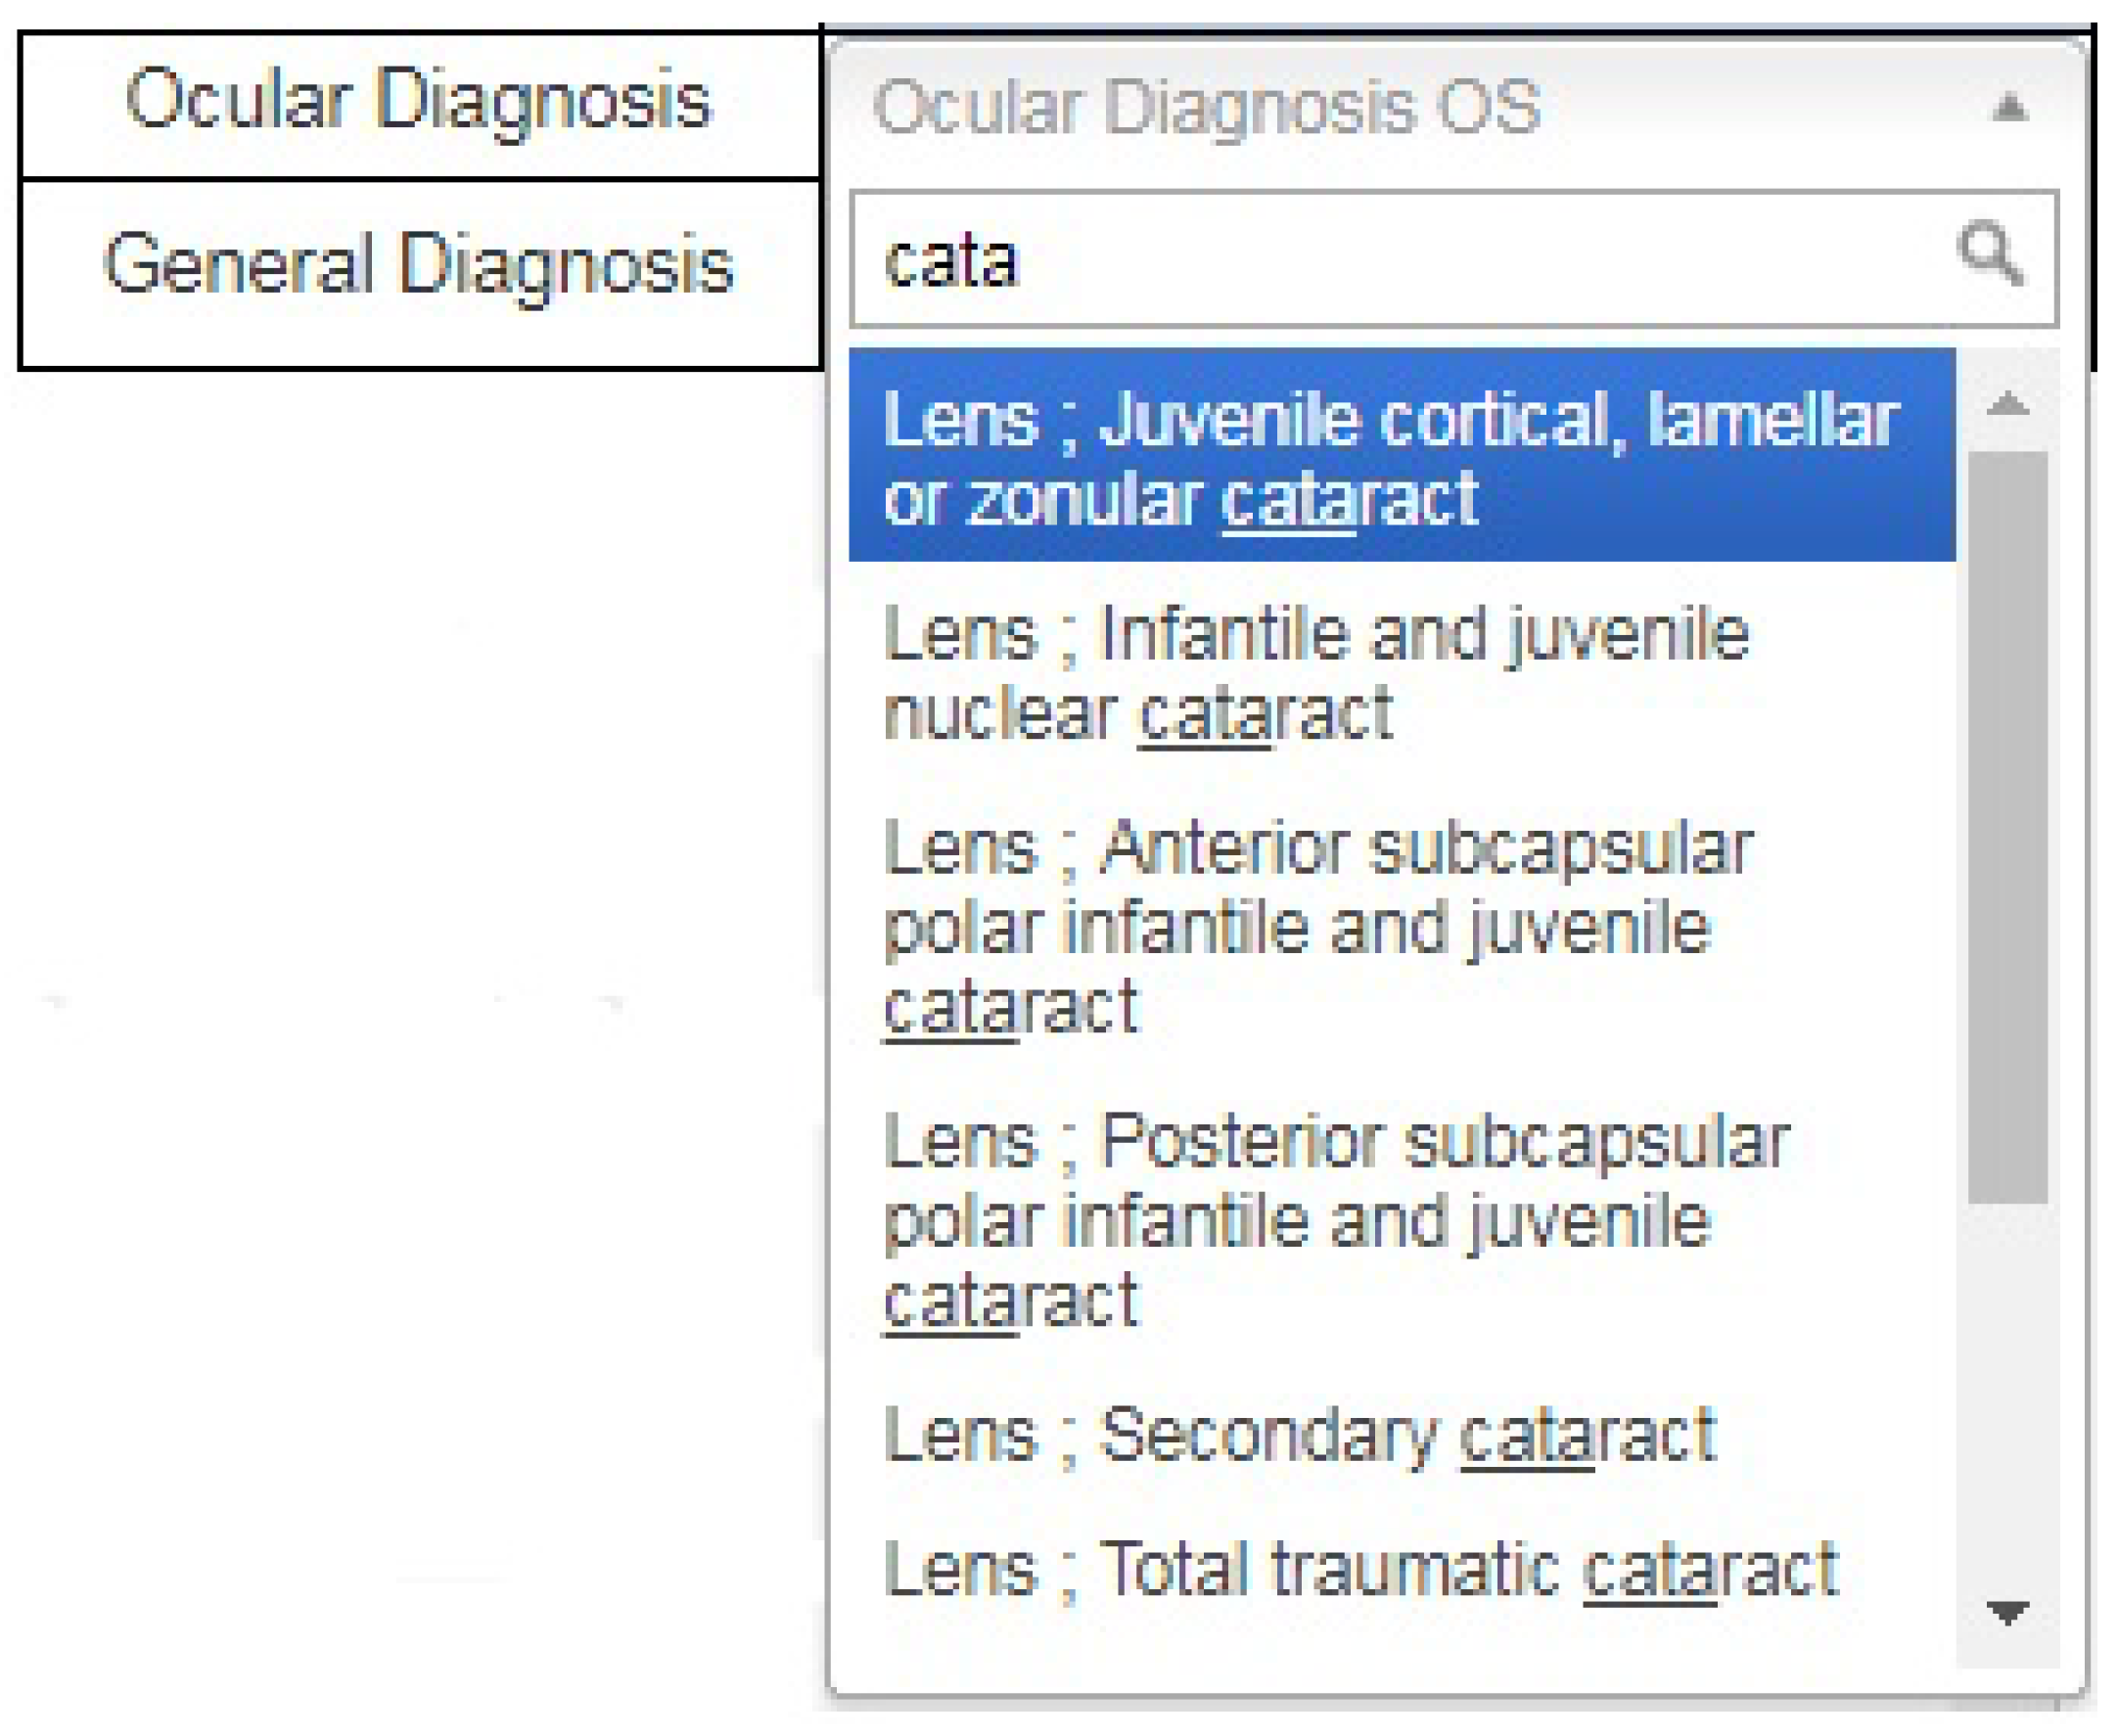
Furthermore, a graphical user interface was also developed for providing a diagnosis in standard format. This is achieved by introducing a search option in the diagnosis dropdown menu because it is difficult to scroll through all available options to reach the required diagnosis. After entering the keywords, the user clicks on the desired diagnosis in a standard format, as shown in
Figure 4. This approach has the advantage of obtaining the same data format from all users.
Thereby, all the symptoms as well as the diagnosis are stored, providing the foundation for machine learning. Initially, the predicted results are compared with the actual diagnosis by medical experts. As shown in the results section, the predicted results may be as accurate as the expert opinion by increasing the amount of data.
Data recording does not end there. For machine-learning algorithms, searching is the most important step and the characters in a symptom are difficult to match efficiently and accurately. Furthermore, the selection order results in false matches. If, for example, lid swelling is selected as the first symptom, followed by three other symptoms but some other expert selects the symptoms in a different order, the machine considers that two separate eye problems are defined. Therefore, symptoms are stored as ordered numeric codes.
Table 2 describes different symptoms and their corresponding codes, as recorded for a patient. Mathematically, the numbers 452,111 and 452 are considered to be far apart but, in the proposed system, they belong to the same hierarchy and should thus be grouped together. Therefore, to unify coding, zeros are appended to the symptom code so that all codes contain six digits, that is, 452,111 and 452,000 for the aforementioned case. The absence of a symptom is represented by six zeros.
3.2. Data Collection and Description
The dataset used in the present study was composed of real-time data on which data mining techniques and classification algorithms were applied. Professional doctors directly recorded the data for research and development and confidentiality was assured.
Table 3 shows the size and description of the dataset. There are 10 attributes, namely, age, gender, complaint, VA (left eye), VA (right eye), pinhole (left eye), pin hole (right eye), slit lamp exam, posterior segment exam and diagnosis. Among these, only age is numeric, whereas all others are nominal and diagnosis is a class attribute with nominal values.
3.3. Data Pre-Processing
In order that machine learning be performed in accordance with medical rules, pre-processing is required that involves data cleaning and normalization, noisy data filtering and handling of missing values [
16]. It is important to mention that data pre-processing highly affects the performance of machine-learning algorithms and, if not performed properly, it may produce biased output [
49]. The Weka knowledge analysis tool provides various pre-processing and transformation algorithms.
Feature selection and extraction are aimed at a more robust machine-learning process by identifying and removing irrelevant attributes from the dataset to reduce dimensionality and improve performance. However, ignoring a small symptom may have serious consequences. Fortunately, standard taxonomies eliminate unnecessary data and, therefore, no feature is ignored in analysis and diagnosis.
Missing values may also adversely affect machine learning. In this study, two techniques were used for handling missing values, namely, deletion of records with more than 60% missing values and a two-step diagnostic method using segmentation, which will be explained later.
3.4. Methods
A number of classification algorithms are in use in the medical domain with the promise of increasing reliability and confidence [
50,
51]. One can easily select a classifier according to the data, whether parametric or non-parametric [
52,
53]. Tree based methods such as Decision Tree and Random Forest are non-parametric classifiers and, therefore, can be applied to the data whose distribution in not know. As in the medical domain collecting normally distributed data is almost impossible, non-parametric methods are always helpful [
54]. However, some other classifiers such as Neural Network, Naïve Bayes and Support Vector Machines have also been very popular in classifying diagnostic data but use assumptions to simplify the learning process and sometimes lead to a higher error rate. All the same, for some classes of disease, such as for cancers, Support Vector Machines can have a valuable role and to that end the reader is referred to Reference [
55]. Herein, we have used a mix of both types of classification algorithms that include decision tree, random forest, naïve Bayes and neural networks. The purpose is to identify the impact of the proposed data modeling method upon classification accuracy. Weka [
56] was used for model implementation in the data classification algorithms. The Weka workbench is a combination of various machine-learning algorithms and data pre-processing filters, whereby existing complex learning algorithms can be applied to new datasets. As in most related studies, the dataset used in this study (described in
Table 3) was divided into two sets: (1) Training; and (2) Testing with 70:30 split. For validation a 10-fold cross-validation method was used in the classification algorithms. For general comparison of the algorithms, no manual tuning of the parameters was performed so that the model can adjust itself according to the data.
3.5. Model Description
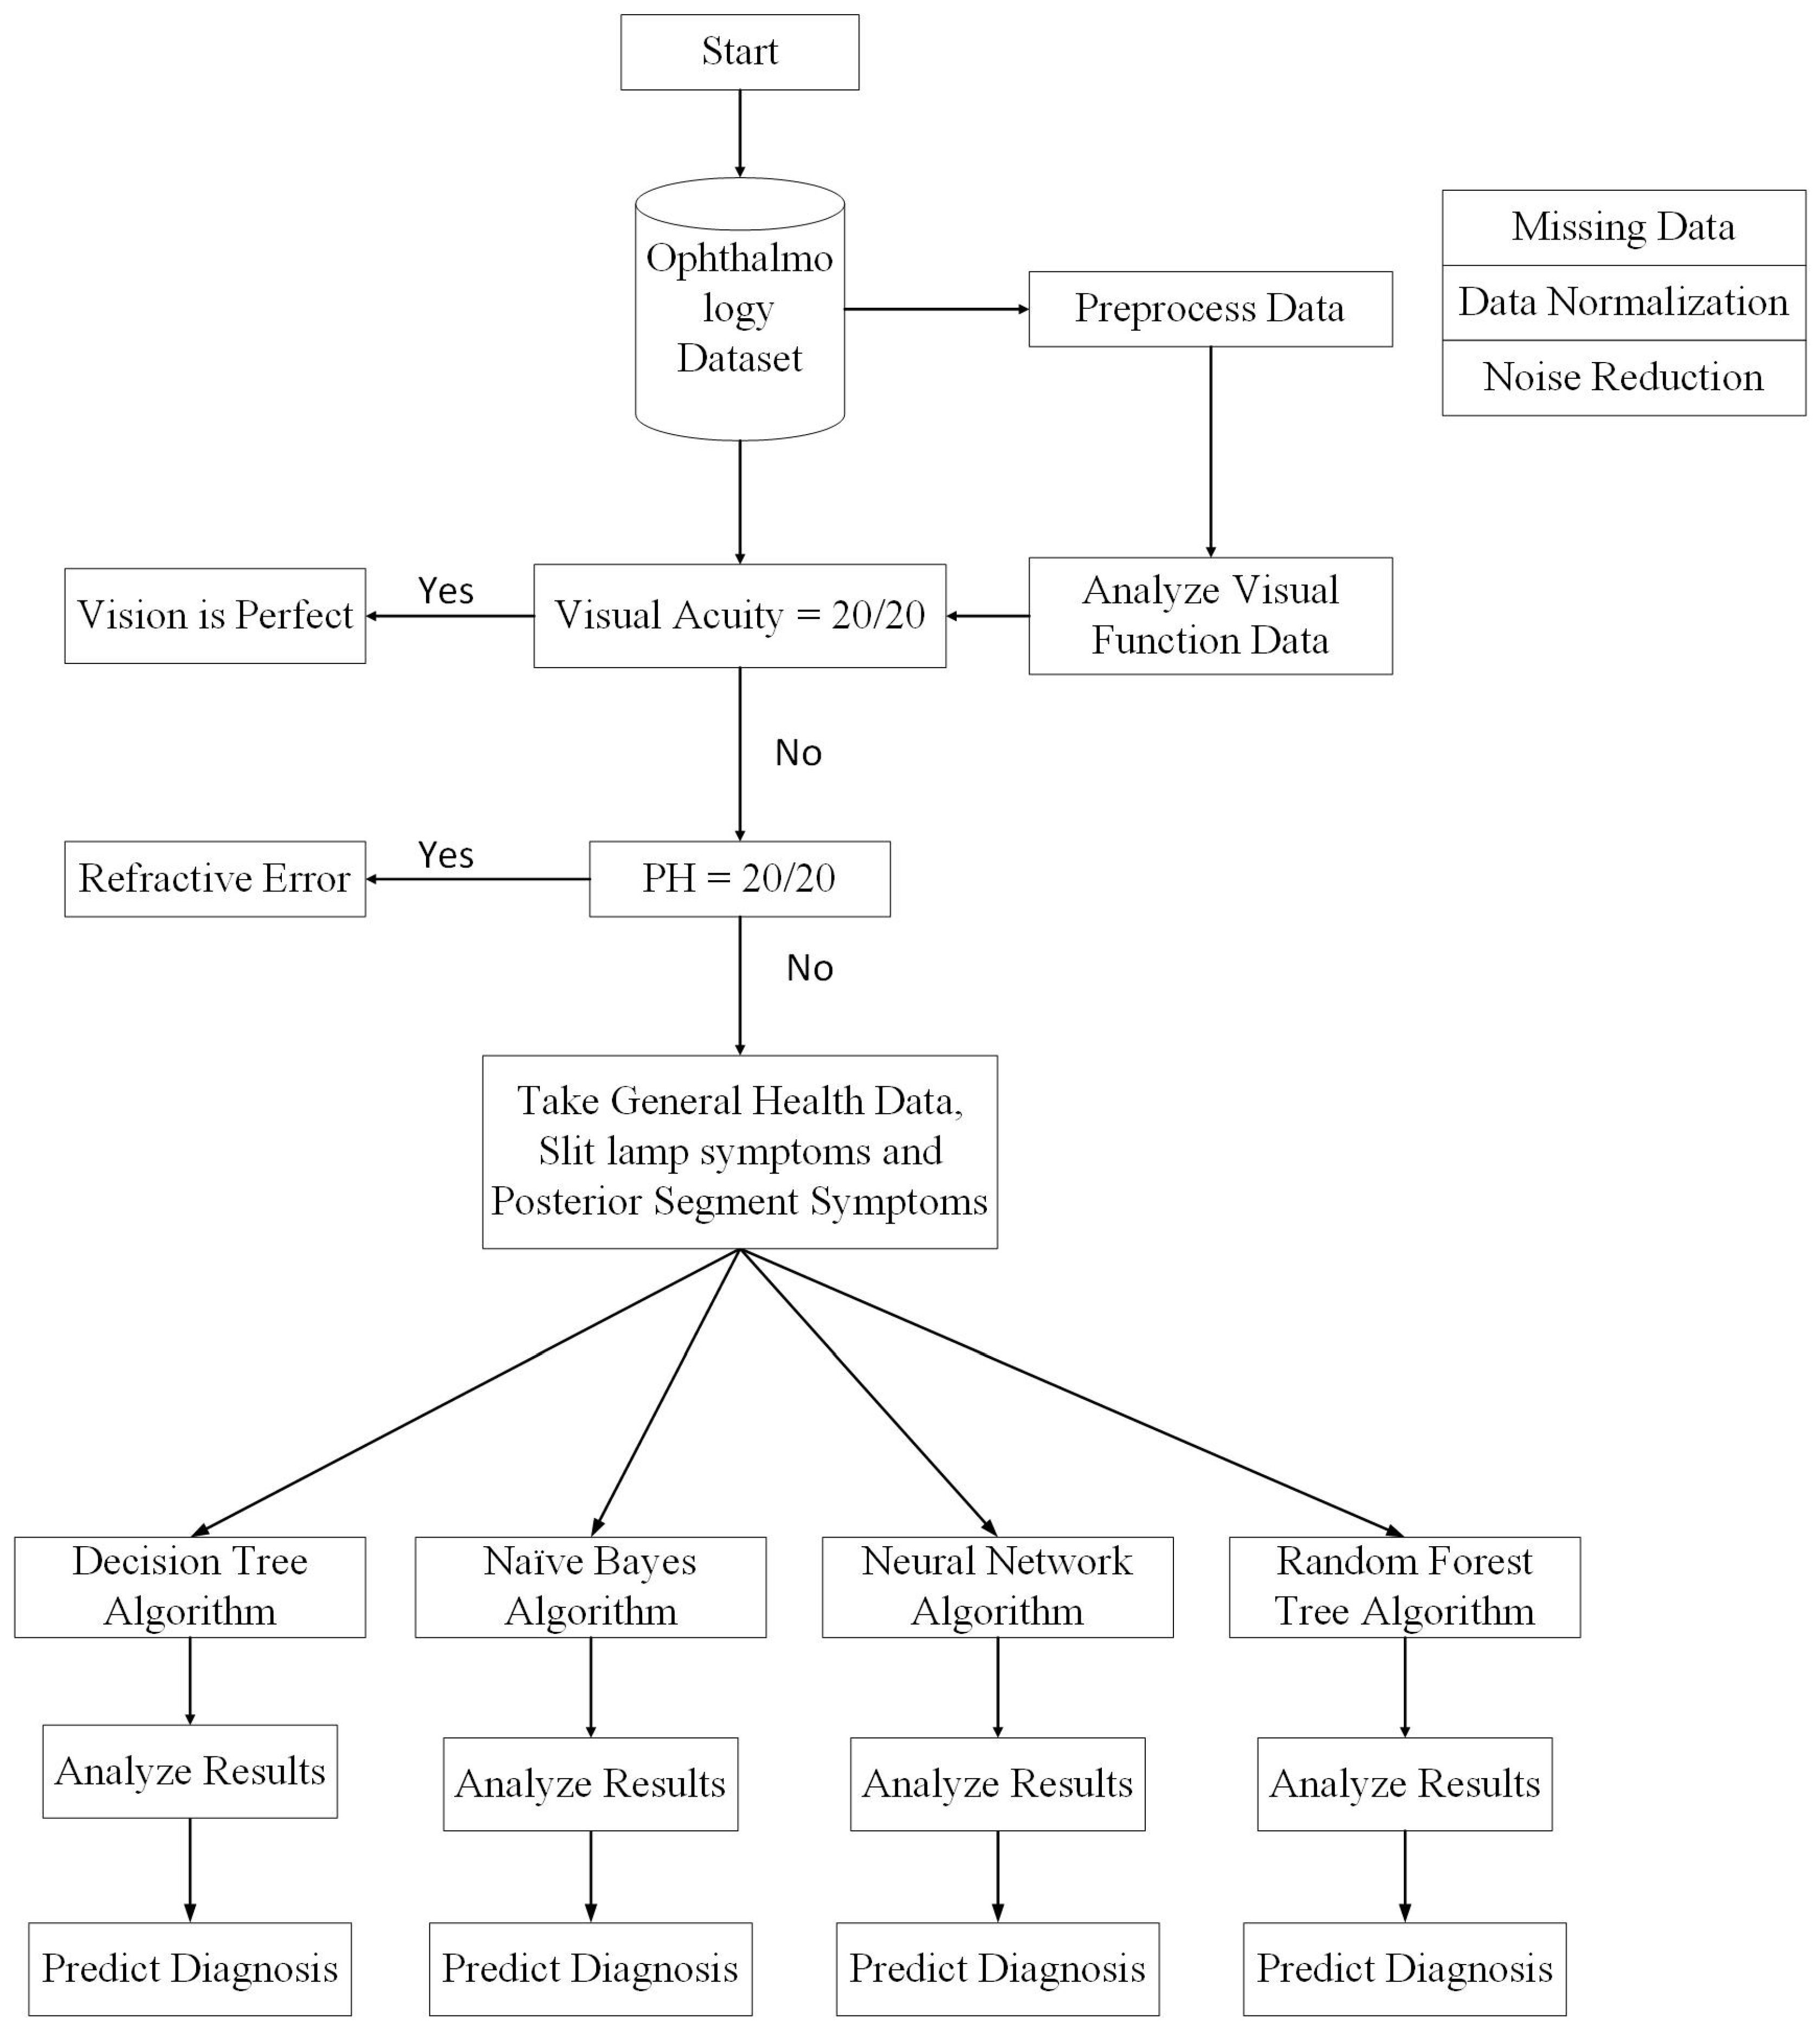
The proposed model is based on real-time patient data from electronic health records. It uses multiple examinations and analyzes patient records from various perspectives, as medical experts do.
Figure 5 shows the entire process in detail. Initially, the visual function test is used to start the diagnostic process. If the visual acuity of a patient is observed to be perfect (i.e., measured to be 20/20 or 6/6), then there is no vision problem; however, the patient may have some allergic eye disorders. Thus, the first decision will be made on the basis of visual acuity. If it is not perfect, then the pinhole value is considered. If pinhole vision improves to 20/20 or 6/6 according to selected scales, then the patient will be prescribed glasses and the diagnosis, according to ICD-10, will be pediatric/strabismus
refractive error. More specifically, the diagnosis will be myopia for nearsightedness and hypermetropia for longsightedness. If pinhole vision is not improved to perfect values, then slit lamp posterior segment examination will be performed to reach a diagnosis. A Java code on the MyEclipse tool was developed that decides on the basis of visual acuity and pinhole values whether the patient requires further investigation or not.
If the problem is not refractive error, then the slit lamp examination and posterior segment examination will facilitate the prediction of the predefined diagnosis class. In this step, missing values are removed from the dataset. If the diagnosis is refractive error, then the anterior and posterior segment examination attributes will remain empty. Therefore, by removing those instances, complete data is passed to the classification module. Thus, after the first step, the data is divided into two parts: one for patients with refractive error and the other for all other diseases.
Another goal is to add general health data (illness history) as a contributing attribute for automatic disease classification. Accordingly, keyword selection was performed based on frequently presented complaints, such as decreased vision and watering eyes. It was observed that patients do not generally know or understand medical terms; therefore, they always use ordinary words to describe their problem, such as itching, watering or frequent blinking. Moreover, experts should be aware of other medical conditions, such as diabetes, hypertension, migraine or uveitis. Therefore, it is more convenient to compile a keyword list of history/health data and store it as the complaint attribute value.
Data from the slit lamp exam is in the form of structured hierarchies written as textual values. The record of a single patient may contain one or multiple symptoms originating in the same or different parts of the eye. To handle this, a multi-label data mechanism is used for arranging multiple symptoms. In addition to symptoms from the slit lamp examination, there is another vital diagnostic test based on symptoms from the posterior eye segment that identifies disorders in macula, retina or the optic nerve. The machine-learning algorithm will then use the behavior learned from previous records available in the database and compare the current combination of slit lamp/external exam symptoms and posterior segment symptoms with those in the database to give an accurate diagnosis on the basis of all input attributes. Diagnosis is also in the form standard taxonomies defined by ICD-10 and maintained by the World Health Organization. Thereby, machine learning algorithms are used for decision making at various stages and they use their learning capabilities for the prognosis of eye diseases. Most of the data considered in this study were either in numeric or nominal/textual form.
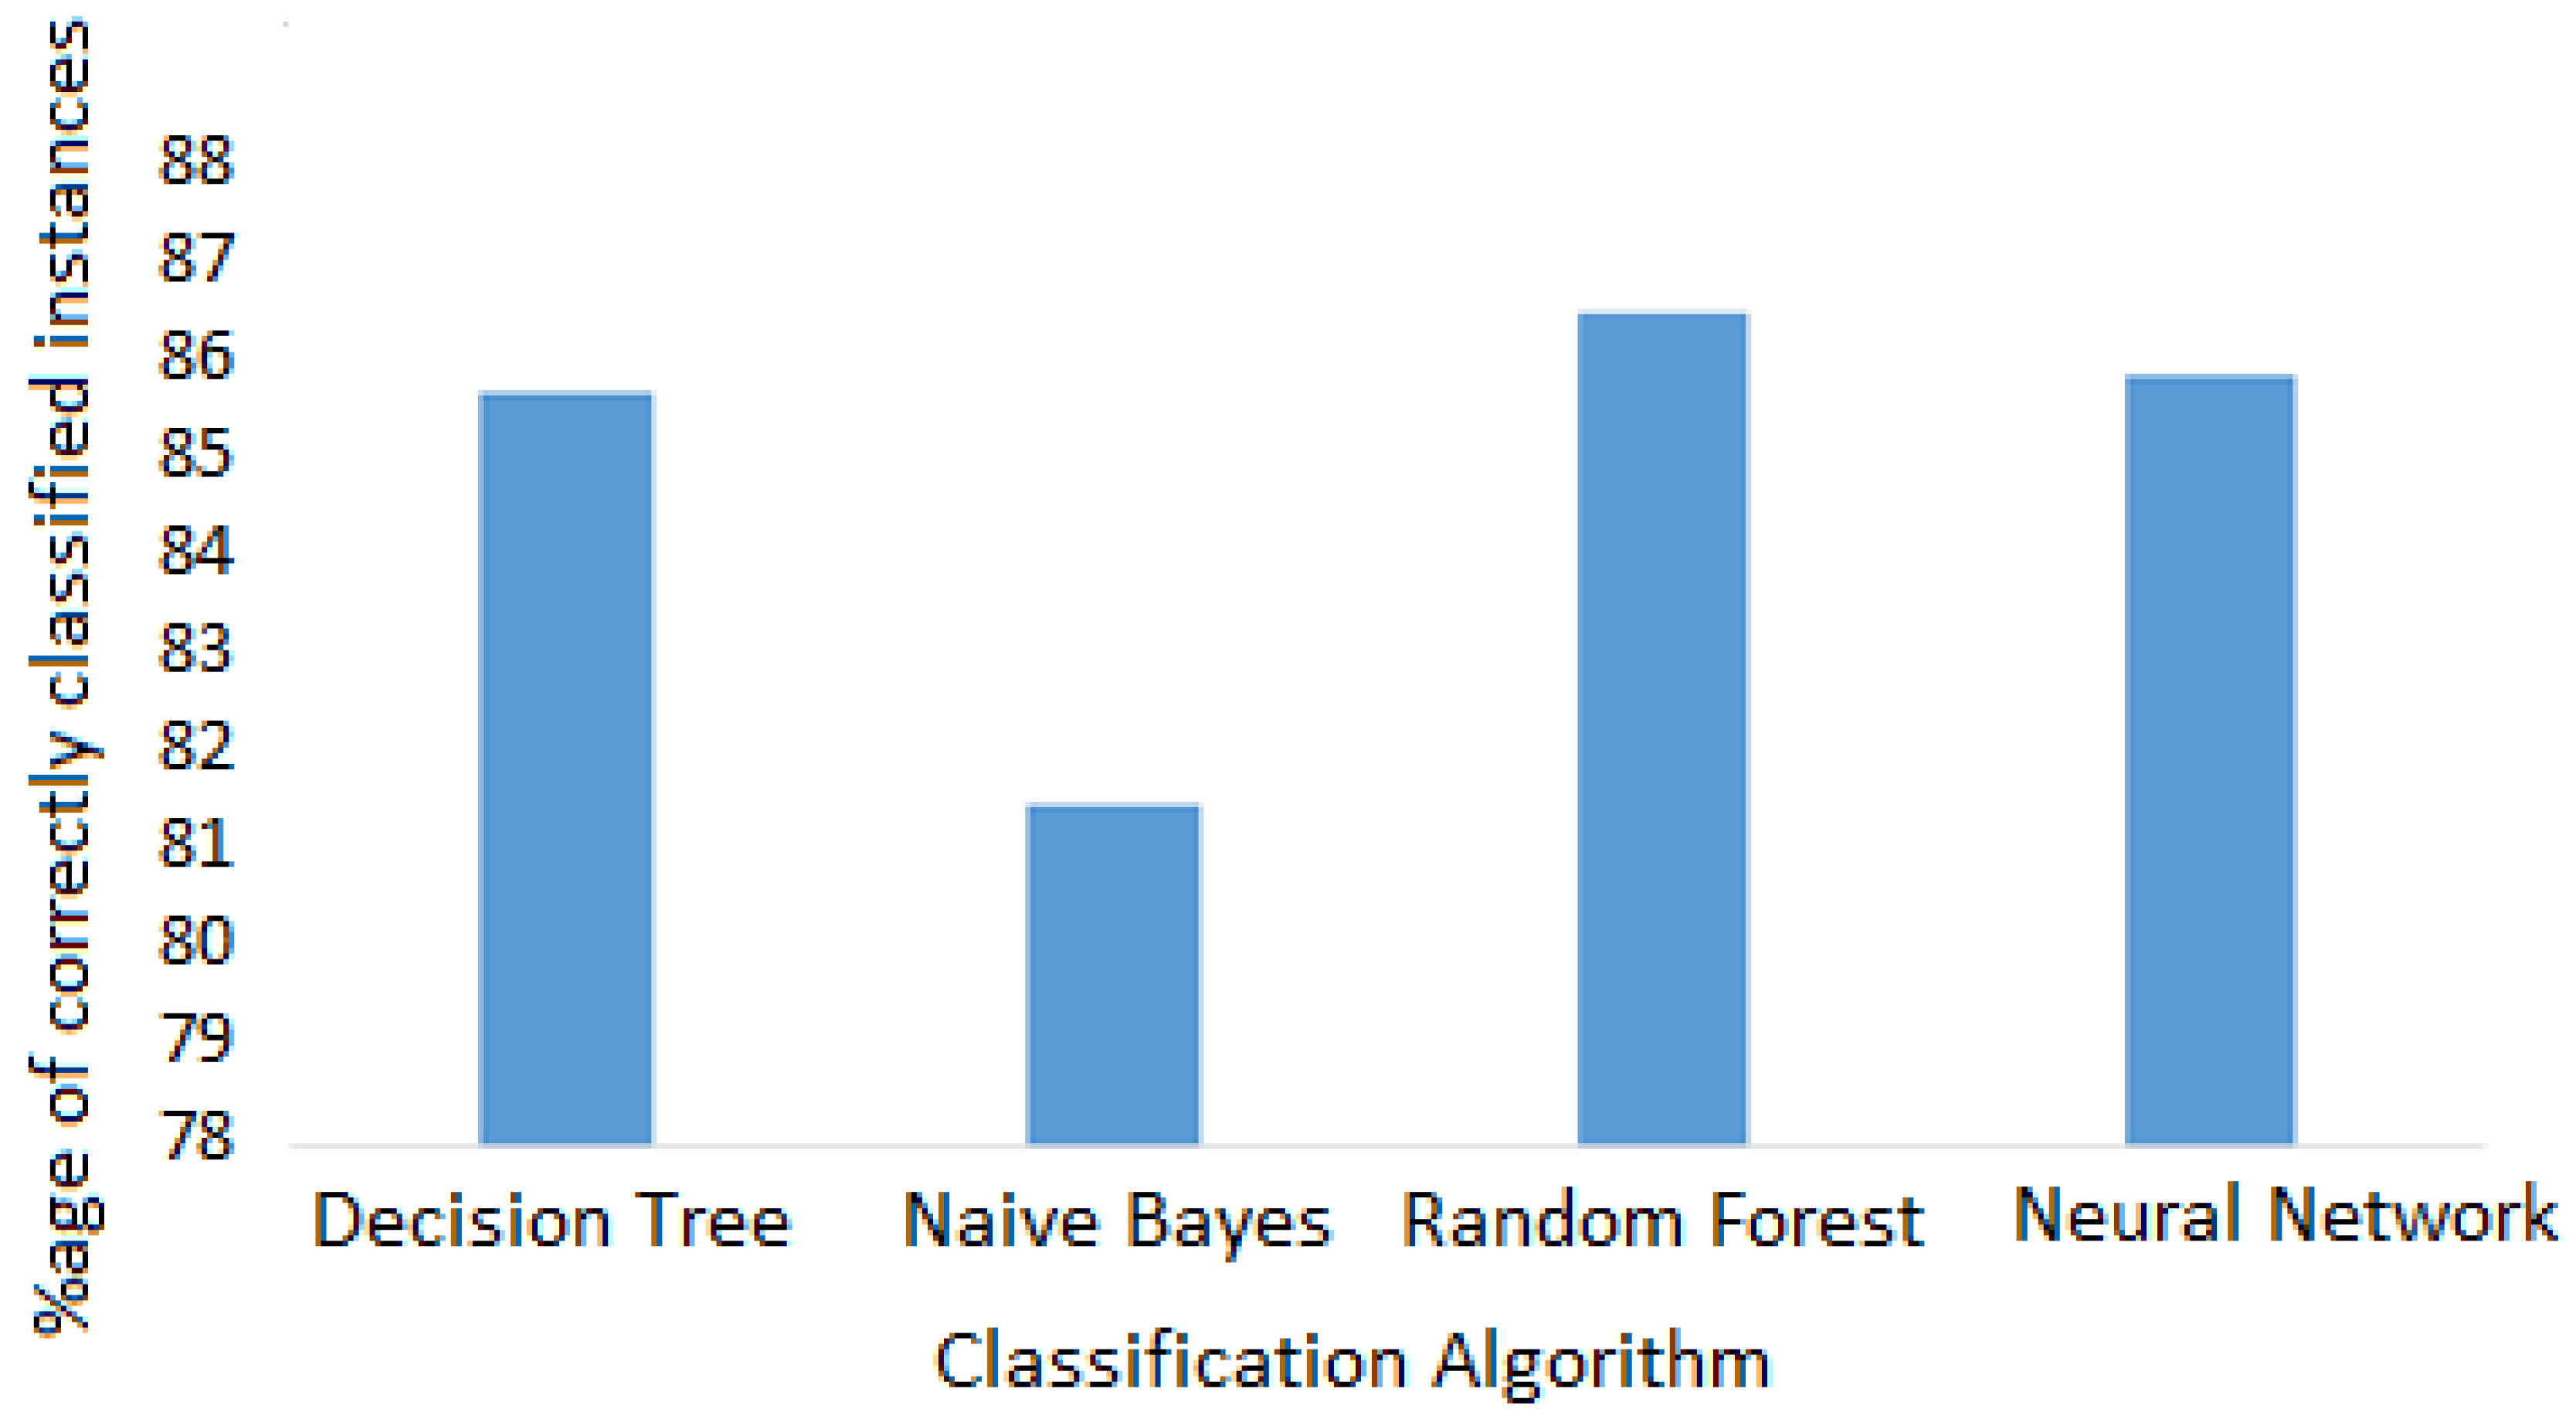
Furthermore, classification algorithms were applied to classify given instances into one of the classes taken from ICD-10. The performance of each classifier was analyzed according to the number of correctly classified instances [
16] and is discussed in the next section.
4. Results
A step-wise decision system generates the classification results presented in
Table 4 and
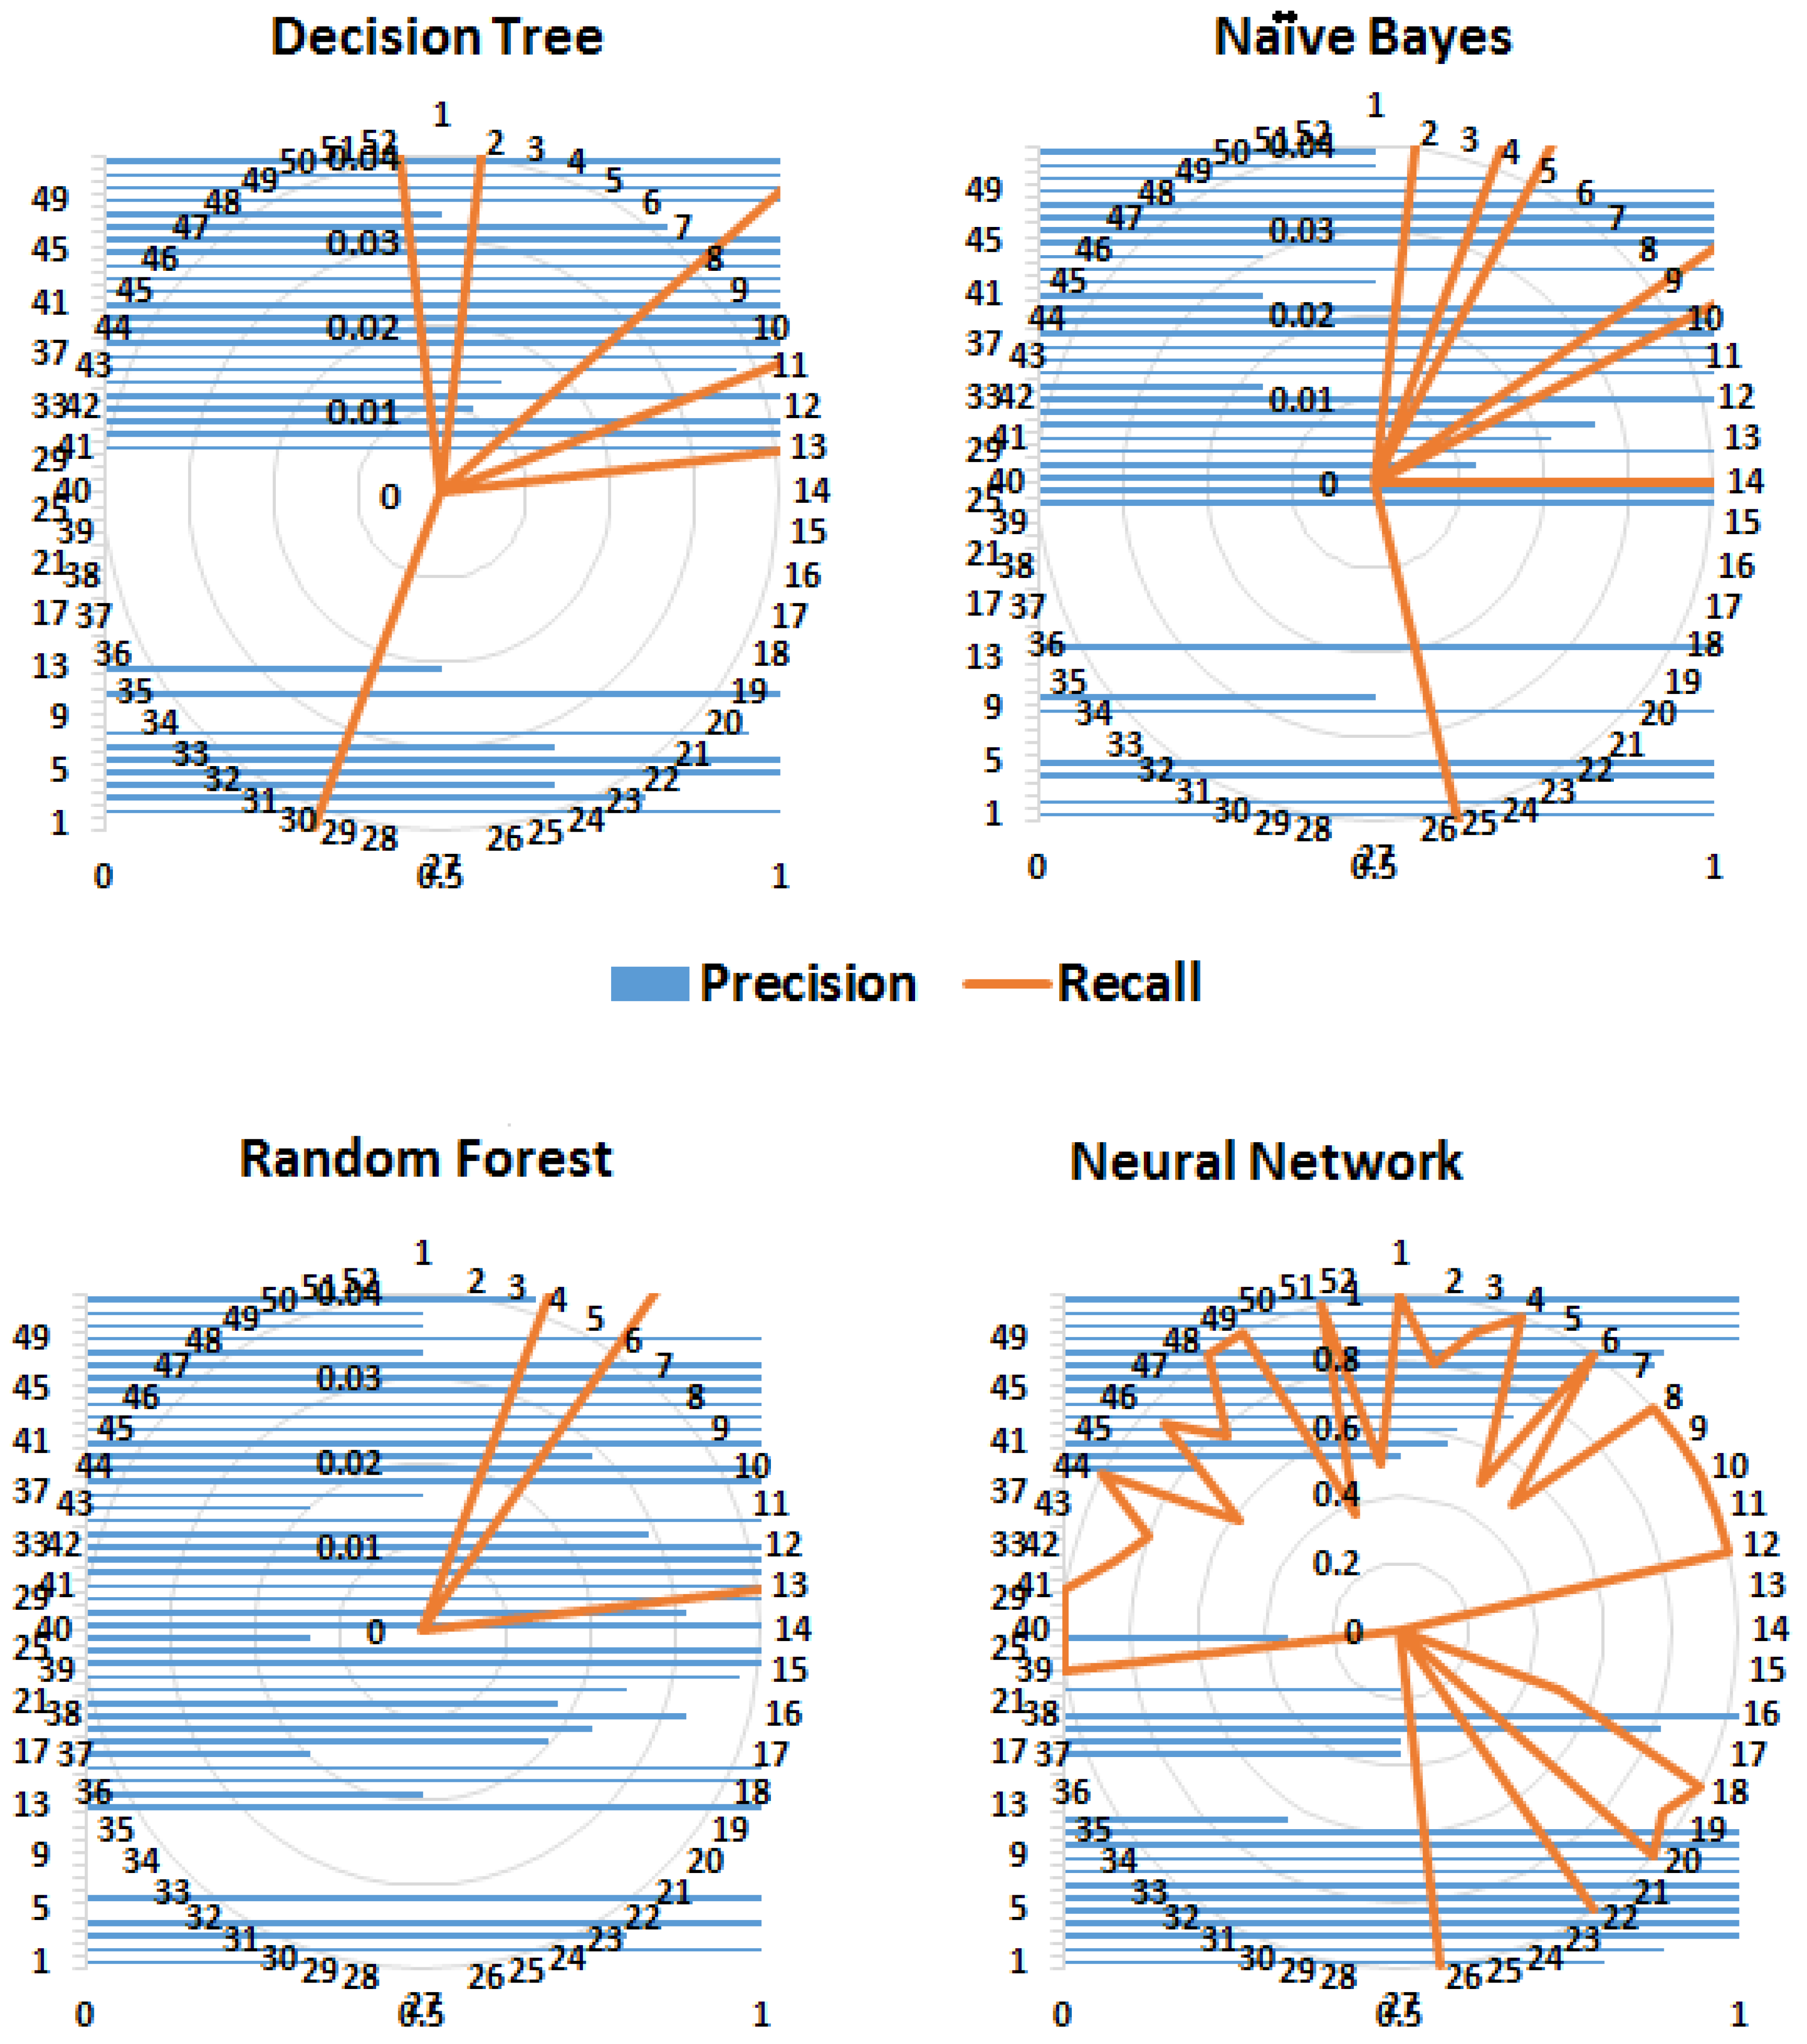
Table 5. The performance of the classification algorithms was evaluated using several statistical measures, namely, kappa statistics, root mean squared error (RMSE), accuracy, precision, recall and the area under the curve (AUC) of receiver operating characteristics (ROC) graphs.
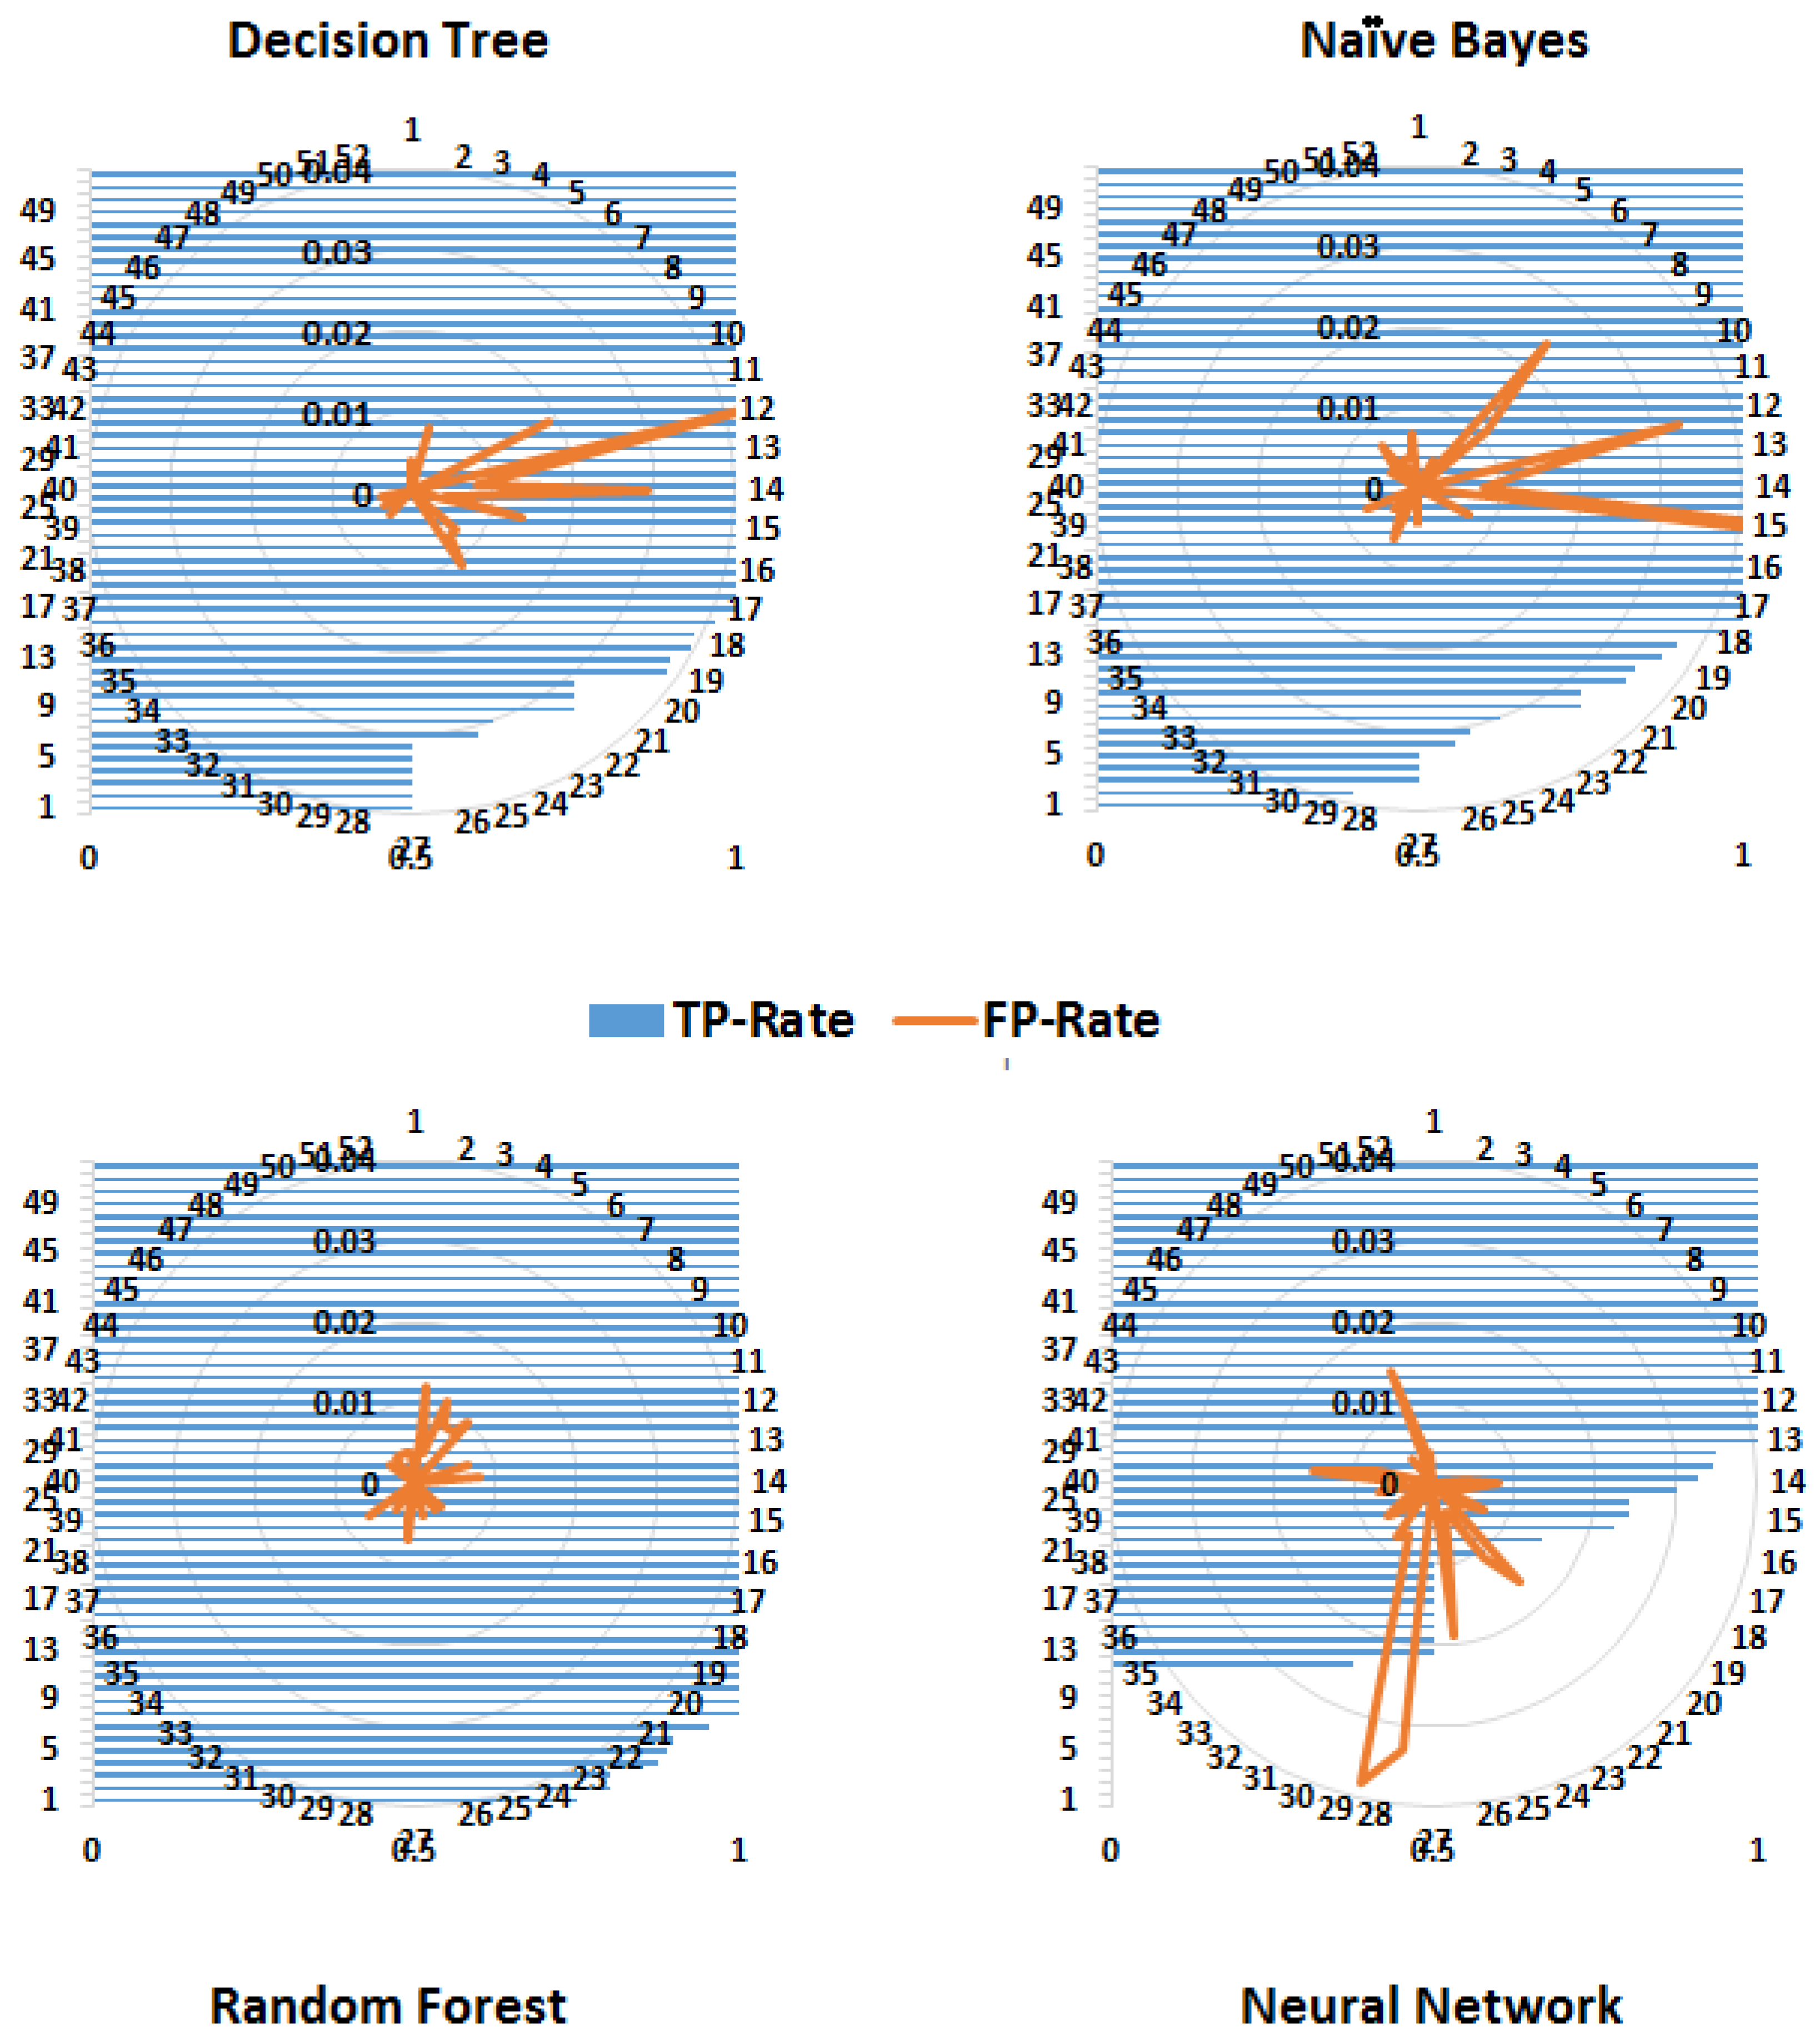
More than one measure is usually considered when classifiers are compared because one measure, for example, accuracy, considers only correct predictions, whereas others, for example, RMSE, consider only false predictions. However, some measures consider both correct and false predictions, for example, precision and recall but by a different proportion. Therefore, most of the commonly used performance measures were considered. As expected, tree-based methods performed better than probability-based methods (Naïve Byes). The kappa statistics demonstrated that both the decision tree and random forest algorithms performed better than the neural network. Similarly, according to the values of precision, recall and the F-measure, the random forest algorithm performed well. Conventionally, precision, recall and ROC are considered graphical measures, where curves are drawn to display the performance of an algorithm. For ROC curves, the true positive rate (TPR) is drawn against the false positive rate (FPR). However, to demonstrate the performance of the entire framework for predicting different classes (diseases), these performance measures for each class are shown in
Figure 6,
Figure 7 and
Figure 8.
Precision is a measure of relevance, whereas recall is the fraction of retrieved relevant instances over the total number of relevant instances (obtained usually in the range 0—1); therefore, high values for both measures indicate better performance. Similarly, FPR is the fraction of wrong true predictions and TPR or sensitivity is the fraction of correct classifications (for a classifier). TPR and FPR also range between 0 and 1 and high TPR and low FPR reflect good performance.
Figure 8 shows that the random forest algorithm yields a high TPR for more classes (diseases) compared to the decision tree and naïve Bayes algorithms. Although the FPR of the naïve Bayes algorithm has the lowest value, its TPR is also low for a number of classes.
4.1. Hierarchical Prediction Accuracy
In
Section 3.1, the data modeling was described, in which the diagnosis was also stored in a hierarchical structure and it was suggested that the classification could be performed at each level. For example, the diagnosis for Keratoconjunctivitis, generated by the system, is as follows:
Cornea Keratitis Neurotrophic keratoconjunctivitis
Here “Cornea” represents a first-level diagnosis, “Cornea Keratitis” represent second-level diagnoses, whereas complete diagnosis will be considered “Cornea Keratitis Neurotrophic keratoconjunctivitis”. To relate data frequency and to verify system reliability by prediction level, accuracies were calculated. This was important because in case of a rare disease, the system should be able to give a reliable diagnosis.
For example, if machine-learning algorithms are unable to give a complete diagnosis (e.g., Cornea Keratitis Neurotrophic keratoconjunctivitis), a second-level diagnosis, namely, Cornea Keratitis, should be given or at least a first-level diagnosis, that is, Cornea. The advantage of this scheme is that if the system is unable to give a complete diagnosis, then it should at least specify a direction or the part of the eye in which the issue may exist, that is, partial but accurate diagnosis.
Performance measures for all classifiers are shown in
Table 7. The random forest algorithm outperformed all others, followed by the decision tree and the neural network algorithms. However, accuracy dropped for second-level and complete diagnosis. This is obviously owing to the relatively low frequency of the data available for complete diagnosis. Overall, this demonstrates that the proposed framework is quite effective with data of sufficient frequency.
4.2. Discussion
The proposed framework was aimed at collecting structured diagnostic data for the prediction of eye diseases by considering all possible symptoms of the anterior and posterior eye segments. Therefore, it was not evaluated for a specific disease; rather, all eye diseases mentioned in ICD-10 were predicted. Most of the current frameworks are designed for a specific eye disease, for example, refractive error, retinal detachment or diabetic retinopathy. By contrast, the purpose of this model is to develop a framework that can handle any type of data and predict all types of eye diseases based on standard symptom taxonomies. However, comparing it with the data mining framework for the prediction of fatty liver disease in Reference [
57], where a number of classifiers were used, tree-based methods yielded the highest accuracy, as shown in
Table 8. Furthermore, as in Reference [
36], the proposed method facilitated the identification of the correlations between attributes related to specific diseases by combining the observations related to different eye segments into one symptom. Recently published work for heart failure identification from unstructured data [
58] exhibits good accuracy, although NLP techniques were used to first convert unstructured data into structured data that was subsequently fed into classification algorithms. The accuracy they achieved using the decision tree and naïve Bayes algorithms is significantly higher than that by the random forest and neural network algorithms but the results are based on only 14 patients’ data. Therefore, reliability is questionable. In the present study, a substantially larger number of classes, hence more data, were considered, as compared to other studies. The comparison of the proposed method with existing solutions (shown in
Table 8) demonstrated that this framework is capable of predicting eye diseases as accurately as analogous specialized frameworks presented for other medical diagnoses.
The results demonstrated that classification by tree algorithms had better prediction accuracy. This is because data was arranged in hierarchical structure and therefore the decision tree and random forest algorithms made better predictions using step-by-step analysis of pruned trees. Moreover, tree algorithms had lower error rate than other algorithms. The neural network algorithm also performed well owing to the multiple hidden layers involved. The results by the naïve Bayes classifier were not as good as those of the others.
5. Conclusions
A general framework for improved classification of eye diseases was presented. It is based on symptoms recorded in the form of standard taxonomies directly by the medical experts. It can incorporate anterior and posterior segment signs along with general health data to correlate a disease with symptoms. Furthermore, a two-step diagnostic process was designed in which patient data related to refractive error was filtered out before analysis by machine-learning algorithms. Different classification algorithms were used, namely, decision tree, random forest, naïve Bayes and artificial neural network algorithms. Tree-based methods performed better than the artificial neural network. Furthermore, efficiency and accuracy were demonstrated to be positively correlated with the amount of available data. According to ICD-10 (used for diagnostic data), the highest accuracy was achieved for first-level diagnosis owing to a sufficiently large amount of data followed by second- and third-level diagnosis. Although the random forest algorithm appeared to be better than the artificial neural network, its execution time was slightly longer than that of the decision tree algorithm. However, as computer technology is advancing, this is expected to be resolved in the near future. Finally, the user interface developed for data recording is unique and has been greatly admired for its ease of use.
In the future, image-based test results will be directly translated into the symptom hierarchy for better disease prediction. Furthermore, nearest neighbor classification methods can also be used by converting codes into numerical data.

 ,
, 


