Quantifying Power System Operational Reliability


Abstract
:1. Introduction
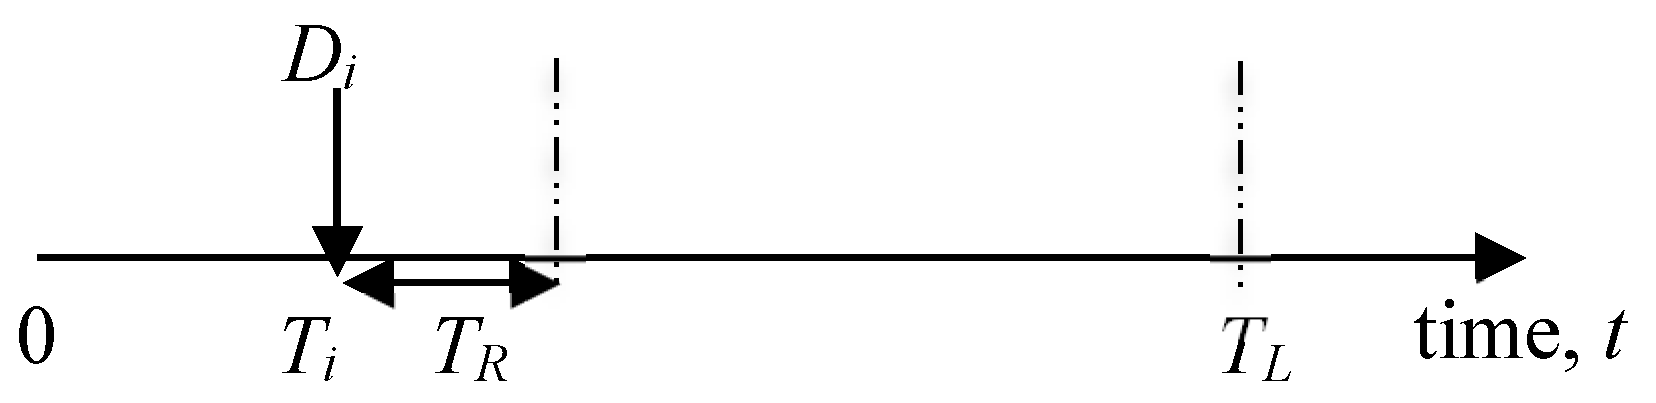
2. Proposed Operating Reliability Assessment Model
3. Illustration of the Proposed Method
4. Simplification of the Proposed Method
5. Development of a Monte Carlo Simulation Method for CGRR Evaluation
6. Model Validation using Monte Carlo Simulation
7. Impact of Ramp Rate and Failure Rate on CGRR
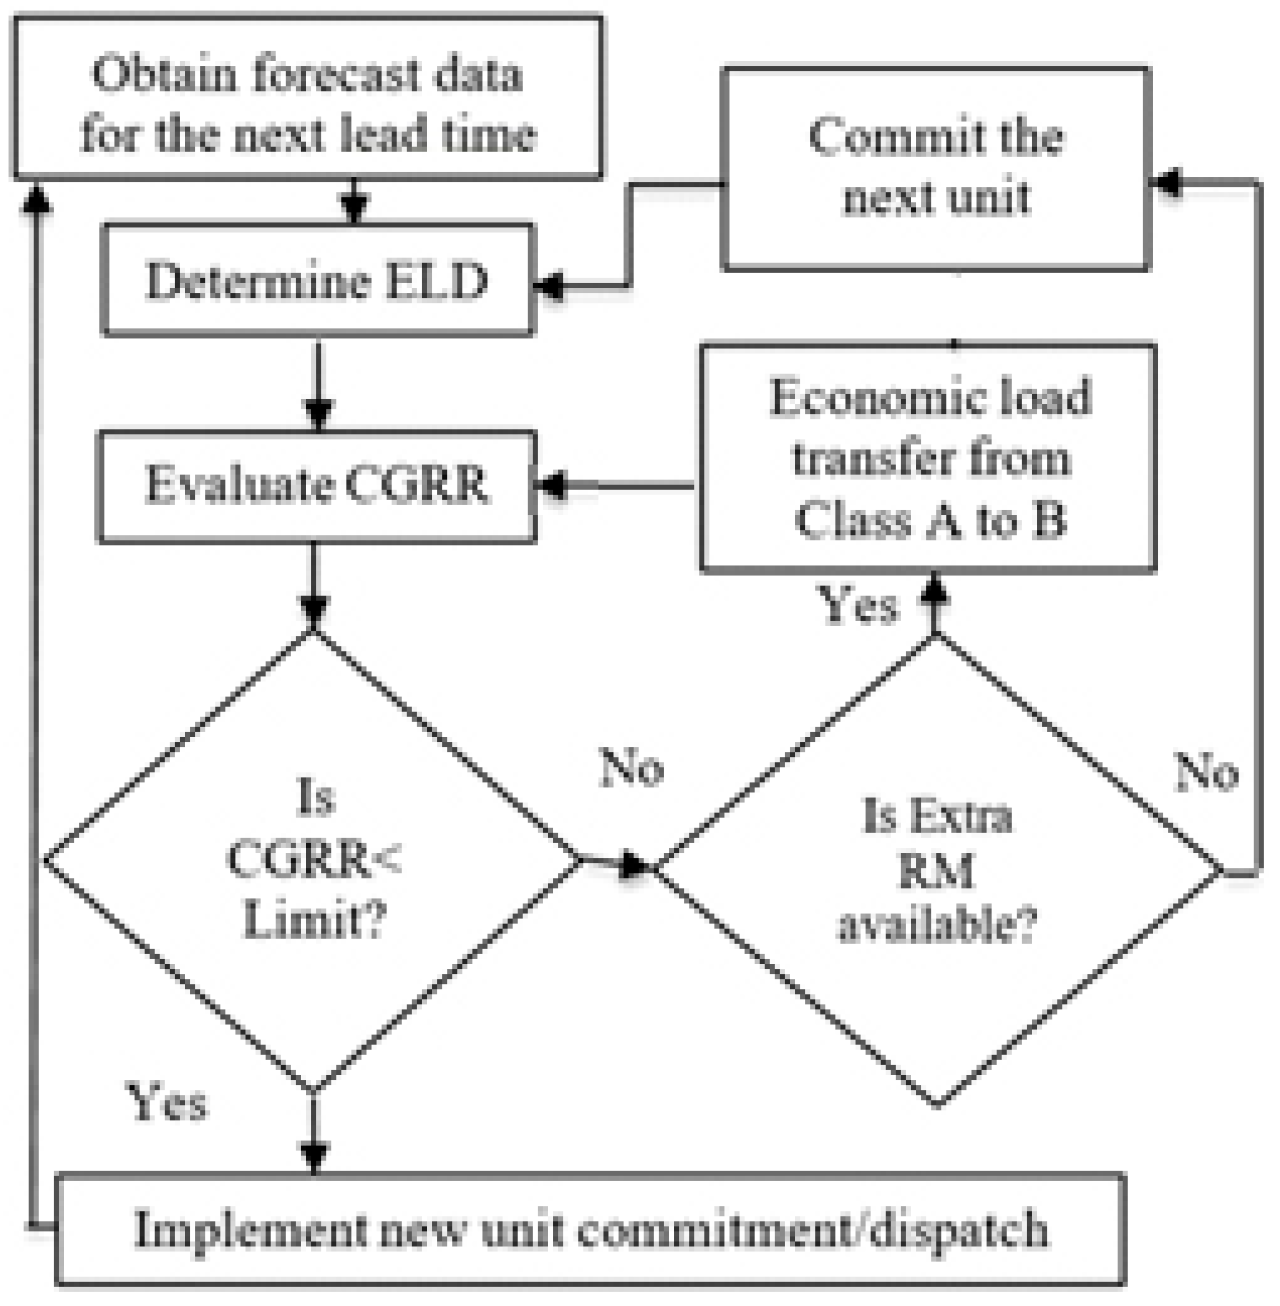
8. Application of CGRR Index in Power System Operating Decisions
8.1. CGRR Criterion for Operating Decisions
8.2. System Operation Using CGRR Criterion
9. Conclusions
Author Contributions
Funding
Conflicts of Interest
References
- Billinton, R.; Allan, R.N. Reliability Evaluation of Power Systems, 2nd ed.; Plenum: New York, NY, USA, 1996. [Google Scholar]
- North American Electric Reliability Corporation (NERC). Balancing and Frequency Control; A Technical Document Prepared by the NERC Resources Subcommittee; NERC: Princeton, NJ, USA, 2011. [Google Scholar]
- Anstine, L.T.; Burke, R.E.; Casey, J.E.; Holgate, R.; John, R.S.; Stewart, H.G. Application of Probability Methods to the Determination of Spinning Reserve Requirements for the Pennsylvania-New Jersey-Maryland Interconnection. IEEE Trans. Power Appar. Syst. 1963, 82, 726–735. [Google Scholar] [CrossRef]
- Billinton, R.; Jain, A.V. The Effect of Rapid Start and Hot Reserve Units in Spinning Reserve Studies. IEEE Trans. Power Appar. Syst. 1972, PAS-91, 511–516. [Google Scholar] [CrossRef]
- Chowdhury, N.A.; Billinton, R. Unit Commitment in Interconnected Generating Systems Using a Probabilistic Technique. IEEE Trans. Power Appar. Syst 1990, 5, 1231–1238. [Google Scholar] [CrossRef]
- Khan, M.E.; Billinton, R. Composite System Spinning Reserve Assessment in Interconnected Systems. IET Proc.-Gener. Transm. Distrib. 1995, 142, 305–309. [Google Scholar] [CrossRef]
- Billinton, R.; Fotuhi-Firuzabad, M. A Basic Framework for Generating System Operating Health Analysis. IEEE Trans. Power Syst. 1994, 9, 1610–1617. [Google Scholar] [CrossRef]
- Billinton, R.; Karki, B.; Karki, R.; Ramakrishna, G. Unit Commitment Risk Analysis of Wind Integrated Power Systems. IEEE Trans. Power Syst. 2009, 24, 930–939. [Google Scholar] [CrossRef]
- Jaefari-Nokandi, M.; Monsef, H. Scheduling of Spinning Reserve Considering Customer Choice on Reliability. IEEE Trans. Power Syst. 2009, 24, 1780–1789. [Google Scholar] [CrossRef]
- Jain, A.V.; Billinton, R. Spinning Reserve Allocation in a Complex Power System. In Proceedings of the IEEE Winter Power Meeting, New York, NY, USA, 28 January–2 February 1973; pp. 1–8. [Google Scholar]
- Yang, M.; Han, X.; Jiang, Z.; Cheng, Y.; Lee, W. A Novel Method for Advanced Dispatch Considering Response Risk Constraints. In Proceedings of the North American Power Symposium (NAPS), Starkville, MS, USA, 4–6 October 2009. [Google Scholar]
- Abiri-Jahromi, A.; Fotuhi-Firuzabad, M. Optimal Scheduling of Spinning Reserve Based on Well-Being Model. IEEE Trans. Power Syst. 2007, 22, 2048–2057. [Google Scholar] [CrossRef]
- Subcommittee, P.M. IEEE Reliability Test System. IEEE Trans. Power Appar. Syst. 1979, PAS-98, 2047–2054. [Google Scholar] [CrossRef]
- Billinton, R.; Jonnavithula, A. Application of Sequential Monte Carlo Simulation to Evaluation of Distributions of Composite System Indices. IET Proc.-Gener. Transm. Distrib. 1997, 144, 87–90. [Google Scholar] [CrossRef]
- Billinton, R.; Li, W. Reliability Assessment of Electrical Power System Using Monte Carlo Methods; Plenum Press: New York, NY, USA, 1994. [Google Scholar]


| Units j | MCR (MW) | Failure Rate λ (f/yr) | Ramp Rate γ (MW/m) | Loading CL (MW) | Spinning Reserve (MW) | RM (MW) |
|---|---|---|---|---|---|---|
| 1 | 20 | 1 | 2 | 7 | 13 | 13 |
| 2 | 36 | 1 | 1 | 20 | 16 | 10 |
| 3 | 11 | 1 | 1 | 4 | 7 | 7 |
| 4 | 33 | 1 | 1 | 33 | 0 | 0 |
| Total | 100 | 64 | 36 | 30 |
| State k | Outage MW Zk | Reduction MW Xk | Probability p(Zk) | RM MW | RR| Zk | p(Zk) × RR| Zk |
|---|---|---|---|---|---|---|
| 1 | 0 | 0 | 0.9993152 | 30 | 0 | 0 |
| 2 | 11 | 4 | 0.0001141 | 23 | 0 | 0 |
| 3 | 20 | 7 | 0.0001141 | 17 | 0 | 0 |
| 4 | 31 | 11 | 1.30 × 10⁻⁸ | 10 | 1 | 1.30 × 10⁻⁸ |
| 5 | 33 | 33 | 0.0002282 | 30 | 1 | 0.0002282 |
| 6 | 36 | 20 | 0.0002282 | 20 | 0 | 0 |
| 7 | 44 | 43 | 2.61 × 10⁻⁸ | 33 | 1 | 2.61 × 10⁻⁸ |
| 8 | 47 | 24 | 2.61 × 10⁻⁸ | 13 | 1 | 2.61 × 10⁻⁸ |
| 9 | 53 | 40 | 2.61 × 10⁻⁸ | 17 | 1 | 2.61 × 10⁻⁸ |
| 10 | 56 | 27 | 2.61 × 10⁻⁸ | 7 | 1 | 2.61 × 10⁻⁸ |
| 11 | 64 | 44 | 2.97 × 10⁻¹² | 10 | 1 | 2.97 × 10⁻¹² |
| 12 | 67 | 31 | 2.97 × 10⁻¹² | 0 | 1 | 2.97 × 10⁻¹² |
| 13 | 69 | 53 | 5.21 × 10⁻⁸ | 20 | 1 | 5.21 × 10⁻⁸ |
| 14 | 80 | 57 | 5.95 × 10⁻¹² | 13 | 1 | 5.95 × 10⁻¹² |
| 15 | 89 | 60 | 5.95 × 10⁻¹² | 7 | 1 | 5.95 × 10⁻¹² |
| 16 | 100 | 64 | 6.79 × 10⁻¹⁶ | 0 | 1 | 6.79 × 10⁻¹⁶ |
| CGRR = 0.00022837 | ||||||
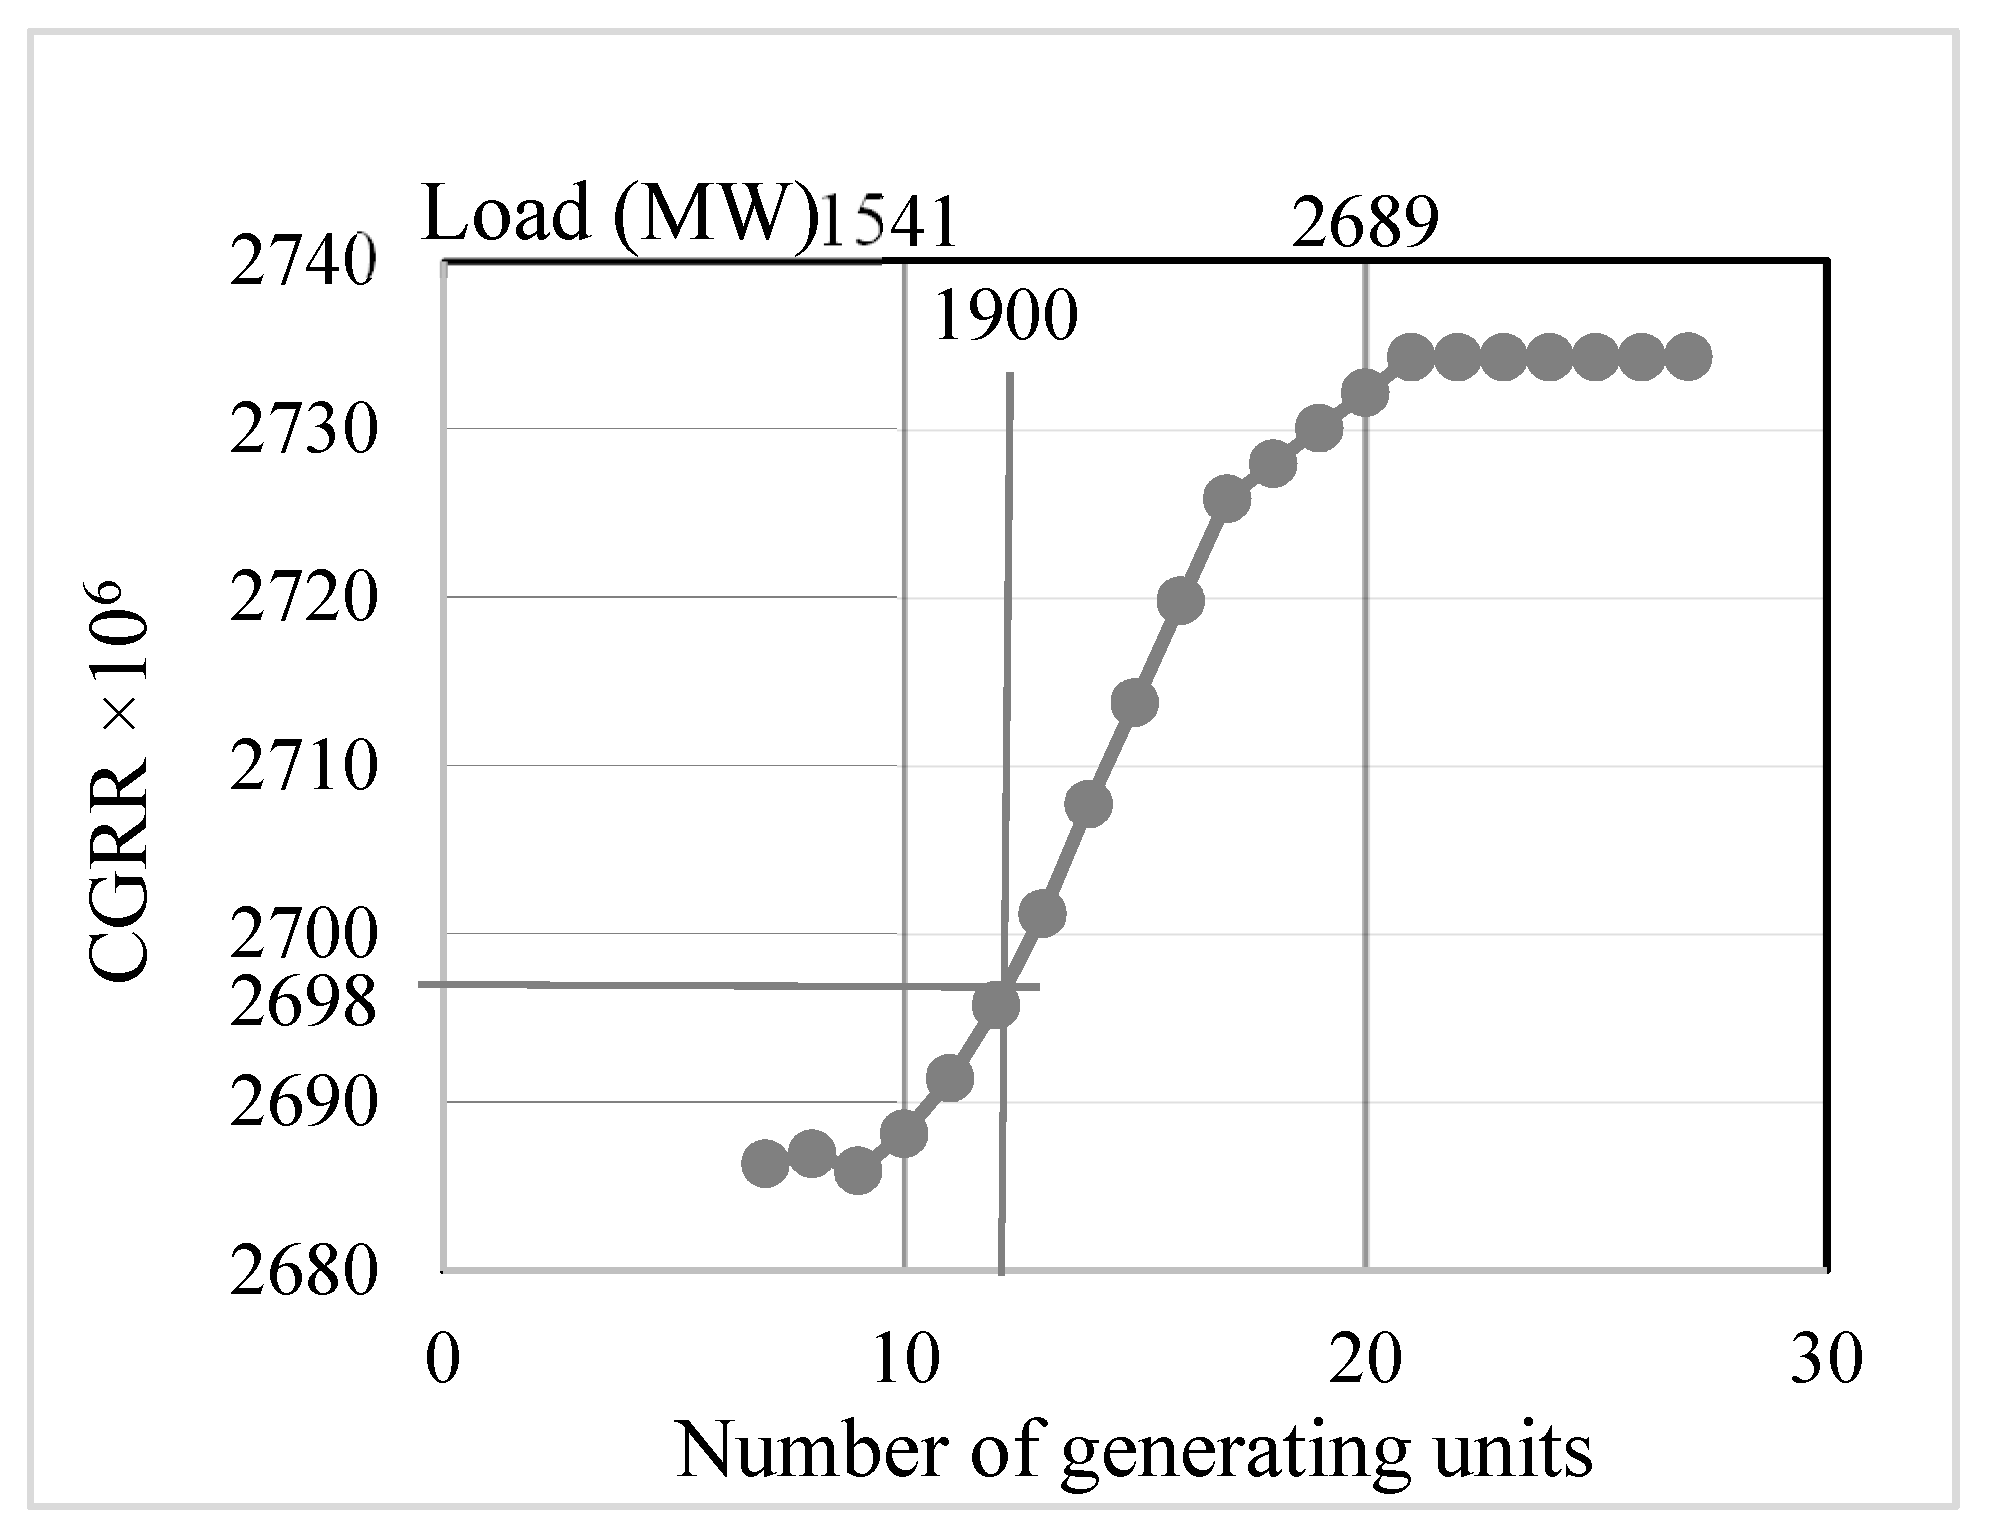
| Load (MW) | No. of Units | CGRR × 106 | Error (%) with Included Order of Contingencies | |||
|---|---|---|---|---|---|---|
| 1st | 2nd | 3rd | 4th | |||
| 900 | 7 | 2686.33119 | 0.3476 | 3.8 × 10⁻⁴ | 3.7 × 10⁻⁷ | 0 |
| 1300 | 9 | 2685.91680 | 0.5419 | 1.3 × 10⁻³ | 1.5 × 10⁻⁶ | 0 |
| 1497 | 10 | 2688.12089 | 0.7280 | 1.9 × 10⁻³ | 3.0 × 10⁻⁶ | 0 |
| 1694 | 11 | 2691.40242 | 0.9524 | 3.1 × 10⁻³ | 5.2 × 10⁻⁶ | 0 |
| 2004 | 13 | 2701.18317 | 1.5167 | 6.2 × 10⁻³ | 1.3 × 10⁻⁵ | 0 |
| 2159 | 14 | 2707.68269 | 1.8555 | 8.3 × 10⁻³ | 1.9 × 10⁻⁵ | 0 |
| 2459 | 17 | 2725.82489 | 2.7522 | 1.5 × 10⁻² | 4.5 × 10⁻⁵ | 0 |
| Priority Order | MCR (MW) | Min. Capacity (MW) | Ramp Rate (MW/min) | Fail. Rate (occ/yr) | Cost Parameters ($/h) | ||
|---|---|---|---|---|---|---|---|
| a | b | c | |||||
| 1–4 | 50 | 0 | 10 | 4.42 | 0.000 | 0.500 | 0.00000 |
| 5–6 | 400 | 200 | 0 | 7.96 | 216.576 | 5.345 | 0.00028 |
| 7 | 350 | 150 | 9 | 7.62 | 388.25 | 8.919 | 0.00392 |
| 8–10 | 197 | 80 | 6 | 9.22 | 301.223 | 20.023 | 0.00300 |
| 11–14 | 155 | 60 | 5 | 9.13 | 206.703 | 9.271 | 0.00667 |
| 15–17 | 100 | 40 | 3 | 7.30 | 286.241 | 17.924 | 0.00220 |
| 18–21 | 76 | 25 | 2 | 4.47 | 100.439 | 12.145 | 0.01131 |
| 22–26 | 12 | 5 | 1 | 2.98 | 30.396 | 23.278 | 0.13733 |
| 27–30 | 20 | 6 | 4 | 19.50 | 40.000 | 37.554 | 0.18256 |
| 31–32 | 50 | 0 | 10 | 4.47 | 0.000 | 0.500 | 0.00000 |
| Unit # | 1 | 2 | 3 | 4 | 5 | 6 | 7 | 8 | 9 | 10 | 11 | 12 | 13 |
|---|---|---|---|---|---|---|---|---|---|---|---|---|---|
| MCR | 50 | 50 | 50 | 50 | 400 | 400 | 350 | 197 | 197 | 197 | 155 | 155 | 155 |
| Loading | 50 | 50 | 50 | 50 | 400 | 400 | 302 | 80 | 80 | 80 | 151 | 151 | 151 |
| Reserve | 0 | 0 | 0 | 0 | 0 | 0 | 48 | 117 | 117 | 117 | 4 | 4 | 4 |
| RM | 0 | 0 | 0 | 0 | 0 | 0 | 48 | 60 | 60 | 60 | 4 | 4 | 4 |
| Evaluation Method | CGRR |
|---|---|
| Analytical | 0.00270118 |
| MCS | 0.00270114 |
| Units | MCR (MW) | Ramping Capability (MW) | ELD | Re-Dispatch | ||
|---|---|---|---|---|---|---|
| Loading (MW) | RM (MW) | Loading (MW) | RM (MW) | |||
| 1-A | 50 | 50 | 50 | 0 | 50 | 0 |
| 2-A | 50 | 50 | 50 | 0 | 50 | 0 |
| 3-A | 50 | 50 | 50 | 0 | 50 | 0 |
| 4-A | 50 | 50 | 50 | 0 | 50 | 0 |
| 5 | 400 | 0 | 400 | 0 | 400 | 0 |
| 6 | 400 | 0 | 400 | 0 | 400 | 0 |
| 7-A | 350 | 90 | 302 | 48 | 276 | 74 |
| 8-B | 197 | 60 | 80 | 60 | 104 | 60 |
| 9-B | 197 | 60 | 80 | 60 | 104 | 60 |
| 10-B | 197 | 60 | 80 | 60 | 104 | 60 |
| 11-A | 155 | 50 | 151 | 4 | 135 | 19 |
| 12-A | 155 | 50 | 151 | 4 | 136 | 19 |
| 13-A | 155 | 50 | 151 | 4 | 136 | 19 |
| Total | 2406 | 620 | 1995 | 240 | 1995 | 311 |
| Unit | MCR | Ramping Capability | 13 Units ELD | 13 Units Re-Dispatch | 14 Units ELD | 14 Units Re-Dispatch | ||||
|---|---|---|---|---|---|---|---|---|---|---|
| Loading | RM | Loading | RM | Loading | RM | Loading | RM | |||
| 1 | 50 | 50 | 50 | 0 | 50 | 0 | 50 | 0 | 50 | 0 |
| 2 | 50 | 50 | 50 | 0 | 50 | 0 | 50 | 0 | 50 | 0 |
| 3 | 50 | 50 | 50 | 0 | 50 | 0 | 50 | 0 | 50 | 0 |
| 4 | 50 | 50 | 50 | 0 | 50 | 0 | 50 | 0 | 50 | 0 |
| 5 | 400 | 0 | 400 | 0 | 400 | 0 | 400 | 0 | 400 | 0 |
| 6 | 400 | 0 | 400 | 0 | 400 | 0 | 400 | 0 | 400 | 0 |
| 7 | 350 | 90 | 306 | 44 | 261 | 89 | 260 | 90 | 260 | 90 |
| 8 | 197 | 60 | 80 | 60 | 136 | 60 | 80 | 60 | 86 | 60 |
| 9 | 197 | 60 | 80 | 60 | 136 | 60 | 80 | 60 | 86 | 60 |
| 10 | 197 | 60 | 80 | 60 | 136 | 60 | 80 | 60 | 86 | 60 |
| 11 | 155 | 50 | 153 | 2 | 112 | 43 | 126 | 29 | 121 | 34 |
| 12 | 155 | 50 | 153 | 2 | 112 | 43 | 126 | 29 | 121 | 33 |
| 13 | 155 | 50 | 153 | 2 | 112 | 43 | 126 | 29 | 122 | 33 |
| 14 | 155 | 50 | 126 | 29 | 122 | 33 | ||||
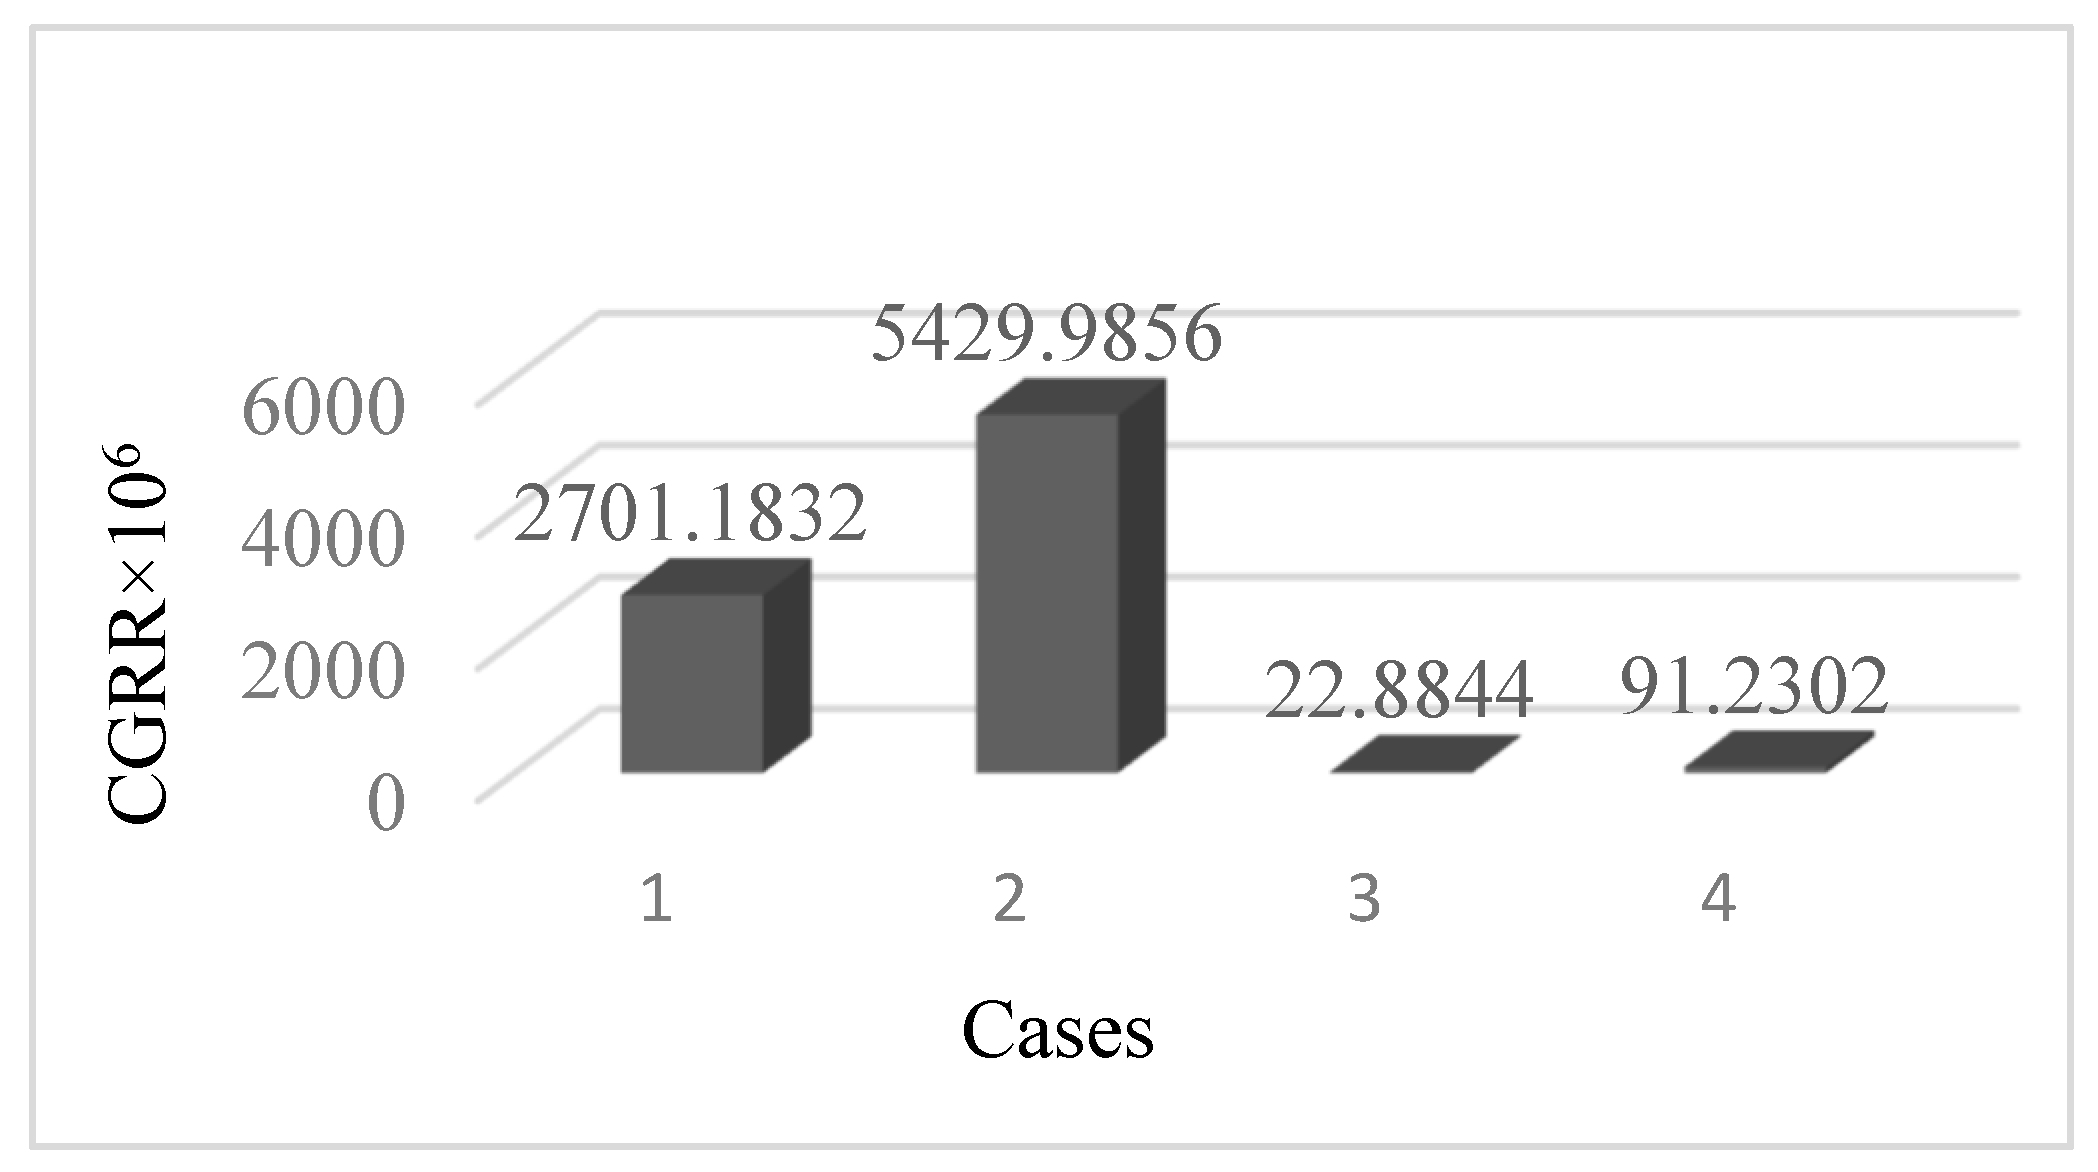
| Committed Units and Dispatch | Total RM (MW) | CGRR × 106 | Cost ($/h) |
|---|---|---|---|
| 13 units, ELD | 230 | 4062.161706 | 19,505.11 |
| 13 units, re-dispatch | 396 | 2740.451292 | 21,118.19 |
| 14 units, ELD | 355 | 2742.428945 | 19,582.40 |
| 14 units re-dispatch | 401 | 57.65131996 | 19,755.09 |
| 15 units ELD | 442 | 60.95279158 | 20,150.68 |
© 2019 by the authors. Licensee MDPI, Basel, Switzerland. This article is an open access article distributed under the terms and conditions of the Creative Commons Attribution (CC BY) license (http://creativecommons.org/licenses/by/4.0/).
Share and Cite
Nepal, N.; Karki, R. Quantifying Power System Operational Reliability. Appl. Sci. 2019, 9, 2777. https://doi.org/10.3390/app9142777
Nepal N, Karki R. Quantifying Power System Operational Reliability. Applied Sciences. 2019; 9(14):2777. https://doi.org/10.3390/app9142777
Chicago/Turabian StyleNepal, Nahakul, and Rajesh Karki. 2019. "Quantifying Power System Operational Reliability" Applied Sciences 9, no. 14: 2777. https://doi.org/10.3390/app9142777
APA StyleNepal, N., & Karki, R. (2019). Quantifying Power System Operational Reliability. Applied Sciences, 9(14), 2777. https://doi.org/10.3390/app9142777